Multi Timeframe Control (Enomai)This indicator is called "Multi Timeframe Control" and has the following features:
1. Table settings:
- selection of different timeframes (1m, 5m, 15m, 30m, 1h, 2h, 4h, 8h, 12h, D, W, M) for displaying closing prices;
- choice of table orientation (horizontal or vertical);
- selection of the position for the table on the chart (top right, middle right, bottom right, top center, middle center, bottom center, top left, middle left, bottom left);
- table size selection (automatic, large, medium, normal, small, tiny);
- text color customization (positive closing value color and negative closing value color);
- display or hide closing prices in the table.
2. Line settings:
- selection of different timeframes for displaying lines (similar to table settings);
- for each time frame (1m, 5m, 15m, etc.) you can choose whether to place a line on the chart;
- individual color selection for each line.
- choice of line display type on the chart (circle, cross, step line, diamond);
- show or hide lines on the chart.
3. Other settings:
- offset the length of price lines to the left by a certain number of bars (default is 0, maximum is 300 bars);
- offset of bars for displaying the closing price from previous periods (default is 1, maximum is 500 bars).
The indicator allows you to display closing prices for different timeframes simultaneously both in the table and on the chart with the corresponding colors for each timeframe. You can also set up which previous bar and, accordingly, its closing price to display in the table and on the chart. For example, if you set 3 in the bar offset setting for displaying the closing price of previous periods, then for the D timeframe will be displayed the closing price of the bar 3 days ago.
-----
Данный индикатор называется "Multi Timeframe Control" и имеет следующие возможности:
1. Настройка таблицы:
- выбор различных временных рамок (1m, 5m, 15m, 30m, 1h, 2h, 4h, 8h, 12h, D, W, M) для отображения цен закрытия;
- выбор ориентации таблицы (горизонтальная или вертикальная);
- выбор положения таблицы на графике (верхний правый, средний правый, нижний правый, верхний центр, средний центр, нижний центр, верхний левый, средний левый, нижний левый);
- выбор размера таблицы (автоматический, большой, средний, нормальный, малый, мелкий);
- настройка цвета текста, цвета положительных значений закрытия цены и цвета отрицательных значений закрытия цены;
- отображение или сокрытие цен закрытия в таблице.
2. Настройка линий:
- выбор различных временных рамок для отображения линий (аналогичны настройкам таблицы);
- для каждой временной рамки (1m, 5m, 15m и т.д.) вы можете выбрать, нужно ли размещать линию на графике;
- вы можете выбрать цвет для каждой линии в отдельности.
- выбор типа отображения линий на графике (круг, крестик, ступенчатая линия, ромб);
- отображение или сокрытие линий на графике.
3. Другие настройки:
- смещение длины линий цены влево на определенное количество баров (по умолчанию 0, максимум 300 баров);
- смещение баров для отображения цены закрытия предыдущих периодов (по умолчанию 1, максимум 500 баров).
Индикатор позволяет отображать цены закрытия для разных таймфреймов одновременно как в таблице, так и на графике с соответствующими цветами для каждого таймфрейма. Также Вы можете настроить какой именно предыдущий бар и, соответственно, его цену закрытия отображать в таблице и на графике. Например, если в настройке смещения баров для отображения цены закрытия предыдущих периодов установить 3, то для таймфрейма D будет отображаться цена закрытия бара 3 дня назад.
Timeframe

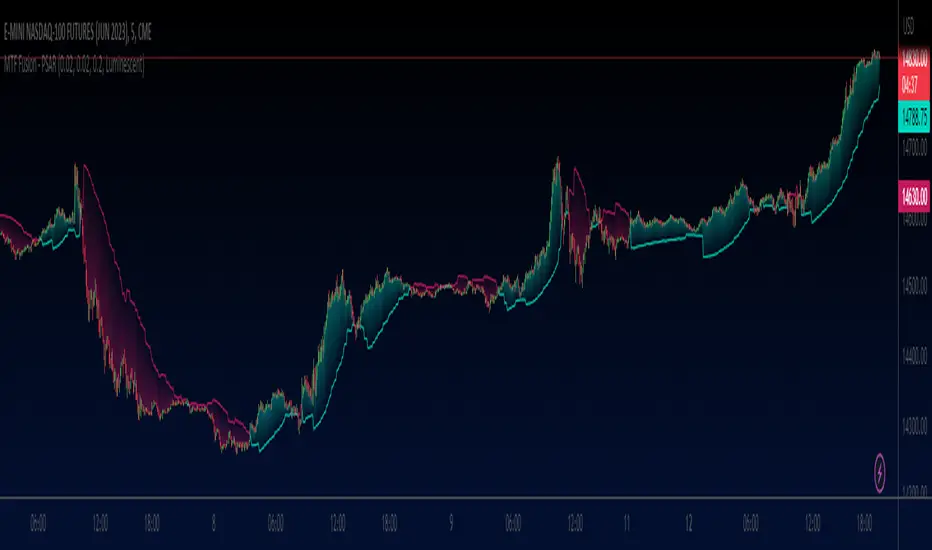
MTF Fusion - PSAR [TradingIndicators]MTF Fusion PSAR intelligently adapts to whatever timeframe you're trading - dynamically calculating Parabolic SAR (Stop and Reverse) levels combined from four appropriate higher timeframes to give you a much broader view of the market and an edge in your trading decisions. It is the third indicator in our MTF Fusion series, and leverages our MTF Fusion algorithm - only this time to visualize J. Welles Wilder Jr.'s famous Parabolic SAR indicator.
What is MTF Fusion?
Multi-Timeframe (MTF) Fusion is the process of combining calculations from multiple timeframes higher than the chart's into one 'fused' value or indicator. It is based on the idea that integrating data from higher timeframes can help us to better identify short-term trading opportunities within the context of long-term market trends.
How does it work?
Let's use the context of this indicator, which calculates PSAR levels, as an example to explain how MTF Fusion works and how you can perform it yourself.
Step 1: Selecting Higher Timeframes
The first step is to determine the appropriate higher timeframes to use for the fusion calculation. These timeframes should typically be chosen based on their ability to provide meaningful price levels and action which actively affect the price action of the smaller timeframe you're focused on. For example, if you are trading the 5 minute chart, you might select the 15 minute, 30 minute, and hourly timeframe as the higher timeframes you want to fuse in order to give you a more holistic view of the trends and action affecting you on the 5 minute. In this indicator, four higher timeframes are automatically selected depending on the timeframe of the chart it is applied to.
Step 2: Gathering Data and Calculations
Once the higher timeframes are identified, the next step is to calculate the data from these higher timeframes that will be used to calculate your fused values. In this indicator, for example, the values of PSAR levels are calculated by determining the value of the PSAR indicator for all four higher timeframes.
Step 3: Fusing the Values From Higher Timeframes
The next step is to actually combine the values from these higher timeframes to obtain your 'fused' indicator values. The simplest approach to this is to simply average them. If you have calculated the value of a PSAR level from three higher timeframes, you can, for example, calculate your 'multi-timeframe fused level' as (HigherTF_PSAR_Level_1 + HigherTF_PSAR_Level_2 + HigherTF_PSAR_Level_3) / 3.0.
Step 4: Visualization and Interpretation
Once the calculations are complete, the resulting fused indicator values are plotted on the chart. These values reflect the fusion of data from the multiple higher timeframes, giving a broader perspective on the market's behavior and potentially valuable insights without the need to manually consider values from each higher timeframe yourself.
What makes this script unique? Why is it closed source?
While the process described above is fairly unique and sounds simple, the truly important key lies in determining which higher timeframes to fuse together, and how to weight their values when calculating the fused end result in such a way that best leverages their relationship for useful TA.
This MTF Fusion indicator employs a smart, adaptive algorithm which automatically selects appropriate higher timeframes to use in fusion calculations depending on the timeframe of the chart it is applied to. It also uses a dynamic algorithm to adjust and weight the PSAR calculations depending on each higher timeframe's relationship to the chart timeframe. These algorithms are based on extensive testing and are the reason behind this script's closed source status.
What is the PSAR indicator?
The Parabolic SAR (Stop and Reverse) indicator is a technical analysis tool that helps identify potential trend reversals in price movements. It was developed by J. Welles Wilder Jr. and is widely used by traders to determine entry and exit points in the market. It consists of levels that are plotted above or below current price. The position of these plots relative to the price provides valuable information about the prevailing trend and potential reversal points.
Here's how the original PSAR indicator works:
Upward Trend: When the Parabolic SAR level is plotted below the price, it indicates an upward trend in the market. The level generally moves closer to the price as the trend progresses. This creates a parabolic curve that rises with time. Traders typically interpret this as a bullish signal, suggesting that it may be a good time to buy or hold positions.
Downward Trend: Conversely, when the Parabolic SAR level is plotted above the price, it indicates a downward trend in the market. The plot generally moves closer to the price as the trend continues, forming a parabolic curve that declines with time. This is considered a bearish signal, suggesting that it may be a suitable time to sell or avoid taking long positions.
Reversal Points: The primary purpose of the Parabolic SAR indicator is to identify potential trend reversals. When the price crosses above or below the Parabolic SAR level, it indicates a possible reversal in the trend.
The Parabolic SAR indicator is versatile and can be used in various market conditions and timeframes. It is particularly useful in trending markets, where it helps traders ride the trend and capture potential profits. However, it's important to note that the Parabolic SAR may generate false signals or provide delayed indications in sideways or choppy markets.
Included Features
Fusion PSAR levels
Filled zones to highlight trends
Full customization of PSAR parameters
Pre-built color stylings
Options
Fusion View: Show/hide the Fusion PSAR levels calculated from multiple higher timeframes
Fill Trending Zones: Show/hide the fill for 'trending zones' between price and the Fusion PSAR levels
Start: Defines the rate at which the PSAR levels move closer to the price during the initial stages of a trend (higher = faster convergence, lower = slower convergence)
Increment: Controls the rate at which the acceleration factor increases or decreases as the trend continues (higher = faster convergence, lower = slower convergence)
Max: Sets a limit on the maximum value that the acceleration factor can reach
Pre-Built Color Styles: Use a pre-built color styling (uncheck to use your own colors)
Manual Color Styles: When pre-built color styles are disabled, use these color inputs to define your own
MTF Smoothable RSI Nexus [DarkWaveAlgo]🧾 Description:
A nexus is a connection, link, or neuronal junction where signals and information are transmitted between different elements.
The MTF Smoothable RSI Nexus indicator serves as a nexus between smoothable, MTF RSIs by facilitating the visualization and interaction of up to six multi-timeframe RSIs, each with its own customizable timeframe, period, coloring customization, and price source. By combining these various RSIs, it helps you create a comprehensive view of MTF momentum trends and dynamics.
It acts as a control center that brings together multiple MTF RSIs and allows you to visualize the interactions between them with exceptional ease-of-use and customizability, helping to provide you with valuable insights into potential trend reversals, momentum shifts, and trading opportunities.
💡 Originality and Usefulness:
While there are other multi-timeframe RSI indicators available, MTF Smoothable RSI Nexus' global smoothing settings offer a flexible take on the development of price momentum across various timeframes. Its semi-transparent overbought and oversold fill zones create a compounding opaqueness when RSIs from multiple timeframes coalesce - making visual assessment of momentum extremes incredibly easy. We also believe it stands above the rest with its sheer quantity and quality of settings, features, and usability.
✔️ Re-Published to Avoid Misleading Values
This script has been re-published to ensure that it does not use `request.security()` calls using lookahead_on to access future data when referencing RSIs from other timeframes. This decreases the likelihood that the indicator will provide deceiving values. This change has been made in accordance with the PineScript documentation: "Using barmerge.lookahead_on at timeframes higher than the chart's without offsetting the `expression` argument like in `close [ ]` will introduce future leak in scripts, as the function will then return the `close` price before it is actually known in the current context" and the Publishing Rule: "Do not use `request.security()` calls using lookahead to access future data". Historical and real-time values may differ when referencing timeframes other than the chart's.
💠 Features:
6 toggleable MTF Smoothable RSIs with customizable timeframes, periods, and price sources
Compounding overbought/oversold filled areas for easy MTF momentum analysis
Aesthetic and flexible coloring and color theme styling options
End-of chart labels and options for ease-of-use and legibility
⚙️ Settings:
Use a Color Theme: When this setting is enabled, all manual 'Bullish and Bearish Colors' are overridden. All plots will use the colors from your selected Color Theme - excepting those plots set to use the 'Single Color' coloring method.
Color Theme: When 'Use a Color Theme' is enabled, this setting allows you to select the color theme you wish to use.
Hide RSIs on Timeframes Lower Than the Chart: When this setting is enabled, any MTF RSI with a timeframe smaller than that of the chart the indicator is applied to will be hidden from view.
Overbought Level: Set the level value for the overbought line.
Oversold Level: Set the level value for the oversold line.
Overbought Color: When 'Use a Color Theme' is disabled, this will set the color for the Overbought Level line.
Oversold Color: When 'Use a Color Theme' is disabled, this will set the color for the Oversold Level line.
Fill Overbought/Oversold Areas: When enabled, the area between any MTF RSI and the Overbought/Oversold level will be filled with semi-transparent coloring if that RSI is above/below the respective level.
Smooth RSIs: When enabled, all MTF RSIs will be processed through an additional smoothing average calculation.
Smoothing Type: Set the calculation type for the smoothing process. Options include: Exponential, Simple, Weighted, Volume-Weighted, and Hull.
Enable: Show/hide a specific MTF RSI.
Timeframe: Set the timeframe for a specific MTF RSI.
Period: Set the lookback period for a specific MTF RSI.
Source Price: Set the source value used for a specific MTF RSI's calculation.
Coloring Method: Set the coloring method for this specific RSI. The coloring method defines how the RSI should be dynamically colored. Options include: 'Single Color' and 'Increasing/Decreasing'.
Bullish Color: When 'Use a Color Theme' is disabled, this will set the 'bullish color' for this specific MTF RSI.
Bearish Color: When 'Use a Color Theme' is disabled, this will set the 'bearish color' for this specific MTF RSI.
Single Color: When the 'Coloring Method' is set to Single Color for this specific RSI, this color option will set the RSI's color.
Enable Label: When enabled, a label will show at the end of the chart displaying the timeframe, period, smoothing type (if any), and current price value of this specific MTF RSI.
Size: Sets the font size of this specific MTF RSI's label.
Label Offset (in Bars): Sets the distance from the latest bar, in bars, at which this specific MTF RSI's label is displayed.
Show Label Line: When enabled, this specific MTF RSI's label will be accommodated by a dashed line connecting it to its plot.
📈 Chart:
The chart shown in this original publication displays the 15 minute chart on ETHUSDT. Displayed on the chart are 4 MTF RSIs: the 15m 14 WMA-Smoothed RSI, 1h 14 WMA-Smoothed RSI, 4h 14 WMA-Smoothed RSI, and the 1D 14 WMA-Smoothed RSI - offering an exemplary view of how you can easily use these MTF RSIs to your advantage in analyzing momentum relationship across multiple timeframes.

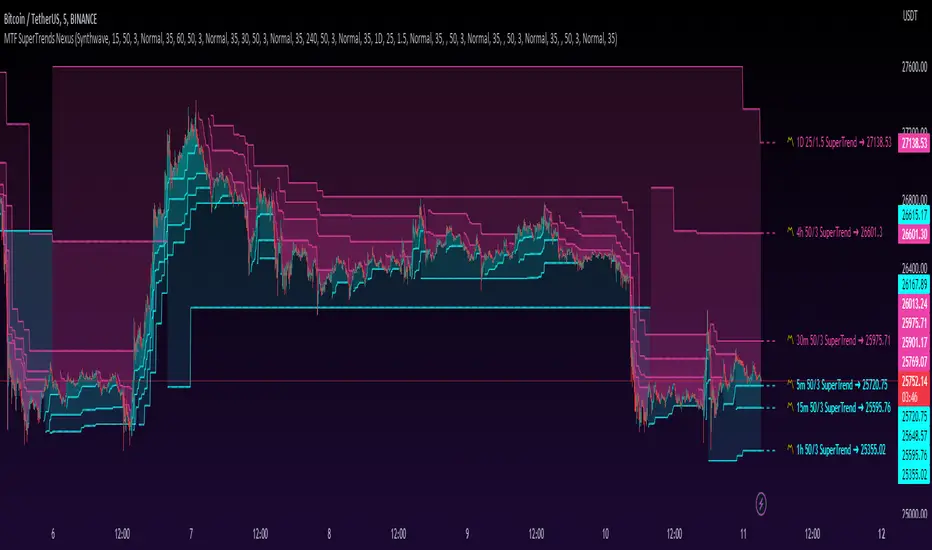
MTF SuperTrends Nexus [DarkWaveAlgo]🧾 Description:
A nexus is a connection, link, or neuronal junction where signals and information are transmitted between different elements.
The MTF SuperTrends Nexus indicator serves as a nexus between MTF SuperTrends by facilitating the visualization of up to eight multi-timeframe SuperTrends, each with its own customizable timeframe, period, factor, and coloring customization. By combining these various SuperTrends, it helps you create a comprehensive view of MTF trend dynamics and cross-timeframe confluence according to the SuperTrend indicator.
It acts as a utility/control center that brings together multiple MTF SuperTrends and allows you to visualize the interactions between them with exceptional ease-of-use and customizability, helping to provide you with valuable insights into potential trend reversals, momentum shifts, and trading opportunities.
💡 Originality and Usefulness:
While there are other multi-timeframe SuperTrend indicators available, MTF SuperTrends Nexus' semi-transparent fills create a compounding opaqueness when SuperTrends from multiple timeframes coalesce - making visual assessment of cross-timeframe confluence extremely easy. We also believe it stands above the rest with its sheer quantity and quality of settings, features, and usability.
✔️ Re-Published to Avoid Misleading Values
This script has been re-published to ensure that it does not use `request.security()` calls using lookahead_on to access future data when referencing SuperTrend calculations from other timeframes. This decreases the likelihood that the indicator will provide deceiving values. This change has been made in accordance with the PineScript documentation: "Using barmerge.lookahead_on at timeframes higher than the chart's without offsetting the `expression` argument like in `close [ ]` will introduce future leak in scripts, as the function will then return the `close` price before it is actually known in the current context" and the Publishing Rule: "Do not use `request.security()` calls using lookahead to access future data". Historical and real-time values may differ when referencing timeframes other than the chart's.
💠 Features:
8 toggleable MTF SuperTrends with customizable timeframes, periods, and factors
Compounding filled areas for easy MTF SuperTrend confluence analysis
Aesthetic and flexible coloring and color theme styling options
End-of chart labels and options for ease-of-use and legibility
⚙️ Settings:
Use a Color Theme: When this setting is enabled, all manual 'Bullish and Bearish Colors' are overridden. All plots will use the colors from your selected Color Theme - excepting those plots set to use the 'Single Color' coloring method.
Color Theme: When 'Use a Color Theme' is enabled, this setting allows you to select the color theme you wish to use.
Fill SuperTrend Areas: When enabled, the area between any MTF SuperTrend and the price bars will be filled with semi-transparent coloring.
Hide SuperTrends on Timeframes Lower Than the Chart: When this setting is enabled, any MTF SuperTrend with a timeframe smaller than that of the chart the indicator is applied to will be hidden from view.
Enable: Show/hide a specific MTF SuperTrend.
Timeframe: Set the timeframe for a specific MTF SuperTrend.
Period: Set the lookback period for a specific MTF SuperTrend.
Factor: Set the multiplier factor used for a specific MTF SuperTrend's calculation.
Bullish Color: When 'Use a Color Theme' is disabled, this will set the 'bullish color' for this specific MTF SuperTrend.
Bearish Color: When 'Use a Color Theme' is disabled, this will set the 'bearish color' for this specific MTF SuperTrend.
Enable Label: When enabled, a label will show at the end of the chart displaying the timeframe, period, factor, and current price value of this specific MTF SuperTrend.
Size: Sets the font size of this specific MTF SuperTrend's label.
Label Offset (in Bars): Sets the distance from the latest bar, in bars, at which this specific MTF SuperTrend's label is displayed.
Show Label Line: When enabled, this specific MTF SuperTrend's label will be accommodated by a dashed line connecting it to its plot.
📈 Chart:
The chart shown in this original publication displays the 5 minute chart on BTCUSDT. Displayed on the chart are 6 MTF SuperTrends: the 5m 50-period/3-factor SuperTrend, 15m 50-period/3-factor SuperTrend, 30m 50-period/3-factor SuperTrend, 1h 50-period/3-factor SuperTrend, 4h 50-period/3-factor SuperTrend, and the 1D 25-period/1.5-factor SuperTrend - offering an exemplary view of how you can easily use these MTF SuperTrends to your advantage in analyzing SuperTrend relationships across multiple timeframes.
MTF MAs and Crosses Nexus [DarkWaveAlgo]🧾 Description:
A nexus is a connection, link, or neuronal junction where signals and information are transmitted between different elements.
The MTF MAs and Crosses Nexus indicator serves as a nexus between MTF Moving Averages by facilitating the visualization and interaction of up to eight multi-timeframe moving averages, each with its own customizable timeframe, period, cross-over and cross-under alerts and plot markers, moving average calculation type, and price source.
It acts as a utility/control center that brings together multiple MTF moving averages (MTF MAs) and allows you to visualize the interactions between them with exceptional ease-of-use and customizability, helping to provide you with valuable insights into potential trend reversals, momentum shifts, and trading opportunities.
💡 Originality and Usefulness:
While there are other multi-timeframe moving average indicators available, MTF MAs and Crosses Nexus' customizable alert and signal settings offer intra-indicator MTF moving average cross markers and alerts not seen in other MTF MA indicators, allowing you to visualize the cross-over and cross-under relationships between the indicator's MAs with an 'all-in-one' experience. We also believe it stands above the rest with its sheer quantity and quality of settings, features, and usability.
✔️ Re-Published to Avoid Misleading Values
This script has been re-published to ensure that it does not use `request.security()` calls using lookahead_on to access future data when referencing moving averages from other timeframes. This decreases the likelihood that the indicator will provide deceiving values. This change has been made in accordance with the PineScript documentation: "Using barmerge.lookahead_on at timeframes higher than the chart's without offsetting the `expression` argument like in `close ` will introduce future leak in scripts, as the function will then return the `close` price before it is actually known in the current context" and the Publishing Rule: "Do not use `request.security()` calls using lookahead to access future data".
💠 Features:
8 toggleable MTF Moving Averages with customizable timeframes, periods, moving average calculation types, and price sources
Customizable cross-over and cross-under alert and chart signal options for each MTF MA (toggleable cross alerts and signals for crosses between intra-indicator MAs and bar price values)
Aesthetic and flexible coloring and color theme styling options
End-of chart labels and options for ease-of-use and legibility
⚙️ Settings:
Use a Color Theme: When this setting is enabled, all manual 'Bullish and Bearish Colors' are overridden. All plots will use the colors from your selected Color Theme - excepting those plots set to use the 'Single Color' coloring method.
Color Theme: When 'Use a Color Theme' is enabled, this setting allows you to select the color theme you wish to use.
Hide MAs on Timeframes Lower Than the Chart: When this setting is enabled, any MTF MA with a timeframe smaller than that of the chart the indicator is applied to will be hidden from view.
Enable: Show/hide a specific MTF MA.
Timeframe: Set the timeframe for a specific MTF MA.
Period: Set the lookback period for a specific MTF MA.
Type: Set the calculation type for a specific MTF MA. Options include: Exponential, Simple, Weighted, Volume-Weighted, and Hull.
Source Price: Set the source value used for a specific MTF MA's calculation.
Enable Cross Over Signals & Alerts: When enabled, cross-over chart signals (markers) and alerts are enabled for when this specific MTF MA crosses above its respective 'Cross Over Cross Source'.
Enable Cross Under Signals & Alerts: When enabled, cross-under chart signals (markers) and alerts are enabled for when this specific MTF MA crosses below its respective 'Cross Under Cross Source'.
Cross Source: Set the target plot which this specific MTF MA must cross (for either a cross-over or cross-under event) to trigger a chart signal and alert.
Marker Position: Set the position where this specific MTF MA's cross chart signal should appear. Options include: Above Bar, Below Bar, and On MA Line.
Coloring Method: Set the coloring method for this specific MA. The coloring method defines how the MA should be dynamically colored. Options include: Single Color, Increasing/Decreasing, and Over/Under Price.
Bullish Color: When 'Use a Color Theme' is disabled, this will set the 'bullish color' for this specific MTF MA.
Bearish Color: When 'Use a Color Theme' is disabled, this will set the 'bearish color' for this specific MTF MA.
Single Color: When the 'Coloring Method' is set to Single Color for this specific MA, this color option will set the MA's color.
Enable Label: When enabled, a label will show at the end of the chart displaying the timeframe, period, MA type, and current price value of this specific MTF MA.
Size: Sets the font size of this specific MTF MA's label.
Label Offset (in Bars): Sets the distance from the latest bar, in bars, at which this specific MTF MA's label is displayed.
Show Label Line: When enabled, this specific MTF MA's label will be accommodated by a dashed line connecting it to its plot.
📈 Chart:
The chart shown in this original publication displays the 15 minute chart on BTCUSDT. Displayed on the chart are 4 MTF MAs: the 15m 20 WMA, 30m 100 EMA, 1h 11 EMA, and 1D 7 VWMA - offering an exemplary view of how you can use these MTF MAs and crosses to your advantage in gauging trend relationships across multiple timeframes.

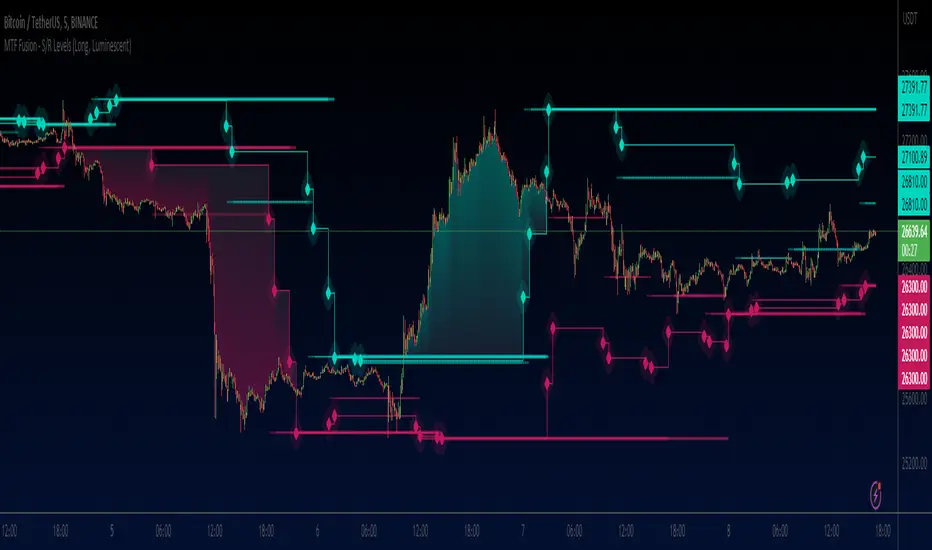
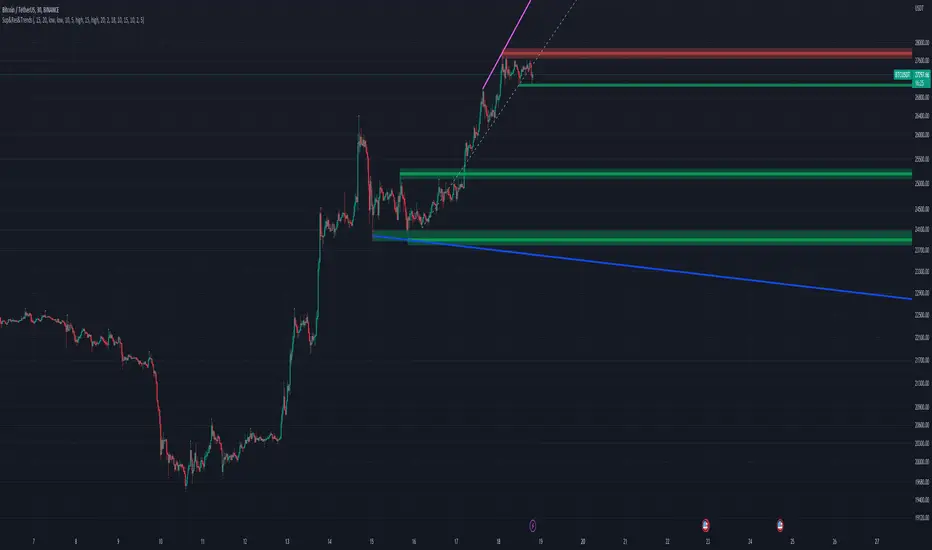
MTF Fusion - S/R Levels [TradingIndicators]MTF Fusion S/R Levels intelligently adapt to whatever timeframe you're trading - dynamically calculating pivot-based support and resistance levels combined from four appropriate higher timeframes to give you a much broader view of the market and an edge in your trading decisions. It is the second indicator in our MTF Fusion series, and leverages our MTF Fusion algorithm - only this time to visualize pivot-based S/R levels and zones.
These levels are not programmed to repaint - so you can use them in real-time just as they appeared historically.
What is MTF Fusion?
Multi-Timeframe (MTF) Fusion is the process of combining calculations from multiple timeframes higher than the chart's into one 'fused' value or indicator. It is based on the idea that integrating data from higher timeframes can help us to better identify short-term trading opportunities within the context of long-term market trends.
How does it work?
Let's use the context of this indicator, which calculates S/R Levels based on pivot points, as an example to explain how MTF Fusion works and how you can perform it yourself.
Step 1: Selecting Higher Timeframes
The first step is to determine the appropriate higher timeframes to use for the fusion calculation. These timeframes should typically be chosen based on their ability to provide meaningful price levels and action which actively affect the price action of the smaller timeframe you're focused on. For example, if you are trading the 5 minute chart, you might select the 15 minute, 30 minute, and hourly timeframe as the higher timeframes you want to fuse in order to give you a more holistic view of the trends and action affecting you on the 5 minute. In this indicator, four higher timeframes are automatically selected depending on the timeframe of the chart it is applied to.
Step 2: Gathering Data and Calculations
Once the higher timeframes are identified, the next step is to calculate the data from these higher timeframes that will be used to calculate your fused values. In this indicator, for example, the values of support and resistance levels are calculated by determining pivot points for all four higher timeframes.
Step 3: Fusing the Values From Higher Timeframes
The next step is to actually combine the values from these higher timeframes to obtain your 'fused' indicator values. The simplest approach to this is to simply average them. If you have calculated the value of a support level from three higher timeframes, you can, for example, calculate your 'multi-timeframe fused level' as (HigherTF_Support_Level_1 + HigherTF_Support_Level_2 + HigherTF_Support_Level_3) / 3.0.
Step 4: Visualization and Interpretation
Once the calculations are complete, the resulting fused indicator values are plotted on the chart. These values reflect the fusion of data from the multiple higher timeframes, giving a broader perspective on the market's behavior and potentially valuable insights without the need to manually consider values from each higher timeframe yourself.
What makes this script unique? Why is it closed source?
While the process described above is fairly unique and sounds simple, the truly important key lies in determining which higher timeframes to fuse together, and how to weight their values when calculating the fused end result in such a way that best leverages their relationship for useful TA.
This MTF Fusion indicator employs a smart, adaptive algorithm which automatically selects appropriate higher timeframes to use in fusion calculations depending on the timeframe of the chart it is applied to. It also uses a dynamic algorithm to adjust and weight the lookbacks used for pivot and S/R level calculations depending on each higher timeframe's relationship to the chart timeframe. These algorithms are based on extensive testing and are the reason behind this script's closed source status.
Included Features
Fusion Support and Resistance Levels
Dynamic Multi-Timeframe S/R Levels
Breakaway Zone fills to highlight breakouts and breakdowns from the Fusion S/R Levels
Customizable lookback approach
Pre-built color stylings
Options
Fusion View: Show/hide the Fusion S/R Levels calculated from multiple higher timeframes
MTF View: Show/hide the S?R levels from multiple higher timeframes used to calculate the Fusion S/R Levels
Breakaway Zones: Show/hide the fill for zones where price breaks away from the Fusion S/R Levels
Lookback: Select how you want your S/R Levels to be calculated (longer = long-term levels, shorter = short-term levels)
Pre-Built Color Styles: Use a pre-built color styling (uncheck to use your own colors)
Manual Color Styles: When pre-built color styles are disabled, use these color inputs to define your own
MTF Fusion - S/R Trendlines [TradingIndicators]MTF Fusion S/R Trendlines intelligently adapt to whatever timeframe you're trading - dynamically calculating support and resistance trendline levels combined from four appropriate higher timeframes to give you a much broader view of the market and an edge in your trading decisions.
These trendlines are not programmed to repaint - so you can use them in real-time just as they appeared historically.
What is MTF Fusion?
Multi-Timeframe (MTF) Fusion is the process of combining calculations from multiple timeframes higher than the chart's into one 'fused' value or indicator. It is based on the idea that integrating data from higher timeframes can help us to better identify short-term trading opportunities within the context of long-term market trends.
How does it work?
Let's use the context of this indicator, which calculates S/R Trendlines, as an example to explain how MTF Fusion works and how you can perform it yourself.
Step 1: Selecting Higher Timeframes
The first step is to determine the appropriate higher timeframes to use for the fusion calculation. These timeframes should typically be chosen based on their ability to provide meaningful price levels and action which actively affect the price action of the smaller timeframe you're focused on. For example, if you are trading the 5 minute chart, you might select the 15 minute, 30 minute, and hourly timeframe as the higher timeframes you want to fuse in order to give you a more holistic view of the trends and action affecting you on the 5 minute. In this indicator, four higher timeframes are automatically selected depending on the timeframe of the chart it is applied to.
Step 2: Gathering Data and Calculations
Once the higher timeframes are identified, the next step is to calculate the data from these higher timeframes that will be used to calculate your fused values. In this indicator, for example, the values of support and resistance trendlines are calculated for all four higher timeframes.
Step 3: Fusing the Values From Higher Timeframes
The next step is to actually combine the values from these higher timeframes to obtain your 'fused' indicator values. The simplest approach to this is to simply average them. If you have calculated the value of a support trendline from three higher timeframes, you can, for example, calculate your 'multi-timeframe fused trendline' as (HigherTF_Support_Trendline_1 + HigherTF_Support_Trendline_2 + HigherTF_Support_Trendline_3) / 3.0.
Step 4: Visualization and Interpretation
Once the calculations are complete, the resulting fused indicator values are plotted on the chart. These values reflect the fusion of data from the multiple higher timeframes, giving a broader perspective on the market's behavior and potentially valuable insights without the need to manually consider values from each higher timeframe yourself.
What makes this script unique? Why is it closed source?
While the process described above is fairly unique and sounds simple, the truly important key lies in determining which higher timeframes to fuse together, and how to weight their values when calculating the fused end result in such a way that best leverages their relationship for useful TA.
This MTF Fusion indicator employs a smart, adaptive algorithm which automatically selects appropriate higher timeframes to use in fusion calculations depending on the timeframe of the chart it is applied to. It also uses a dynamic algorithm to adjust and weight the lookbacks used for trendline calculations depending on each higher timeframe's relationship to the chart timeframe. These algorithms are based on extensive testing and are the reason behind this script's closed source status.
Included Features
Fusion Support and Resistance Trendlines
Dynamic Multi-Timeframe Trendlines
Breakaway Zone fills to highlight breakouts and breakdowns from the Fusion trendlines
Customizable lookback approach
Pre-built color stylings
Options
Fusion View: Show/hide the Fusion trendlines calculated from multiple higher timeframes
MTF View: Show/hide the trendlines from multiple higher timeframes used to calculate the Fusion trendlines
Breakaway Zones: Show/hide the fill for zones where price breaks away from the Fusion trendlines
Lookback: Select how you want your trendlines to be calculated (longer = long-term trendlines, shorter = short-term trendlines)
Pre-Built Color Styles: Use a pre-built color styling (uncheck to use your own colors)
Manual Color Styles: When pre-built color styles are disabled, use these color inputs to define your own

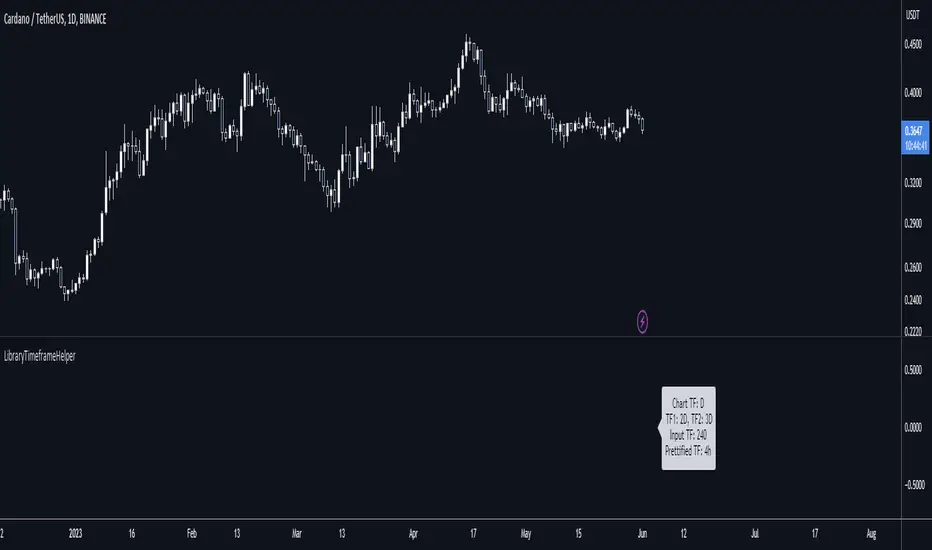
LibraryTimeframeHelperLibrary "LibraryTimeframeHelper"
Helper functions to work with timeframes: to get the next higher TF, and to make the string pretty for use in labels. Perhaps I'll add more later.
f_getHigherTF(_TF)
f_getHigherTF(): Converts the input timeframe into the next one up in the list of commonly used timeframes. NOTE: You can NOT use a TF from this function as input to a request.security() call if called from this library because it gets converted to a series (since there's nothing special about this function, I expect this probably goes for any library). However, you CAN copy the code and use it directly in your script, in which case the output is only a simple variable and thus suitable for the timeframe of a request.security() call.
Parameters:
_TF (string) - The timeframe to convert.
Returns: : A string in standard timeframe format.
f_prettifyTF(_TF)
f_prettifyTF(): Converts the input timeframe from standard timeframe format to the format shown by TradingView on a chart. The output is not suitable for use as an input timeframe of a request.security() call.
Parameters:
_TF (string) - The timeframe to convert.
Returns: : A string in prettified timeframe format.
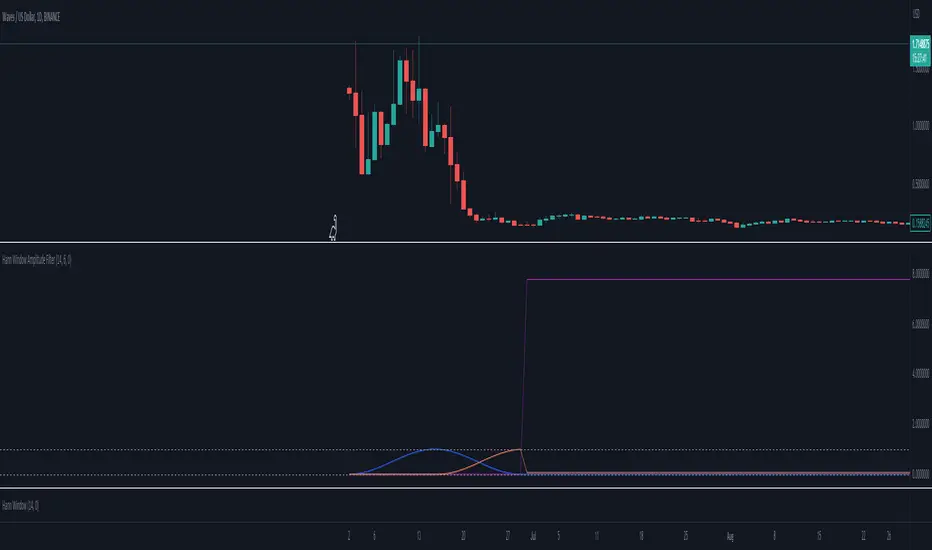
Hann Window Amplitude FilterThis script is designed to implement a multi-signal Hann filter, which is essentially a movable Hann window filter. The purpose of this filter is to allow users to select the periods or frequencies that best align with their trading strategy or market analysis.
The Hann window filter operates by enabling the selection of either lower or higher frequencies. The period of the window is twice the number of signals you wish to filter. As you shift the window by the number of your signals, the signal on one side will have an amplitude of 0, while the other side will have an amplitude of 1.
Continuing to shift the window will result in new values of 0. This feature is particularly useful for further filtering the frequencies or periods that you want to focus on for your trading decisions.
In summary, this script provides a flexible and customizable tool for filtering signals based on their frequency or period, which can be a valuable addition to any trader's technical analysis toolkit.
Price Action (ValueRay)With this indicator, you gain access to up to 5 moving averages from a selection of 15 different types. This flexibility allows you to customize your trading strategy based on your preferences and market conditions. Whether you're a fan of simple moving averages, exponential moving averages, or weighted moving averages, our indicator has got you covered! Additionally, all the MAs are Multi-Time-Frame!
The indicator also provides trading signals. By analyzing market trends and price movements, it generates accurate buy and sell signals, providing you with clear entry and exit points. You can choose between Fast, Mid, and Slow signal speeds.
Trendlines are another crucial aspect of effective trading, and our indicator seamlessly integrates them, helping you visualize the market's direction.
Furthermore, the indicator empowers you with recent highs and lows. By highlighting these key levels, it becomes easier than ever to spot support and resistance areas, aiding you in making well-informed trading choices.
Additionally, you can switch the ADR% (Average Daily Range as a Percentage) on and off. This number instantly provides you with information on how much the stock usually moves per day as a percentage.
Key Features:
Up to 5 Moving Averages, each with its own timeframe.
SMA, EMA, WMA, RMA, Triangular, Volume Weighted, Elastic Volume Weighted, Least Squares, ZLEMA, Hull, Double EMA, Triple EMA, T3, ALMA, KAMA (more to come in future versions).
Recent High and Low Pivot Points acting as support/resistance.
Trendline indicating the current trend.
Buy/Sell Signals (recommended for use as exit points, stop loss, or take profit levels).
Signals can have three different speeds: Fast, Mid, and Slow. You can switch them anytime depending on how quickly or slowly you want to exit a trade.
The predefined colors are best suited for a dark background, and the predefined settings provide a solid starting point that many traders use in their daily work.
Unlock the full potential of your trading strategy with our comprehensive indicator and start making informed trading decisions today!

Moving Averages + BB & R.VWAP StDev (multi-tf)█ Moving Averages + Bollinger Bands and Rolling Volume Weighted Average Price with Standard Deviation Bands (Multi Timeframe)
Multiple moving averages can be independently applied.
The length , type and timeframe of each moving average are configurable .
The lines and colors are customizable too.
This script can display:
Moving Averages
Bollinger Bands
Rolling VWAP and Standard Deviation Bands
Types of Moving Averages:
Simple Moving Average (SMA)
Exponential Moving Average (EMA)
Smoothed Moving Average (SMMA)
Weighted Moving Average (WMA)
Volume Weighted Moving Average (VWMA)
Least Squares Moving Average (LSMA)
Hull Moving Average (HMA)
Arnaud Legoux Moving Average (ALMA)
█ Moving Average
Moving Averages are price based, lagging (or reactive) indicators that display the average price of a security over a set period of time.
A Moving Average is a good way to gauge momentum as well as to confirm trends, and define areas of support and resistance.
█ Bollinger Bands
Bollinger Bands consist of a band of three lines which are plotted in relation to security prices.
The line in the middle is usually a Simple Moving Average (SMA) set to a period of 20 days (the type of trend line and period can be changed by the trader, a 20 day moving average is by far the most popular).
The SMA then serves as a base for the Upper and Lower Bands which are used as a way to measure volatility by observing the relationship between the Bands and price.
█ Rolling VWAP
The typical VWAP is designed to be used on intraday charts, as it resets at the beginning of the day.
Such VWAPs cannot be used on daily, weekly or monthly charts. Instead, this rolling VWAP uses a time period that automatically adjusts to the chart's timeframe.
You can thus use the rolling VWAP on any chart that includes volume information in its data feed.
Because the rolling VWAP uses a moving window, it does not exhibit the jumpiness of VWAP plots that reset.
Based on the previous script :

Market Dynamics Pro [ChartPrime]ChartPrime Market Dynamics Pro is designed to cater to those traders who are more interested in market structures, price action and fundermentals. Analysing volume, key levels in the market, market phases and multi-timeframe can help a trader build a clearer and more actionable view of the market. ChartPrime performs analysis on data in a unique way therefore attempting to give insights into the market otherwise unseen.
Major Features:
Order blocks: The ChartPrime order blocks provide sleek and clear levels in the market where the price might find support and resistance. It is important to note this data isn't availible currently therefore these are derived from data outside of order books. Order blocks are segmented into 4 sections reflecting the volume at a given levels. Low, Medium, High and very high based on relevant and dynamic averages. This allows a trader to identify how significant a level is in the market in a simpler method. Bearish order blocks have a red color bias and bullish order blocks have a green color bias allowing a trader to identify what type of order block it is. The order blocks also dynamically show the remaining volume at that given level.
Pattern Detection: ChartPrime leverages unique pattern identification methods providing earlier and cleaner chart formations. Patterns are commonly used in trading to assess whether bulls or bears are performing optimally in a market or losing strength. ChartPrime identifies; Ascending wedges, descending wedges, symmetrical Triangles, H&S, iH&S, broadening wedges and double tops/bottoms. Patterns often have associated theory behind them for entries and targets that we suggest a trader covers before using this feature. ChartPrime also allow for the user to adjust where a pattern is drawn from. In pattern theory there are 2 main approaches to drawing a formation; from candle body and candle wick. ChartPrime allows for this to be adjusted by a user and also allow for alerts to be set on these patterns.
MTF SR: Taking into account multi timeframes when trading is a key idea. Having ideas of the larger market moves can provide deeper context when trading. ChartPrime Market Dynamics Pro allows for 3 varying SR plots from 3 varying user desired timeframes. These are graded via pivot analysis and grid analysis. This rank is on a 1-10 scale with 1 being the highest rank and 10 is the lowest.
Market Stucutures : These labels are commonly found and used by the Smart Money community. They denote a break of stucture and a chance of character. BOS are labelled when the price breaks a lower low or higher high (in the trending markets) and a CoC occurs when price breaks a trending market pivot. These break a market into clearer breakouts of price action and can help a trader deduce relevant moves. The indicator allows for the user to adjust the detection length of these structures.
Premium and Discount Zones: Premium and Discount zones are underpinned by a simple piece of logic. A premium zone is taken from a higher swing point and the discount from a lower swing point. Although a very generic approach this can show areas in the market that could see a reaction. An asset being in a discount zone implies the price is undervalued. An asset being in a premium zone implies the asset is overpriced or overextended. These are excellent when used in confluence with other SR methods. These naturally will have a delay as they are derived from swing points in a market but still are extremely relevant levels.
Fair Value Gaps: These are gaps in the market where price has seen a highly volatile move and they are assumed to act as magnets in the market. The price may come back and visit these 'gaps' after the move has occured. These are a common technique now used by traders and added to this toolkit for convinience.
Settings:
Order Blocks: Select the scale of the order blocks displayed
BoS/CoC: Toggle these on/off and adjust the lookback on these market structures
Premium/Discount Zones: Toggle on/off and adjust lookback
Enable FVG: Toggle on/off FVGs
Swing Levels: Enable basic swing levels in market
MTF Support/Resistance: Enable and select the relevant timeframe to obtain MTF SR levels on your chart. Up to 3 timeframes at a time.
Predictive Ranges: Toggle on/off
Trend Lines Detection: Toggle on/off trendlines
Wedge Detection: Adjust how patterns are detected; whether from wick or candle body
Toggles provided for relevant patterns.
Example usecases:
ChartPrime order blocks give a deeper insight into market support and resistance levels. Looking for order blocks labelled with High can indicate this level being a significant support or resistance in the market. Adding in further confluences here can assist further in deciding where the price may see a reaction. Take the screenshot below:
Adding in confluences from other timeframes can also help give a broader view. Using the multi time frame graded frame support and resistance levels we can use these to further assist us in finding significant levels in the market.
ChartPrime also provides breaker blocks. These are still significant levels in the market despite being "broken" prior. These too can be used in a classical manor and act as relevant areas in the market. These are particularly effective when used in confluence with Premium and discount zones. We can see in the example below price sees a strong reaction and bounces at these levels.
Market Dynamics Pro provides a comprehensive toolkit of unique features and mixes in the classical concepts allowing for a cleaner charting experience.
All content and indicators provided by ChartPrime are purely for informational & educational purposes only. Past performance does not guarantee future results.
สคริปต์แบบชำระเงิน

Premium MTF Layered RSI - Bitcoin Bot [wbburgin]This the premium version of my MTF Layered RSI strategy, which improves significantly on the original strategy (publicly available on my profile). Improvements are below. This strategy will also appear as an overlay on your chart. It is completely non-repainting.
The MTF Layered RSI strategy uses the current timeframe and two configurable higher timeframes to enter a long position when Bitcoin is oversold on all three timeframes, and exit the long position when Bitcoin is overbought on the current timeframe. This hedges against situations where the RSI on higher timeframes never reaches the overbought level and we are left "holding the bag" so to speak with the classic "enter long at oversold and enter short at overbought" strategy.
IMPORTANT: This strategy does not work on ranges. It will work on all timeframes and assets, but does not work on ranges (Renko blocks and some other advanced types of charts).
********** My Background
I am an investor, trader, and entrepreneur with 10 years of cryptocurrency and equity trading experience and founder of two fintech startups. I am a graduate of a prestigious university in the United States and carry broad and inclusive interests in mathematical finance, computer science, machine learning / artificial intelligence, as well as other fields.
**********
Improvements over the original MTF RSI strategy include:
Filters for Uptrends and Downtrends → The Premium RSI strategy will adjust its buy and sell thresholds depending on whether the instrument is trending. This means that, in uptrends, the Premium strategy will buy more frequently, bringing in potentially greater profit, and in downtrends, the strategy will stop buying altogether. These filters and dynamic buy/sell thresholds have made this strategy more profitable in my backtesting across random timeframes, but I cannot guarantee that the strategy will be profitable for you on the default settings. To that end, I have enabled a number of different configurations that you can change in the settings of the strategy.
Stop Loss / Take Profit Calculation Per Tick → Stop loss and take profit are now both enabled in the script and each has their own alerts. You can specify what type of stop loss or take profit you want: percentage or ATR. If you have alerts configured, you will be alerted mid-bar, instead of at close. This helps prevent loss from abrupt falls in price between closing price and next bar open.
Customizable Alert Messages In-Strategy → In the settings, there will be text boxes where you can create your own alerts. All you will need to do is create an alert in the alert panel on Tradingview and leave the message box blank - if you fill out the alert boxes in the settings, these will automatically populate into your alerts. There are in total eight different customizable alerts messages: Entry, Exit, Stop loss, and Take profit alerts for both Long and Short sides. If you disable stop loss and/or take profit, these alerts will also be disabled. Similarly, if you disable shorts, all short alerts will be disabled.
**********
Display
Configuring Stop Loss or Take Profit will make their corresponding displays appear.
Separately from the trading boxes, background colors (green, red) signify extended uptrends and downtrends, respectively.
Configuring Alerts
In TradingView desktop, go to the ‘Alerts’ tab on the right panel. Click the “+” button to create a new alert. Select this strategy for the condition and one of the two options that includes alert() function calls. Name the alert what you wish and clear the default message, because your text in the settings will replace this message.
Now that the alert is configured, you can go to the settings of the strategy and fill in your chosen text for the specific alert condition. You will need to check “Long and Short” in the “Trade Direction” setting in order for any Short Alerts to become active. Similarly, you will need to check “Enable Stop Loss” for stop loss alerts to become active and “Enable Take Profit” for take profit alerts to become active.
**********
Disclaimer
Copyright by wbburgin.
The information contained in my Scripts/Indicators/Algorithms does not constitute financial advice or a solicitation to buy or sell any securities of any type. I will not accept liability for any loss or damage, including without limitation any loss of profit, which may arise directly or indirectly from the use of or reliance on such information.
All investments involve risk, and the past performance of a security, industry, sector, market, financial product, trading strategy, backtest, or individual's trading does not guarantee future results or returns. Investors are fully responsible for any investment decisions they make. Such decisions should be based solely on an evaluation of their financial circumstances, investment objectives, risk tolerance, and liquidity needs.
**********
Notes on the Strategy Performance below: This is 3% of equity per trade, with a pyramiding number of 3. I did not include fees because Binance US on Bitcoin/USD does not charge fees on the instrument; however, I heavily encourage you to include fees in your backtesting if you use a different brokerage. To mitigate fees, this strategy is designed with a high average %/trade. If your current fees are greater than the strategy's average %/trade, I encourage you to choose a higher RSI period, such as 14 or 28, which will result in less trades but potentially a higher %/trade.

MTF Stationary Extreme IndicatorThe Multiple Timeframe Stationary Extreme Indicator is designed to help traders identify extreme price movements across different timeframes. By analyzing extremes in price action, this indicator aims to provide valuable insights into potential overbought and oversold conditions, offering opportunities for trading decisions.
The indicator operates by calculating the difference between the latest high/low and the high/low a specified number of periods back. This difference is expressed as a percentage, allowing for easy comparison and interpretation. Positive values indicate an increase in the extreme, while negative values suggest a decrease.
One of the unique features of this indicator is its ability to incorporate multiple timeframes. Traders can choose a higher timeframe to analyze alongside the current timeframe, providing a broader perspective on market dynamics. This feature enables a comprehensive assessment of extreme price movements, considering both short-term and longer-term trends.
By observing extreme movements on different timeframes, traders can gain deeper insights into market conditions. This can help in identifying potential areas of confluence or divergence, supporting more informed trading decisions. For example, when extreme movements align across multiple timeframes, it may indicate a higher probability of a significant price reversal or continuation.
To use the Multiple Timeframe Stationary Extreme Indicator effectively, traders should consider a few key points:
- Choose the Timeframes : Select the appropriate timeframes based on your trading strategy and objectives. The current timeframe represents the focus of your analysis, while the higher timeframe provides a broader context. Ensure the chosen timeframes align with your trading style and the asset you are trading.
- Interpret Extreme Movements : Pay attention to extreme movements that breach certain levels. Values above zero indicate a rise in the extreme, potentially signaling overbought conditions. Conversely, values below zero suggest a decrease, potentially indicating oversold conditions. Use these extreme movements as potential entry or exit signals, in conjunction with other indicators or confirmation signals.
- Validate with Price Action : Confirm the extreme movements observed on the indicator with price action. Look for confluence between the indicator's extreme levels and key support or resistance levels, trendlines, or chart patterns. This can provide added confirmation and increase the reliability of the signals generated by the indicator.
- Consider Volatility Filters : The indicator can be enhanced by incorporating volatility filters. By adjusting the sensitivity of the extreme differences calculation based on market volatility, traders can adapt the indicator to different market conditions. Higher volatility may require a longer lookback period, while lower volatility may call for a shorter one. Experiment with volatility filters to fine-tune the indicator's performance.
- Combine with Other Analysis Techniques : The Multiple Timeframe Stationary Extreme Indicator is most effective when used as part of a comprehensive trading strategy. Combine it with other technical analysis tools, such as trend indicators, oscillators, or chart patterns, to form a well-rounded approach. Consider risk management techniques and money management principles to optimize your trading strategy.
---------------------------------------------------------------------------------------------------------------------------------------------------------------
Remember that trading indicators, including the Multiple Timeframe Stationary Extreme Indicator, should not be used in isolation. They serve as tools to assist in decision-making, but they require proper context, analysis, and confirmation. Always conduct thorough analysis and consider market conditions, news events, and other relevant factors before making trading decisions.
It's recommended to backtest the indicator on historical data to assess its performance and effectiveness for your trading approach. This will help you understand its strengths and limitations, allowing you to refine and optimize your usage of the indicator.

RSI MTF DashboardThis is an RSI dashboard, which allows you to see the current RSI value for five timeframes across up to 8 tickers of your choice. This is a useful tool to gauge momentum across multiple timeframes, where you would look to enter a buy with high RSI values across the timeframes (and vice versa for sell positions).
Conversely, some traders use RSI to identify potential areas for reversals, so you would look to buy with low RSI values (and vice versa for sell positions).
In the settings, please select which 5 timeframes you require. Then select which tickers you wish to see, and you will find a dashboard on your chart to show the RSI values. The dashboard can be highlighted when the RSI value shows bearish momentum (a value under 50, of your choice) and bullish momentum (a value over 50, again of your choice). These colours and values are fully customisable.
In the settings you can also select the location of the dashboard, as well as some colour and transparency settings to enable the best possible view on screen.

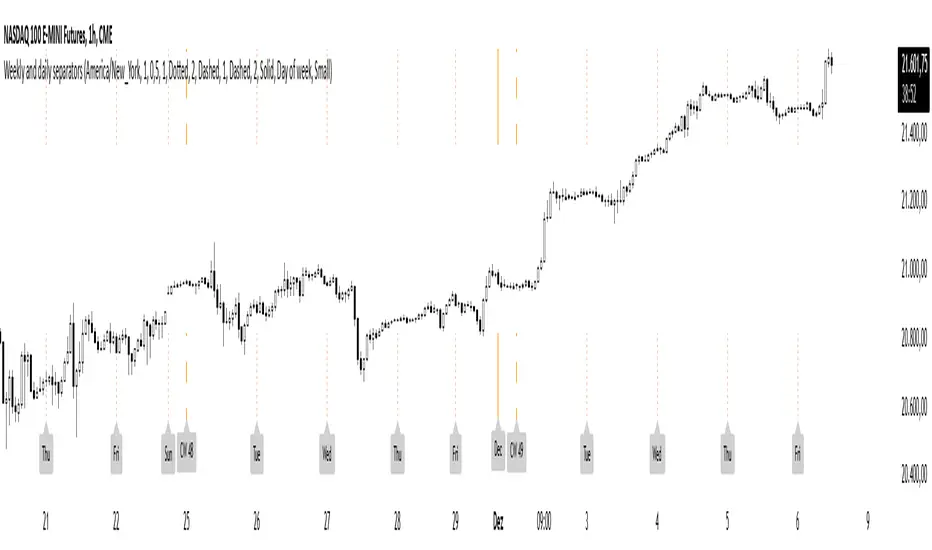
Weekly and daily separatorsThis script plots vertical line between each trading week (thick, solid) and smaller lines (dotted) between each trading day. This helps kepping a better overview on the aspect of time on the higher timeframes below 1D. The distance of the lines to the top and bottom of the chart is controlled by your chart settings menu under Appearance -> Margins.
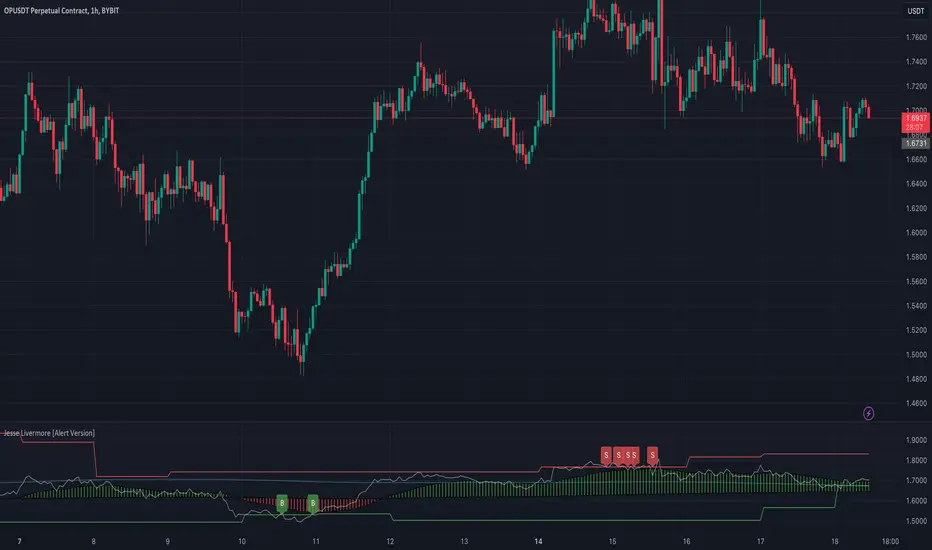
Jesse Livermore Strategy [Buy & Sell]Jesse Livermore was a famous trader who made a fortune in the early 20th century through his unique approach to trading.
While he did not leave behind a single, specific trading strategy that is attributed to him, I have tried to reproduce one.
His trading strategy was based on understanding market trends and sentiment, and he used several technical indicators to identify potential entry and exit points.
Some of the indicators he used include:
Price Action:
Jesse Livermore relied heavily on price action to make trading decisions.
He believed that the price itself was the best indicator of market sentiment, and that by analyzing the price movement, he could identify trends and market behavior.
Volume:
Livermore also used volume to confirm price movements.
He believed that a rise in volume along with a price increase indicated a strong bullish trend, while a decrease in volume with a price increase indicated a weak trend.
Pivot Points:
Another key component of Jesse Livermore's trading strategy was pivot points.
He used pivot points to identify potential support and resistance levels in the market, which he then used to identify potential entry and exit points.
Jesse Livermore outlined a simple trading system: wait for pivotal points before entering a trade.
When the points come into play, trade them using a buffer, trading in the direction of the overall market.
Let the price dictate your actions and stay with profitable trades until there is good reason to exit the trade.
The one I have tried to reproduce it's based on Pivot High and Low looking back 5 Days, and the average price oscillator.
When the price is bellow the support defined line it's time to Buy ( Long Position ), when the Price line is over the Resistance Line it's time to Sell ( Short Position )
This indicator has to be checked, and tried into a Real-Time context, so using the Replay functionality of TradingView is the best way to see and understand how Signals comes
(NB: look back into the chart without Replay should give you wrong Buy/Sell information)
The Indicator can be used on every TimeFrames, but the better ones are 5min - 15min.
I will add the possibility to choose the TimeFrames value for Pivot High and Low.
I will create a version with Alerts for Buy and Sell and the possibility to integrate it with "3commas Bot" where the best deal can be to set a TP to 1% for each Long or Short Entry.
Let's try it and comment for doubts or questions.
Cleaner Screeners LibraryLibrary "cleanscreens"
Screener Panel.
This indicator displays a panel with a list of symbols and their indications.
It can be used as a screener for multiple timess and symbols
in any timeframe and with any indication in any combination.
#### Features
Multiple timeframes
Multiple symbols
Multiple indications per group
Vertical or horizontal layouts
Acceepts External Inputs
Customizable colors with 170 presets included (dark and light)
Customizable icons
Customizable text size and font
Customizable cell size width and height
Customizable frame width and border width
Customizable position
Customizable strong and weak values
Accepts any indicator as input
Only 4 functions to call, easy to use
#### Usage
Initialize the panel with _paneel = cleanscreens.init()
Add groupd with _screener = cleanscreens.Screener(_paneel, "Group Name")
Add indicators to screeener groups with cleanscreens.Indicator(_screener, "Indicator Name", _source)
Update the panel with cleanscreens.display(_paneel)
Thanks @ PineCoders , and the Group members for setting the bar high.
# local setup for methods on our script
import kaigouthro/cleanscreen/1
method Screener ( panel p, string _name) => cleanscreens.Screener ( p, _name)
method Indicator ( screener s , string _tf, string name, float val) => cleanscreens.Indicator ( s , _tf, name, val)
method display ( panel p ) => cleanscreens.display ( p )
init(_themein, loc)
# Panel init
> init a panel for all the screens
Parameters:
_themein (string) : string: Theme Preset Name
loc (int) : int :
1 = left top,
2 = middle top,
3 = right top,
4 = left middle,
5 = middle middle,
6 = right middle,
7 = left bottom,
8 = middle bottom,
9 = right bottom
Returns: panel
method Screener(p, _name)
# Screener - Create a new screener
### Example:
cleanscreens.new(panel, 'Crpyto Screeners')
Namespace types: panel
Parameters:
p (panel)
_name (string)
method Indicator(s, _tf, name, val)
# Indicator - Create a new Indicator
### Example:
cleanscreens.Inidcator('1h', 'RSI', ta.rsi(close, 14))
Namespace types: screener
Parameters:
s (screener)
_tf (string)
name (string)
val (float)
method display(p)
# Display - Display the Panel
### Example:
cleanscreens.display(panel)
Namespace types: panel
Parameters:
p (panel)
indication
single indication for a symbol screener
Fields:
name (series string)
icon (series string)
rating (series string)
value (series float)
col (series color)
tf (series string)
tooltip (series string)
normalized (series float)
init (series bool)
screener
single symbol screener
Fields:
ticker (series string)
icon (series string)
rating (series string)
value (series float)
bg (series color)
fg (series color)
items (indication )
init (series bool)
config
screener configuration
Fields:
strong (series float)
weak (series float)
theme (series string)
vert (series bool)
cellwidth (series float)
cellheight (series float)
textsize (series string)
font (series int)
framewidth (series int)
borders (series int)
position (series string)
icons
screener Icons
Fields:
buy (series string)
sell (series string)
strong (series string)
panel
screener panel object
Fields:
items (screener )
table (series table)
config (config)
theme (theme type from kaigouthro/theme_engine/1)
icons (icons)

TimeFiesta by Billy Rock
Introducing TimeFiesta, a unique and fun digital clock timer for TradingView charts, created by Billy Rock. TimeFiesta is designed to help traders, especially scalpers, stay on top of multiple time frame closes with ease.
Features of TimeFiesta:
Customizable display of timer for Current Time Frame, 15 Minutes, 1 Hour, and 4 Hours.
Options to turn ON/OFF each time frame display as per the user's preference.
Adjustable digital clock text size: Small, Medium, and Large.
Multiple location options for the digital clock timer: Top Center, Top Right, and Bottom Right.
TimeFiesta is the perfect companion for those who need to keep an eye on multiple time frames while trading. Its sleek design and user-friendly interface make it a must- have tool for traders of all levels. With TimeFiesta, you'll never miss a crucial time frame close again!
Give credit where it's due: TimeFiesta is created by the talented Billy Rock. Be sure to try this fantastic tool and enhance your trading experience!

MTF Diagonally Layered RSI - 1 minute Bitcoin Bot [wbburgin]This is a NON-REPAINTING multi-timeframe RSI strategy (long-only) that enters a trade only when two higher timeframes are oversold. I wrote it on BTC/USD for 1min, but the logic should work on other assets as well. It is diagonally layered to be profitable for when the asset is in a downtrend.
Diagonal layering refers to entry and exit conditions spread across different timeframes. Normally, indicators can become unprofitable because in downtrends, the overbought zones of the current timeframe are not reached. Rather, the overbought zones of the faster timeframes are reached first, and then a selloff occurs. Diagonally-layered strategies mitigate this by selling diagonally, that is, selling once the faster timeframe reaches overbought and buying once the slower timeframe reaches oversold.
Thus this strategy is diagonally layered down . I may create a separate script that alternates between diagonal-up and diagonal-down based off of overall trend, as in extended trend periods up this indicator may not flash as frequently. This can be visualized in a time series x timeframe chart as an "X" shape. Something to consider...
Let me know if you like this strategy. Feel free to alter the pyramiding entries, initial capital, and entry size, as well as commission regime. My strategies are designed to maximize average profit instead of flashing super frequently, as the fees will eat you up. Additionally, at the time of publication, all of my strategy scripts are intended to have profitable Sharpe and Sortino ratios.
Timeframes, RSI period, and oversold/overbought bounds are configurable.

Import Forex Volume from 5 biggest FX Brokers (single/combined) Some Brokers like Forex.com don't show Volume for FX. This indicator allows user to import Volume from a range of FX brokers that DO show volume
-Combine the reported volumes from all five brokers: FXCM, GLOBALPRIME, PEPPERSTONE, Currency.com, OANDA. Or pick a specific broker to import volume from.
-Image above shows combined Volume from the big 5 brokers, with added notes on the 2yr average of various broker's volumes; showing their size in descending order.
-Works across timeframes & FX pairs. Standard color formatting options Added.
//notes:
~default settings pull/combine volume from all 5 brokers. History goes back to Sept 2019 (due to GlobalPrime's later start date in publishing Volume data).
~~toggle ON 'only show FXCM, Pepperstone & Oanda' for a LONGER history, going back to June 2012.
~individual broker feeds: top checkbox toggled OFF, choose your preferred broker.
~~FXCM has both the longest history and the highest volume size of all the brokers.
~Table (toggle on/off) shows the broker feed (which broker(s) volume is on display) and the SMA 100 to give an idea of relative size.
//Cautionary note:
Volume is not as reliable in Forex as it is in Equities/commodities, due to unreported Inter-bank trades; the broker volumes do not give the full picture, but this is a best approximation of combined total volume based on brokers reported volume. The true volume will likely be much higher.
-Thank you @theEccentricTrader for the idea of pulling volume feed from other brokers.

support and resistance on multi timeframe [parsimaj] Description:
support and resistance and trendline on two timeframes by your choice
This indicator is capable of showing you the current and higher timeframe support and resistance by your strategy choice (two timeframes alongside each other). It also helps you to monitor the trend direction in short and long term by trend lines . You can change the depth of every levels and trend lines from the panel. Use this indicator in all markets because it follows the basic principles of levels but is unique in changing second timeframe by your choice.
_its smart , if the levels are too close together ,it will choose the deeper ones for you.
How it works:
By default, there is no higher timeframe and you can select your desire higher timeframe from the panel. Higher timelines will be displayed thicker and your current levels would be thin lines. (Levels that are higher than the current price will be red and those that are lower will be green). The number of levels to display is also by your choice, the default is 4 levels for each timeframe.
We have two types of trend lines , long terms as trend 1 (blue below and purple above trend line )- short term as trend 2(dashed ones).
Bouncing on levels and breaking trend line are the best triggers for entry and exit points.
Setting:
First, choose your higher timeframe then the depth of levels for each time (current and higher), The deeper it is, the more precise the lines. After that you can set the depth of trend lines by your choice. Trend 1 is the longer term So put it deeper and then set the short trend line (dashed ones) if you want to change it.
We have put the settings in the best mode, but you can also change it according to your strategy and inform us about the results.
This indicator has been obtained with hours of effort and codding , hope you enjoy
Period OpenA very simple indicator that displays the Open of the specified Timeframe
How to use this indicator?
1. Directional Bias
Bullish => Closing Price > Period Open
Bearish => Closing Price < Period Open
2. Support / Resistance
Each Period Open can be used as Support or Resistance
3. Take Profit Targets
Each Period Open can be used as targets for taking profit
