52SIGNAL RECIPE Market Structure Reversal Signals═══ 52SIGNAL RECIPE Market Structure Reversal Signals ═══
◆ Overview
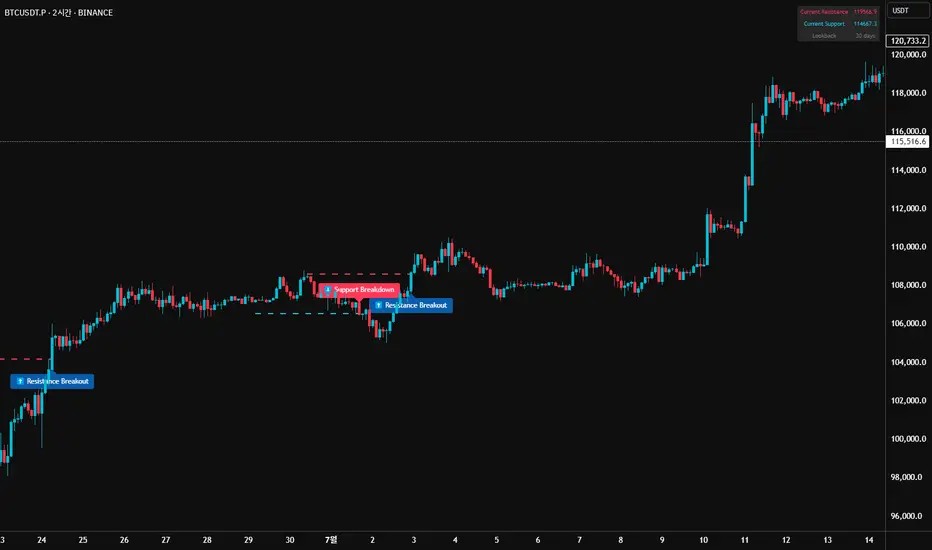
52SIGNAL RECIPE Market Structure Reversal Signals is a technical indicator designed to detect structural changes in price charts and identify potential trend reversals. By tracking highs and lows over a specified period, this indicator provides clear visual signals when significant price breakouts occur, helping traders capture directional changes in the market early.
─────────────────────────────────────
◆ Key Features
• Structural Reversal Detection: Provides potential trend change signals when price breaks through recent N-day highs/lows
• Duplicate Signal Prevention: Filters out consecutive signals in the same direction
• Intuitive Visualization: Clearly distinguishes bullish/bearish reversal signals by color and position on the chart
• Confirmed Bar Based: Generates signals only after bars are completely closed, enhancing reliability
• Customizable Settings: Adjustable tracking period to optimize for various market environments and timeframes
─────────────────────────────────────
◆ Technical Foundation
■ Market Structure Analysis Principle
• High/Low Tracking: Identifies previous highs (LH) and lows (HL) over the specified period
• Structural Breakout: Interprets as structural change when closing price breaks above previous high or below previous low
• Confirmed Bar Verification: Minimizes false signals by generating signals only after the current bar has completely closed
■ Signal Filtering Mechanism
• Signal State Tracking: Prevents duplicate signals by tracking the direction of the last generated signal
• Directional Change Focus: Suppresses signals in the same direction until an opposite signal occurs
• Noise Reduction: Focuses only on important level breakouts, eliminating unnecessary signals
─────────────────────────────────────
◆ Practical Applications
■ Trend Reversal Point Identification
• Bullish Trend Starting Point:
▶ When bullish reversal signal occurs after a downtrend
▶ When upward momentum is confirmed by breaking previous high
• Bearish Trend Starting Point:
▶ When bearish reversal signal occurs after an uptrend
▶ When downward momentum is confirmed by breaking below previous low
• Range Breakout Detection:
▶ Potential trend formation signals when breaking upper/lower boundaries in a ranging market
■ Trading Strategy Application
• Trend Following Strategy:
▶ Consider buy entry when bullish reversal signal occurs
▶ Consider sell entry when bearish reversal signal occurs
• Reversal Trading:
▶ Signals occurring at support/resistance levels provide high-probability entry points
▶ Reversal signals in overbought/oversold conditions strengthen trend reversal possibility
• Risk Management:
▶ Consider closing or reducing positions when opposite signals occur
▶ Set precise stop-loss points by combining with key technical levels
─────────────────────────────────────
◆ Advanced Setting Options
■ Tracking Period (N-day) Adjustment
• Short-term Setting: 10-15 days (sensitive signals, quick reaction, suitable for short-term trading)
• Medium-term Setting: 20-30 days (balanced signals, general trend detection, recommended default)
• Long-term Setting: 40-50 days (strong filtering, detects only major trend reversals, suitable for long-term investment)
■ Timeframe Optimization
• Daily Chart: 20-30 day setting (medium-term trend change detection)
• 4-Hour Chart: 30-40 setting (short-term swing trading signals)
• Hourly Chart: 40-50 setting (intraday trend change detection)
• Intraday Chart: 10-20 setting (scalping and short-term trading)
■ Market Type Adjustment
• High Volatility Markets: Higher N values (30-50) to filter noise
• Trending Markets: Medium N values (20-30) to capture only major reversals
• Ranging Markets: Lower N values (10-20) to capture range-bound movements
─────────────────────────────────────
◆ Synergy with Other Indicators
• Moving Averages: Signal strength enhanced when Market Structure Reversal Signals align with key moving average crossovers
• RSI: Market Structure Reversal Signals occurring at overbought/oversold levels increase reversal probability
• Volume Indicators: Market Structure Reversal Signals accompanied by high volume enhance reliability
• Fibonacci Levels: Market Structure Reversal Signals occurring at key Fibonacci levels provide important turning points
• Channel Indicators: Powerful breakout confirmation when price channel upper/lower breakthroughs coincide with Market Structure Reversal Signals
─────────────────────────────────────
◆ Conclusion
52SIGNAL RECIPE Market Structure Reversal Signals objectively identifies structural changes in the market and clearly visualizes potential trend reversal points. Its simple yet powerful approach of detecting directional changes through recent N-day high/low breakouts provides flexibility applicable to various market environments and trading styles. The duplicate signal prevention mechanism and confirmed bar-based signal generation greatly enhance signal quality and reliability. When combined with other technical indicators, synergy effects can be maximized, providing traders with a valuable tool to capture market turning points early.
─────────────────────────────────────
※ Disclaimer: Past performance does not guarantee future results. Always use appropriate risk management strategies.
═══ 52SIGNAL RECIPE Market Structure Reversal Signals ═══
◆ 개요
52SIGNAL RECIPE Market Structure Reversal Signals는 가격 차트의 구조적 변화를 감지하여 잠재적인 추세 반전을 식별하는 기술적 지표입니다. 이 지표는 최근 N일 동안의 고점과 저점을 추적하여 의미 있는 가격 돌파가 발생할 때 명확한 시각적 신호를 제공함으로써, 트레이더가 시장의 방향성 변화를 조기에 포착할 수 있도록 도와줍니다.
─────────────────────────────────────
◆ 주요 특징
• 구조적 반전 탐지: 가격이 최근 N일 고점/저점을 돌파할 때 잠재적 추세 변화 신호 제공
• 중복 신호 방지: 동일한 방향의 신호가 연속으로 반복되지 않도록 필터링
• 직관적인 시각화: 상승/하락 반전 신호를 차트 상에서 색상과 위치로 명확히 구분
• 확정 봉 기반: 봉이 완전히 종료된 후에만 신호 생성하여 신뢰도 향상
• 사용자 정의 설정: 추적 기간을 조정하여 다양한 시장 환경과 타임프레임에 최적화 가능
─────────────────────────────────────
◆ 기술적 기반
■ 시장 구조 분석 원리
• 고점/저점 추적: 지정된 기간 동안의 이전 고점(LH)과 저점(HL) 식별
• 구조적 돌파: 종가가 이전 고점을 상향 돌파하거나 이전 저점을 하향 돌파할 때 구조적 변화로 해석
• 확정 봉 검증: 현재 봉이 완전히 종료된 후에만 신호 생성하여 오신호 최소화
■ 신호 필터링 메커니즘
• 신호 상태 저장: 마지막 생성된 신호의 방향을 추적하여 동일 방향 신호 중복 방지
• 방향성 전환 초점: 반대 방향 신호가 발생할 때까지 동일 방향 신호 억제
• 노이즈 감소: 중요 수준 돌파에만 집중하여 불필요한 신호 제거
─────────────────────────────────────
◆ 실용적 응용
■ 추세 전환점 식별
• 상승 추세 시작점:
▶ 하락 추세 후 상승 반전 신호 발생 시
▶ 이전 고점 돌파로 상승 모멘텀 확인 시
• 하락 추세 시작점:
▶ 상승 추세 후 하락 반전 신호 발생 시
▶ 이전 저점 이탈로 하락 모멘텀 확인 시
• 범위 돌파 감지:
▶ 횡보 시장에서 상/하 경계 돌파 시 잠재적 추세 형성 신호
■ 트레이딩 전략 적용
• 추세 추종 전략:
▶ 상승 반전 신호 발생 시 매수 진입 고려
▶ 하락 반전 신호 발생 시 매도 진입 고려
• 반전 트레이딩:
▶ 지지/저항 수준에서 반전 신호 발생 시 높은 확률의 진입점 제공
▶ 과매수/과매도 상태에서의 반전 신호는 추세 전환 가능성 강화
• 리스크 관리:
▶ 반대 방향 신호 발생 시 포지션 종료 또는 축소 고려
▶ 주요 기술적 수준과 결합하여 정밀한 손절점 설정 가능
─────────────────────────────────────
◆ 고급 설정 옵션
■ 추적 기간(N일) 조정
• 단기 설정: 10-15일 (민감한 신호, 빠른 반응, 단기 트레이딩에 적합)
• 중기 설정: 20-30일 (균형 잡힌 신호, 일반적 추세 감지, 기본 권장)
• 장기 설정: 40-50일 (강한 필터링, 주요 추세 전환만 감지, 장기 투자에 적합)
■ 타임프레임별 최적화
• 일봉 차트: 20-30일 설정 (중기 추세 변화 감지)
• 4시간 차트: 30-40 설정 (단기 스윙 트레이딩 신호)
• 시간봉 차트: 40-50 설정 (일중 추세 변화 감지)
• 일중 차트: 10-20 설정 (스캘핑 및 단기 거래)
■ 시장 유형별 조정
• 변동성 높은 시장: 높은 N값 (30-50) 설정으로 노이즈 필터링
• 추세 시장: 중간 N값 (20-30) 설정으로 주요 반전만 포착
• 횡보 시장: 낮은 N값 (10-20) 설정으로 범위 내 움직임 포착
─────────────────────────────────────
◆ 다른 지표와의 시너지
• 이동평균선: Market Structure Reversal Signals 신호와 주요 이동평균선 교차 지점이 일치할 때 신호 강화
• RSI: 과매수/과매도 수준에서의 Market Structure Reversal Signals 신호는 반전 가능성 높임
• 볼륨 지표: 높은 볼륨과 함께 발생하는 Market Structure Reversal Signals 신호는 신뢰도 향상
• 피보나치 레벨: 주요 피보나치 레벨에서 발생하는 Market Structure Reversal Signals 신호는 중요한 전환점 제공
• 채널 지표: 가격 채널의 상단/하단 돌파와 Market Structure Reversal Signals 신호 일치 시 강력한 돌파 확인
─────────────────────────────────────
◆ 결론
52SIGNAL RECIPE Market Structure Reversal Signals는 시장의 구조적 변화를 객관적으로 식별하여 잠재적인 추세 전환점을 명확하게 시각화합니다. 최근 N일 고점/저점 돌파를 통해 방향성 변화를 감지하는 단순하면서도 강력한 접근 방식은 다양한 시장 환경과 트레이딩 스타일에 적용할 수 있는 유연성을 제공합니다. 중복 신호 방지 메커니즘과 확정 봉 기반 신호 생성은 신호의 품질과 신뢰성을 크게 향상시킵니다. 다른 기술적 지표와 결합하여 사용할 때 시너지 효과를 극대화할 수 있으며, 트레이더에게 시장의 전환점을 조기에 포착할 수 있는 귀중한 도구를 제공합니다.
─────────────────────────────────────
※ 면책 조항: 과거 성과가 미래 결과를 보장하지 않습니다. 항상 적절한 리스크 관리 전략을 사용하세요.
Supportandresitance
Active PMI Support/Resistance Levels [EdgeTerminal]The PMI Support & Resistance indicator revolutionizes traditional technical analysis by using Pointwise Mutual Information (PMI) - a statistical measure from information theory - to objectively identify support and resistance levels. Unlike conventional methods that rely on visual pattern recognition, this indicator provides mathematically rigorous, quantifiable evidence of price levels where significant market activity occurs.
- The Mathematical Foundation: Pointwise Mutual Information
Pointwise Mutual Information measures how much more likely two events are to occur together compared to if they were statistically independent. In our context:
Event A: Volume spikes occurring (high trading activity)
Event B: Price being at specific levels
The PMI formula calculates: PMI = log(P(A,B) / (P(A) × P(B)))
Where:
P(A,B) = Probability of volume spikes occurring at specific price levels
P(A) = Probability of volume spikes occurring anywhere
P(B) = Probability of price being at specific levels
High PMI scores indicate that volume spikes and certain price levels co-occur much more frequently than random chance would predict, revealing genuine support and resistance zones.
- Why PMI Outperforms Traditional Methods
Subjective interpretation: What one trader sees as significant, another might ignore
Confirmation bias: Tendency to see patterns that confirm existing beliefs
Inconsistent criteria: No standardized definition of "significant" volume or price action
Static analysis: Doesn't adapt to changing market conditions
No strength measurement: Can't quantify how "strong" a level truly is
PMI Advantages:
✅ Objective & Quantifiable: Mathematical proof of significance, not visual guesswork
✅ Statistical Rigor: Levels backed by information theory and probability
✅ Strength Scoring: PMI scores rank levels by statistical significance
✅ Adaptive: Automatically adjusts to different market volatility regimes
✅ Eliminates Bias: Computer-calculated, removing human interpretation errors
✅ Market Structure Aware: Reveals the underlying order flow concentrations
- How It Works
Data Processing Pipeline:
Volume Analysis: Identifies volume spikes using configurable thresholds
Price Binning: Divides price range into discrete levels for analysis
Co-occurrence Calculation: Measures how often volume spikes happen at each price level
PMI Computation: Calculates statistical significance for each price level
Level Filtering: Shows only levels exceeding minimum PMI thresholds
Dynamic Updates: Refreshes levels periodically while maintaining historical traces
Visual System:
Current Levels: Bright, thick lines with PMI scores - your actionable levels
Historical Traces: Faded previous levels showing market structure evolution
Strength Tiers: Line styles indicate PMI strength (solid/dashed/dotted)
Color Coding: Green for support, red for resistance
Info Table: Real-time display of strongest levels with scores
- Indicator Settings:
Core Parameters
Lookback Period (Default: 200)
Lower (50-100): More responsive to recent price action, catches short-term levels
Higher (300-500): Focuses on major historical levels, more stable but less responsive
Best for: Day trading (100-150), Swing trading (200-300), Position trading (400-500)
Volume Spike Threshold (Default: 1.5)
Lower (1.2-1.4): More sensitive, catches smaller volume increases, more levels detected
Higher (2.0-3.0): Only major volume surges count, fewer but stronger signals
Market dependent: High-volume stocks may need higher thresholds (2.0+), low-volume stocks lower (1.2-1.3)
Price Bins (Default: 50)
Lower (20-30): Broader price zones, less precise but captures wider areas
Higher (70-100): More granular levels, precise but may be overly specific
Volatility dependent: High volatility assets benefit from more bins (70+)
Minimum PMI Score (Default: 0.5)
Lower (0.2-0.4): Shows more levels including weaker ones, comprehensive view
Higher (1.0-2.0): Only statistically strong levels, cleaner chart
Progressive filtering: Start with 0.5, increase if too cluttered
Max Levels to Show (Default: 8)
Fewer (3-5): Clean chart focusing on strongest levels only
More (10-15): Comprehensive view but may clutter chart
Strategy dependent: Scalpers prefer fewer (3-5), swing traders more (8-12)
Historical Tracking Settings
Update Frequency (Default: 20 bars)
Lower (5-10): More frequent updates, captures rapid market changes
Higher (50-100): Less frequent updates, focuses on major structural shifts
Timeframe scaling: 1-minute charts need lower frequency (5-10), daily charts higher (50+)
Show Historical Levels (Default: True)
Enables the "breadcrumb trail" effect showing evolution of support/resistance
Disable for cleaner charts focusing only on current levels
Max Historical Marks (Default: 50)
Lower (20-30): Less memory usage, shorter history
Higher (100-200): Longer historical context but more resource intensive
Fade Strength (Default: 0.8)
Lower (0.5-0.6): Historical levels more visible
Higher (0.9-0.95): Historical levels very subtle
Visual Settings
Support/Resistance Colors: Choose colors that contrast well with your chart theme Line Width: Thicker lines (3-4) for better visibility on busy charts Show PMI Scores: Toggle labels showing statistical strength Label Size: Adjust based on screen resolution and chart zoom level
- Most Effective Usage Strategies
For Day Trading:
Setup: Lookback 100-150, Volume Threshold 1.8-2.2, Update Frequency 10-15
Use PMI levels as bounce/rejection points for scalp entries
Higher PMI scores (>1.5) offer better probability setups
Watch for volume spike confirmations at levels
For Swing Trading:
Setup: Lookback 200-300, Volume Threshold 1.5-2.0, Update Frequency 20-30
Enter on pullbacks to high PMI support levels
Target next resistance level with PMI score >1.0
Hold through minor levels, exit at major PMI levels
For Position Trading:
Setup: Lookback 400-500, Volume Threshold 2.0+, Update Frequency 50+
Focus on PMI scores >2.0 for major structural levels
Use for portfolio entry/exit decisions
Combine with fundamental analysis for timing
- Trading Applications:
Entry Strategies:
PMI Bounce Trades
Price approaches high PMI support level (>1.0)
Wait for volume spike confirmation (orange triangles)
Enter long on bullish price action at the level
Stop loss just below the PMI level
Target: Next PMI resistance level
PMI Breakout Trades
Price consolidates near high PMI level
Volume increases (watch for orange triangles)
Enter on decisive break with volume
Previous resistance becomes new support
Target: Next major PMI level
PMI Rejection Trades
Price approaches PMI resistance with momentum
Watch for rejection signals and volume spikes
Enter short on failure to break through
Stop above the PMI level
Target: Next PMI support level
Risk Management:
Stop Loss Placement
Place stops 0.1-0.5% beyond PMI levels (adjust for volatility)
Higher PMI scores warrant tighter stops
Use ATR-based stops for volatile assets
Position Sizing
Larger positions at PMI levels >2.0 (highest conviction)
Smaller positions at PMI levels 0.5-1.0 (lower conviction)
Scale out at multiple PMI targets
- Key Warning Signs & What to Watch For
Red Flags:
🚨 Very Low PMI Scores (<0.3): Weak statistical significance, avoid trading
🚨 No Volume Confirmation: PMI level without recent volume spikes may be stale
🚨 Overcrowded Levels: Too many levels close together suggests poor parameter tuning
🚨 Outdated Levels: Historical traces are reference only, not tradeable
Optimization Tips:
✅ Regular Recalibration: Adjust parameters monthly based on market regime changes
✅ Volume Context: Always check for recent volume activity at PMI levels
✅ Multiple Timeframes: Confirm PMI levels across different timeframes
✅ Market Conditions: Higher thresholds during high volatility periods
Interpreting PMI Scores
PMI Score Ranges:
0.5-1.0: Moderate statistical significance, proceed with caution
1.0-1.5: Good significance, reliable for most trading strategies
1.5-2.0: Strong significance, high-confidence trade setups
2.0+: Very strong significance, institutional-grade levels
Historical Context: The historical trace system shows how support and resistance evolve over time. When current levels align with multiple historical traces, it indicates persistent market memory at those prices, significantly increasing the level's reliability.

Non-Lagging Longevity Zones [BigBeluga]🔵 OVERVIEW
A clean, non-lagging system for identifying price zones that persist over time—ranking them visually based on how long they survive without being invalidated.
Non-Lagging Longevity Zones uses non-lagging pivots to automatically build upper and lower zones that reflect key resistance and support. These zones are kept alive as long as price respects them and are instantly removed when invalidated. The indicator assigns a unique lifespan label to each zone in Days (D), Months (M), or Years (Y), providing instant context for historical relevance.
🔵 CONCEPTS
Non-Lag Pivot Detection: Detects upper and lower pivots using non-lagging swing identification (highest/lowest over length period).
h = ta.highest(len)
l = ta.lowest(len)
high_pivot = high == h and high < h
low_pivot = low == l and low > l
Longevity Ranking: Zones are preserved as long as price doesn't breach them. Levels that remain intact grow in visual intensity.
Time-Based Weighting: Each zone is labeled with its lifespan in days , emphasizing how long it has survived.
duration = last_bar_index - start
days_ = int(duration*(timeframe.in_seconds("")/60/60/24))
days = days_ >= 365 ? int(days_ / 365) : days_ >= 30 ? int(days_ / 30) : days_
marker = days_ >= 365 ? " Y" : days_ >= 30 ? " M" : " D"
Dynamic Coloring: Older zones are drawn with stronger fill, while newer ones appear fainter—making it easy to assess significance.
Self-Cleaning Logic: If price invalidates a zone, it’s instantly removed, keeping the chart clean and focused.
🔵 FEATURES
Upper and Lower Zones: Auto-detects valid high/low pivots and plots horizontal zones with ATR-based thickness.
Real-Time Validation: Zones are extended only if price stays outside them—giving precise control zones.
Gradient Fill Intensity: The longer a level survives, the more opaque the fill becomes.
Duration-Based Labeling: Time alive is shown at the root of each zone:
• D – short-term zones
• M – medium-term structure
• Y – long-term legacy levels
Smart Zone Clearing: Zones are deleted automatically once invalidated by price, keeping the display accurate.
Efficient Memory Handling: Keeps only the 10 most recent valid levels per side for optimal performance.
🔵 HOW TO USE
Track durable S/R zones that survived price tests without being breached.
Use longer-lived zones as high-confidence confluence areas for entries or targets.
Observe fill intensity to judge structural importance at a glance .
Layer with volume or momentum tools to confirm bounce or breakout probability.
Ideal for swing traders, structure-based traders, or macro analysis.
🔵 CONCLUSION
Non-Lagging Longevity Zones lets the market speak for itself—by spotlighting levels with proven survival over time. Whether you're trading trend continuation, mean reversion, or structure-based reversals, this tool equips you with an immediate read on what price zones truly matter—and how long they've stood the test of time.

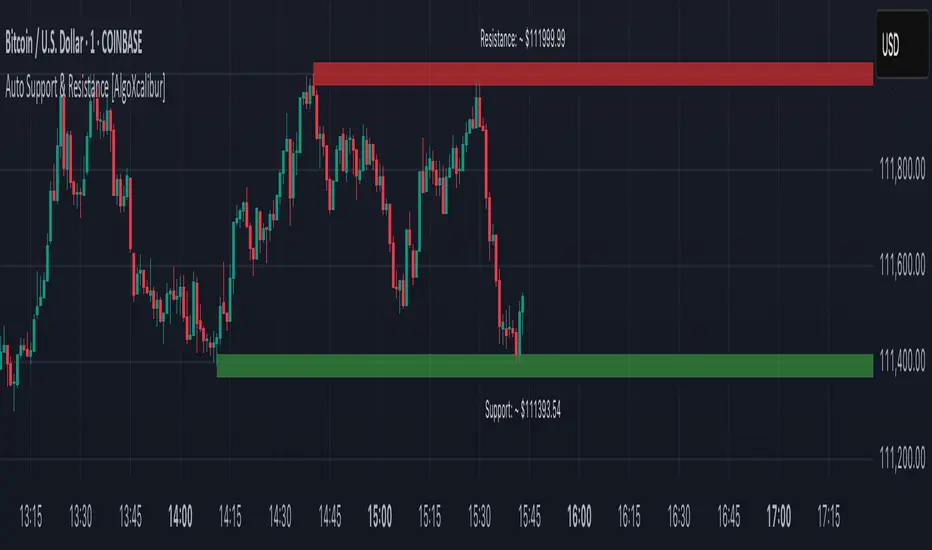
Auto Support & Resistance [AlgoXcalibur]Instantly visualize support and resistance levels with adaptive breakout prediction and zero chart clutter.
Combining reliable pivot level detection, relative volume, and price action confirmation, this tool delivers intelligent S/R zones that adapt to current market conditions. Whether you’re trading breakouts, navigating ranges, or using key levels to manage profits and risk — this indicator automatically identifies important levels for you, reducing your workload so you can better focus on your trades and decision-making.
🧠 Algorithm Logic
This ultra-refined Auto Support & Resistance indicator does more than just display reliable support and resistance levels — it applies a minimalist approach to display only the most relevant and actionable zones, while dynamically tracking their structural integrity in real time. The algorithm features unique Breakout Probability Detection — automatically switching lines from solid to dashed when volume and price action suggest a high probability that a breakout will occur. If a level is broken, the next relevant support or resistance level is immediately displayed on the chart, keeping the levels current and actionable so you do not miss critical insight. Optional Price Labels display the price of each level — practical if using these areas for setting take-profits or stop-losses. This algorithm keeps Support & Resistance what they are supposed to be — simple and useful — effortlessly providing a clean, adaptive view of evolving market structure.
⚙️ User-Selectable Features
• Breakout Probability Detection: When enabled, lines automatically switch from solid to dashed when volume and price action suggest a high breakout probability.
• Price Labels: When enabled, price labels display the price of the S/R for practical reference.
📊 Minimalistic Sophistication
Most automated support and resistance tools clutter the chart with dozens of static levels that do not react to price action. This tool displays only the single most relevant support and resistance level at a time, continuously monitoring for breaks and automatically updating when a level is invalidated. With breakout detection built in, it offers a modern, intuitive way to track structural integrity. This tool is designed to prioritize accuracy, adaptability, and visual simplicity — delivering a smart and refined tool for automatically identifying key levels with confidence.
🔐 To get access or learn more, visit the Author’s Instructions section.
Auto Trendlines [AlgoXcalibur]Effortlessly visualize trendlines.
This algorithm does more than just draw lines connecting structural swing points — it reveals dynamic support & resistance breakouts with clarity and precision while significantly reducing your workload compared to the hassle of manually drawing trendlines.
🧠 Algorithm Logic
This advanced Auto Trendlines indicator delivers clear market structure through an intelligent multi-fractal design, revealing useful swing structures in real time. For those seeking maximum awareness, the optional Micro Trendlines (Dotted) constantly monitors even the most recent and minor structural shifts — keeping you fully in tune with evolving market dynamics. A Break Detection Engine constantly monitors each trendline and provides instant visual feedback when structural integrity is lost: broken lines turn gray, stop extending, and remain visible to enhance clarity and situational awareness. The algorithm is carefully refined to prevent chart distortion commonly caused by forcing entire trendline structures into view — preserving a natural and accurate charting experience. To further ensure optimal readability, an integrated Clutter Control mechanism limits the number of visible trendlines — focusing attention only on the most relevant structures.
⚙️ User-Selectable Features
• Micro Trendlines (Dotted): Ultra-responsive short-term trendlines that react to even the smallest structural shifts — ideal for staying ahead of early trend changes.
• Broken Trendline Declutter: Enable to display only the most recent broken trendlines to simplify chart visuals and maintain clarity, or disable to analyze previous price action.
💡 Modern Innovation
Auto Trendline indicators are often inaccurate, clumsy, and rely on slow methods that fail to adapt. AlgoXcalibur’s Auto Trendline indicator takes a modern, refined approach — combining smart pivot logic for both speed and stability, dynamic break detection with clear visual cues, and displaying only the most relevant trendlines while prioritizing accuracy, preventing distortion, and reducing clutter — automatically.
🔐 To get access or learn more, visit the Author’s Instructions section.

Volumatic Support/Resistance Levels [BigBeluga]🔵 OVERVIEW
A smart volume-powered tool for identifying key support and resistance zones—enhanced with real-time volume histogram fills and high-volume markers.
Volumatic Support/Resistance Levels detects structural levels from swing highs and lows, and wraps them in dynamic histograms that reflect the relative volume strength around those zones. It highlights the strongest price levels not just by structure—but by the weight of market participation.
🔵 CONCEPTS
Price Zones: Support and resistance levels are drawn from recent price pivots, while volume is used to visually enhance these zones with filled histograms and highlight moments of peak activity using markers.
Histogram Fill = Activity Zone: The width and intensity of each filled zone adjusts to recent volume bursts.
High-Volume Alerts: Circle markers highlight moments of volume dominance directly on the levels—revealing pressure points of support/resistance.
Clean Visual Encoding: Red = resistance zones, green = support zones, orange = high-volume bars.
🔵 FEATURES
Detects pivot-based resistance (highs) and support (lows) using a customizable range length.
Wraps these levels in volume-weighted bands that expand/contract based on percentile volume.
Color fill intensity increases with rising volume pressure, creating a live histogram feel.
When volume > user-defined threshold , the indicator adds circle markers at the top and bottom of that price level zone.
Bar coloring highlights the candles that generated this high-volume behavior (orange by default).
Adjustable settings for all thresholds and colors, so traders can dial in volume sensitivity.
🔵 HOW TO USE
Identify volume-confirmed resistance and support zones for potential reversal or breakout setups.
Focus on levels with intense histogram fill and circle markers —they indicate strong participation.
Use bar coloring to track when key activity started and align it with broader market context.
Works well in combination with order blocks, trend indicators, or liquidity zones.
Ideal for day traders, scalpers, and volume-sensitive setups.
🔵 CONCLUSION
Volumatic Support/Resistance Levels elevates traditional support and resistance logic by anchoring it in volume context. Instead of relying solely on price action, it gives traders insight into where real conviction lies—by mapping how aggressively the market defended or rejected key levels. It's a visual, reactive, and volume-conscious upgrade to your structural toolkit.

Future is hereOverview
"Future is Here" is an original, multi-faceted Pine Script indicator designed to provide traders with a comprehensive toolset for identifying high-probability trading opportunities. By integrating volatility-based entry zones, trend-based price targets, momentum confirmation, dynamic support/resistance levels, and risk-reward ratio (RRR) calculations, this indicator offers a cohesive and actionable trading framework. Each feature is carefully designed to complement the others, ensuring a synergistic approach that enhances decision-making across various market conditions. This script is unique in its ability to combine these elements into a single, streamlined interface with clear visual cues and customizable alerts, making it suitable for both novice and experienced traders.
Key Features and How They Work Together
Volatility-Based Entry Zones
Purpose: Identifies overbought and oversold conditions using a volatility-adjusted moving average, helping traders spot potential reversal zones.
Mechanism: Utilizes a user-defined volatility length and multiplier to calculate dynamic overbought/oversold thresholds based on the standard deviation of price. Crossovers and crossunders of these levels trigger "Buy Zone" or "Sell Zone" labels.
Synergy: These zones act as the foundation for entry signals, which are later confirmed by momentum and trend filters to reduce false signals.
Trend-Based Price Targets
Purpose: Projects potential price targets based on the prevailing trend, giving traders clear objectives for profit-taking.
Mechanism: Combines a fast and slow moving average to determine trend direction, then calculates target prices using a multiplier of the price deviation from the slow MA. Labels display bullish or bearish targets when the fast MA crosses the slow MA.
Synergy: Works in tandem with entry zones and momentum signals to align targets with market conditions, ensuring traders aim for realistic price levels supported by trend strength.
Momentum Confirmation
Purpose: Validates entry signals by assessing momentum strength, filtering out weak setups.
Mechanism: Uses the momentum indicator to detect bullish or bearish momentum crossovers, labeling them as "Strong" or "Weak" based on a comparison with a smoothed momentum average.
Synergy: Enhances the reliability of buy/sell signals by ensuring momentum aligns with volatility zones and trend direction, reducing the risk of premature entries.
Dynamic Support/Resistance Levels
Purpose: Highlights key price levels where the market is likely to react, aiding in trade planning and risk management.
Mechanism: Detects pivot highs and lows over a user-defined lookback period, drawing horizontal lines for the most recent support and resistance levels (limited to two each for clarity). Labels mark these levels with price values.
Synergy: Complements entry zones and price targets by providing context for potential reversal or continuation points, helping traders set logical stop-losses or take-profits.
Buy/Sell Signals with Risk-Reward Ratios
Purpose: Generates precise buy/sell signals with integrated take-profit (TP), stop-loss (SL), and RRR calculations for disciplined trading.
Mechanism: Combines volatility zone crossovers, trend confirmation, and positive momentum to trigger signals. ATR-based TP and SL levels are calculated, and the RRR is displayed in labels for quick assessment.
Synergy: This feature ties together all previous components, ensuring signals are only generated when volatility, trend, and momentum align, while providing clear risk-reward metrics for trade evaluation.
Customizable Alerts
Purpose: Enables traders to stay informed of trading opportunities without constant chart monitoring.
Mechanism: Alert conditions are set for buy and sell signals, delivering notifications with the entry price for seamless integration into trading workflows.
Synergy: Enhances usability by allowing traders to act on high-probability setups identified by the indicator’s combined logic.
Originality
"Future is Here" is an original creation that distinguishes itself through its holistic approach to technical analysis. Unlike single-purpose indicators, it integrates volatility, trend, momentum, and support/resistance into a unified system, reducing the need for multiple scripts. The inclusion of RRR calculations directly in signal labels is a unique feature that empowers traders to evaluate trade quality instantly. The script’s design emphasizes clarity and efficiency, with cooldowns to prevent label clutter and a limit on support/resistance lines to maintain chart readability. This combination of features, along with its customizable parameters, makes it a versatile and novel tool for traders seeking a robust, all-in-one solution.
How to Use
Setup: Add the indicator to your TradingView chart and adjust input parameters (e.g., Volatility Length, Trend Length, TP/SL Multipliers) to suit your trading style and timeframe.
Interpretation:
Look for "Buy Zone" or "Sell Zone" labels to identify potential entry points.
Confirm entries with "Bull Mom" or "Bear Mom" labels and trend direction (Bull/Bear Target labels).
Use Support/Resistance lines to set logical TP/SL levels or anticipate reversals.
Evaluate Buy/Sell signals with TP, SL, and RRR for high-probability trades.
Alerts: Set up alerts for Buy/Sell signals to receive real-time notifications.
Customization: Fine-tune multipliers and lengths to adapt the indicator to different markets (e.g., stocks, forex, crypto) or timeframes.

Super MTF Clouds (4x3 Pairs)Overview:
This script is based on Ripster's MTF clouds, which transcends the standard moving average cloud indicator by offering a powerful and deeply customizable Multi-Timeframe (MTF) analysis. Instead of being limited to the moving averages of your current charts from the current timeframe, this tool allows you to project and visualize the trend and key support/resistance zones from up to 4 different timeframes simultaneously. User can input up to 6 different EMA values which will form 3 pairs of EMA clouds, for each of the timeframes.
The primary purpose is to provide traders with immediate confluence. By observing how price interacts with moving average clouds from higher timeframes (e.g., Hourly, Daily, Weekly), you can make more informed decisions on your active trading timeframe (e.g., 10 Minute). It's designed as a complete MTF Cloud toolkit, allowing you to display all necessary MTFs in a single script to build a comprehensive view of the market structure without having to flick to different timeframe to look for cloud positions.
Key features:
Four Independent Multi-Timeframe Slots: Each slot can be assigned any timeframe available on TradingView (e.g., D, W, M, 4H).
Three MA Pairs Per Timeframe: For each timeframe, configure up to three separate MA clouds (e.g., a 9/12 EMA pair, a 20/50 EMA pair, and a 100/200 SMA pair).
Complete Customisation: For every single moving average (24 in total), you can independently control:
MA Type: Choose between EMA or SMA.
Length: Any period you require.
Line Color: Full colour selection.
Line Thickness: Adjust the visual weight of each line.
Cloud Control: For every pair (12 in total), you can set the fill colour and transparency.
How To Use This Script:
This tool is best used for confirmation and context. Here are some practical strategies that one can adopt:
Trend Confluence: Before taking a trade based on a signal on your current timeframe, glance at the higher timeframe clouds. If you see a buy signal on the 15-minute chart and the price is currently trading above a thick, bullish Daily cloud, the probability of that trade succeeding is significantly higher. Conversely, shorting into strong HTF support is a low-probability trade.
Dynamic Support & Resistance: The edges of the higher timeframe clouds often act as powerful, dynamic levels of support and resistance. A pullback to the 4-Hour 50 EMA on your 15-minute chart can be a prime area to look for entries in the direction of the larger trend.
Gauging Market Regimes: Use the toggles in the settings to quickly switch between different views. You can have a "risk-on" view with short-term clouds and a "macro" view with weekly and monthly clouds. This helps you adapt your trading style to the current market conditions.
Key Settings:
1. Global Setting
Source For All MAs: This determines the price data point used for every single moving average calculation.
Default: hl2 (an average of the High and Low of each bar). This gives a smooth midpoint price.
Options: You can change this to Close (the most common method), Open, High, Low, or ohlc4 (an average of the open, high, low, and close), among others.
Recommendation: For most standard trend analysis, the default hl2 is the common choice.
2. The Timeframe Group Structure
The rest of the settings are organized into four identical, collapsible groups: "Timeframe 1 Settings" through "Timeframe 4 Settings". Each group acts as a self-contained control panel for one multi-timeframe view.
Within each timeframe group, you have two master controls:
Enable Timeframe: This is the main power switch for the entire group. Uncheck this box to instantly hide all three clouds and lines associated with this timeframe. This is perfect for quickly decluttering your chart or focusing on a different set of analyses.
Timeframe: This dropdown menu is the heart of the MTF feature. Here, you select the higher timeframe you want to analyse (e.g., 1D for Daily, 1W for Weekly, 4H for 4-Hour). All calculations for the three pairs within this group will be based on the timeframe you select here.
3. Pair-Specific Controls
Inside each timeframe group, there are three sections for "Pair 1", "Pair 2", and "Pair 3". These control each individual moving average cloud.
Enable Pair: Just like the master switch for the timeframe, this checkbox turns a single cloud and its two MA lines on or off.
For each pair, the settings are further broken down:
Moving Average Lines (A and B): These two rows control the two moving averages that form the cloud. 'A' is typically used for the shorter-period MA and 'B' for the longer-period one.
Type (A/B): A dropdown menu to select either EMA (Exponential Moving Average) or SMA (Simple Moving Average). EMAs react more quickly to recent price changes, while SMAs are smoother and react more slowly.
Length (A/B): The lookback period for the moving average (e.g., 21, 50, 200).
Color (A/B): Sets the specific colour of the MA line itself on your chart.
Cloud Fill Settings
Fill Color: This controls the colour of the shaded area (the "cloud") between the two moving average lines. For a consistent look, you can set this to the same colour as your shorter MA line.
Transparency: Controls how see-through the cloud is, on a scale of 0 to 100. 0 is a solid, opaque colour, while 100 is completely invisible. The default of 85 provides a light, "cloud-like" appearance that doesn't obscure the price action.
----------------------------------------------------------------------
If anything is not clear please let me know!

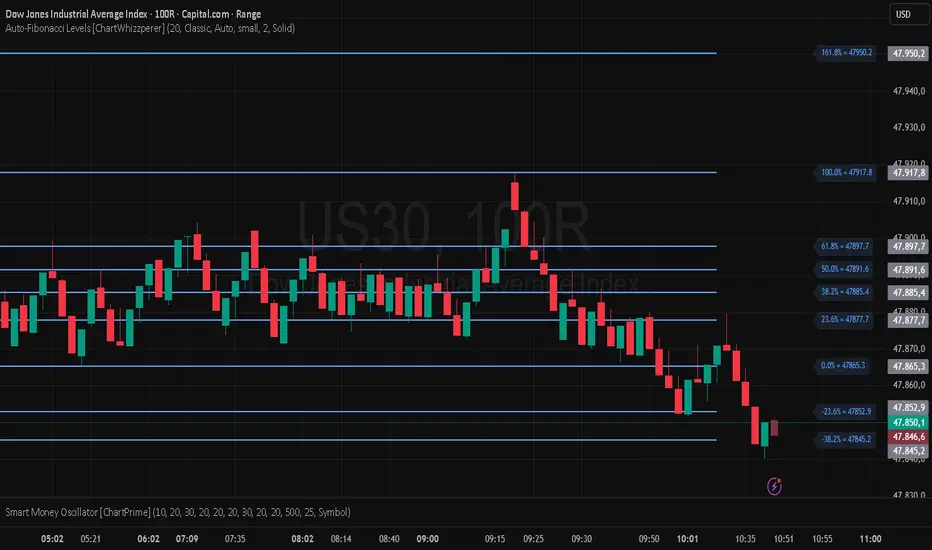
Auto-Fibonacci Levels [ChartWhizzperer]Auto-Fibonacci Levels
Discover one of the most elegant and flexible Fibonacci indicators for TradingView – fully automatic, tastefully understated, and built entirely in Pine Script V6.
Key Features:
- Automatically detects the most recent swing high and swing low.
- Plots Fibonacci retracement levels and extensions (including 161.8%, 261.8%) perfectly aligned
to the prevailing trend.
- Distinctive, dashed lines with crystal-clear price labels right at the price scale
for maximum clarity.
- Line length and label offset are fully customisable for your charting preference.
- Absolutely no repainting: Only confirmed swings are used for reliable signals.
- Parameter: "Swing Detection Length"
The “Swing Detection Length” parameter determines how many bars must appear to the left and right of a potential high or low for it to be recognised as a significant swing point.
- Higher values make the script less sensitive (only major turning points are detected).
- Lower values make it more responsive to minor fluctuations (more fibs, more signals).
For best results, adjust this setting according to your preferred timeframe and trading style.
Pro Tip:
Fibonacci levels refresh automatically whenever a new swing is confirmed.
Ideal for price action enthusiasts and Fibonacci purists alike.
Licence:
// Licence: CC BY-NC-SA 4.0 – Non-commercial use only, attribution required.
// © ChartWhizzperer
HMA Swing Levels [BigBeluga]An advanced swing structure and trend-following tool built on Hull Moving Average logic, designed to detect major reversals and track dynamic support/resistance zones.
This indicator analyzes price swings using pivot highs/lows and a smoothed HMA trend baseline. It highlights key reversal levels and keeps them active until breached, giving traders a clear visual framework for price structure and trend alignment. The pivots are calculated in real-time using non-lagging logic, making them highly responsive to market conditions.
🔵 CONCEPTS
Combines a fast-reacting Hull Moving Average (HMA) with pivot logic to capture precise directional changes.
Detects non-lagging reversal highs and lows when pivot points form and the HMA direction flips.
Projects these reversal levels forward as horizontal support/resistance lines until broken by price.
Active trend is shown with a step-style trail line that reflects HMA bias over time.
🔵 FEATURES
Swing Level Detection:
Identifies high/low reversals when trend direction changes and plots horizontal zones.
Non-lagging logic of swing points detection:
if h == high and high < h and change > 0
// Detected Swing High
if l == low and low > l and change < 0
// Detected Swing Low
Persistent Support & Resistance Lines:
Each detected swing high or low is extended forward until price invalidates the level. Dotted style is applied once breached.
Color-Coded Trend Trail:
Displays a stepped trend trail using HMA slope: lime = uptrend, blue = downtrend.
Automatic Labeling:
Each reversal level is labeled with its price for clear reference.
Age-Based Line Thickness:
Every level increases in thickness every 250 bars. The longer the level lasts, the stronger it is.
🔵 HOW TO USE
Use green (support) and blue (resistance) levels to frame key reaction zones.
Trade with the trend defined by the trail color: lime for bullish bias, blue for bearish.
Explore where buy or sell orders are stacked
Look for breaks of swing lines to anticipate trend shifts or breakout setups.
Adjust the "Trend Change" input to tune the sensitivity of swing detection.
Adjust the "SwingLevels" input to define how far back to search for valid pivots.
🔵 CONCLUSION
HMA Swing Levels offers a hybrid approach to structural and trend-based trading. With automated non-lagging swing detection, persistent support/resistance tracking, and intuitive HMA-based trend coloring, it provides a powerful visual system for discretionary and systematic traders alike.

Session Range ProjectionsSession Range Projections
Purpose & Concept:
Session Range Projections is a comprehensive trading tool that identifies and analyzes price ranges during user-defined time periods. The indicator visualizes high-probability reversal zones and profit targets by projecting Fibonacci levels from custom session ranges, making it ideal for traders who focus on time-based market structure analysis.
Key Features & Calculations:
1. Custom Time Range Analysis
- Define any time period for range calculation - from traditional sessions (Asian, London, NY) to custom periods like opening ranges, hourly ranges, or 4-hour blocks
- Automatically captures the highest and lowest prices within your specified timeframe
- Supports multiple timezone selections for global market analysis
- Flexible enough for intraday scalping ranges or longer-term swing trading setups
2. Premium & Discount Zones
- Automatically divides the range into premium (above 50%) and discount (below 50%) zones
- Visual differentiation helps identify institutional buying and selling areas
- Color-coded boxes clearly mark these critical price zones
3. Optimal Trade Entry (OTE) Zones
- Highlights the 79-89% retracement zone in premium territory
- Highlights the 11-21% retracement zone in discount territory
- These zones represent high-probability reversal areas based on institutional order flow concepts
4. Fibonacci Projections
- Projects 11 customizable Fibonacci extension levels from the range extremes
- Levels extend both above and below the range for symmetrical analysis
- Each level can be individually toggled and color-customized
- Default levels include common retracement ratios: -0.5, -1.0, -2.0, -2.33, -2.5, -3.0, -4.0, -4.5, -6.0, -7.0, -8.0
How to Use:
Set Your Time Range: Input your desired session start and end times (24-hour format)
Select Timezone: Choose the appropriate timezone for your trading session
Customize Display: Toggle various visual elements based on your preferences
Monitor Price Action: Watch for reactions at projected levels and OTE zones
Set Alerts: Configure sweep alerts for when price breaks above/below range extremes
Input Parameters Explained:
Time Range Settings
Range Start/End Hour & Minute: Define your analysis period
Time Zone: Ensure accurate session timing across different markets
Visual Settings
Range Box: Toggle the premium/discount zone visualization
Horizontal Lines: Customize high/low line appearance
Internal Range Levels: Show/hide equilibrium and OTE zones
Labels: Configure text display for key levels
Fibonacci Projections: Enable/disable extension levels
Display Settings
Historical Ranges: Show up to 10 previous session ranges
Alert Type: Choose between high sweep, low sweep, or both
Trading Applications:
Session-Based Trading: Analyze specific market sessions (Asian, London, New York, opening ranges, hourly ranges)
Reversal Trading: Identify high-probability reversal zones at OTE levels
Breakout/Reversal Trading: Monitor range breaks/reversals with built-in sweep alerts
Risk Management: Use Fibonacci projections as profit targets or rejection areas
Multi-Timeframe Analysis: Apply to any timeframe for various trading styles
Important Notes:
This indicator is for educational purposes only and should not be considered financial advice
Past performance does not guarantee future results
Always use proper risk management when trading
The indicator automatically manages historical data to maintain chart performance

Volatility Quality [Alpha Extract]The Alpha-Extract Volatility Quality (AVQ) Indicator provides traders with deep insights into market volatility by measuring the directional strength of price movements. This sophisticated momentum-based tool helps identify overbought and oversold conditions, offering actionable buy and sell signals based on volatility trends and standard deviation bands.
🔶 CALCULATION
The indicator processes volatility quality data through a series of analytical steps:
Bar Range Calculation: Measures true range (TR) to capture price volatility.
Directional Weighting: Applies directional bias (positive for bullish candles, negative for bearish) to the true range.
VQI Computation: Uses an exponential moving average (EMA) of weighted volatility to derive the Volatility Quality Index (VQI).
vqiRaw = ta.ema(weightedVol, vqiLen)
Smoothing: Applies an additional EMA to smooth the VQI for clearer signals.
Normalization: Optionally normalizes VQI to a -100/+100 scale based on historical highs and lows.
Standard Deviation Bands: Calculates three upper and lower bands using standard deviation multipliers for volatility thresholds.
vqiStdev = ta.stdev(vqiSmoothed, vqiLen)
upperBand1 = vqiSmoothed + (vqiStdev * stdevMultiplier1)
upperBand2 = vqiSmoothed + (vqiStdev * stdevMultiplier2)
upperBand3 = vqiSmoothed + (vqiStdev * stdevMultiplier3)
lowerBand1 = vqiSmoothed - (vqiStdev * stdevMultiplier1)
lowerBand2 = vqiSmoothed - (vqiStdev * stdevMultiplier2)
lowerBand3 = vqiSmoothed - (vqiStdev * stdevMultiplier3)
Signal Generation: Produces overbought/oversold signals when VQI reaches extreme levels (±200 in normalized mode).
Formula:
Bar Range = True Range (TR)
Weighted Volatility = Bar Range × (Close > Open ? 1 : Close < Open ? -1 : 0)
VQI Raw = EMA(Weighted Volatility, VQI Length)
VQI Smoothed = EMA(VQI Raw, Smoothing Length)
VQI Normalized = ((VQI Smoothed - Lowest VQI) / (Highest VQI - Lowest VQI) - 0.5) × 200
Upper Band N = VQI Smoothed + (StdDev(VQI Smoothed, VQI Length) × Multiplier N)
Lower Band N = VQI Smoothed - (StdDev(VQI Smoothed, VQI Length) × Multiplier N)
🔶 DETAILS
Visual Features:
VQI Plot: Displays VQI as a line or histogram (lime for positive, red for negative).
Standard Deviation Bands: Plots three upper and lower bands (teal for upper, grayscale for lower) to indicate volatility thresholds.
Reference Levels: Horizontal lines at 0 (neutral), +100, and -100 (in normalized mode) for context.
Zone Highlighting: Overbought (⋎ above bars) and oversold (⋏ below bars) signals for extreme VQI levels (±200 in normalized mode).
Candle Coloring: Optional candle overlay colored by VQI direction (lime for positive, red for negative).
Interpretation:
VQI ≥ 200 (Normalized): Overbought condition, strong sell signal.
VQI 100–200: High volatility, potential selling opportunity.
VQI 0–100: Neutral bullish momentum.
VQI 0 to -100: Neutral bearish momentum.
VQI -100 to -200: High volatility, strong bearish momentum.
VQI ≤ -200 (Normalized): Oversold condition, strong buy signal.
🔶 EXAMPLES
Overbought Signal Detection: When VQI exceeds 200 (normalized), the indicator flags potential market tops with a red ⋎ symbol.
Example: During strong uptrends, VQI reaching 200 has historically preceded corrections, allowing traders to secure profits.
Oversold Signal Detection: When VQI falls below -200 (normalized), a lime ⋏ symbol highlights potential buying opportunities.
Example: In bearish markets, VQI dropping below -200 has marked reversal points for profitable long entries.
Volatility Trend Tracking: The VQI plot and bands help traders visualize shifts in market momentum.
Example: A rising VQI crossing above zero with widening bands indicates strengthening bullish momentum, guiding traders to hold or enter long positions.
Dynamic Support/Resistance: Standard deviation bands act as dynamic volatility thresholds during price movements.
Example: Price reversals often occur near the third standard deviation bands, providing reliable entry/exit points during volatile periods.
🔶 SETTINGS
Customization Options:
VQI Length: Adjust the EMA period for VQI calculation (default: 14, range: 1–50).
Smoothing Length: Set the EMA period for smoothing (default: 5, range: 1–50).
Standard Deviation Multipliers: Customize multipliers for bands (defaults: 1.0, 2.0, 3.0).
Normalization: Toggle normalization to -100/+100 scale and adjust lookback period (default: 200, min: 50).
Display Style: Switch between line or histogram plot for VQI.
Candle Overlay: Enable/disable VQI-colored candles (lime for positive, red for negative).
The Alpha-Extract Volatility Quality Indicator empowers traders with a robust tool to navigate market volatility. By combining directional price range analysis with smoothed volatility metrics, it identifies overbought and oversold conditions, offering clear buy and sell signals. The customizable standard deviation bands and optional normalization provide precise context for market conditions, enabling traders to make informed decisions across various market cycles.

Intra_Candle_Welding by Chaitu50cIntra Candle Welding by Chaitu50c
This is a professional price action–based indicator designed to automatically detect and visualize *intra-candle reversal zones* using simple yet powerful logic. It highlights price levels where two consecutive opposite candles meet with a high probability of short-term market reaction.
Concept
The indicator identifies potential intraday support and resistance levels based on the "Intra Candle Welding" concept: when the close of one candle is very close to the open of the next candle, and the two candles have opposite directions (bullish followed by bearish, or bearish followed by bullish). These levels often attract market attention due to order flow imbalance created during such transitions.
How It Works
1. The indicator continuously monitors each new candle and checks if the current open is approximately equal to the previous close, within a configurable buffer.
2. It further ensures that the two candles form an opposite pair (green→red or red→green).
3. When a valid pair is detected, the indicator checks for existing active lines near this level. If no active line exists within the defined tolerance, it draws a new horizontal line at the detected level.
4. Each line is classified as either a potential resistance (from green→red pair) or support (from red→green pair).
5. Lines automatically extend rightward and update with each bar. If price breaks through the line beyond a configurable break buffer, the line stops extending and is visually marked as "broken."
6. The indicator intelligently manages the maximum number of lines on the chart by deleting the oldest ones when the limit is exceeded.
Use Case
Traders can use this tool to identify short-term reaction zones and potential intraday turning points. The highlighted levels act as temporary support and resistance areas where price frequently reacts. It is especially useful in fast-moving or volatile markets such as index futures or liquid stocks.
Features
* Automatically detects intra-candle reversal zones.
* Classifies zones as support (bottom) or resistance (top).
* Automatically updates and breaks lines when invalidated by price action.
* Adjustable parameters for flexibility:
* Equality Buffer
* Max Lines to Keep
* Line Suppression Tolerance
* Initial Extend Bars
* Break Buffer
* Line colors, widths, and styles (active and broken states)
* Efficient memory handling with capped line count.
* Minimalist and clean visual representation, suitable for overlay on any chart.
Recommended Settings
* Works best on intraday timeframes (1 min to 15 min).
* Tune the Equality Buffer and Tolerance parameters based on instrument volatility.
* Use conservative Break Buffer to avoid premature line invalidation.
Disclaimer
This is a tool to support discretionary trading decisions. It is not a standalone buy/sell signal generator. Users are advised to combine it with their own market context and risk management framework.
This indicator is released for the TradingView community for educational and practical trading use.
---

Stop Hunt Indicator ║ BullVision 🧠 Overview
The Stop Hunt Indicator (SmartTrap Radar) is an original tool designed to identify potential liquidity traps caused by institutional stop hunts. It visually maps out historically significant levels where price has repeatedly reversed or rejected — and dynamically detects real-time sweep patterns based on volume, structure, and candle rejection behavior.
This script does not repurpose existing public indicators, nor does it use default TradingView built-ins such as RSI, MACD, or MAs. Its core logic is fully proprietary and was developed from scratch to support discretionary and data-driven traders in visualizing volatility risks and manipulation zones.
🔍 What the Indicator Does
This indicator identifies and visualizes potential stop hunt zones using:
Historical structure analysis: Swing highs/lows are identified via a configurable lookback period.
Liquidity level tracking: Once detected, levels are monitored for touches, age, and volume strength.
Proprietary scoring model: Each level receives a real-time significance score based on:
Age (how long the level has held)
Number of rejections (touches)
Relative volume strength
Proximity to current price
The glow intensity of plotted levels is dynamically mapped based on this score. Bright glow = higher institutional interest probability.
⚙️ Stop Hunt Detection Logic
A stop hunt is flagged when all of the following are met:
Price sweeps through a high/low beyond a user-defined penetration threshold
Wick rejection occurs (i.e., candle closes back inside the level)
Volume spikes above the average in a recent window
The script automatically:
Detects bullish stop hunts (below support) and bearish ones (above resistance)
Marks detected sweeps on-chart with optional 🔰/🚨 signals
Adjusts glow visuals based on score even after the sweep occurs
These sweeps often precede local reversals or high-volatility zones — this is not predictive, but rather a reactive mapping of market manipulation behavior.
📌 Why This Is Not Just Another Liquidity Tool
Unlike typical liquidity heatmaps or S/R indicators, this script includes:
A proprietary significance score instead of fixed rules
Multi-layer glow rendering to reflect level importance visually
Real-time scoring updates as new volume and touches occur
Combined volume × rejection × structure logic to validate stop hunts
Fully customizable detection logic (lookback, wick %, volume filters, max bars, etc.)
This indicator provides a specialized view focused solely on visualizing trap setups — not generic trend signals.
🧪 Usage Recommendations
To get started:
Add the indicator to your chart (volume-enabled instruments only)
Customize detection:
Lookback Period for structure
Penetration % for how far price must sweep
Volume Spike Multiplier
Wick rejection strength
Enable/disable features:
Glow effects
Hunt markers
Score labels
Volume highlights
Watch for:
🔰 Bullish Sweeps (below support)
🚨 Bearish Sweeps (above resistance)
Bright glowing zones = high-liquidity targets
This tool can be used for both confluence and risk assessment, especially around high-impact sessions, liquidation events, or range extremes.
📊 Volume Dependency Notice
⚠️ This indicator requires real volume data to function correctly. On instruments without volume (e.g., synthetic pairs), certain features like spike detection and scoring will be disabled or inaccurate.
🔐 Closed-Source Disclosure
This script is published as invite-only to protect its proprietary scoring, glow mapping, and detection logic. While the full implementation remains confidential, this description outlines all key mechanics and configurable logic for user transparency.

Liquidity mark-out indicator(by Lumiere)This indicator marks out every High that has a bullish candle followed by a bearish one, vice versa for lows.
Once the price reaches the marked-out liquidity, the line is removed automatically.
This indicator only shows the current liquidity of the time frame you are at.
(To get it look like the picture just chance the length to 30-50)
Key Features of the Liquidity Mark-Out Indicator:
🔹 Identifies Liquidity Zones – Marks highs and lows based on candlestick patterns.
🔹 Customizable Settings – Toggle highs/lows visibility 🎚️, adjust line colors 🎨, and set line length (bars) 📏.
🔹 Smart Clean-Up – Automatically removes swept levels (when price breaks through) for a clean chart 🧹.
🔹 Pattern-Based Detection –
Highs: Detects two-candle reversal patterns (🟢 bullish close → 🔴 bearish close).
Lows: Detects two-candle reversal patterns (🔴 bearish close → 🟢 bullish close).
🔹 Dynamic Lines – Projects liquidity levels forward (adjustable length) to track key zones 📈.
Perfect For Traders Looking To:
✅ Spot potential liquidity grabs 🎯
✅ Identify key support/resistance levels 🛑
✅ Clean up their chart from outdated levels 🖥️

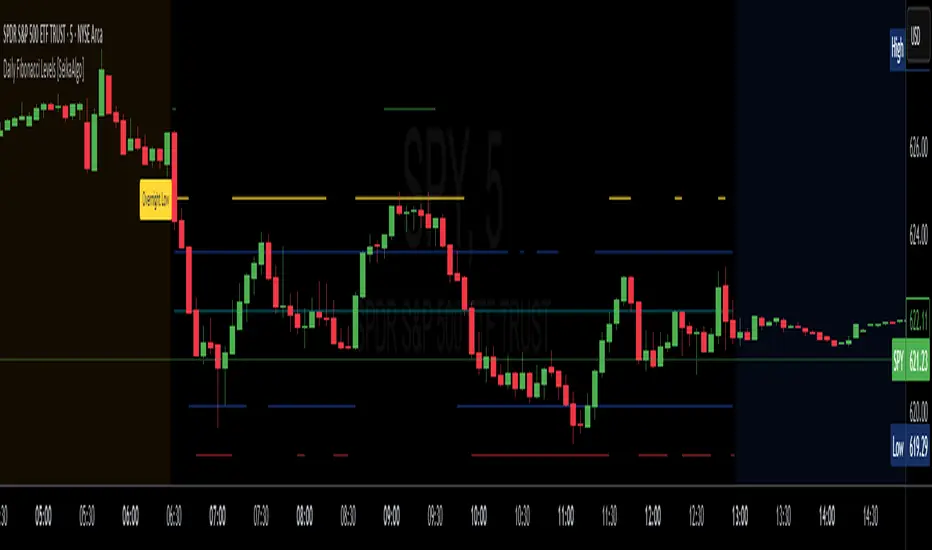
Daily Fibonacci Levels [Asa]This indicator plots dynamic daily Fibonacci levels based on the overnight session high and low, helping traders identify key price zones for potential reversals, breakouts, and pullbacks during the regular trading session.
Key Features:
Overnight Session High/Low Detection: Automatically captures the high and low between user-defined hours (default 16:00–09:30 EST).
Day Session Levels: Fibonacci retracement and extension levels are calculated once the regular session begins (default 09:30–16:00 EST).
Proximity Filter: Only plots levels that are within a customizable threshold of the current price to reduce chart clutter.
Custom Styling: Choose from solid lines, crosses, or circles, and customize the line width for a personalized look.
Mirrored Extensions: Includes both upside and downside Fibonacci extensions beyond the 100% level (up to 300%).
Labels: Clearly marks the overnight high and low with labeled points at session start.
Use Case:
Ideal for intraday and swing traders who rely on overnight price action to map out key Fibonacci levels before and during the trading day. This tool helps quickly identify zones of confluence, potential resistance/support, and continuation levels.
Customization Options:
Session hours and timezone
Line width and style
Proximity threshold for level visibility
HTF High/Low Targets This script plots the previous Highs and Lows of the 1HR, 4HR, Daily, and Weekly timeframes.
Each level is color-coded, extends across the chart, and includes labels to help you spot key areas of past support and resistance.
Use this tool to:
- Confirm intraday price reactions at HTF zones
- Identify high-probability reversal or breakout areas
- Get notified with built-in alerts when price crosses a level
You can toggle each timeframe level on/off in the settings panel.
Great for:
- Day traders and scalpers who trade off 1-minute or 5-minute charts
-Swing traders looking for confluence with HTF zones
- Anyone using a multi-timeframe analysis approach
Created by @mychaellesliemedia.

Auto Price Action SR Levels by Chaitu50cAuto Price Action SR Levels by Chaitu50c:
This is a session-based support and resistance indicator that identifies price levels based on actual candle activity, without relying on traditional indicators. It works by clustering open, high, low, or close values of past candles that frequently occur within a defined price range, making it a reliable price action-based tool for intraday traders.
The indicator calculates these levels at the start of each new trading session (based on NSE 09:15 time) and keeps them static throughout the session. This avoids unnecessary noise or flickering due to live price action, giving traders consistent zones to work with during the day.
FEATURES:
* Automatic detection of support and resistance levels based on candle price hits
* Cluster formation using high/low or open/close logic
* Static levels: calculated once per session and remain unchanged until the next session
* Adjustable settings for:
* Cluster range (in points)
* Number of lookback candles
* Line width
* Line color (default: black)
* Minimalist design for a clean chart experience
HOW IT WORKS:
The indicator looks back over a defined number of candles at the beginning of each session. It clusters prices that fall within a specified range (e.g., 250 points) and counts how many times they appear as open, high, low, or close values. If a price level is hit at least once (default), it is considered significant and a line is plotted.
Because clustering is done once per session, the lines do not shift during the session. This allows traders to base decisions on fixed, stable levels formed by prior market structure.
RECOMMENDED FOR:
* Intraday traders
* Price action traders
* Traders who prefer clean charts with logical SR zones
* Nifty, BankNifty, and stock-based day trading
Created by Chaitu50c for traders who rely on logic and structure, not signals.
Disclaimer:
This indicator is intended for educational and informational purposes only. It does not constitute financial advice or trading recommendations. Use at your own discretion and always manage risk responsibly.
---
Let me know if you’d like to include use-case examples or screenshots before publishing.

Impulse Profile Zones [BigBeluga]🔵 OVERVIEW
Impulse Profile Zones is a volume-based tool designed to highlight high-impact candles and visualize hidden liquidity zones inside them using microstructure data. It’s ideal for identifying volume concentration and potential reaction points during impulsive market moves.
Whenever a candle exceeds a specified size threshold, this indicator captures its structure and overlays a detailed intrabar volume profile (from a 10x lower timeframe), allowing traders to analyze the distribution of interest within powerful market impulses.
🔵 CONCEPTS
Filters candles that exceed a user-defined threshold by size.
For qualifying candles, retrieves lower timeframe price and volume data.
Divides the candle’s body into 10 volume bins and calculates the volume per zone. Highlights the bin with the highest volume as the Point of Control (POC) .
Each POC line extends forward until a new impulse is detected.
🔵 FEATURES
Impulse Candle Detection:
Triggers only when a candle’s body size is larger than the defined threshold.
Lower Timeframe Profiling:
Aggregates 10-bin volume data from a lower timeframe (typically 1/10 of current TF).
Volume Distribution Bars:
Each bin displays a stylized bar using unicode block characters (e.g., ▇▇▇, ▇▇ or ▇--).
The bar size reflects the relative volume intensity.
POC Zone Mapping:
The bin with the highest volume is marked with a bold horizontal line.
Its value is labeled and extended until the next valid impulse.
🔵 HOW TO USE
Use large candle profiles to assess which price levels inside a move were most actively traded.
Watch the POC line as a magnet for future price interaction (support/resistance or reaction).
Combine with market structure or order block indicators to identify confluence levels.
Adjust the “Filter Large Candles” input to detect more or fewer events based on volatility.
🔵 CONCLUSION
Impulse Profile Zones is a hybrid microstructure tool that bridges lower timeframe volume with higher timeframe impulse candles. By revealing where most of the volume occurred inside large moves, traders gain a deeper view into hidden liquidity, enabling smarter trade entries and more confident profit-taking zones.

Silver Bullet 5 minutes Box - By KaVeHThis indicator plots high-low range boxes based on selected intraday time windows on the 5-minute chart. It's inspired by the "Silver Bullet" trading concept, highlighting key liquidity grabs and volatility pockets at predefined times. It helps traders visually identify potential smart money trading windows during the New York session and other time anchors.
⚠️ This script only works on the 5-minute chart.
📦 Main Features:
⏰ Customizable Time Boxes:
Define up to 4 separate time windows per day:
3:00 AM – 3:05 AM (New York time) (Box 1)
10:00 AM – 10:05 AM (New York time) (Box 2)
2:00 PM – 2:05 PM (New York time) (Box 3)
8:00 PM – 8:05 PM (New York time) (Box 4)
🎨 Color and Visibility Control:
Each box can be independently toggled and colored for visual distinction.
🕔 New York Time Based:
All timestamps are automatically adjusted to New York Time, aligning with institutional market behavior.
📉 Post-Box Projection:
After each time window closes, a box extends forward 6 hours (72 bars on a 5-minute chart) to highlight the range.
💡 Use Case:
These boxes are best used to:
Detect liquidity sweeps.
Mark potential entry or exit zones.
Track price behavior after specific time-based events.
For example, the 10 AM box is often used to identify setups just after the NYSE open and into the first hour of volatility.
⚠️ TradingView Compliance Notes:
This script is original and does not replicate or resell premium/paid indicators.
All logic is coded from scratch by kaveh_mirmousavi, using public concepts from ICT/Smart Money Trading.
Fully complies with the Mozilla Public License 2.0.
Does not include financial advice or signals — for educational use only.
✅ How to Use:
Apply to a 5-minute chart.
Adjust the desired time boxes in the input panel.
Watch for price action within and after the boxes.
Enjoy and feel free to share feedback or ideas for improvement!

SuperTrend: Silent Shadow 🕶️ SuperTrend: Silent Shadow — Operate in trend. Vanish in noise.
Overview
SuperTrend: Silent Shadow is an enhanced trend-following system designed for traders who demand clarity in volatile markets and silence during indecision.
It combines classic Supertrend logic with a proprietary ShadowTrail engine and an adaptive Silence Protocol to filter noise and highlight only the cleanest signals.
Key Features
✅ Core Supertrend Logic
Built on Average True Range (ATR), this trend engine identifies directional bias with visual clarity. Lines adjust dynamically with price action and flip when meaningful reversals occur.
✅ ShadowTrail: Stepped Counter-Barrier
ShadowTrail doesn’t predict reversals — it reinforces structure.
When price is trending, ShadowTrail forms a stepped ceiling in downtrends and a stepped floor in uptrends. This visual containment zone helps define the edges of price behavior and offers a clear visual anchor for stop-loss placement and trade containment.
✅ Silence Protocol: Adaptive Noise Filtering
During low-volatility zones, the system enters “stealth mode”:
• Trend lines turn white to indicate reduced signal quality
• Fill disappears to reduce distraction
This helps avoid choppy entries and keeps your focus sharp when the market isn’t.
✅ Visual Support & Stop-Loss Utility
When trendlines flatten or pause, they naturally highlight price memory zones. These flat sections often align with:
• Logical stop-loss levels
• Prior support/resistance areas
• Zones of reduced volatility where price recharges or rejects
✅ Custom Styling
Full control over line colors, width, transparency, fill visibility, and silence behavior. Tailor it to your strategy and visual preferences.
How to Use
• Use Supertrend color to determine bias — flips mark momentum shifts
• ShadowTrail mirrors the primary trend as a structural ceiling/floor
• Use flat segments of both lines to identify consolidation zones or place stops
• White lines = low-quality signal → stand by
• Combine with RSI, volume, divergence, or your favorite tools for confirmation
Recommended For:
• Traders seeking clearer trend signals
• Avoiding false entries in sideways or silent markets
• Identifying key support/resistance visually
• Structuring stops around real market containment levels
• Scalping, swing, or position trading with adaptive clarity
Built by Sherlock Macgyver
Forged for precision. Designed for silence.
When the market speaks, you listen.
When it doesn’t — you wait in the shadows.

GapCluster SR For Intraday by Chaitu50c**GapCluster SR For Intraday by Chaitu50c**
**Overview**
GapCluster SR plots dynamic intraday support and resistance lines based on candle-to-candle gaps. Whenever an Open/Close or High/Low gap is detected, the script draws a horizontal level and “clusters” nearby gaps into a single line to keep your chart clean. Lines automatically color-code relative to price—green when below, red when above.
---
**Key Features**
* **Gap Detection Modes**: Choose between Open/Close gaps (default) or High/Low gaps.
* **Clustering**: Merge levels within a user-defined vertical range to avoid clutter.
* **Dynamic Coloring**: Levels below price turn green; levels above price turn red.
* **Session Reset**: Automatically removes levels older than X days.
* **Fully Customizable**: Adjust buffer, cluster range, line width, lookback period, and both above/below colors.
---
**Inputs**
| Input | Default | Description |
| ---------------------------- | :--------: | ------------------------------------------- |
| Gap Type | Open/Close | Select gap detection method |
| Price Buffer (points) | 5.0 | Maximum distance for gap matching |
| Cluster Range (points) | 100.0 | Vertical distance within which levels merge |
| Line Width | 2 | Thickness of plotted lines |
| Days to Include | 14 | Number of days to retain past levels |
| Color for Levels Above Price | red | Line color when level > current price |
| Color for Levels Below Price | green | Line color when level < current price |
---
**How to Use**
1. **Add to Chart**: Apply on any intraday timeframe (1 min, 5 min, etc.).
2. **Select Mode**: Pick Open/Close or High/Low in settings.
3. **Tweak Inputs**: Raise/lower buffer for tighter/looser gap detection; adjust cluster range to group levels; change lookback (“Days to Include”) to control session reset.
4. **Interpret Levels**:
* **Green Lines** mark potential support zones.
* **Red Lines** mark potential resistance zones.
5. **Combine with Your Strategy**: Use alongside volume, momentum, or trend filters for confirmation.
---
**Tips & Tricks**
* **Intraday Entries**: Look for price reaction at green (support) lines for long setups, or red (resistance) lines for shorts.
* **Filter Noise**: Increase the “Cluster Range” to consolidate many close levels into stronger, singular lines.
---
**Disclaimer**
This indicator is provided “as-is” for educational purposes only. Always backtest any setup and practice proper risk management.

Intraday Fibs RetracementFibonacci (Fibs) levels are often used by traders as a way to find support and resistance, based on the Fibonacci sequence. These levels are widely used in technical analysis to identify potential reversal points in the price of an asset.
Fibs retracement draws lines at these Fibs level between a significant high and low point on a price chart.
What it shows:
This indicator will automatically draw Fibs Retracement Levels on your chart without any manual work.
It is designed to be used for day trading, especially in scenarios where a ticker gaps up/down large compared to the prior day close. (i.e. scenario where the difference of day's open and prior day close is large)
The drawing will happen on each trading day the moment trading hours open, and will NOT draw during pre-market and post-market.
User can see the line of each Fibs level, labelled with the Fib percentage and price value for the corresponding levels.
User will specify a start and end point of Fibs and based on the choice the indicator will automatically compute the other user defined Fibs levels and display on the chart.
How to use it:
The Fib levels drawn can be a potential support and resistance zone. Therefore in scenario where you already have a position and are approaching one of these levels it could be a point to close out some or all the position as you are approaching a resistance. On the other hand when price do approach these levels you could enter a position for a reversal trade. These are few ways to use the indicator but there are other ways that can be used, which can be found out by researching "Fibonacci (Fibs) Retracement".
In the example on the chart you can see a price bounce from the 0.7886 Fibs level on this particular day, where the price gapped up and was coming down after market hours opened.
Key settings:
1. Fibs Retracement Start and end Point: User selects where the Fibs levels should be drawn.
Available Options are:
Start Points:
Market Open
Market Open High (Dependent on the time frame you are on)
Pre-market High
Day's High
End Points:
Previous Day Close
Previous Day Low
Previous Day High
Pre-market Low (Current Day)
Day's Low
2. Custom Fib Levels: User can manually enter the Fib levels they want to see. (Max 9)
Default values are: 0,0.236,0.382,0.5,0.618,0.786,1,1.618,2.618.
3. Display settings: User can specify the line colour, thickness and style.
4. Label Setting: User can choose to turn on/off the labels for the each Fibs Level. Label will show the fib percentage and the corresponding price. User can also choose the location of the labels, defined by an offset from the current candle.
----------------------------------------------------------------------
If anything is not clear please let me know!
