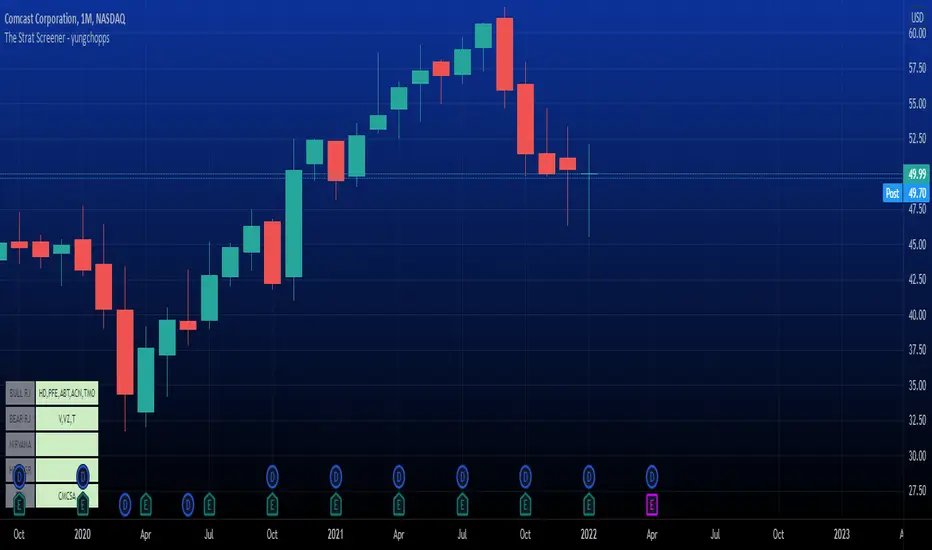
The Strat Screener - yungchoppsThis indicator scan up to 40 tickers of your choice for bullish and bearish Randy Jackson setups. Randy Jackson setups are 2u-2u-2d-2u for bullish cases and 2d-2d-2u-2d for bearish cases. If a ticker has a possible RJ setup, the ticker name will be display on the table depending if it is bullish or bearish. The only thing you need to do it change one of the default tickers to the ones you desire and the table will update if there are any RJ setups. The indicators search for RJ setups on the current timeframe that you are on.
Randy Jackson setups are part of the 'Strat' candlestick analysist. More information about the Strat can be found on the internet and YouTube. This indicator reads the previous candles of every selected ticker and searched for a RJ setup. If one exist, it will update the table with the tickers name. I will add more setups in the future.
This is a screener. This indicator really just makes it easier to scan many indicators at once. Its not hard to use... just place it on the chart and it will do the work for you. Hopefully mods find this enough of a description...
Strat
The Strat Numbers & CombosThis indicator is an all-in-one " The Strat " script. This script displays the following:
The Strat candle numbers (1's, 2's, & 3's)
The Strat Combo labels along with trigger line
Pivot Machine Gun ( PMG ) dynamic labels
Hammer & Shooter candle labels
The Strat Candle Numbers label each candle, on any timeframe, either a 1, 2, or 3. 1's are inside bars of the previous candles. 2's take out only one side of the previous candle. And 3's go outside both sides of the previous candle.
The Strat Combo labels (which are made of the 1's, 2's, 3's outlined above) display labels when a Strat Combo occurs. The script displays a label, direction arrow, and trigger line for each Strat Combo. This indicator finds the following Strat Combos:
2-1-2 bullish reversal (BLR)
2-1-2 bullish continuation (BLC)
3-1-2 BLR
3-2-2 BLR
1-2-2 rev strat BLR
2-2 BLR
2-1-2 bearish reversal (BRR)
2-1-2 bearish continuation (BRC)
3-1-2 BRR
3-2-2 BRR
1-2-2 rev strat BRR
2-2 BRR
Double inside candles
The Pivot Machine Gun (PMG) labels any 5 or more consecutive candles that make higher lows or 5 or more consecutive candles that make lower highs. A PMG can continue going in its direction or it can reverse and come back through the range. The logic in this indicator dynamically finds each level in a PMG and draws a line for easy identification.
The script also identifies if the candle type is a Hammer, Inverted Hammer, Shooting Star, or Hanging Man. These candle types are highly likely reversal points in price action.The indicator will plot a shape with a color coded icon identifying the candle. The distance between the shape and the candles can be manually adjusted in the inputs section.
This indicator has many style options . The user can independently toggle on/off the Strat numbers, boxes around the Strat Combos, and Hammer and Shooter shapes. Also all of the colors used in this script can be changed from the inputs section, so a user can easily change colors to match their current color scheme.

RM Timeframe ContinuityThis indicator plots a table off to the right of the chart to help with determining timeframe continuity. Per the Strat, a great edge is only taking trades where full timeframe continuity is in place (i.e. if you are going long, make sure other timeframes are also green).
In this script:
Green candles have green colored boxes, red candles have red colored boxes.
Inside bars are represented by a circle - ⬤
Outside bars are represented by a tall rectangle - ▮
2-up bars are indicated by an up arrow - ▲
2-down bars are indicated by a down arrow - ▼
User defined options:
Pick any timeframe for the 4 boxes
Choose whether to plot the highs/lows of the larger timeframe candles as horizontal rays on your chart (along with the associated colors)

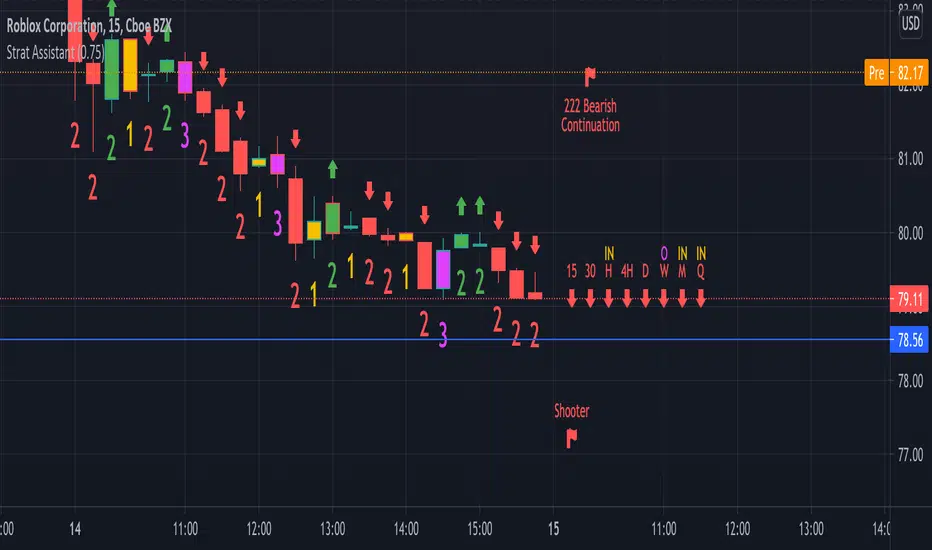
Strat AssistantStrat Assistant
This script will help you follow the strat. While other collections of scripts exist to do similar functionality, the idea of this (work in progress) is to be a one stop shop for all things strat that will evolve over time. Fairly new to the strat and pine script. The script is for informational purposes only. Please do you due diligence.
Features:
=Candle numbering: will number candles underneath based on the prior candle. 1 for an inside bar 2 for a directional bar (up or down) and 3 for an outside bar.
=Candle coloring: will highlight candles. Yellow for an inside candle, magenta for an outside candle, red for a 2 down candle, green for a 2 up candle. It will not modify the outside border of the candle so you can still see green if the open was lower than the close or red if the close was below open.
=Candle shape: will place an arrow up if the 2 candle is a directional UP and arrows down if the 2 candle is a directional DOWN. It will display red if it's bearish and green if it's bullish.
=Strat combos: will provide a text description of all currently applicable strat combinations if they are active at the top right of the chart. It will display red if it's bearish and green if it's bullish.
=Actionable signals: will provide text description of actionable signals if they are active on the bottom right of the chart. Inside bar if the bar is inside the prior bar, the color of this signal will be blue (shows better on white background). Hammer will be 75% of the candle is at the bottom and the open and close are above the 75% of the wick. Hammers will display green for bullish. Shooters are just the opposite of hammers, 75% of the wick is at the top and the open and close are below 75% of the wick. Shooters will display at red for bearish.
=Time Frame Continuity: will provide time frame continuity across 15m, 30m, Hour, Day, Week, Quarter, Year with green arrows up if the close is above the open for the given time frame, or red arrows down if the close is below the open for the given time frame. This will also look to determine if the time frame is applicable based on what time frame the user selects as well as ensures history exists for the given time frame.
Backlog / Work in progress:
=Opacity for time frame continuity
=Line indicators (or maybe just a label) for highs and lows of previous periods (hour, day, week, quarter)
=Alert conditions
=User input for various indicators
Candle Type w/only 3-1This script is a "fork" of Crinklebine's excellent "Candle Type" script for Rob Smith's ( aka RobInTheBlack) #thestrat methodology. 1 strategy that's becoming increasingly popular is looking for 3-1 (outside-inside) set-ups per #thestrat. The idea is that as the inside candle breaks, the target to take profits is given by the high/low of the previous outside range. This script is for traders who only want to look for this specific candle combo (3-1) and highlights up/dn breaks of the inside candle. It's designed to work with or without "Candle Type" (so traders who want all bars labelled can also select Crinklebine's Candle Type script to run concurrently). I've had traders specifically request this script from me, so I thought others may be interested as well and I'm sharing it here.

Paint 1 & 3 Bars (The Strat)Based on 'The Strat' methodology by Rob Smith.
This script will paint 1 & 3 bars per 'The Strat'.
N.B. Per 'The Strat' a bar is seen as a 1 (inside) when the bar's high or low is an equal tick to the previous bar.

Price Continuation (The Strat)Shows the historic bar type, whether it is up, down, up and inside, down and inside, up and outside, or down and outside. Will only display historic bar type based on the selected time timeframe. (Ex. if you are looking at the weekly time frame, you will only see the bar type for Year, Quarter, Month, and Week. It will not display the Day or Hour bar type.)


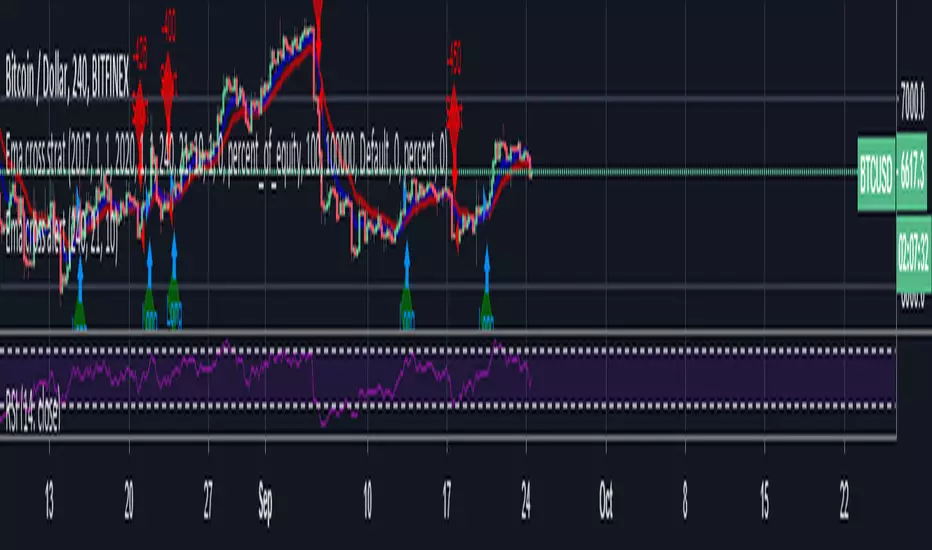
Ema cross strat / Turtle Trading This is just a simple EMA cross strategy which is meant to be similar to Turtle Trading Strategy.
It uses in default 4 Hour 21 / 10 EMA to long or short. This is not perfect but in the long run it will profit. Works best in bull market.
LINK TO ALERT :
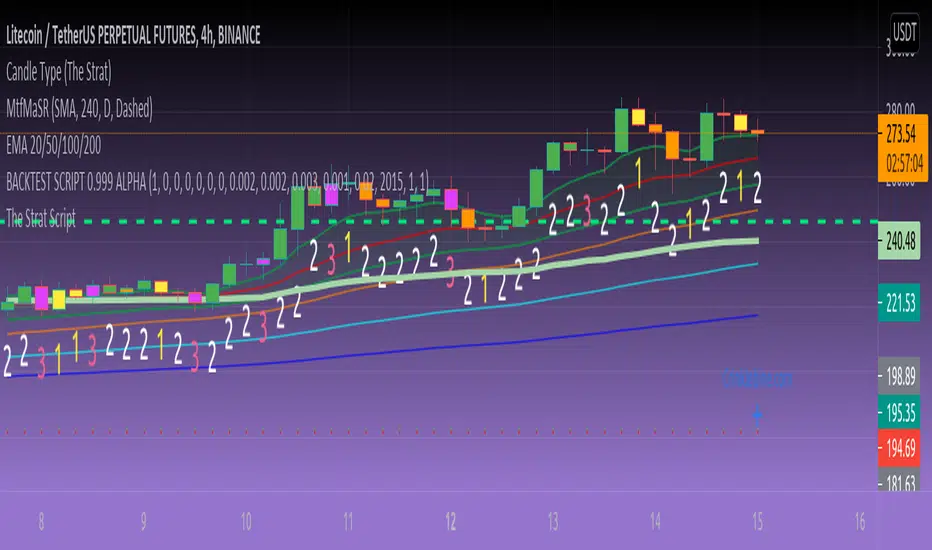
Understanding order sizestype: properties manipulation, no programming needed
time required: 15minutes, at least
level: medium (need to know contracts, trading pairs)
A strategy can "appear" to work or be broken depending on the pile of cash that is working on. This amount is defined in the strat properties, under "order size".
For noobs (like me) this is very confusing at first :)
A strat opens/closes positions using units, a generic measure for the chart being operated on. Thes "units" can be a fixed amount of cash, a fixed amount of contracts, or a floating amount based on the last profits made. I recommend checking my previous strat to figure the case of contracts .
So, any trading price is the amount of "things" you get for some "cash". The things are the first unit, the "cash" is the second. Some examples:
XAU/USD - 1 xau oz is worth x dollars
BTC/USD - 1 bitcoin is worth x dollars
GBP/EUR - 1 pound is worth x euros
To add to confusion, a lot of markets the "unit size" is different from what the strat thinks it is. An options contract is 100 shares(the unit), 1 xau contract is 10 oz(units), 1 eur/usd contract is 100k euros and so on... so, after figuring out how the sizes work in a strat, then the sizes must be adapted for the specific market in question.
The choice os using the ETHUSD pair is because:
1 - you can buy 1eth, unlike a gold contract for example, so 1 "unit" = 1 eth, easier to get
2 - ETH is around 12 bucks, wich gives round numbers on the math, easier to wrap the brains around :)
3- is an unusual pair, so the regular contract sizes don't apply, and the brain is not conditioned to work inside the box ;)
You will have to access the script properties, to change the values. As these values are changed you will see exactly the differences in the values of the strat.
Text is too long, check the comments for all the cases
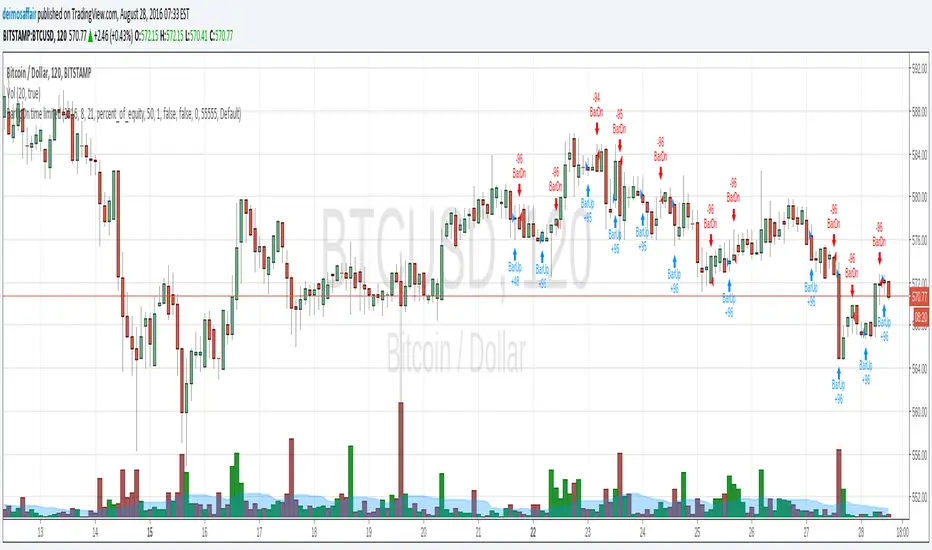
Understanding contract sizes in a strategyThis simple strat fires up on green bars, down on red bars. cannot get any simpler. So, it's a good example to check how returns are calculated.
First, the internal firing mechanism for the strategy.entry function is something hardcore. As result, the entry points can be confusing, and seem to appear in a wrong bar (as the 2nd and 3rd signals are good examples), but i'll put that aside to keep it simple. And, because i don't yet get it myself ;)
The example is simple, so that numbers can be followed easy. Chart in BTC/USD, so USD is the "base" currency used by strat to calculate. A contract/unit is the value of 1 unit in base currency. 1 Apple share is 600$, 1 bitcoin is 600$, 1 oz gold is 1330 bucks. So, here in each bar, the value of 1 contract is the value of the BTC in USD. simple as that.
The strat properties, can be passed as input fields (line 2) or accessed/changed in the right click->properties pop-up. To make it easier, initial capital is 1000 bucks, and "order size" is 1 contract. This means that the strat will open a position of 1 BTC when it fires. Value "Initial capital" makes no difference at all, at least with these choices. It's just for show. Try to put 1$ and 1 contract, the strat will still trade anyway. It manages to trade 1 contract(or BTC) values at ~600$, with a single dollar. nice ;)
Check the chart. see the little blue "BarUp +1" ? that's it, strat goes long 1 BTC. there's a little blue triangle on the bar, points to the value of entry.
Then later, on second move, the "BarDn -2", the strat goes short 2BTC. 1BTC to close the long +1 more to open a short.
The profit here is the difference between the value of the long opening and the long closing. The extra BTC (shorted) is part of the next position. Since this dumb strat just reverses the direction, there are always +2, -2 , +2.... 1 to close previous position, 1 to open another. At the strategy tester tab, the option "list of trades" shows in details each of the moves
Checking each move and comparing what we see with the chart itself helps to achieve ilumination :)
Bonus feature: as soon as you get it, try to increase the option "pyramiding" and see how the strat adds more contracts, and how it reverses the positions. sometimes it even makes sense!!!! :)

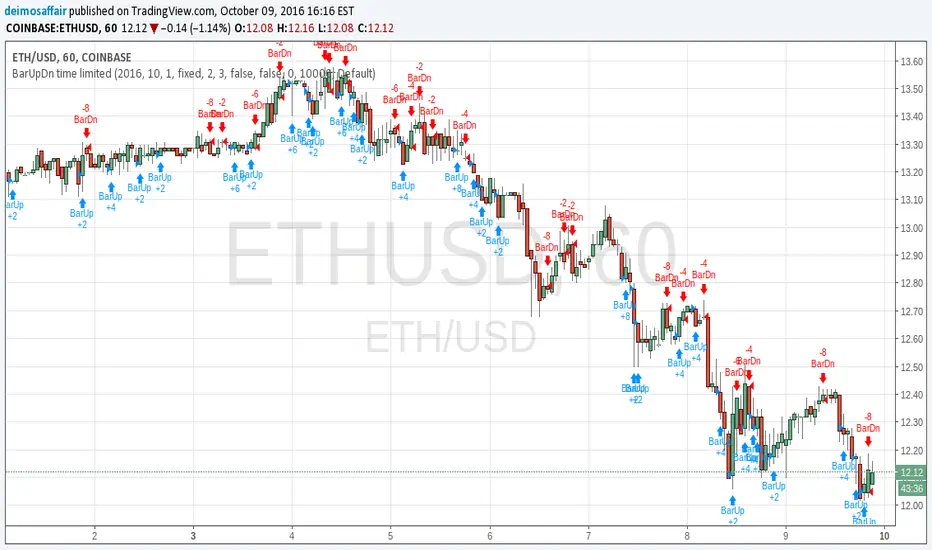
BarUpDn time limitedtrying to understand strategies, it appears that there is a lot of black magic in how a strat works behind the scenes.
anyway, it's hard to analyse what's all the data with one gazillion entries, and i wanted to know how we can manipulate/do stuff with a chart.
so, i needed to know how to "give" the script my values to work on. bundled two wants/needs into one, and created a script that only applies a strategy from the date given onwards.
how to use:
at the chart, go to the "format" little button, then the input tab, and there is all the date fields i created. fun to set it to the current date, then start going backwards and see all the little arrows filing up the chart :)