XRP CrossChain Momentum EngineThis is a strategy with stop loss 3% , leverage 4 and no pyramiding. It works great with XRP and other coins with similar price, but i suggest XRP. Profit in 1 year around 900% and profit in 2 years around 2000% as you can see in the pictures. I have initial capital 1000 but it can change.
Stoploss

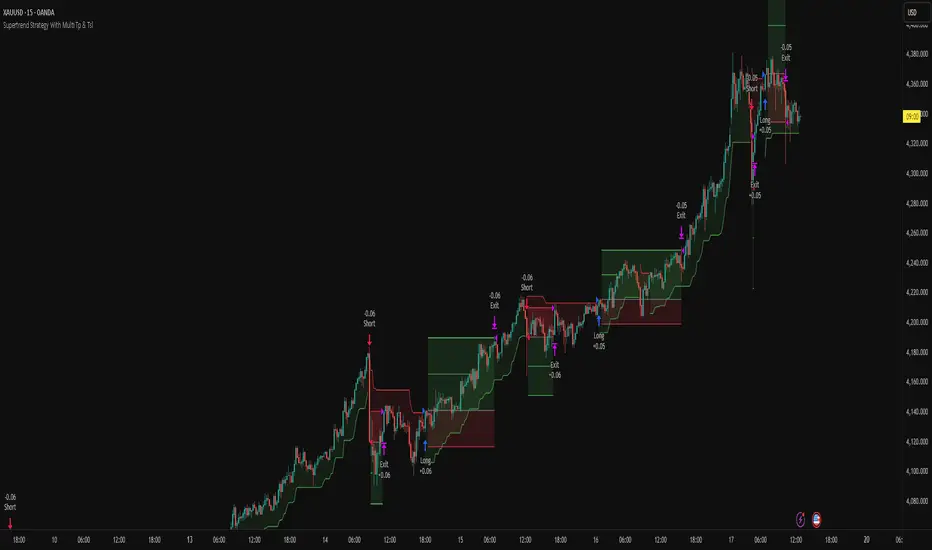
Supertrend Strategy With Multi Tp & TslHello Traders,
This strategy is based on the popular Supertrend indicator, which many traders use as a simple trend-following tool. The core entry logic is straightforward:
Buy (Long) when the price closes above the Supertrend line.
Sell (Short) when the price closes below the Supertrend line.
However, trading success isn’t only about entries — proper risk management makes all the difference. That’s why this strategy includes four stop-loss methods, two take-profit types, and a trailing stop-loss system. You can customize all of these settings to create your own personalized version.
🛑 Stop-Loss Methods
Tick – Uses the instrument’s smallest price increment. Ideal for tick-based markets such as Futures or Forex.
Percent – Defines the stop-loss as a percentage of entry price. Commonly used in Crypto trading.
ATR – Uses the Average True Range value to determine stop-loss distance. Perfect for adapting to changing market volatility.
Supertrend – The stop-loss level is set at the Supertrend line value at the time of entry.
🔁 Trailing Stop-Loss & Reverse Signals
Trailing SL: If enabled, the chosen stop-loss method will trail the price dynamically from the moment the position opens.
Close with Reverse Signals: When activated, the current position closes and reverses on an opposite signal. If disabled, the strategy waits until the current position is closed before opening a new one.
🎯 Take-Profit Options
Tick – Set a fixed take-profit level based on tick distance.
Percent – Set take-profit based on a percentage change from entry.
Ratio – Sets take-profit based on the entry-to-stop-loss distance × ratio value.
Each take-profit method allows you to define the percentage of position to close at that level.
⚖️ Breakeven Option
When Breakeven is enabled, after the first take-profit is triggered, the stop-loss automatically moves to the entry level, protecting your capital.
⚙️ Additional Settings
Position Type: Choose between Long only, Short only, or Both directions.
Session Filter: Trade only during specific time ranges. Activate this option and set your desired session hours (make sure to select your correct timezone).
📈 Visuals
The strategy plots entry, stop-loss, and take-profit levels directly on the chart, allowing you to clearly visualize your trades and manage them effectively.
Feel free to ask any questions or suggest improvements — this strategy is built for flexibility and experimentation!
Open Range Breakout Strategy With Multi TakeProfitHello everyone,
For a while, I’ve been wanting to develop new scripts, but I couldn’t decide what to create. Eventually, I came up with the idea of coding traditional and well-known trading strategies—while adding modern features such as multi–take profit options. For the first strategy in this series, I chose the Open Range Strategy .
For those unfamiliar with it, the Open Range Strategy is a trading approach where you define a specific time period at the beginning of a trading session—such as the first 15 minutes, 30 minutes, or 1 hour—and mark the highest and lowest prices within that range. These levels then act as reference points for potential breakouts: if the price breaks above the range, it may signal a long entry; if it breaks below, it may indicate a short entry. This method is popular among day traders for capturing early momentum in the market.
Since this strategy is generally used as an intraday strategy , I added a Trade Session feature. This allows you to define the exact time window during which trades can be opened. Once the session ends, all positions are automatically closed, ensuring trades remain within your chosen intraday period.
Even though it’s a relatively simple concept, I’ve come across many different variations of it. That’s why I created a highly customizable project. Under the Session Settings, you can select the time window you want to define as your range. Whether it’s the first 15-minute candle or the entire first hour, the choice is entirely yours.
For stop-loss placement, there are two different options:
Middle of the Range – The stop loss is placed at the midpoint between the high and low of the defined range, offering a balanced buffer for both bullish and bearish setups.
Top/Bottom of the Range – The stop loss is placed just beyond the range’s high for short trades or just below the range’s low for long trades, providing a more conservative risk approach.
I’ve always been a big fan of the multi take-profit feature, so I added two different take-profit targets to this project. Take profits are calculated based on a Risk-to-Reward Ratio, which you can adjust in the settings. You can also set different position sizes for each target, allowing you to scale out of trades in a way that suits your strategy.
The result is a flexible, user-friendly strategy script that brings together a classic approach with modern risk management tools—ready to be tailored to your trading style

Mutanabby_AI | Algo Pro Strategy# Mutanabby_AI | Algo Pro Strategy: Advanced Candlestick Pattern Trading System
## Strategy Overview
The Mutanabby_AI Algo Pro Strategy represents a systematic approach to automated trading based on advanced candlestick pattern recognition and multi-layered technical filtering. This strategy transforms traditional engulfing pattern analysis into a comprehensive trading system with sophisticated risk management and flexible position sizing capabilities.
The strategy operates on a long-only basis, entering positions when bullish engulfing patterns meet specific technical criteria and exiting when bearish engulfing patterns indicate potential trend reversals. The system incorporates multiple confirmation layers to enhance signal reliability while providing comprehensive customization options for different trading approaches and risk management preferences.
## Core Algorithm Architecture
The strategy foundation relies on bullish and bearish engulfing candlestick pattern recognition enhanced through technical analysis filtering mechanisms. Entry signals require simultaneous satisfaction of four distinct criteria: confirmed bullish engulfing pattern formation, candle stability analysis indicating decisive price action, RSI momentum confirmation below specified thresholds, and price decline verification over adjustable lookback periods.
The candle stability index measures the ratio between candlestick body size and total range including wicks, ensuring only well-formed patterns with clear directional conviction generate trading signals. This filtering mechanism eliminates indecisive market conditions where pattern reliability diminishes significantly.
RSI integration provides momentum confirmation by requiring oversold conditions before entry signal generation, ensuring alignment between pattern formation and underlying momentum characteristics. The RSI threshold remains fully adjustable to accommodate different market conditions and volatility environments.
Price decline verification examines whether current prices have decreased over a specified period, confirming that bullish engulfing patterns occur after meaningful downward movement rather than during sideways consolidation phases. This requirement enhances the probability of successful reversal pattern completion.
## Advanced Position Management System
The strategy incorporates dual position sizing methodologies to accommodate different account sizes and risk management approaches. Percentage-based position sizing calculates trade quantities as equity percentages, enabling consistent risk exposure across varying account balances and market conditions. This approach proves particularly valuable for systematic trading approaches and portfolio management applications.
Fixed quantity sizing provides precise control over trade sizes independent of account equity fluctuations, offering predictable position management for specific trading strategies or when implementing precise risk allocation models. The system enables seamless switching between sizing methods through simple configuration adjustments.
Position quantity calculations integrate seamlessly with TradingView's strategy testing framework, ensuring accurate backtesting results and realistic performance evaluation across different market conditions and time periods. The implementation maintains consistency between historical testing and live trading applications.
## Comprehensive Risk Management Framework
The strategy features dual stop loss methodologies addressing different risk management philosophies and market analysis approaches. Entry price-based stop losses calculate stop levels as fixed percentages below entry prices, providing predictable risk exposure and consistent risk-reward ratio maintenance across all trades.
The percentage-based stop loss system enables precise risk control by limiting maximum loss per trade to predetermined levels regardless of market volatility or entry timing. This approach proves essential for systematic trading strategies requiring consistent risk parameters and capital preservation during adverse market conditions.
Lowest low-based stop losses identify recent price support levels by analyzing minimum prices over adjustable lookback periods, placing stops below these technical levels with additional buffer percentages. This methodology aligns stop placement with market structure rather than arbitrary percentage calculations, potentially improving stop loss effectiveness during normal market fluctuations.
The lookback period adjustment enables optimization for different timeframes and market characteristics, with shorter periods providing tighter stops for active trading and longer periods offering broader stops suitable for position trading approaches. Buffer percentage additions ensure stops remain below obvious support levels where other market participants might place similar orders.
## Visual Customization and Interface Design
The strategy provides comprehensive visual customization through eight predefined color schemes designed for different chart backgrounds and personal preferences. Color scheme options include Classic bright green and red combinations, Ocean themes featuring blue and orange contrasts, Sunset combinations using gold and crimson, and Neon schemes providing high visibility through bright color selections.
Professional color schemes such as Forest, Royal, and Fire themes offer sophisticated alternatives suitable for business presentations and professional trading environments. The Custom color scheme enables precise color selection through individual color picker controls, maintaining maximum flexibility for specific visual requirements.
Label styling options accommodate different chart analysis preferences through text bubble, triangle, and arrow display formats. Size adjustments range from tiny through huge settings, ensuring appropriate visual scaling across different screen resolutions and chart configurations. Text color customization maintains readability across various chart themes and background selections.
## Signal Quality Enhancement Features
The strategy incorporates signal filtering mechanisms designed to eliminate repetitive signal generation during choppy market conditions. The disable repeating signals option prevents consecutive identical signals until opposing conditions occur, reducing overtrading during consolidation phases and improving overall signal quality.
Signal confirmation requirements ensure all technical criteria align before trade execution, reducing false signal occurrence while maintaining reasonable trading frequency for active strategies. The multi-layered approach balances signal quality against opportunity frequency through adjustable parameter optimization.
Entry and exit visualization provides clear trade identification through customizable labels positioned at relevant price levels. Stop loss visualization displays active risk levels through colored line plots, ensuring complete transparency regarding current risk management parameters during live trading operations.
## Implementation Guidelines and Optimization
The strategy performs effectively across multiple timeframes with optimal results typically occurring on intermediate timeframes ranging from fifteen minutes through four hours. Higher timeframes provide more reliable pattern formation and reduced false signal occurrence, while lower timeframes increase trading frequency at the expense of some signal reliability.
Parameter optimization should focus on RSI threshold adjustments based on market volatility characteristics and candlestick pattern timeframe analysis. Higher RSI thresholds generate fewer but potentially higher quality signals, while lower thresholds increase signal frequency with corresponding reliability considerations.
Stop loss method selection depends on trading style preferences and market analysis philosophy. Entry price-based stops suit systematic approaches requiring consistent risk parameters, while lowest low-based stops align with technical analysis methodologies emphasizing market structure recognition.
## Performance Considerations and Risk Disclosure
The strategy operates exclusively on long positions, making it unsuitable for bear market conditions or extended downtrend periods. Users should consider market environment analysis and broader trend assessment before implementing the strategy during adverse market conditions.
Candlestick pattern reliability varies significantly across different market conditions, with higher reliability typically occurring during trending markets compared to ranging or volatile conditions. Strategy performance may deteriorate during periods of reduced pattern effectiveness or increased market noise.
Risk management through stop loss implementation remains essential for capital preservation during adverse market movements. The strategy does not guarantee profitable outcomes and requires proper position sizing and risk management to prevent significant capital loss during unfavorable trading periods.
## Technical Specifications
The strategy utilizes standard TradingView Pine Script functions ensuring compatibility across all supported instruments and timeframes. Default configuration employs 14-period RSI calculations, adjustable candle stability thresholds, and customizable price decline verification periods optimized for general market conditions.
Initial capital settings default to $10,000 with percentage-based equity allocation, though users can adjust these parameters based on account size and risk tolerance requirements. The strategy maintains detailed trade logs and performance metrics through TradingView's integrated backtesting framework.
Alert integration enables real-time notification of entry and exit signals, stop loss executions, and other significant trading events. The comprehensive alert system supports automated trading applications and manual trade management approaches through detailed signal information provision.
## Conclusion
The Mutanabby_AI Algo Pro Strategy provides a systematic framework for candlestick pattern trading with comprehensive risk management and position sizing flexibility. The strategy's strength lies in its multi-layered confirmation approach and sophisticated customization options, enabling adaptation to various trading styles and market conditions.
Successful implementation requires understanding of candlestick pattern analysis principles and appropriate parameter optimization for specific market characteristics. The strategy serves traders seeking automated execution of proven technical analysis techniques while maintaining comprehensive control over risk management and position sizing methodologies.

Fibonacci + TP/SL Strategy [Backtest]✅ Key Features Added and Adjusted:
Fibonacci Retracement Levels:
Automatically calculated based on the last 100 bars' high/low
Plotted levels: 0%, 23.6%, 38.2%, 50%, 61.8%, 78.6%, 100%
Extension targets: 161.8%, 261.8%, 423.6%
Buy/Sell Signal Logic:
Buy: Price is between 78.6% and 38.2% levels
Sell: Price is between 61.8% and 23.6% levels
Both depend on a can_trade time filter to avoid overtrading
ATR-based Stop-Loss:
Stop-loss dynamically adapts to market volatility:
SL = Entry - ATR * 1.5 (long)
SL = Entry + ATR * 1.5 (short)
Fixed Take-Profit:
Configurable via input: default is 4%
Can be changed in TradingView UI
Golden/Death Cross Indicator (Visual Only):
EMA 50 crossing EMA 200 plotted on chart:
Golden Cross = Buy signal (green triangle)
Death Cross = Sell signal (red triangle)
Weekly Profit Cap:
Prevents new trades if weekly profit exceeds 15%
Resets at the start of every week
Visual Elements:
All Fibonacci levels are plotted
Buy/Sell signals are labeled on the chart (BUY, SELL)

Crypto Strategy SUSDT 10 minThis strategy is designed to trade the **SUSDT** pair on a **10-minute time frame**, using a combination of an Exponential Moving Average (EMA) and percentage-based Stop Loss (SL) and Take Profit (TP) levels.
### How the strategy works:
1. **EMA Calculation**:
- The strategy calculates a 24-period Exponential Moving Average (EMA) based on the closing price.
- This EMA serves as the primary trend indicator.
2. **Entry Conditions**:
- **Long Position**: A long position is entered when the closing price is above the EMA and the opening price is below the EMA. This indicates a potential upward trend.
- **Short Position**: A short position is entered when the closing price is below the EMA and the opening price is above the EMA. This indicates a potential downward trend.
3. **Stop Loss and Take Profit**:
- Both Stop Loss (SL) and Take Profit (TP) are calculated based on the entry price of the position.
- **For Long Positions**:
- Stop Loss is set as a percentage below the entry price.
- Take Profit is set as a percentage above the entry price.
- **For Short Positions**:
- Stop Loss is set as a percentage above the entry price.
- Take Profit is set as a percentage below the entry price.
- The percentage values for SL and TP can be adjusted in the strategy's settings (default: SL = 2%, TP = 4%).
4. **Exit Conditions**:
- The position is closed automatically when either the Stop Loss or Take Profit level is reached.
5. **Visualization**:
- The 24-period EMA is plotted on the chart as a blue line, helping visualize the trend direction.
### Key Features:
- **Pair and Time Frame**: The strategy is optimized for the SUSDT pair on a 10-minute time frame.
- **Customizable Parameters**: Users can adjust the Stop Loss and Take Profit percentages to suit their risk tolerance and trading style.
- **Trend-Following Approach**: The strategy uses the EMA to identify and follow the current market trend.
This strategy is simple yet effective for capturing trends while managing risk through predefined Stop Loss and Take Profit levels.

John Bob-Trading-BotDeveloped by Ayebale John Bob with the help of his bestie, this innovative strategy combines advanced Smart Money Concepts with practical risk management tools to help traders identify and capitalize on key market moves.
Key Features:
Smart Money Concepts & Fair Value Gaps (FVG):
The strategy monitors price action for fair value gaps, which are visualized as extremely faint horizontal lines on the chart. These FVGs signal potential areas where institutional traders might have entered or exited positions.
Dynamic Entry Signals:
Buy signals are triggered when the price crosses above the 50-bar lowest low or when a bullish FVG is detected. Conversely, sell signals are generated when the price falls below the 50-bar highest high or a bearish FVG is identified. Each signal is visually marked on the chart with clear buy (green) and sell (red) labels.
Multi-Level Order Execution:
Once an entry signal occurs, the strategy places five separate orders, each with its own take-profit (TP) level. The TP levels are calculated dynamically using the Average True Range (ATR) and a set of predefined multipliers. This allows traders to scale out of positions as the market moves favorably.
Dynamic Risk Management:
A stop-loss is automatically set at a distance determined by the ATR, ensuring that risk is managed in accordance with current market volatility.
Real-Time Trade Information Table:
In the bottom-right corner of the chart, a trade information table displays essential details about the current trade:
Side: Displays "BUY NOW" (with a dark green background) for long entries or "SELL NOW" (with a dark red background) for short entries.
Entry Price & Stop-Loss: Shows the entry price (highlighted in green) and the corresponding stop-loss level (highlighted in red).
Take-Profit Levels: Lists the five TP levels, each of which turns green once the market price reaches that target.
Timer: A live timer in minutes counts from the moment the current trade trigger started, helping traders track the duration of their active trades.
Visual Progress Bar:
A histogram-style progress bar is plotted on the chart, visually representing the percentage gain (or loss) relative to the entry price.
This strategy was meticulously designed to incorporate both technical analysis and smart risk management, offering a robust trading solution that adapts to changing market conditions. Whether you're a seasoned trader or just starting out, the AyebaleJohnBob Trading Bot equips you with the tools and visual cues needed to make well-informed trading decisions. Enjoy a seamless blend of strategy and style—crafted with passion by Ayebale John Bob and his bestie!

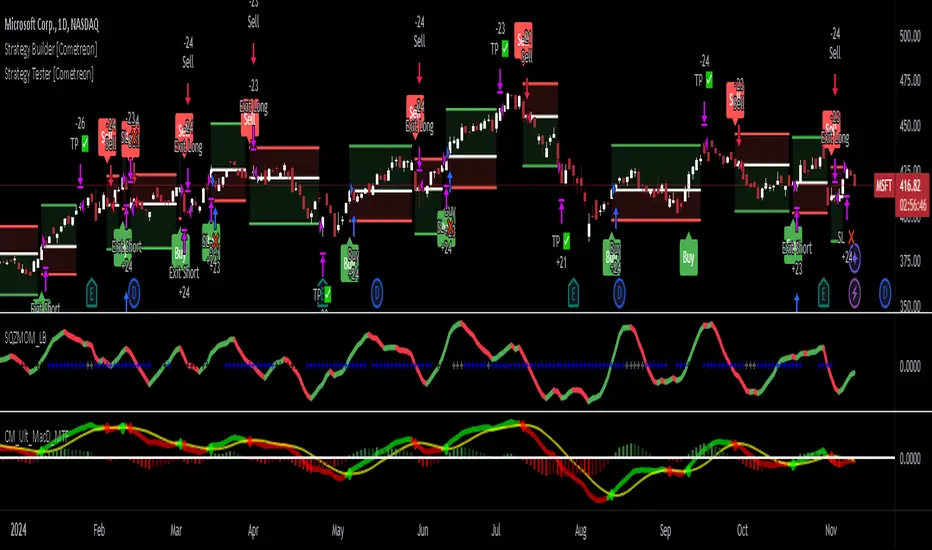
Strategy Tester [Cometreon]Strategy Tester is a powerful backtesting engine designed to evaluate and optimize trading strategies built with the Strategy Builder or signals triggered by the Signal Tester.
It provides a full-featured environment for assessing strategy performance across symbols and timeframes, offering smart tools for risk management, capital allocation, and alert handling.
Whether you're refining a custom strategy or validating signals, Strategy Tester helps you test with confidence and clarity.
🔷 Key Features
🟩 Multi-Symbol, Multi-Timeframe Testing
Easily test strategies across different assets and timeframes to understand how they behave in diverse market conditions.
🟩 Advanced Risk Management
Implement multiple Take Profit and Stop Loss combinations, break-even, trailing systems, and exit rules tailored to your style.
🟩 Flexible Session and Capital Settings
Customize trading hours, session windows, and initial capital allocation for ultra-precise testing scenarios.
🟩 Custom Alerts
Generate personalized alerts for entries, exits, and SL/TP adjustments to simulate real-time execution.
🔷 Technical Details and Customizable Inputs
1️⃣ Source Entry Long and Short - Select entry conditions for the strategy from the "Signal Tester" or "Strategy Builder".
2️⃣ Source Exit Long and Short - Select exit conditions for the strategy from the "Signal Tester" or "Strategy Builder".
3️⃣ Trading Session - Choose the period in which the strategy will enter positions, selecting from: Months, Days, up to 3 hourly sessions, and the strategy's activity range, i.e., start and end date.
4️⃣ Alert Message - Set custom messages for each type of Alert, such as Entry Long, Exit Short, or Change SL Long.
5️⃣ Plot - Choose whether to show Long and Short positions on the chart.
🔷 Risk Management Settings
1️⃣ Initial Capital - Set the starting capital for the strategy.
2️⃣ Quantity - Choose the entry quantity for each type of position, selecting from: Contracts, USD, Percentage of equity, or percentage of initial capital.
3️⃣ Take Profit - Configure up to 4 Take Profits using one of the following types:
%: Percentage from the entry price
USD: Distance in dollars
Pip: Distance in Pips
ATR: Based on ATR multiplier
Swing: Uses swing length
Risk Reward: Linked to Stop Loss or vice versa
4️⃣ Stop Loss - Set the SL using the same types as TP for maximum flexibility.
5️⃣ Break Even - Automatically modify SL when price hits a TP level, adjusting by % / USD / Pip from entry.
6️⃣ Trailing Take Profit - Activates a dynamic TP when a condition is met, updating it as price evolves (e.g., new highs).
7️⃣ Trailing Stop Loss - Updates SL automatically when the market moves in your favor (e.g., new lows in long trades).
8️⃣ Exit Before End Session - Exit positions a few candles before the session ends to avoid overnight risks.
🔍 How to Use Strategy Tester
🧩 Add the Indicator:
Load Strategy Tester onto your chart and connect it to any Cometreon signal generator.
⚙️ Configure Risk Settings:
Set up capital, risk, SL/TP parameters, and time filters to match your strategy profile.
🧪 Run the Test:
Execute the backtest and analyze the visual + data output for insight.
📊 Optimize and Repeat:
Adjust key parameters and re-run until your strategy achieves optimal performance.
☄️ Take your trading to the next level with TradeLab Beta's Strategy Tester this powerful backtesting tool and start optimizing your trading strategies today.
👉 Don't waste any more time and visit the link to get access to all Cometreon indicators.
Neural Momentum StrategyThis strategy combines Exponential Moving Average (EMA) analysis with a multi-timeframe approach. It uses a neural scoring system to evaluate market momentum and generate precise trading signals. The strategy is implemented in Pine Script v5 and is designed for use on TradingView.
Key Components
The strategy utilizes short-term (10-period) and long-term (25-period) EMAs. It calculates the difference between these EMAs to assess trend direction and strength. A neural scoring system evaluates EMA crossovers (weight: 12 points), trend strength (weight: 10 points), and price acceleration (weight: 4 points). The system implements a score smoothing algorithm using a 10-period EMA.
Multi-timeframe Analysis
The strategy automatically selects a higher timeframe based on the current chart timeframe. It calculates scores for both the current and higher timeframes, then combines these scores using a weighted average. The higher timeframe factor ranges from 3 to 6, depending on the current timeframe.
Trading Logic
Entry occurs when the final combined score turns positive after a change. Exit happens when the final combined score turns negative after a change. The strategy recalculates scores on each bar, ensuring responsive trading decisions.
Risk Management
An optional adaptive stop-loss system based on Average True Range (ATR) is available. The default ATR period is 10, and the stop factor is 1.2. Stop levels are dynamically adjusted on the higher timeframe.
Customization Options
Users can adjust EMA periods, signal line period, scoring weights, and enable/disable multi-timeframe analysis. The strategy allows setting specific date ranges for backtesting and deployment.
Position Sizing
The strategy uses a percentage-of-equity position sizing method, with a default of 30% of account equity per trade.
Code Structure
The strategy is built using TradingView's strategy framework. It employs efficient use of the request.security() function for multi-timeframe analysis. The main calculation function, calculate_score(), computes the neural score based on EMA differences and acceleration.
Performance Considerations
The strategy adapts to various market conditions through its multi-faceted scoring system. Multi-timeframe analysis helps filter out noise and identify stronger trends. The neural scoring approach aims to capture subtle market dynamics often missed by traditional indicators.
Limitations
Performance may vary across different markets and timeframes. The strategy's effectiveness relies on proper calibration of its numerous parameters. Users should thoroughly backtest and forward test before live implementation.
To summarize, the Neural Momentum Strategy represents a sophisticated approach to market analysis. It combines traditional technical indicators with advanced scoring techniques and multi-timeframe analysis. This strategy is designed for traders seeking a data-driven and adaptive method. It aims to identify high-probability trading opportunities across various market conditions.
This Neural Momentum Strategy is for informational and educational purposes only. It should not be considered financial advice. The strategy may exhibit slight repainting behavior due to the nature of multi-timeframe analysis and the use of the request.security() function. Historical values might change as new data becomes available.
Trading carries a high level of risk, and may not be suitable for all investors. Before deciding to trade, you should carefully consider your investment objectives, level of experience, and risk appetite. The possibility exists that you could sustain a loss of some or all of your initial investment. Therefore, you should not invest money that you cannot afford to lose.
Past performance is not indicative of future results. The author and TradingView are not responsible for any losses incurred as a result of using this strategy. Always exercise caution when using this or any trading strategy, and thoroughly test it before implementing in live trading scenarios.
Users are solely responsible for any trading decisions they make based on this strategy. It is strongly recommended that you seek advice from an independent financial advisor if you have any doubts.

VAWSI and Trend Persistance Reversal Strategy SL/TPThis is a completely revamped version of my "RSI and ATR Trend Reversal Strategy."
What's New?
The RSI has been replaced with an original indicator of mine, the "VAWSI," as I've elected to call it.
The standard RSI measures a change in an RMA to determine the strength of a movement.
The VAWSI performs very similarly, except it uses another original indicator of mine, the VAWMA.
VAWMA stands for "Volume (and) ATR Weight Moving Average." It takes an average of the volume and ATR and uses the ratio of each bar to weigh a moving average of the source.
It has the same formula as an RSI, but uses the VAWMA instead of an RMA.
Next we have the Trend Persistence indicator, which is an index on how long a trend has been persisting for. It is another original indicator. It takes the max deviation the source has from lowest/highest of a specified length. It then takes a cumulative measure of that amount, measures the change, then creates a strength index with that amount.
The VAWSI is a measure of an emerging trend, and the Trend Persistence indicator is a measure of how long a trend has persisted.
Finally, the 3rd main indicator, is a slight variation of an ATR. Rather than taking the max of source - low or high- source and source - source , it instead takes the max of high-low and the absolute value of source - the previous source. It then takes the absolute value of the change of this, and normalizes it with the source.
Inputs
Minimum SL/TP ensures that the Stop Loss and Take Profit still exist in untrendy markets. This is the minimum Amount that will always be applied.
VAWSI Weight is a divided by 100 multiplier for the VAWSI. So value of 200 means it is multiplied by 2. Think of it like a percentage.
Trend Persistence weight and ATR Weight are applied the same. Higher the number, the more impactful on the final calculation it is.
Combination Mult is an outright multiplier to the final calculation. So a 2.0 = * 2.0
Trend Persistence Smoothing Length is the length of the weighted moving average applied to the Trend Persistence Strength index.
Length Cycle Decimal is a replacement of length for the script.
Here we used BlackCat1402's Dynamic Length Calculation, which can be found on his page. With his permission we have implemented it into this script. Big shout out to them for not only creating, but allowing us to use it here.
The Length Cycle Decimal is used to calculate the dynamic length. Because TradingView only allows series int for their built-in library, a lot of the baseline indicators we use have to be manually recreated as functions in the following section.
The Strategy
As usual, we use Heiken Ashi values for calculations.
We begin by establishing the minimum SL/TP for use later.
Next we determine the amount of bars back since the last crossup or crossdown of our threshold line.
We then perform some normalization of our multipliers. We want a larger trend or larger VAWSI amount to narrow the threshold, so we have 1 divide them. This way, a higher reading outputs a smaller number and vice versa. We do this for both Trend Persistence, and the VAWSI.
The VAWSI we also normalize, where rather than it being a 0-100 reading of trend direction and strength, we absolute it so that as long as a trend is strong, regardless of direction, it will have a higher reading. With these normalized values, we add them together and simply subtract the ATR measurement rather than having 1 divide it.
Here you can see how the different measurements add up. A lower final number suggests imminent reversal, and a higher final number suggests an untrendy or choppy market.
ATR is in orange, the Trend Persistence is blue, the VAWSI is purple, and the final amount is green.
We take this final number and depending on the current trend direction, we multiply it by either the Highest or Lowest source since the last crossup or crossdown. We then take the highest or lowest of this calculation, and have it be our Stop Loss or Take Profit. This number cannot be higher/lower than the previous source to ensure a rapid spike doesn't immediately close your position on a still continuing trend. As well, the threshold cannot be higher/ lower than the the specified Stop Loss and Take Profit
Only after the source has fully crossed these lines do we consider it a crossup or crossdown. We confirm this with a barstate.isconfirmed to prevent repainting. Next, each time there is a crossup or crossdown we enter a long or a short respectively and plot accordingly.
I have the strategy configured to "process on order close" to ensure an accurate backtesting result. You could also set this to false and add a 1 bar delay to the "if crossup" and "if crossdown" lines under strategy so that it is calculated based on the open of the next bar.
Final Notes
The amounts have been preconfigured for performance on RIOT 5 Minute timeframe. Other timeframes are viable as well. With a few changes to the parameters, this strategy has backtested well on NVDA, AAPL, TSLA, and AMD. I recommend before altering settings to try other timeframes first.
This script does not seem to perform nearly as well in typically untrendy and choppy markets such as crypto and forex. With some setting changes, I have seen okay results with crypto, but overfitting could be the cause there.
Thank you very much, and please enjoy.

RSI and ATR Trend Reversal SL/TPQuick History:
I was frustrated with a standard fixed percent TP/SL as they often were not receptive to quick market rallies/reversals. I developed this TP/SL and eventually made it into a full fledge strategy and found it did well enough to publish. This strategy can be used as a standalone or tacked onto another strategy as a TP/SL. It does function as both with a single line. This strategy has been tested with TSLA , AAPL, NVDA, on the 15 minutes timeframe.
HOW IT WORKS:
Inputs:
Length: Simple enough, it determines the length of the RSI and ATR used.
Multiplier: This multiplies the RSI and ATR calculation, more on this later.
Delay to prevent Idealization: TradingView will use the open of the bar the strategy triggers on when calculating the backtest. This can produce unrealistic results depending on the source. If your source is open, set to 0, if anything else, set to 1.
Minimum Difference: This is essentially a traditional SL/TP, it is borderline unnecessary, but if the other parameters are wacky this can be used to ensure the SL/TP. It multiplies the source by the percent, so if it is set to 10, the SL/TP is initialized at src +- 10%.
Source input: Self Explanatory, be sure to update the Delay if you use open.
CALCULATION:
Parameters Initialization:
The strategy uses Heikinashi values for calculations, this is not toggleable in parameters, but can be easily changed by changing hclose to equal src.
FUNCTION INITIALIZATION:
highest_custom and lowest_custom do the same thing as ta.highest and ta.lowest, however the built in ta library does not allow for var int input, so I had to create my own functions to be used here. I actually developed these years ago and have used them in almost every strategy since. Feel especially free to use these in your own scripts.
The rsilev is where the magic happens.
SL/TP min/max are initially calculated to be used later.
Then we begin by establishing variables.
BullGuy is used to determine the length since the last crossup or crossdown, until one happens, it returns na, breaking the function. BearGuy is used in all the calculations, and is the same as BullGuy, unless BullGuy is na, where BearGuy counts up from 1 on each bar from 0.
We create our rsi and have to modify the second one to suit the function. In the case of the upper band, we mirror the lower one. So if the RSI is 80, we want it to be 20 on the upper band.
the upper band and lower band are calculated the exact same way, but mirrored. For the purpose of writing, I'm going to talk about the lower band. Assume everything is mirrored for the upper one. It finds the highest source since the last crossup or crossdown. It then multiplies from 1 / the RSI, this means that a rapid RSI increase will increase the band dramatically, so it is able to capture quick rally/reversals. We add this to the atr to source ratio, as the general volatility is a massive factor to be included. We then multiply this number by our chosen amount, and subtract it from the highest source, creating the band.
We do this same process but mirrored with both bands and compared it to the source. If the source is above the lower band, it suggests an uptrend, so the lower band is outputted, and vice versa for the upper one.
PLOTTING:
We also determine the line color in the same manner as we do the trend direction.
STRATEGY:
We then use the source again, and if it crosses up or down relative to the selected band, we enter a long or short respectively.
This may not be the most superb independent strategy, but it can be very useful as a TP/SL for your chosen entry conditions, especially in volatile markets or tickers.
Thank you for taking the time to read, and please enjoy.

Bitcoin Momentum StrategyThis is a very simple long-only strategy I've used since December 2022 to manage my Bitcoin position.
I'm sharing it as an open-source script for other traders to learn from the code and adapt it to their liking if they find the system concept interesting.
General Overview
Always do your own research and backtesting - this script is not intended to be traded blindly (no script should be) and I've done limited testing on other markets beyond Ethereum and BTC, it's just a template to tweak and play with and make into one's own.
The results shown in the strategy tester are from Bitcoin's inception so as to get a large sample size of trades, and potential returns have diminished significantly as BTC has grown to become a mega cap asset, but the script includes a date filter for backtesting and it has still performed solidly in recent years (speaking from personal experience using it myself - DYOR with the date filter).
The main advantage of this system in my opinion is in limiting the max drawdown significantly versus buy & hodl. Theoretically much better returns can be made by just holding, but that's also a good way to lose 70%+ of your capital in the inevitable bear markets (also speaking from experience).
In saying all of that, the future is fundamentally unknowable and past results in no way guarantee future performance.
System Concept:
Capture as much Bitcoin upside volatility as possible while side-stepping downside volatility as quickly as possible.
The system uses a simple but clever momentum-style trailing stop technique I learned from one of my trading mentors who uses this approach on momentum/trend-following stock market systems.
Basically, the system "ratchets" up the stop-loss to be much tighter during high bearish volatility to protect open profits from downside moves, but loosens the stop loss during sustained bullish momentum to let the position ride.
It is invested most of the time, unless BTC is trading below its 20-week EMA in which case it stays in cash/USDT to avoid holding through bear markets. It only trades one position (no pyramiding) and does not trade short, but can easily be tweaked to do whatever you like if you know what you're doing in Pine.
Default parameters:
HTF: Weekly Chart
EMA: 20-Period
ATR: 5-period
Bar Lookback: 7
Entry Rule #1:
Bitcoin's current price must be trading above its higher-timeframe EMA (Weekly 20 EMA).
Entry Rule #2:
Bitcoin must not be in 'caution' condition (no large bearish volatility swings recently).
Enter at next bar's open if conditions are met and we are not already involved in a trade.
"Caution" Condition:
Defined as true if BTC's recent 7-bar swing high minus current bar's low is > 1.5x ATR, or Daily close < Daily 20-EMA.
Trailing Stop:
Stop is trailed 1 ATR from recent swing high, or 20% of ATR if in caution condition (ie. 0.2 ATR).
Exit on next bar open upon a close below stop loss.
I typically use a limit order to open & exit trades as close to the open price as possible to reduce slippage, but the strategy script uses market orders.
I've never had any issues getting filled on limit orders close to the market price with BTC on the Daily timeframe, but if the exchange has relatively low slippage I've found market orders work fine too without much impact on the results particularly since BTC has consistently remained above $20k and highly liquid.
Cost of Trading:
The script uses no leverage and a default total round-trip commission of 0.3% which is what I pay on my exchange based on their tier structure, but this can vary widely from exchange to exchange and higher commission fees will have a significantly negative impact on realized gains so make sure to always input the correct theoretical commission cost when backtesting any script.
Static slippage is difficult to estimate in the strategy tester given the wide range of prices & liquidity BTC has experienced over the years and it largely depends on position size, I set it to 150 points per buy or sell as BTC is currently very liquid on the exchange I trade and I use limit orders where possible to enter/exit positions as close as possible to the market's open price as it significantly limits my slippage.
But again, this can vary a lot from exchange to exchange (for better or worse) and if BTC volatility is high at the time of execution this can have a negative impact on slippage and therefore real performance, so make sure to adjust it according to your exchange's tendencies.
Tax considerations should also be made based on short-term trade frequency if crypto profits are treated as a CGT event in your region.
Summary:
A simple, but effective and fairly robust system that achieves the goals I set for it.
From my preliminary testing it appears it may also work on altcoins but it might need a bit of tweaking/loosening with the trailing stop distance as the default parameters are designed to work with Bitcoin which obviously behaves very differently to smaller cap assets.
Good luck out there!

Machine Learning: SuperTrend Strategy TP/SL [YinYangAlgorithms]The SuperTrend is a very useful Indicator to display when trends have shifted based on the Average True Range (ATR). Its underlying ideology is to calculate the ATR using a fixed length and then multiply it by a factor to calculate the SuperTrend +/-. When the close crosses the SuperTrend it changes direction.
This Strategy features the Traditional SuperTrend Calculations with Machine Learning (ML) and Take Profit / Stop Loss applied to it. Using ML on the SuperTrend allows for the ability to sort data from previous SuperTrend calculations. We can filter the data so only previous SuperTrends that follow the same direction and are within the distance bounds of our k-Nearest Neighbour (KNN) will be added and then averaged. This average can either be achieved using a Mean or with an Exponential calculation which puts added weight on the initial source. Take Profits and Stop Losses are then added to the ML SuperTrend so it may capitalize on Momentum changes meanwhile remaining in the Trend during consolidation.
By applying Machine Learning logic and adding a Take Profit and Stop Loss to the Traditional SuperTrend, we may enhance its underlying calculations with potential to withhold the trend better. The main purpose of this Strategy is to minimize losses and false trend changes while maximizing gains. This may be achieved by quick reversals of trends where strategic small losses are taken before a large trend occurs with hopes of potentially occurring large gain. Due to this logic, the Win/Loss ratio of this Strategy may be quite poor as it may take many small marginal losses where there is consolidation. However, it may also take large gains and capitalize on strong momentum movements.
Tutorial:
In this example above, we can get an idea of what the default settings may achieve when there is momentum. It focuses on attempting to hit the Trailing Take Profit which moves in accord with the SuperTrend just with a multiplier added. When momentum occurs it helps push the SuperTrend within it, which on its own may act as a smaller Trailing Take Profit of its own accord.
We’ve highlighted some key points from the last example to better emphasize how it works. As you can see, the White Circle is where profit was taken from the ML SuperTrend simply from it attempting to switch to a Bullish (Buy) Trend. However, that was rejected almost immediately and we went back to our Bearish (Sell) Trend that ended up resulting in our Take Profit being hit (Yellow Circle). This Strategy aims to not only capitalize on the small profits from SuperTrend to SuperTrend but to also capitalize when the Momentum is so strong that the price moves X% away from the SuperTrend and is able to hit the Take Profit location. This Take Profit addition to this Strategy is crucial as momentum may change state shortly after such drastic price movements; and if we were to simply wait for it to come back to the SuperTrend, we may lose out on lots of potential profit.
If you refer to the Yellow Circle in this example, you’ll notice what was talked about in the Summary/Overview above. During periods of consolidation when there is little momentum and price movement and we don’t have any Stop Loss activated, you may see ‘Signal Flashing’. Signal Flashing is when there are Buy and Sell signals that keep switching back and forth. During this time you may be taking small losses. This is a normal part of this Strategy. When a signal has finally been confirmed by Momentum, is when this Strategy shines and may produce the profit you desire.
You may be wondering, what causes these jagged like patterns in the SuperTrend? It's due to the ML logic, and it may be a little confusing, but essentially what is happening is the Fast Moving SuperTrend and the Slow Moving SuperTrend are creating KNN Min and Max distances that are extreme due to (usually) parabolic movement. This causes fewer values to be added to and averaged within the ML and causes less smooth and more exponential drastic movements. This is completely normal, and one of the perks of using k-Nearest Neighbor for ML calculations. If you don’t know, the Min and Max Distance allowed is derived from the most recent(0 index of data array) to KNN Length. So only SuperTrend values that exhibit distances within these Min/Max will be allowed into the average.
Since the KNN ML logic can cause these exponential movements in the SuperTrend, they likewise affect its Take Profit. The Take Profit may benefit from this movement like displayed in the example above which helped it claim profit before then exhibiting upwards movement.
By default our Stop Loss Multiplier is kept quite low at 0.0000025. Keeping it low may help to reduce some Signal Flashing while not taking extra losses more so than not using it at all. However, if we increase it even more to say 0.005 like is shown in the example above. It can really help the trend keep momentum. Please note, although previous results don’t imply future results, at 0.0000025 Stop Loss we are currently exhibiting 69.27% profit while at 0.005 Stop Loss we are exhibiting 33.54% profit. This just goes to show that although there may be less Signal Flashing, it may not result in more profit.
We will conclude our Tutorial here. Hopefully this has given you some insight as to how Machine Learning, combined with Trailing Take Profit and Stop Loss may have positive effects on the SuperTrend when turned into a Strategy.
Settings:
SuperTrend:
ATR Length: ATR Length used to create the Original Supertrend.
Factor: Multiplier used to create the Original Supertrend.
Stop Loss Multiplier: 0 = Don't use Stop Loss. Stop loss can be useful for helping to prevent false signals but also may result in more loss when hit and less profit when switching trends.
Take Profit Multiplier: Take Profits can be useful within the Supertrend Strategy to stop the price reverting all the way to the Stop Loss once it's been profitable.
Machine Learning:
Only Factor Same Trend Direction: Very useful for ensuring that data used in KNN is not manipulated by different SuperTrend Directional data. Please note, it doesn't affect KNN Exponential.
Rationalized Source Type: Should we Rationalize only a specific source, All or None?
Machine Learning Type: Are we using a Simple ML Average, KNN Mean Average, KNN Exponential Average or None?
Machine Learning Smoothing Type: How should we smooth our Fast and Slow ML Datas to be used in our KNN Distance calculation? SMA, EMA or VWMA?
KNN Distance Type: We need to check if distance is within the KNN Min/Max distance, which distance checks are we using.
Machine Learning Length: How far back is our Machine Learning going to keep data for.
k-Nearest Neighbour (KNN) Length: How many k-Nearest Neighbours will we account for?
Fast ML Data Length: What is our Fast ML Length?? This is used with our Slow Length to create our KNN Distance.
Slow ML Data Length: What is our Slow ML Length?? This is used with our Fast Length to create our KNN Distance.
If you have any questions, comments, ideas or concerns please don't hesitate to contact us.
HAPPY TRADING!

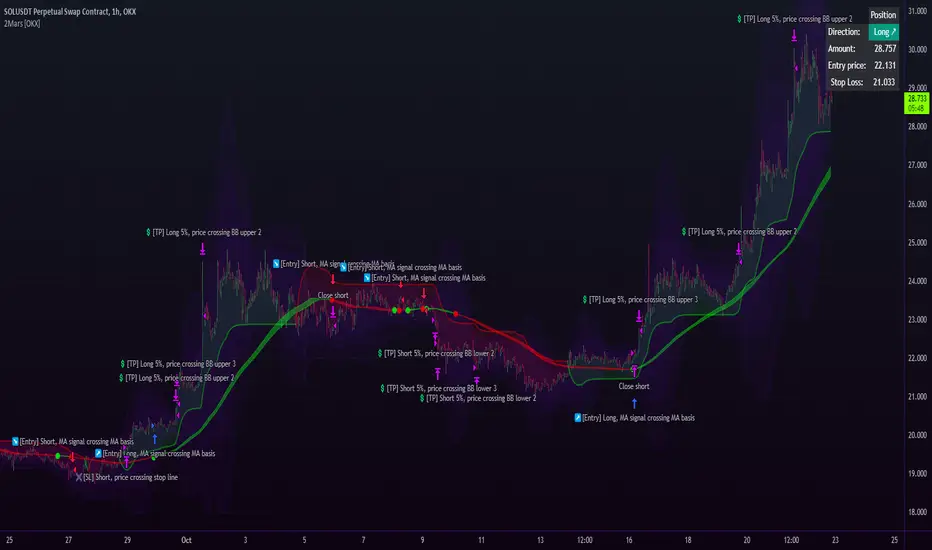
2Mars strategy [OKX]The strategy is based on the intersection of two moving averages, which requires adjusting the parameters (ratio and multiplier) for the moving average.
Basis MA length: multiplier * ratio
Signal MA length: multiplier
The SuperTrend indicator is used for additional confirmation of entry into a position.
Bollinger Bands and position reversal are used for take-profit.
About stop loss:
If activated, the stop loss price will be updated on every entry.
Basic setup:
Additional:
Alerts for OKX:
Long-Only Opening Range Breakout (ORB) with Pivot PointsIntraday Trading Strategy: Long-Only Opening Range Breakout (ORB) with Pivot Points
Background:
Opening Range Breakout (ORB) is a popular long-only trading strategy that capitalizes on the early morning volatility in financial markets. It's based on the idea that the initial price movements during the first few minutes or hours of the trading day can set the tone for the rest of the session. The strategy involves identifying a price range within which the asset trades during the opening period and then taking long positions when the price breaks out to the upside of this range.
Pivot Points are a widely used technical indicator in trading. They represent potential support and resistance levels based on the previous day's price action. Pivot points are calculated using the previous day's high, low, and close prices and can help traders identify key price levels for making trading decisions.
How to Use the Script:
Initialization: This script is written in Pine Script, a domain-specific language for trading strategies on the TradingView platform. To use this script, you need to have access to TradingView.
Apply the Script: You can do this by adding it to your favorites, then selecting the script in the indicators list under favorites or by searching for it by name under community scripts.
Customize Settings: The script allows you to customize various settings through the TradingView interface. These settings include:
Opening Session: You can set the time frame for the opening session.
Max Trades per Day: Specify the maximum number of long trades allowed per trading day.
Initial Stop Loss Type: Choose between using a percentage-based stop loss or the previous candles low for stop loss calculations.
Stop Loss Percentage: If you select the percentage-based stop loss, specify the percentage of the entry price for the stop loss.
Backtesting Start and End Time: Set the time frame for backtesting the strategy.
Strategy Signals:
The script will display pivot points in blue (R1, R2, R3, R4, R5) and half-pivot points in gray (R0.5, R1.5, R2.5, R3.5, R4.5) on your chart.
The green line represents the opening range.
The script generates long (buy) signals based on specific conditions:
---The open price is below the opening range high (h).
---The current high price is above the opening range high.
---Pivot point R1 is above the opening range high.
---It's a long-only strategy designed to capture upside breakouts.
---It also respects the maximum number of long trades per day.
The script manages long positions, calculates stop losses, and adjusts long positions according to the defined rules.
Trailing Stop Mechanism
The script incorporates a dynamic trailing stop mechanism designed to protect and maximize profits for long positions. Here's how it works:
1. Initialization:
The script allows you to choose between two types of initial stop loss:
---Percentage-based: This option sets the initial stop loss as a percentage of the entry price.
---Previous day's low: This option sets the initial stop loss at the previous day's low.
2. Setting the Initial Stop Loss (`sl_long0`):
The initial stop loss (`sl_long0`) is calculated based on the chosen method:
---If "Percentage" is selected, it calculates the stop loss as a percentage of the entry price.
---If "Previous Low" is selected, it sets the stop loss at the previous day's low.
3. Dynamic Trailing Stop (`trail_long`):
The script then monitors price movements and uses a dynamic trailing stop mechanism (`trail_long`) to adjust the stop loss level for long positions.
If the current high price rises above certain pivot point levels, the trailing stop is adjusted upwards to lock in profits.
The trailing stop levels are calculated based on pivot points (`r1`, `r2`, `r3`, etc.) and half-pivot points (`r0.5`, `r1.5`, `r2.5`, etc.).
The script checks if the high price surpasses these levels and, if so, updates the trailing stop accordingly.
This dynamic trailing stop allows traders to secure profits while giving the position room to potentially capture additional gains.
4. Final Stop Loss (`sl_long`):
The script calculates the final stop loss level (`sl_long`) based on the following logic:
---If no position is open (`pos == 0`), the stop loss is set to zero, indicating there is no active stop loss.
---If a position is open (`pos == 1`), the script calculates the maximum of the initial stop loss (`sl_long0`) and the dynamic trailing stop (`trail_long`).
---This ensures that the stop loss is always set to the more conservative of the two values to protect profits.
5. Plotting the Stop Loss:
The script plots the stop loss level on the chart using the `plot` function.
It will only display the stop loss level if there is an open position (`pos == 1`) and it's not a new trading day (`not newday`).
The stop loss level is shown in red on the chart.
By combining an initial stop loss with a dynamic trailing stop based on pivot points and half-pivot points, the script aims to provide a comprehensive risk management mechanism for long positions. This allows traders to lock in profits as the price moves in their favor while maintaining a safeguard against adverse price movements.
End of Day (EOD) Exit:
The script includes an "End of Day" (EOD) exit mechanism to automatically close any open positions at the end of the trading day. This feature is designed to manage and control positions when the trading day comes to a close. Here's how it works:
1. Initialization:
At the beginning of each trading day, the script identifies a new trading day using the `is_newbar('D')` condition.
When a new trading day begins, the `newday` variable becomes `true`, indicating the start of a new trading session.
2. Plotting the "End of Day" Signal:
The script includes a plot on the chart to visually represent the "End of Day" signal. This is done using the `plot` function.
The plot is labeled "DayEnd" and is displayed as a comment on the chart. It signifies the EOD point.
3. EOD Exit Condition:
When the script detects that a new trading day has started (`newday == true`), it triggers the EOD exit condition.
At this point, the script proceeds to close all open positions that may have been active during the trading day.
4. Closing Open Positions:
The `strategy.close_all` function is used to close all open positions when the EOD exit condition is met.
This function ensures that any remaining long positions are exited, regardless of their current profit or loss.
The function also includes an `alert_message`, which can be customized to send an alert or notification when positions are closed at EOD.
Purpose of EOD Exit
The "End of Day" exit mechanism serves several essential purposes in the trading strategy:
Risk Management: It helps manage risk by ensuring that positions are not left open overnight when markets can experience increased volatility.
Capital Preservation: Closing positions at EOD can help preserve trading capital by avoiding potential adverse overnight price movements.
Rule-Based Exit: The EOD exit is rule-based and automatic, ensuring that it is consistently applied without emotions or manual intervention.
Scalability: It allows the strategy to be applied to various markets and timeframes where EOD exits may be appropriate.
By incorporating an EOD exit mechanism, the script provides a comprehensive approach to managing positions, taking profits, and minimizing risk as each trading day concludes. This can be especially important in volatile markets like cryptocurrencies, where overnight price swings can be significant.
Backtesting: The script includes a backtesting feature that allows you to test the strategy's performance over historical data. Set the start and end times for backtesting to see how the long-only strategy would have performed in the past.
Trade Execution: If you choose to use this script for live trading, make sure you understand the risks involved. It's essential to set up proper risk management, including position sizing and stop loss orders.
Monitoring: Monitor the long-only strategy's performance over time and be prepared to make adjustments as market conditions change.
Disclaimer: Trading carries a risk of capital loss. This script is provided for educational purposes and as a starting point for your own long-only strategy development. Always do your own research and consider seeking advice from a qualified financial professional before making trading decisions.

Cyatophilum SmartStrategy MakerThis indicator allows you to use any other indicator from the TradingView library and create complex entry and exit conditions with ease thanks to several external inputs. Add risk management to your strategy and backtest it before creating alerts!
Key Features:
1 — Entry Conditions: Traders can define their entry conditions using up to three sources. They can choose from several options such as "Cross," "Crossover," "Crossunder," "Above," "Below," or "Equal" for comparing the selected sources.
2 — Entry Gates: Users can set logical gates (e.g., "AND," "OR," "XOR," "NAND," "XNOR") to combine multiple entry conditions.
3 — Exit Conditions: Similar to entry conditions, traders can define exit conditions based on two sources and select from various comparison options.
4 — Stop Loss: The indicator allows users to enable or disable a stop-loss feature. The stop-loss value is calculated based on a percentage of the base order price.
5 — Take Profit: Traders can set multiple take-profit levels by specifying the number of take profits, a base percentage, and a step value. Take profits can be defined as a percentage from the total volume or the base order.
6 — Safety Orders (DCA): The indicator supports the use of safety orders (Dollar Cost Averaging) to help manage risks. Users can set the number of safety orders, price deviation, step scale, and volume scale.
7 — Backtest Settings: Traders can define the start and end periods for backtesting their strategy. This feature allows them to analyze the performance of their strategy within specific timeframes.
8 — Alerts: The indicator provides the option to create alerts for entry, exit, stop loss, take profit, and safety orders. Users can customize the alert messages using placeholders for dynamic values like price, symbol, and order size.

FRAMA & CPMA Strategy [CSM]The script is an advanced technical analysis tool specifically designed for trading in financial markets, with a particular focus on the BankNifty market. It utilizes two powerful indicators: the Fractal Adaptive Moving Average (FRAMA) and the CPMA (Conceptive Price Moving Average), which is similar to the well-known Chande Momentum Oscillator (CMO) with Center of Gravity (COG) bands.
The FRAMA is a dynamic moving average that adapts to changing market conditions, providing traders with a more precise representation of price movements. The CMO is an oscillator that measures momentum in the market, helping traders identify potential entry and exit points. The COG bands are a technical indicator used to identify potential support and resistance levels in the market.
Custom functions are included in the script to calculate the FRAMA and CSM_CPMA indicators, with the FRAMA function calculating the value of the FRAMA indicator based on user-specified parameters of length and multiplier, while the CSM_CPMA function calculates the value of the CMO with COG bands indicator based on the user-specified parameters of length and various price types.
The script also includes trailing profit and stop loss functions, which while not meeting expectations, have been backtested with a success rate of over 90%, making the script a valuable tool for traders.
Overall, the script provides traders with a comprehensive technical analysis tool for analyzing cryptocurrency markets and making informed trading decisions. Traders can improve their success rate and overall profitability by using smaller targets with trailing profit and minimizing losses. Feedback is always welcome, and the script can be improved for future use. Special thanks go to Tradingview for providing inbuilt functions that are utilized in the script.

Trend Movement S1-TMIdea:
This script combines: Moving Average (MA), Directional Movement (DMI), MACD
When condition of long or short position from all mentioned indicator are met script opens position. Once trend changes, it closes the position.
Then add some filter conditions to avoid noise.
Concept:
(Note that we take the close to get the closing price)
-Using only cross up down with MA will give a reversal point, but the downside is that it can be noisy.
-MACD will show the current trend detected by cross point.
-Then the +DI , -DI , ADX values are taken into account to confirm the price direction and movement strength.
-This strategy solves this problem by combining 2 more moving averages called 2 trend lines 1 long and 1 short. When the short line crosses up, it will show that the price trend is increasing (at this time the background between these 2 lines will be green) and vice versa (red). To determine if the current trend is bullish or bearish . This will avoid buying when price tend to go down.
-However, there will be many points where some more complex logic is needed. It will add conditions and calculate the probabilities before triggering the signals (You can see them through the item symbols B1, B2, ... ).
How it works:
1. The thin line is stand for short term moving average, and the thick line is stand for long term moving average.
If thin lines cross the thick lines, their color and background will turn green, the price is tend to go up (Uptrend).
If thin lines cross down thick lines, their color and background will turn red, the price is tend to go down (Downtrend).
2. Ability to check the checkbox in setting to show the Golden/De*ath cross.
The yellow symbol "+" is the Golden cross.
The black symbol "+" is the De*th cross.
3. Buy and Sell are show clearly on strategy as the buy and sell point. The default source from bar is CLOSE
4. Setting "Buy only" it using for spot market.
5. When "Not buy in down trend" is checked, it will not trigger buy when in down trend (thin lines cross down thick lines like description in 1.)
6. Setting High spread will call Close buy when it match the High spread bar with the High spread % value
7. It provides setting "Back test From date/To date" for backtest feature. You can set "BacktestFrom date" as the begin of test period. If check box "Using To Date" is check: "Backtest To Date" will be the end of test period.
Suitable time frames:
4h, 1D, 1W
* Please note that this logic does not attempt to predict future prices or 100% accurate signal; Strategy Tester are available to test the profitability of this strategy.
(INVITE ONLY indicator. Please direct message or visit website to try it out)
Hope you guys enjoy!
Examples:
BTCUSD 4H
TSLA 4H

Bollinger Band strategy with split, limit, stopEntering a short position after breaking the upper Bollinger Band, entering a long position when entering after breaking the lower Bollinger Band
Provides templates for how to display position average price, stop loss, and profit price using the plot function on the chart, and how to buy splits
After entering the position, if the price crosses the mid-band line, the stop loss is adjusted to the mid-band line.

FFT Strategy Bi-Directional Stop/Profit/Trailing + VMA + AroonThis strategy uses the Fast Fourier Transform inspired from the source code of @tbiktag for the Fast Fourier Transform & @lazybear for the VMA filter.
If you are not familiar with the Fast Fourier transform it is a variation of the Discrete Fourier Transform. Veritasium on youtube has a great video on it with a follow up recommendation from 3brown1blue. In short it will extract all the frequencies from a set of data. @tbiktag laid the groundwork for creating the indicator which will allow you to isolate only those signals which are the most relevant and remove the noise. I recommend having @tbiktag's FFT Transform indicator side by side with this to understand what my variation is doing by setting similar settings .
Using this idea, you can then optimize a strategy to the frequencies that are best. The main entry signal is when the FFT Signal crosses above or below the 0 line .
Included with this strategy is the ability to optionally bi-directionally set:
Stop Loss
Trailing Stop Loss
Take Profit
Trailing Take Profit
Entries are optionally further filtered by use of the VMA using the algorithm from LazyBear which allows you to adjust a variable moving average with 3 market trend detections. Green represents upwards momentum; Blue sideways trading and Red downwards momentum. The idea being to filter out buy or sell entries unless the market is moving in that direction, and this makes a big difference as you can see for yourself when you turn it off or on. Turning it off will change the color of the FFT signal to orange instead of the green, blue, red colors .
I have added 2 custom stop loss types as well for experimentation:
1. VMA Filter stop loss to exit the trade if the VMA detects a market trend direction change matching the rules you have set. I have set this to off by default, but it is there so you can see what affect it may have on other tickers. It can increase the profit factor but usually at a cost of net profit.
2. The Aroon Filter stop loss with different lengths for the short or long direction. For the Aroon strategy (which is a trend change detector) it is considered bullish if the upper line (green in my code) is above 70 and the lower line (red in my code) is below 30 and the opposite for the bearish case. With this in mind, I have set it to filter by default only the extreme ends (99 and 1) to increase profit factor and net profit but I encourage you to try different settings and see how it affects things. Turning this off yields much higher net profit but at the cost of the profit factor and drawdown . To disable this just uncheck the 'Use Aroon Filter Long' (or short) and it will also hide the aroon graphics and crosses on the plot.
I will be adding more features in an attempt to lower the drawdown on this strategy but I hope you enjoy what I have so far!

[D] Dudu 95 Strategy Template ver.1.1.Hello Guys! Nice to meet you all!
This is my Second script after changing My Profile Name!
I updated my strategy template before - I added some filter conditions (EMA, ADX, DMI).
If there's something to update, I will update this script!
Thank you!
-----
I made this based on the open source strategies by jason5480, kevinmck100, myncrypto.
Thank you All!
### Filter
1. Can Choose whether to use filter.
2. Filters Based on ATR, EMA, ADX, and DMI are ready to use.
### StopLoss
1. Can Choose Stop Loss Type: Percent, ATR, Previous Low / High.
2. Can Chosse inputs of each Stop Loss Type.
### Take Profit
1. Can set Risk Reward Ratio for Take Profit.
- To simplify backtest, I erased all other options except RR Ratio.
- You can add Take Profit Logic by adding options in the code.
2. Can set Take Profit Quantity.
### Risk Manangement
1. Can choose whether to use Risk Manangement Logic.
- This controls the Quantity of the Entry.
- e.g. If you want to take 3% risk per trade and stop loss price is 6% below the long entry price,
then 50% of your equity will be used for trade.
2. Can choose How much risk you would take per trade.
### Plot
1. Added Labels to check the data of entry / exit positions.
2. Changed and Added color different from the original one. (green: #02732A, red: #D92332, yellow: #F2E313)

[fpemehd] Strategy TemplateHello Guys! Nice to meet you all!
This is my fourth script!
This is the Strategy Template for traders who wants to make their own strategy.
I made this based on the open source strategies by jason5480, kevinmck100, myncrypto. Thank you All!
### StopLoss
1. Can Choose Stop Loss Type: Percent, ATR, Previous Low / High.
2. Can Chosse inputs of each Stop Loss Type.
### Take Profit
1. Can set Risk Reward Ratio for Take Profit.
- To simplify backtest, I erased all other options except RR Ratio.
- You can add Take Profit Logic by adding options in the code.
2. Can set Take Profit Quantity.
### Risk Manangement
1. Can choose whether to use Risk Manangement Logic.
- This controls the Quantity of the Entry.
- e.g. If you want to take 3% risk per trade and stop loss price is 6% below the long entry price,
then 50% of your equity will be used for trade.
2. Can choose How much risk you would take per trade.
### Plot
1. Added Labels to check the data of entry / exit positions.
2. Changed and Added color different from the original one. (green: #02732A, red: #D92332, yellow: #F2E313)

TTP Kent Strat PROKent Strat PRO trades breakouts using Bollinger Bands together with SuperTrend.
PRO features:
- 3commas bot alerts for long/short bots
- Custom JSON bots alerts
Features:
- Risk/reward ratio parameter
- Longs, shorts and combined positions.
- Breakout settings
- Trailing SL, trailing TP
- Use of latest candles to place the SL using a lookback parameter (how many candles to look back for a low/high price)
- Select your SL between the ATR trendline and the latest candle: the closest or furthest away value
- Show the trendline
- Backtest mode for accurate backtests
- Signal mode for live price accurate signals
- Date range backtesting
Filters:
- EMA 200 filter and timeframe selector. This filter can be used to trade with the trend: open longs on an uptrend and shorts on a downtrend.
- ADX filter using threshold. This filter can be used to filter entries where the trend is not very strong.
- ADX pointing up. ADX values pointing up and above certain threshold can improve entries.
- Relative volume filter based on the volume being X% above the MA of the Volume. Trading with volume can help filtering out bad trades.
Example setup:
1) pick BINANCE:ETHUSDT chart, 15 min chart
2) trade longs + shorts
3) pick ratio 3
4) trailing SL checked
5) trailing TP unchecked
7) stop loss "furthest"
8) candle loopback 30
9) BB period 21, dev 1, ATR filter on, atr period 5
10) EMA filter on, 15 min
11) ADX off
12) Volume filter on set to 60%
