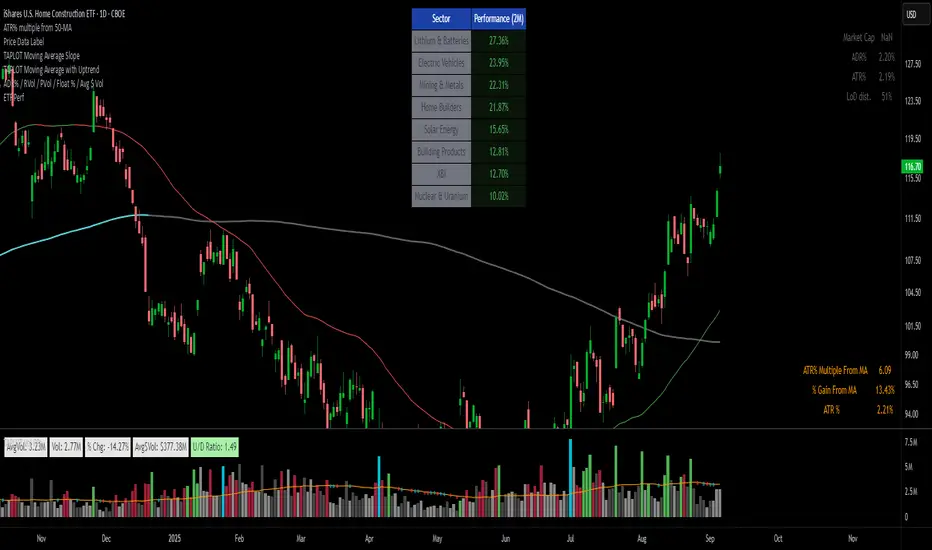
ETFs Sector PerformanceDisplays a table of the Top 8 performing ETFs over a selected period (1M / 2M / 3M / 6M) to quickly identify industry strength.
Pre-Set Universe (39 ETFs)
ITA — iShares U.S. Aerospace & Defense ETF
DBA — Invesco DB Agriculture Fund
BOTZ — Global X Robotics & Artificial Intelligence ETF
JETS — U.S. Global Jets ETF
XLB — Materials Select Sector SPDR Fund
XBI — SPDR S&P Biotech ETF
PKB — Invesco Dynamic Building & Construction ETF
ICLN — iShares Global Clean Energy ETF
SKYY — First Trust Cloud Computing ETF
DBC — Invesco DB Commodity Index Tracking Fund
XLY — Consumer Discretionary Select Sector SPDR Fund
XLP — Consumer Staples Select Sector SPDR Fund
BLOK — Amplify Transformational Data Sharing ETF
KARS — KraneShares Electric Vehicles & Future Mobility ETF
XLE — Energy Select Sector SPDR Fund
ESPO — VanEck Video Gaming and eSports ETF
XLF — Financial Select Sector SPDR Fund
PBJ — Invesco Dynamic Food & Beverage ETF
ITB — iShares U.S. Home Construction ETF
XLI — Industrial Select Sector SPDR Fund
PAVE — Global X U.S. Infrastructure Development ETF
PEJ — Invesco Dynamic Leisure & Entertainment ETF
LIT — Global X Lithium & Battery Tech ETF
IHI — iShares U.S. Medical Devices ETF
XME — SPDR S&P Metals & Mining ETF
FCG — First Trust Natural Gas ETF
URA — Global X Uranium ETF
PPH — VanEck Pharmaceutical ETF
QTUM — Defiance Quantum Computing & Machine Learning ETF
IYR — iShares U.S. Real Estate ETF
XRT — SPDR S&P Retail ETF
SOXX — iShares Semiconductor ETF
BOAT — SonicShares Global Shipping ETF
IGV — iShares Expanded Tech-Software Sector ETF
TAN — Invesco Solar ETF
SLX — VanEck Steel ETF
IYZ — iShares U.S. Telecommunications ETF
IYT — iShares U.S. Transportation ETF
XLU — Utilities Select Sector SPDR Fund
Statistics
Theil-Sen Line Filter [BackQuant]Theil-Sen Line Filter
A robust, median-slope baseline that tracks price while resisting outliers. Designed for the chart pane as a clean, adaptive reference line with optional candle coloring and slope-flip alerts.
What this is
A trend filter that estimates the underlying slope of price using a Theil-Sen style median of past slopes, then advances a baseline by a controlled fraction of that slope each bar. The result is a smooth line that reacts to real directional change while staying calm through noise, gaps, and single-bar shocks.
Why Theil-Sen
Classical moving averages are sensitive to outliers and shape changes. Ordinary least squares is sensitive to large residuals. The Theil-Sen idea replaces a single fragile estimate with the median of many simple slopes, which is statistically robust and less influenced by a few extreme bars. That makes the baseline steadier in choppy conditions and cleaner around regime turns.
What it plots
Filtered baseline that advances by a fraction of the robust slope each bar.
Optional candle coloring by baseline slope sign for quick trend read.
Alerts when the baseline slope turns up or down.
How it behaves (high level)
Looks back over a fixed window and forms many “current vs past” bar-to-bar slopes.
Takes the median of those slopes to get a robust estimate for the bar.
Optionally caps the magnitude of that per-bar slope so a single volatile bar cannot yank the line.
Moves the baseline forward by a user-controlled fraction of the estimated slope. Lower fractions are smoother. Higher fractions are more responsive.
Inputs and what they do
Price Source — the series the filter tracks. Typical is close; HL2 or HLC3 can be smoother.
Window Length — how many bars to consider for slopes. Larger windows are steadier and slower. Smaller windows are quicker and noisier.
Response — fraction of the estimated slope applied each bar. 1.00 follows the robust slope closely; values below 1.00 dampen moves.
Slope Cap Mode — optional guardrail on each bar’s slope:
None — no cap.
ATR — cap scales with recent true range.
Percent — cap scales with price level.
Points — fixed absolute cap in price points.
ATR Length / Mult, Cap Percent, Cap Points — tune the chosen cap mode’s size.
UI Settings — show or hide the line, paint candles by slope, choose long and short colors.
How to read it
Up-slope baseline and green candles indicate a rising robust trend. Pullbacks that do not flip the slope often resolve in trend direction.
Down-slope baseline and red candles indicate a falling robust trend. Bounces against the slope are lower-probability until proven otherwise.
Flat or frequent flips suggest a range. Increase window length or decrease response if you want fewer whipsaws in sideways markets.
Use cases
Bias filter — only take longs when slope is up, shorts when slope is down. It is a simple way to gate faster setups.
Stop or trail reference — use the line as a trailing guide. If price closes beyond the line and the slope flips, consider reducing exposure.
Regime detector — widen the window on higher timeframes to define major up vs down regimes for asset rotation or risk toggles.
Noise control — enable a cap mode in very volatile symbols to retain the line’s continuity through event bars.
Tuning guidance
Quick swing trading — shorter window, higher response, optionally add a percent cap to keep it stable on large moves.
Position trading — longer window, moderate response. ATR cap tends to scale well across cycles.
Low-liquidity or gappy charts — prefer longer window and a points or ATR cap. That reduces jumpiness around discontinuities.
Alerts included
Theil-Sen Up Slope — baseline’s one-bar change crosses above zero.
Theil-Sen Down Slope — baseline’s one-bar change crosses below zero.
Strengths
Robust to outliers through median-based slope estimation.
Continuously advances with price rather than re-anchoring, which reduces lag at turns.
User-selectable slope caps to tame shock bars without over-smoothing everything.
Minimal visuals with optional candle painting for fast regime recognition.
Notes
This is a filter, not a trading system. It does not account for execution, spreads, or gaps. Pair it with entry logic, risk management, and higher-timeframe context if you plan to use it for decisions.

Retail Sentiment Indicator - Multi-Asset CFD & Fear/Greed IndexRetail Sentiment Indicator - Multi-Asset CFD & Fear/Greed Index
Overview
The Retail Sentiment Indicator provides real-time sentiment data for major financial instruments including stocks, forex, commodities, and cryptocurrencies. This indicator displays retail trader positioning and market sentiment using CFD data and fear/greed indices.
Methodology and Scale Calculation
This indicator operates on a **-50 to +50 scale** with zero representing perfect market equilibrium.
Scale Interpretation:
- **Zero (0)**: Market balance - exactly 50% of investors buying, 50% selling
- **Positive values**: Majority buying pressure
- Example: If 63% of investors are buying, the indicator shows +13 (63 - 50 = +13)
- **Negative values**: Majority selling pressure
- Example: If 92% of investors are selling, the indicator shows -42 (50 - 92 = -42)
BTC Fear & Greed Index Scaling:
The original `BTC FEAR&GREED` index is natively scaled from 0-100 by its creator. In our indicator, this data has been rescaled to also fit the -50 to +50 range for consistency with other sentiment data sources.
This unified scaling approach allows for direct comparison across all instruments and data sources within the indicator.
-Important Data Source Selection-
Bitcoin (BTC) Data Sources
When viewing Bitcoin charts, the indicator offers **two different data sources**:
1. **Default Auto-Mode**: `BTCUSD Retail CFD` - Retail CFD traders sentiment data (automatically loaded).
2. **Manual Selection**: `BTC FEAR&GREED` - Fear & Greed Index from website: alternative dot me
**To access BTC Fear & Greed Index**: Input settings -> disable checkbox "Auto-load Sentiment Data" -> manually select "BTC FEAR&GREED" from the dropdown menu.
US Stock Market Data Sources
For US stocks and indices (S&P 500, NASDAQ, Dow Jones), there are **two data source options**:
1. **Default Auto-Mode**: Individual retail CFD sentiment data for each instrument
2. **Manual Selection**: `SNN FEAR&GREED` - SNN's Fear & Greed Index covering the overall US market sentiment. SNN was used as the name to avoid any potential trademark infringement.
**To access SNN Fear & Greed Index**: When viewing US market charts, disable in input settings checkbox "Auto-load Sentiment Data" and manually select "SNN FEAR&GREED" from the dropdown menu.
This distinction allows traders to choose between **instrument-specific retail sentiment** (auto-mode) or **broader market sentiment indices** (manual selection).
Features
- **Auto-Detection**: Automatically loads sentiment data based on the current chart symbol
- **Manual Selection**: Choose from 40+ supported instruments when auto-detection is unavailable
- **Multiple Data Sources**: Combines retail CFD sentiment with Fear & Greed indices
- **Visual Zones**: Clear greed/fear zones with color-coded backgrounds
- **Real-time Updates**: Live sentiment data from merged data sources
Supported Instruments
Major Indices
- S&P 500, NASDAQ, Dow Jones 30, DAX
Forex Pairs
- Major pairs: EURUSD, GBPUSD, USDJPY, USDCHF, USDCAD
- Cross pairs: EURJPY, GBPJPY, AUDUSD, NZDUSD, and 20+ others
Commodities
- Precious metals: Gold (XAUUSD), Silver (XAGUSD)
- Energy: WTI Oil
- Agricultural: Wheat, Coffee
- Industrial: Copper
Cryptocurrencies
- Bitcoin (BTC) sentiment data
- BTC & SNN Fear & Greed indices
How to Use
1. **Auto Mode** (Default): Enable "Auto-load Sentiment Data" to automatically display sentiment for the current chart symbol
2. **Manual Mode**: Disable auto-load and select from the dropdown menu for specific instruments
3. **Interpretation**:
- Values above 0 (green) indicate retail greed/bullish sentiment
- Values below 0 (red) indicate retail fear/bearish sentiment
- Fear & Greed indices use 0-100 scale (50 is neutral)
Data Sources
This indicator uses curated sentiment data from retail CFD providers and established fear/greed indices. Data is updated regularly and sourced from reputable financial data providers.
Trading Strategy & Market Philosophy
Contrarian Trading Approach
The primary purpose of this indicator is based on the fundamental market principle that **the majority of retail investors are often wrong**, and markets typically move opposite to the positions held by the majority of market participants.
Key Strategy Guidelines:
- **Contrarian Signal**: When the majority of users are positioned on one side of the market, there is statistically greater market advantage in taking positions in the opposite direction
- **Trend Exhaustion Signal**: An interesting observed phenomenon occurs when, during a long-lasting trend where the majority of investors have consistently been on the wrong side, the Sentiment indicator suddenly shows that the majority has flipped and opened positions in the direction of that long-running trend. This is often a signal of fuel exhaustion for further movement in that direction
Interpretation Examples
- High greed readings (majority bullish) → Consider bearish opportunities
- High fear readings (majority bearish) → Consider bullish opportunities
- Sudden sentiment flip during established trends → Potential trend reversal signal
Technical Notes
- Built with PineScript v6
- Dynamic symbol detection with fallback options
- Optimized for performance with minimal resource usage
- Color-coded visualization with customizable zones
Data Sources & Expansion
Acknowledgments
We extend our gratitude to **TradingView** for enabling the use of custom data feeds based on GitHub repositories, making this comprehensive sentiment analysis possible.
Data Expansion Opportunities
As the operator of this indicator, I am **open to suggestions for new data sources** that could be integrated and published. If you have ideas for additional instruments or sentiment data:
How to Submit Suggestions:
1. Send a **private message** with your proposal
2. Include: **instrument/data type**, **source**, and **brief description**
3. If technically feasible, we will work to import and publish the data
Data Infrastructure Status
Current Data Upload Process:
Please note that sentiment data uploads may occasionally experience minor interruptions. However, this should not pose significant issues as sentiment data typically changes gradually rather than rapidly.
Infrastructure Development:
We are actively working on establishing permanent cloud-based infrastructure to ensure continuous, automated data collection and upload processes. This will provide more reliable and consistent data availability in the future.
Disclaimer
This indicator is for educational and informational purposes only. Sentiment data should be used as part of a comprehensive trading strategy and not as the sole basis for trading decisions. Past performance does not guarantee future results. The contrarian approach described is a market theory and may not always produce profitable results.

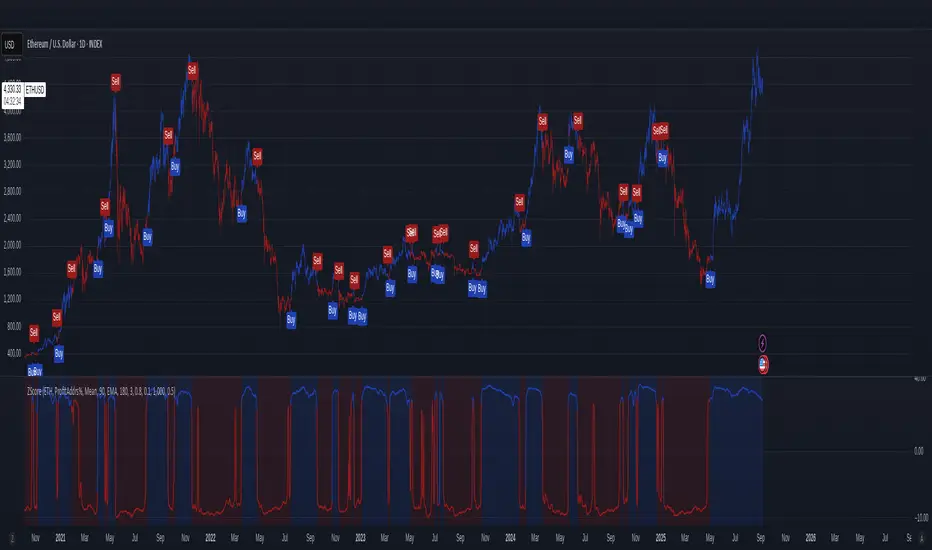
On-Chain Metrics & Z-Mode SelectionThis indicator provides an on-chain metric analysis framework for cryptocurrencies (currently limited to) BTC and ETH; allowing users to select from popular metrics such as SOPR, Profit Addresses %, NUPL, or MVRV.
It enables various analyses on the chosen metric to capture momentum and rate of change dynamics over time.
Analyses include:
Normalization techniques utilizing Mean or Median with standard deviation, as well as a 'Robust' method using interquartile range-based Z-scoring to accommodate skewed distributions, or raw values without normalization.
An optional differential calculation that highlights the rate of change (first derivative) of the metric.
Moving average smoothing with up to two passes, supporting EMA, SMA, or WMA types.
Optional sigmoid-based compression that scales and centers the indicator output, improving interpretability, mitigating extreme outliers, and allowing the user to scale the output so that the step size or increment of the long and short thresholds remains within a workable range.
Buy and sell signals are generated based on configurable long and short thresholds applied to the processed output.
Visual components such as trend colouring, threshold lines, background shading, and labels make it simple for traders to identify entry signals.
This indicator is suitable for those looking to integrate blockchain behavioral insights into their trading decisions.
Overall, this script transforms complex on-chain data into actionable trade signals by combining adaptive normalization and smoothing techniques. Its versatility and multi-metric support make it a valuable tool for both market monitoring and strategy development.
No financial decisions should be made based solely on this indicator. Always conduct your own research. .
Acknowledgements
Inspiration drawn from: CipherDecoded
BTC Sigma CloudOverview
The BTC Sigma Cloud indicator calculates and displays 1, 2, and 3 sigma price movements for Bitcoin (BTC) on a rolling basis, visualized as a cloud. It shows historical volatility bands and projects them forward for the next 7 days.
Settings:
Vol Lookback: Default is 20 periods. Adjust to change the volatility calculation window.
Interpretation:
Cloud Bands: The cloud consists of three shaded layers representing 1σ, 2σ, and 3σ moves above and below the current price.
1σ (Innermost): 68% probability of price staying within this range.
2σ (Middle): 95% probability.
3σ (Outermost): 99.7% probability.
Historical View: The cloud tracks past price movements based on volatility.
Projection: The cloud extends 7 days forward, indicating potential price ranges based on current volatility.
Labels: Subtle labels (1σ, -1σ, 2σ, -2σ, 3σ, -3σ) mark the upper and lower bounds of each sigma level on the latest bar for clarity.
Trading Use:
Use the cloud to gauge potential support/resistance zones.
Monitor price behavior near sigma levels for breakout or reversal signals.
The projected cloud helps anticipate future price ranges for planning trades.
Notes
Best used on daily charts for Bitcoin.
Adjust the lookback period to suit shorter or longer-term analysis.
Combine with other indicators for confirmation.

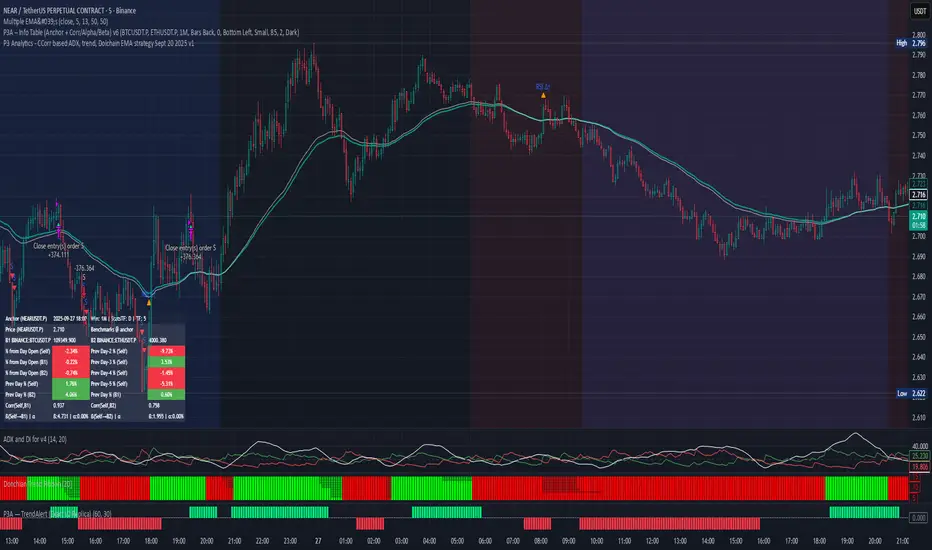
PPP – Info Table (Anchor + Corr/Alpha/Beta) v3PPP – Info Table (Anchor + Corr/Alpha/Beta)
- By P3 Analytics, run by Puranam Pradeep Picasso Sharma
🔎 Overview
This indicator creates a clean, dynamic information table on your chart that lets you quickly analyze how your chosen asset is performing relative to BTC, ETH, or any other benchmarks.
With a single glance, you can see:
% change from today’s open (for the anchor asset, BTC, and ETH)
Previous day % change (self + benchmarks)
Correlation, Beta, and Alpha statistics for the selected window (1W, 1M, 1Y)
Anchor values at any bar you choose (via Bars Back or Anchor Time)
Perfect for traders who want to measure coin strength vs benchmarks and make better rotation, risk, or hedging decisions.
📊 Key Metrics
Correlation (Corr): How closely the asset moves with the benchmark.
+1 = moves together, 0 = no relation, -1 = moves opposite.
Beta (β): Sensitivity of returns vs the benchmark.
β = 1 → moves 1:1 with BTC.
β > 1 → more volatile (amplifies BTC moves).
β < 1 → less volatile (defensive).
Alpha (α): Excess return beyond what Beta predicts.
Positive α = outperforming benchmark-adjusted expectation.
Negative α = underperforming.
⚙️ Features
Flexible Anchor Mode:
Bars Back → quickly step through bars.
Time → pin analysis to a specific historical candle.
Customizable Benchmarks: Default BTC & ETH (futures), but replaceable with any ticker.
Adjustable Stats Window:
1 Week, 1 Month, 1 Year (auto-scales if using chart timeframe).
Compact Mode for a smaller table layout.
Dark/Light Theme, font size, corner placement, transparency, and decimal control.
Runs efficiently with minimal chart clutter.
🧑💻 About P3 Analytics
This indicator is developed under P3 Analytics, a research & trading technology initiative led by Puranam Pradeep Picasso Sharma.
P3 Analytics builds tools that merge machine learning, statistics, and trading strategy into accessible products for traders across crypto, equities, forex, and commodities.
✅ How to Use
Add indicator to your chart.
In settings:
Pick your benchmarks (default = BTCUSDT.P, ETHUSDT.P).
Choose your anchor (Bars Back or Time).
Set window length for correlation/alpha/beta.
Read the table:
Left side = your asset.
Right side = benchmarks.
Colors: Green = positive % change, Red = negative.
🚀 Why Use This?
Quickly compare your asset vs BTC/ETH without juggling multiple charts.
Spot whether a coin is truly leading or just following BTC.
Identify outperformance (alpha) coins for rotation or trend plays.
Manage risk by knowing which assets are high beta (high leverage-like moves).
✦ Indicator by P3 Analytics
✦ Created & published by Puranam Pradeep Picasso Sharma
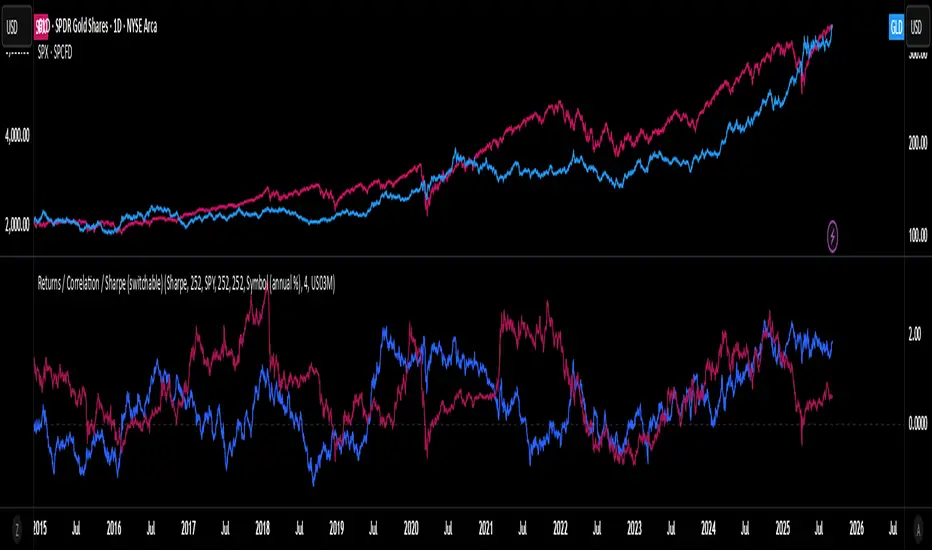
Rolling Performance Toolkit (Returns, Correlation and Sharpe)This script provides a flexible toolkit for evaluating rolling performance metrics between any asset and a benchmark.
Features:
Library-based: Built on a custom utilities library for consistent return and statistics calculations.
Rolling Window Control: Choose the lookback period (in days) to calculate metrics.
Multiple Modes: Toggle between Rolling Returns, Rolling Correlation, and Rolling Sharpe Ratio.
Benchmark Comparison: Compare your selected ticker against a benchmark (default: S&P 500 / SPX), but you can easily switch to any symbol.
Risk-Free Rate Options: Choose from zero, a constant annual % rate, or a proxy symbol (default: US03M – 3-Month Treasury Yield).
Annualized Sharpe: Sharpe ratios are annualized by default (×√252) for intuitive interpretation.
This tool is useful for traders and investors who want to monitor relative performance, diversification benefits, or risk-adjusted returns over time.
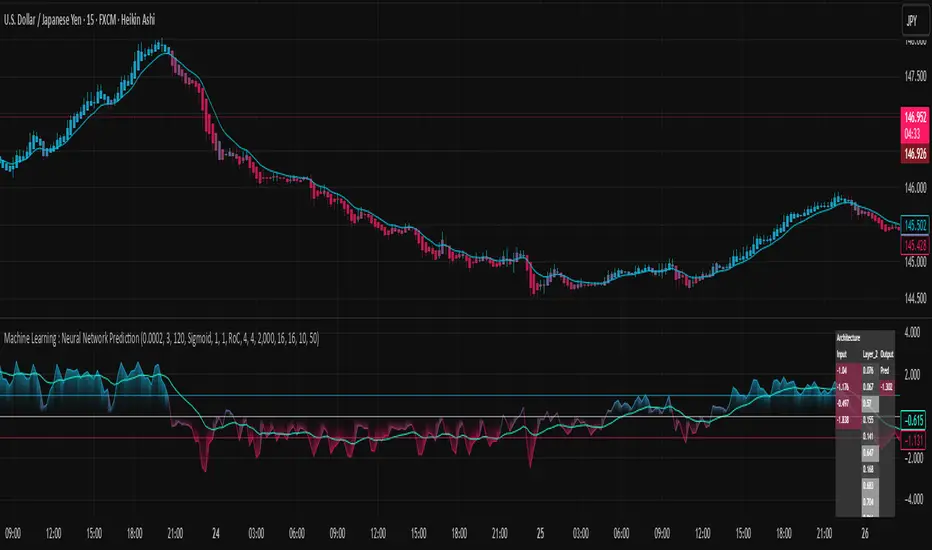
Machine Learning : Neural Network Prediction -EasyNeuro-Machine Learning: Neural Network Prediction
— An indicator that learns and predicts price movements using a neural network —
Overview
The indicator “Machine Learning: Neural Network Prediction” uses price data from the chart and applies a three-layer Feedforward Neural Network (FNN) to estimate future price movements.
Key Features
Normally, training and inference with neural networks require advanced programming languages that support machine learning frameworks (such as TensorFlow or PyTorch) as well as high-performance hardware with GPUs. However, this indicator independently implements the neural network mechanism within TradingView’s Pine Script environment, enabling real-time training and prediction directly on the chart.
Since Pine Script does not support matrix operations, the backpropagation algorithm—necessary for neural network training—has been implemented entirely through scalar operations. This unique approach makes the creation of such a groundbreaking indicator possible.
Significance of Neural Networks
Neural networks are a core machine learning method, forming the foundation of today’s widely used generative AI systems, such as OpenAI’s GPT and Google’s Gemini. The feedforward neural network adopted in this indicator is the most classical architecture among neural networks. One key advantage of neural networks is their ability to perform nonlinear predictions.
All conventional indicators—such as moving averages and oscillators like RSI—are essentially linear predictors. Linear prediction inherently lags behind past price fluctuations. In contrast, nonlinear prediction makes it theoretically possible to dynamically anticipate future price movements based on past patterns. This offers a significant benefit for using neural networks as prediction tools among the multitude of available indicators.
Moreover, neural networks excel at pattern recognition. Since technical analysis is largely based on recognizing market patterns, this makes neural networks a highly compatible approach.
Structure of the Indicator
This indicator is based on a three-layer feedforward neural network (FNN). Every time a new candlestick forms, the model samples random past data and performs online learning using stochastic gradient descent (SGD).
SGD is known as a more versatile learning method compared to standard gradient descent, particularly effective for uncertain datasets like financial market price data. Considering Pine Script’s computational constraints, SGD is a practical choice since it can learn effectively from small amounts of data. Because online learning is performed with each new candlestick, the indicator becomes a little “smarter” over time.
Adjustable Parameters
Learning Rate
Specifies how much the network’s parameters are updated per training step. Values between 0.0001 and 0.001 are recommended. Too high causes divergence and unstable predictions, while too low prevents sufficient learning.
Iterations per Online Learning Step
Specifies how many training iterations occur with each new candlestick. More iterations improve accuracy but may cause timeouts if excessive.
Seed
Random seed for initializing parameters. Changing the seed may alter performance.
Architecture Settings
Number of nodes in input and hidden layers:
Increasing input layer nodes allows predictions based on longer historical periods. Increasing hidden layer nodes increases the network’s interpretive capacity, enabling more flexible nonlinear predictions. However, more nodes increase computational cost exponentially, risking timeouts and overfitting.
Hidden layer activation function (ReLU / Sigmoid / Tanh):
Sigmoid:
Classical function, outputs between 0–1, approximates a normal distribution.
Tanh:
Similar to Sigmoid but outputs between -1 and 1, centered around 0, often more accurate.
ReLU:
Simple function (outputs input if ≥ 0, else 0), efficient and widely effective.
Input Features (selectable and combinable)
RoC (Rate of Change):
Measures relative price change over a period. Useful for predicting movement direction.
RSI (Relative Strength Index):
Oscillator showing how much price has risen/fallen within a period. Widely used to anticipate direction and momentum.
Stdev (Standard Deviation, volatility):
Measures price variability. Useful for volatility prediction, though not directional.
Optionally, input data can be smoothed to stabilize predictions.
Other Parameters
Data Sampling Window:
Period from which random samples are drawn for SGD.
Prediction Smoothing Period:
Smooths predictions to reduce spikes, especially when RoC is used.
Prediction MA Period:
Moving average applied to smoothed predictions.
Visualization Features
The internal state of the neural network is displayed in a table at the upper-right of the chart:
Network architecture:
Displays the structure of input, hidden, and output layers.
Node activations:
Shows how input, hidden, and output node values dynamically change with market conditions.
This design allows traders to intuitively understand the inner workings of the neural network, which is often treated as a black box.
Glossary of Terms
Feature:
Input variables fed to the model (RoC/RSI/Stdev).
Node/Unit:
Smallest computational element in a layer.
Activation Function:
Nonlinear function applied to node outputs (ReLU/Sigmoid/Tanh).
MSE (Mean Squared Error):
Loss function using average squared errors.
Gradient Descent (GD/SGD):
Optimization method that gradually adjusts weights in the direction that reduces loss.
Online Learning:
Training method where the model updates sequentially with each new data point.
Deadband Hysteresis Filter [BackQuant]Deadband Hysteresis Filter
What this is
This tool builds a “debounced” price baseline that ignores small fluctuations and only reacts when price meaningfully departs from its recent path. It uses a deadband to define how much deviation matters and a hysteresis scheme to avoid rapid flip-flops around the decision boundary. The baseline’s slope provides a simple trend cue, used to color candles and to trigger up and down alerts.
Why deadband and hysteresis help
They filter micro noise so the baseline does not react to every tiny tick.
They stabilize state changes. Hysteresis means the rule to start moving is stricter than the rule to keep holding, which reduces whipsaw.
They produce a stepped, readable path that advances during sustained moves and stays flat during chop.
How it works (conceptual)
At each bar the script maintains a running baseline dbhf and compares it to the input price p .
Compute a base threshold baseTau using the selected mode (ATR, Percent, Ticks, or Points).
Build an enter band tauEnter = baseTau × Enter Mult and an exit band tauExit = baseTau × Exit Mult where typically Exit Mult < Enter Mult .
Let diff = p − dbhf .
If diff > +tauEnter , raise the baseline by response × (diff − tauEnter) .
If diff < −tauEnter , lower the baseline by response × (diff + tauEnter) .
Otherwise, hold the prior value.
Trend state is derived from slope: dbhf > dbhf → up trend, dbhf < dbhf → down trend.
Inputs and what they control
Threshold mode
ATR — baseTau = ATR(atrLen) × atrMult . Adapts to volatility. Useful when regimes change.
Percent — baseTau = |price| × pctThresh% . Scale-free across symbols of different prices.
Ticks — baseTau = syminfo.mintick × tickThresh . Good for futures where tick size matters.
Points — baseTau = ptsThresh . Fixed distance in price units.
Band multipliers and response
Enter Mult — outer band. Price must travel at least this far from the baseline before an update occurs. Larger values reject more noise but increase lag.
Exit Mult — inner band for hysteresis. Keep this smaller than Enter Mult to create a hold zone that resists small re-entries.
Response — step size when outside the enter band. Higher response tracks faster; lower response is smoother.
UI settings
Show Filtered Price — plots the baseline on price.
Paint candles — colors bars by the filtered slope using your long/short colors.
How it can be used
Trend qualifier — take entries only in the direction of the baseline slope and skip trades against it.
Debounced crossovers — use the baseline as a stabilized surrogate for price in moving-average or channel crossover rules.
Trailing logic — trail stops a small distance beyond the baseline so small pullbacks do not eject the trade.
Session aware filtering — widen Enter Mult or switch to ATR mode for volatile sessions; tighten in quiet sessions.
Parameter interactions and tuning
Enter Mult vs Response — both govern sensitivity. If you see too many flips, increase Enter Mult or reduce Response. If turns feel late, do the opposite.
Exit Mult — widening the gap between Enter and Exit expands the hold zone and reduces oscillation around the threshold.
Mode choice — ATR adapts automatically; Percent keeps behavior consistent across instruments; Ticks or Points are useful when you think in fixed increments.
Timeframe coupling — on higher timeframes you can often lower Enter Mult or raise Response because raw noise is already reduced.
Concrete starter recipes
General purpose — ATR mode, atrLen=14 , atrMult=1.0–1.5 , Enter=1.0 , Exit=0.5 , Response=0.20 . Balanced noise rejection and lag.
Choppy range filter — ATR mode, increase atrMult to 2.0, keep Response≈0.15 . Stronger suppression of micro-moves.
Fast intraday — Percent mode, pctThresh=0.1–0.3 , Enter=1.0 , Exit=0.4–0.6 , Response=0.30–0.40 . Quicker turns for scalping.
Futures ticks — Ticks mode, set tickThresh to a few spreads beyond typical noise; start with Enter=1.0 , Exit=0.5 , Response=0.25 .
Strengths
Clear, explainable logic with an explicit noise budget.
Multiple threshold modes so the same tool fits equities, futures, and crypto.
Built-in hysteresis that reduces flip-flop near the boundary.
Slope-based coloring and alerts that make state changes obvious in real time.
Limitations and notes
All filters add lag. Larger thresholds and smaller response trade faster reaction for fewer false turns.
Fixed Points or Ticks can under- or over-filter when volatility regime shifts. ATR adapts, but will also expand bands during spikes.
On extremely choppy symbols, even a well tuned band will step frequently. Widen Enter Mult or reduce Response if needed.
This is a chart study. It does not include commissions, slippage, funding, or gap risks.
Alerts
DBHF Up Slope — baseline turns from down to up on the latest bar.
DBHF Down Slope — baseline turns from up to down on the latest bar.
Implementation details worth knowing
Initialization sets the baseline to the first observed price to avoid a cold-start jump.
Slope is evaluated bar-to-bar. The up and down alerts check for a change of slope rather than raw price crossings.
Candle colors and the baseline plot share the same long/short palette with transparency applied to the line.
Practical workflow
Pick a mode that matches how you think about distance. ATR for volatility aware, Percent for scale-free, Ticks or Points for fixed increments.
Tune Enter Mult until the number of flips feels appropriate for your timeframe.
Set Exit Mult clearly below Enter Mult to create a real hold zone.
Adjust Response last to control “how fast” the baseline chases price once it decides to move.
Final thoughts
Deadband plus hysteresis gives you a principled way to “only care when it matters.” With a sensible threshold and response, the filter yields a stable, low-chop trend cue you can use directly for bias or plug into your own entries, exits, and risk rules.

Valid H/LsOverview
Advanced breakout indicator that identifies valid high and low levels with statistical performance analytics. Features confirmation systems, visual customization, and historical MFE/MAE analysis to help traders identify high-probability setups.
Key Features
📈 Smart Breakout Detection
Automatically identifies confirmed valid high/low breakout levels
Shows potential setups before confirmation with different styling
Filters setups using institutional order flow (I/O) signals
🎯 Visual Display
Dynamic Lines: Full extension or shrinking previous lines for cleaner charts
Color Coding: Customizable colors for highs (red) and lows (green)
Confirmation Candles: Highlights breakout confirmation with custom colors
Background Boxes: Optional zone highlighting around valid levels
📊 MFE/MAE Analytics
Multi-Timeframe: 1-hour and 3-hour performance analysis
Historical Data: Analyzes 10-500 past setups for profit/risk statistics
Profit Targets: MFE lines show typical profit potential
Risk Levels: MAE lines indicate common drawdown zones
How to Use
Green = Bullish: Valid low breakout levels
Red = Bearish: Valid high breakout levels
Solid Lines: Confirmed setups ready for trading
Dashed Lines: Potential setups awaiting confirmation
Use Analytics: MFE for profit targets, MAE for stop loss placement
Key Settings
Show Valid Highs/Lows: Toggle breakout level display
Only Show with I/O Prints: Filter for institutional signals only
Line Display Mode: Choose full extension or shrinking lines
Show MFE/MAE Analytics: Enable statistical overlays
Analytics Lookback: Set number of historical setups to analyze (10-500)
Timeframe Options: Toggle 1-hour and 3-hour analytics
Best Practices
Wait for solid line confirmation before entries
Use MFE analytics for realistic profit targets
Use MAE analytics for appropriate stop losses
Combine multiple timeframe analytics for better context
Always apply proper risk management
Technical Notes
Works on all timeframes and markets
No repainting once confirmed
Analytics update dynamically with new data
Optimized for breakout trading strategies

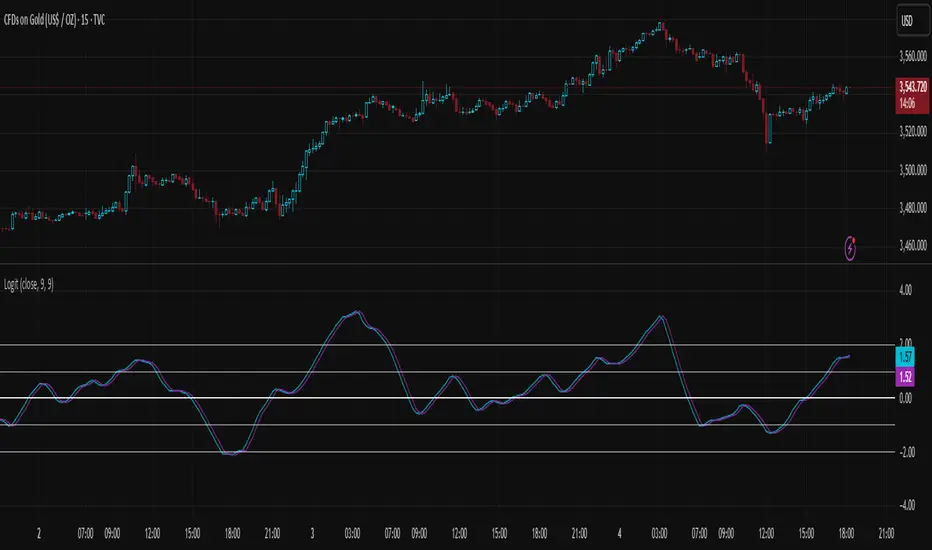
Logit Transform -EasyNeuro-Logit Transform
This script implements a novel indicator inspired by the Fisher Transform, replacing its core arctanh-based mapping with the logit transform. It is designed to highlight extreme values in bounded inputs from a probabilistic and statistical perspective.
Background: Fisher Transform
The Fisher Transform, introduced by John Ehlers , is a statistical technique that maps a bounded variable x (between a and b) to a variable approximately following a Gaussian distribution. The standard form for a normalized input y (between -1 and 1) is F(y) = 0.5 * ln((1 + y)/(1 - y)) = arctanh(y).
This transformation has the following properties:
Linearization of extremes:
Small deviations around the mean are smooth, while movements near the boundaries are sharply amplified.
Gaussian approximation:
After transformation, the variable approximates a normal distribution, enabling analytical techniques that assume normality.
Probabilistic interpretation:
The Fisher Transform can be linked to likelihood ratio tests, where the transform emphasizes deviations from median or expected values in a statistically meaningful way.
In technical analysis, this allows traders to detect turning points or extreme market conditions more clearly than raw oscillators alone.
Logit Transform as a Generalization
The logit function is defined for p between 0 and 1 as logit(p) = ln(p / (1 - p)).
Key properties of the logit transform:
Maps probabilities in (0, 1) to the entire real line, similar to the Fisher Transform.
Emphasizes values near 0 and 1, providing sharp differentiation of extreme states.
Directly interpretable in terms of odds and likelihood ratios: logit(p) = ln(odds).
From a statistical viewpoint, the logit transform corresponds to the canonical link function in binomial generalized linear models (GLMs). This provides a natural interpretation of the transformed variable as the logarithm of the likelihood ratio between success and failure states, giving a rigorous probabilistic framework for extreme value detection.
Theoretical Advantages
Distributional linearization:
For inputs that can be interpreted as probabilities, the logit transform creates a variable approximately linear in log-odds, similar to Fisher’s goal of Gaussianization but with a probabilistic foundation.
Extreme sensitivity:
By amplifying small differences near 0 or 1, it allows for sharper detection of market extremes or overbought/oversold conditions.
Statistical interpretability:
Provides a link to statistical hypothesis testing via likelihood ratios, enabling integration with probabilistic models or risk metrics.
Applications in Technical Analysis
Oscillator enhancement:
Apply to RSI, Stochastic Oscillators, or other bounded indicators to accentuate extreme values with a well-defined probabilistic interpretation.
Comparative study:
Use alongside the Fisher Transform to analyze the effect of different nonlinear mappings on market signals, helping to uncover subtle nonlinearity in price behavior.
Probabilistic risk assessment:
Transforming input series into log-odds allows incorporation into statistical risk models or volatility estimation frameworks.
Practical Considerations
The logit diverges near 0 and 1, requiring careful scaling or smoothing to avoid numerical instability. As with the Fisher Transform, this indicator is not a standalone trading signal and should be combined with complementary technical or statistical indicators.
In summary, the Logit Transform builds upon the Fisher Transform’s theoretical foundation while introducing a probabilistically rigorous mapping. By connecting extreme-value detection to odds ratios and likelihood principles, it provides traders and analysts with a mathematically grounded tool for examining market dynamics.
Artharjan NSE Sectors Relative Strength DashboardArtharjan NSE Sectors Relative Strength Dashboard
This script provides a comprehensive dashboard for analyzing the relative strength of NSE sectors compared to a benchmark index (default: NIFTY). It is designed to give traders and investors a consolidated snapshot of sector performance, momentum, and short-term trend strength — all in one visual table.
Core Purpose
The goal is to simplify sector rotation analysis by combining relative strength, rate of change, momentum, and trend classification into a sortable, color-coded dashboard. Instead of scanning multiple charts, users can rely on this single panel for quick decision-making.
Key Features
Benchmark Comparison
Every sector is measured against the benchmark index (default: NIFTY). This allows users to spot outperforming or underperforming sectors relative to the market.
Multiple Performance Metrics
LTP % Change: Last traded price percentage change from the prior close.
RS Score: Relative strength score over a user-defined lookback.
Momentum (ROC Difference): Convergence/divergence between two ROC values for added confirmation.
ROC1 / ROC2: Short- and medium-term rate-of-change measures.
Trend Classification Engine
Each sector is tagged as Ultra Bullish, Bullish Breakout, Strong/Moderate Bullish, Neutral, Moderate/Strong Bearish, Bearish Breakdown, or Ultra Bearish. This classification is based on sectoral price behavior and candlestick relationships.
Sorting & Customization
Users can sort the dashboard by any metric (e.g., RS Score, % Change, Momentum), in ascending or descending order, to highlight what matters most for their strategy.
Table Presentation
Adjustable text size, thickness, and positioning on the chart.
Optional color-coded cells for visual cues — green shades for strength, red shades for weakness, neutral shades for sideways trends.
“Last Updated” timestamp for clarity on when the snapshot was generated.
How It Helps
This tool reduces the noise of flipping through individual sector charts. Traders can identify sector leadership, monitor momentum shifts, and catch early signs of rotation without leaving a single chart window. It acts as both a macro lens (sector overview) and a micro tool (spotting exact strength/weakness transitions).
Closing Note
This dashboard was built with a simple goal: to bring clarity to complex sectoral movements. Use it as a guiding compass while respecting your broader trading or investing framework.
With Thanks,
Rrahul Desai
@Artharjan

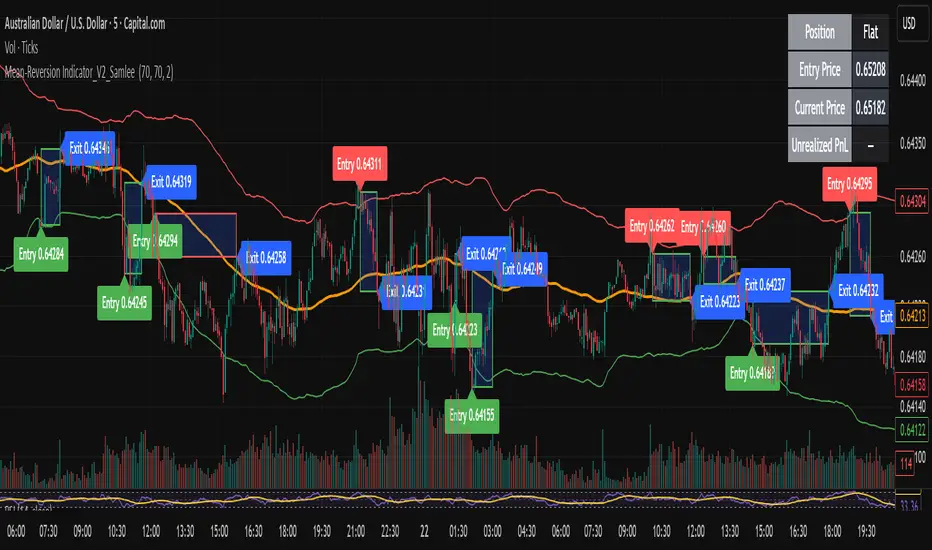
Mean-Reversion Indicator_V2_SamleeOverview
This is the second version of my mean reversion indicator. It combines a moving average with adaptive standard deviation bands to detect when the price deviates significantly from its mean. The script provides automatic entry/exit signals, real-time PnL tracking, and shaded trade zones to make mean reversion trading more intuitive.
Core Logic
Mean benchmark: Simple Moving Average (MA).
Volatility bands: Standard deviation of the spread (close − MA) defines upper and lower bands.
Trading rules:
Price breaks below the lower band → Enter Long
Price breaks above the upper band → Enter Short
Price reverts to MA → Exit position
What’s different vs. classic Bollinger/Keltner
Bandwidth is based on the standard deviation of the price–MA spread, not raw closing prices.
Entry signals use previous-bar confirmation to reduce intrabar noise.
Exit rule is a mean-touch condition, rather than fixed profit/loss targets.
Enhanced visualization:
A shaded box dynamically shows the distance between entry and current/exit price, making it easy to see profit/loss zones over the holding period.
Instant PnL labels display current position side (Long/Short/Flat) and live profit/loss in both pips and %.
Entry and exit points are clearly marked on the chart with labels and exact prices.
These visualization tools go beyond what most indicators provide, giving traders a clearer, more practical view of trade evolution.
Key Features
Automatic detection of position status (Long / Short / Flat).
Chart labels for entries (“Entry”) and exits (“Exit”).
Real-time floating PnL calculation in both pips and %.
Info panel (top-right) showing entry price, current price, position side, and PnL.
Dynamic shading between entry and current/exit price to visualize profit/loss zones.
Usage Notes & Risk
Mean reversion may underperform in strong trending markets; parameters (len_ma, len_std, mult) should be validated per instrument and timeframe.
Works best on relatively stable, mean-reverting pairs (e.g., AUDNZD).
Risk management is essential: use independent stop-loss rules (e.g., limit risk to 1–2% of equity per trade).
This script is provided for educational purposes only and is not financial advice.
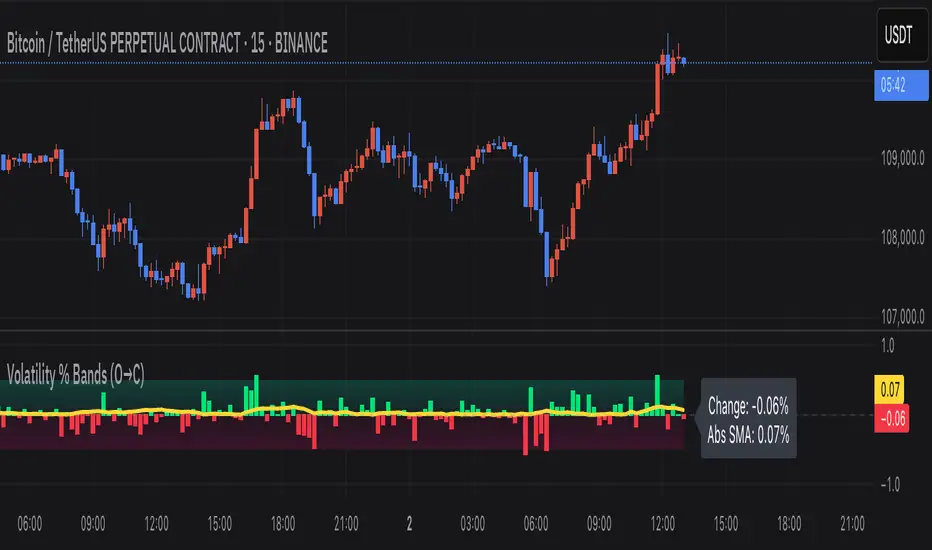
Volatility % Bands (O→C)Volatility % Bands (O→C) is an indicator designed to visualize the percentage change from Open to Close of each candle, providing a clear view of short-term momentum and volatility.
**Histogram**: Displays bar-by-bar % change (Close vs Open). Green bars indicate positive changes, while red bars indicate negative ones, making momentum shifts easy to identify.
**Moving Average Line**: Plots the Simple Moving Average (SMA) of the absolute % change, helping traders track the average volatility over a chosen period.
**Background Bands**: Based on the user-defined Level Step, ±1 to ±5 zones are highlighted as shaded bands, allowing quick recognition of whether volatility is low, moderate, or extreme.
**Label**: Shows the latest candle’s % change and the current SMA value as a floating label on the right, making it convenient for real-time monitoring.
This tool can be useful for volatility breakout strategies, day trading, and short-term momentum analysis.
Machine Learning Z-Score Buy and Sell [SS]Hey everyone,
Releasing this Z-Score based buy and sell indicator.
What it does
This indicator:
Uses Z-score and trend to identify potential buy and sell areas.
Signals those buy and sell areas and provides a target price based on the mean.
Plots the target price for buy and sell signals as a red line (for sell signals) or green line (for buy signals).
Has some "machine learning" aspects, namely, it is able to auto select its lookback length based on its analysis of the trend using Pienscript's trend correlation function iterated over multiple lengths, in order for the indicator to identify:
a) The strongest trend; and
b) The correct target price
What is Z-Score
Z-Score is a measure of the mean. Thus, this is a mean reverting type strategy, as it uses z-score to determine price's distance from the mean (or a Z-Score of 0) and then it looks at historic deviations from the mean to signal the buy and sell signals (i.e. how far has price traditionally drifted from the mean before reverting).
Z-Score is a powerful tool in this sense, and if you folow my other indicators, you will know how much I love Z-score!
How to use the indicator
If you want to use the full Machine Learning capabilities of the indicator, its best to just leave all default settings. These default settings will automatically adjust the mean target price and buy and sell signals to align with the current price action.
If you want to be more aggressive in your
Target Price; and
Signals
Then you can opt to manually input a lookback length and mean reversion standard deviation. However, I generally suggest to avoid this as you are then making your own determination of trend by qualitative assessment. It can work, but its just not suggested.
In the input menu, you will see the option to "Manually select lookback" thus over-riding the auto-determination of trend and targets.
You will also see "manual pullback" enabler and "Pullback Standard Deviation". You can set your pullback standard deviation if you want to be more aggressive. The indicator will naturally shift to conservative target prices based on a neutral mean. However, if you want to increase the aggressiveness of the target price, you can increase or decrease the pullback standard deviation.
General Tips about Manually Adjusting Pullback Target
Here are some tips if you want to manually adjust the pullback targets:
The pullback target needs to be in a standard deviation value, this can be anywhere from 0 to 4 or 0 to -4 (you can theoretically go higher but its not really realistic). You can also do decimals, so 1.5 or 1.25 etc.
To determine whether you should be doing negative or positive standard deviation, you should determine the trend. If it is a downtrend and you are looking to short the rips, you will want to select a negative number, like -1.
If it is an uptrend and you want to buy the dips, you should be selecting a positive number, like 1 or 1.5.
Again, I do suggest leaving the indicator to decide for itself, but the options are there for those who wish.
Overall strategy
This is a mean reverting strategy. So if you are a mean reversion trader, this may be of particular interest to you.
Optional
Optionally, you can have the indicator plot the target prices or not, simply toggle this functionality off or on in the settings menu.
Concluding remarks
That is the indicator in a nutshell!
I hope you enjoy it and find it helpful.
Feel free to check out my other Z-Score based indicators if you find this interesting or want to learn more about the power of Z-Score in trading!
Thanks all and safe trades!

Price-Volume RelationshipVolume is the relationship between price and performance. Set the candlestick quantity in the settings. It analyzes price and volume based on the number of candlesticks you specify to determine price expectations.
