Bitcoin Cycle Master Z-ScoreThe "Bitcoin Cycle Master Z-Score" indicator is designed for in-depth, long-term analysis of Bitcoin's price cycles, using several key metrics to track market behavior and forecast potential price tops and bottoms. The indicator integrates multiple moving averages and on-chain metrics, offering a comprehensive view of Bitcoin’s historical and projected performance. Each of its components plays a crucial role in identifying critical cycle points.
The Z-Score is calculated between the 3 lower bands and the 2 upper bands
top_bands = (DeltaTop() + TerminalPrice())/2
bottom_bands = (BalancedPrice() + CVDD() + RealizedPrice())/3
The Z-Score is calculated to be -3 Z at the bottom bands and 3 Z at the top bands
mean = (top_bands + bottom_bands) / 2
bands_range = top_bands - bottom_bands
stdDev = bands_range != 0 ? bands_range / 6 : 0
zScore = stdDev != 0 ? (close - mean) / stdDev : 0
Created for TRW
Statistics

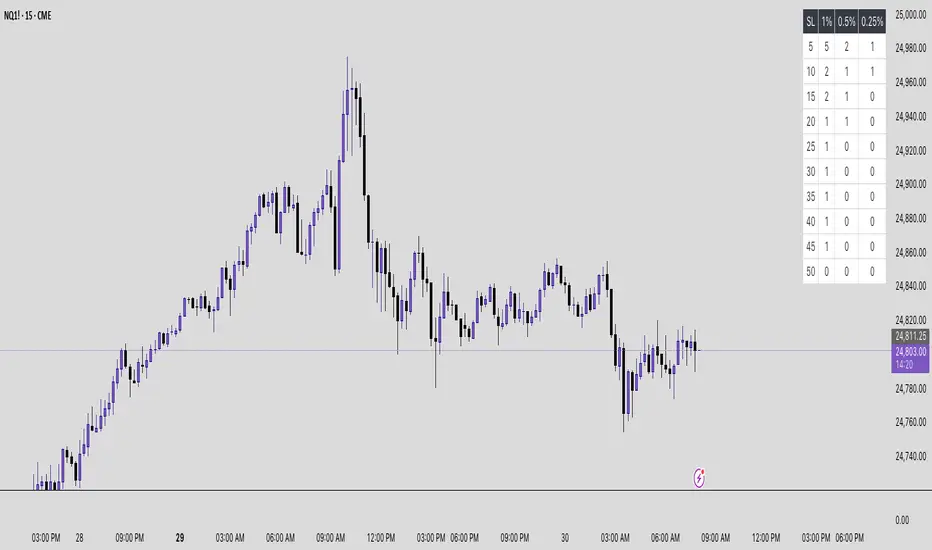
NQ Hourly Probability of PHH/PHL BreakNQ Hourly Probability of PHH/PHL Break
This indicator provides a statistical analysis of the Nasdaq 100 (NQ) on an hourly timeframe. It displays the historical probability of the current hour's candle breaking above the previous hour's high (PHH) or below the previous hour's low (PHL). The probabilities are contextual, changing based on the current hour of the day and the price's position relative to key levels.
It's made for traders who want to incorporate a data-driven approach into their intraday strategy.
________________________________________
SUMMARY
The core function of this tool is to display a real-time probability table on your chart. This table answers the question: "Based on historical data for this specific time of day and market context, what is the likelihood that price will break out of the previous hour's range?"
The indicator calculates these probabilities based on two key contextual conditions:
1. Is the current price above or below the Midnight Open price?
2. Is the current price above or below the midpoint of the previous hour's range?
By combining these conditions with the current hour, the indicator looks up the relevant historical statistics and presents them clearly.
________________________________________
FEATURES
• Probability Table: The main feature of the indicator. It displays the probability of breaking the Previous Hour High (PHH), the probability of breaking the Previous Hour Low (PHL), and the probability of the price staying within the range (No Breakout). It also shows the sample size for each statistic.
• Dynamic Color Coding: The table automatically highlights the most probable outcome in green, the second most probable in orange, and the least probable in red, allowing for a quick and easy assessment.
• Previous Hour Levels: Automatically plots the previous hour's high and low at the start of each new hour, providing key intraday levels for reference.
• Customizable Display: You have full control over the appearance, including line colors, styles, widths, and the text size of the probability table.
________________________________________
HOW TO USE
This indicator is designed for confluence, not as a standalone signal generator. It helps you frame your expectations for the current trading hour.
• Assessing Bias: If the table shows a high probability (e.g., >65%) of a breakout to the upside, you might have more confidence in looking for long opportunities or holding a long position through the PHH.
• Range-Bound Conditions: If the "No Breakout" probability is the highest, it suggests that a ranging or mean-reverting environment is more likely for that hour. You might be more cautious about chasing breakouts and instead look for trades within the previous hour's range.
• Context is Key: Always use this information in conjunction with your own analysis of market structure, order flow, and other factors.
________________________________________
IMPORTANT NOTES
• Asset Specific: The statistical data within this indicator is specifically calculated for NQ1! (Nasdaq 100 Futures). It will not be accurate for other assets like ES, BTC, or Forex pairs.
• Historical Data: These are historical probabilities and are not a guarantee of future results. Market dynamics can and do change. This tool is for educational and informational purposes to show what has happened in the past under similar conditions.
• Not Financial Advice: This script does not constitute financial advice. All trading decisions are your own responsibility.
________________________________________
USERINPUT
• Table Text Size: Adjust the size of the text in the probability table (Tiny, Small, Normal, Large).
• Show Midnight & PH Mid Lines: Toggle the visibility of the Midnight Open and Previous Hour Midpoint lines.
• Show Previous Hour High/Low Lines: Toggle the visibility of the PHH and PHL lines.
• Show Line Labels: Toggle the "phh" and "phl" text labels.
• Line Customization: Full control over the color, width, and style (Solid, Dotted, Dashed) for the high and low lines.

ACR(Average Candle Range) With TargetsWhat is ACR?
The Average Candle Range (ACR) is a custom volatility metric that calculates the mean distance between the high and low of a set number of past candles. ACR focuses only on the actual candle range (high - low) of specific past candles on a chosen timeframe.
This script calculates and visualizes the Average Candle Range (ACR) over a user-defined number of candles on a custom timeframe. It displays a table of recent range values, plots dynamic bullish and bearish target levels, and marks the start of each new candle with a vertical line. All calculations update in real time as price action develops. This script was inspired by the “ICT ADR Levels - Judas x Daily Range Meter°” by toodegrees.
Key Features
Custom Timeframe Selection: Choose any timeframe (e.g., 1D, 4H, 15m) for analysis.
User-Defined Lookback: Calculate the average range across 1 to 10 previous candles.
Dynamic Targets:
Bullish Target: Current candle low + ACR.
Bearish Target: Current candle high – ACR.
Live Updates: Targets adjust intrabar as highs or lows change during the current candle.
Candle Start Markers: Vertical lines denote the open of each new candle on the selected timeframe.
Floating Range Table:
Displays the current ACR value.
Lists individual ranges for the previous five candles.
Extend Target Lines: Choose to extend bullish and bearish target levels fully across the screen.
Global Visibility Controls: Toggle on/off all visual elements (targets, vertical lines, and table) for a cleaner view.
How It Works
At each new candle on the user-selected timeframe, the script:
Draws a vertical line at the candle’s open.
Recalculates the ACR based on the inputted previous number of candles.
Plots target levels using the current candle's developing high and low values.
Limitation
Once the price has already moved a full ACR in the opposite direction from your intended trade, the associated target loses its practical value. For example, if you intended to trade long but the bearish ACR target is hit first, the bullish target is no longer a reliable reference for that session.
Use Case
This tool is designed for traders who:
Want to visualize the average movement range of candles over time.
Use higher or lower timeframe candles as structural anchors.
Require real-time range-based price levels for intraday or swing decision-making.
This script does not generate entry or exit signals. Instead, it supports range awareness and target projection based on historical candle behavior.
Key Difference from Similar Tools
While this script was inspired by “ICT ADR Levels - Judas x Daily Range Meter°” by toodegrees, it introduces a major enhancement: the ability to customize the timeframe used for calculating the range. Most ADR or candle-range tools are locked to a single timeframe (e.g., daily), but this version gives traders full control over the analysis window. This makes it adaptable to a wide range of strategies, including intraday and swing trading, across any market or asset.

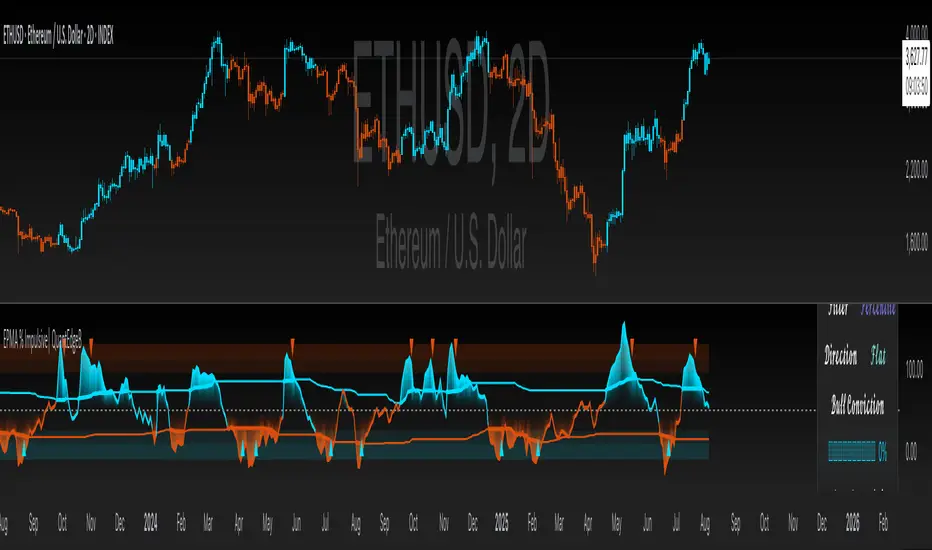
EPMA % Impulsive| QuantEdgeBEPMA % Impulsive | QuantEdgeB
🔍 What Is EPMA % Impulsive?
A volatility‐standardized impulse oscillator built on a forward-projected, low-lag moving average baseline. It transforms raw price into a 0–100% “impulse meter” by:
1. Trend Projection: Smoothing price with a double-EMA and fitting a short-term regression line that’s extended forward to anticipate direction.
2. Volatility Normalization: Wrapping that projected level in dynamic standard-deviation bands, then scaling price within those bands to a percentage scale.
3. Impulse Thresholds: Offering fixed, percentile-based, or rolling-volatility triggers to distinguish genuine bursts from noise.
💡 Why It’s Special
• Forward-Looking Base: By projecting the regression line forward, it reduces lag and “chases” trends intelligently.
• Noise-Aware Scaling: Volatility bands adapt in real time—quiet markets tighten bands, explosive markets widen them—ensuring the % reading always reflects true impulse, not random jitter.
• Flexible Thresholds: Static levels for simplicity, percentile ranks for regime-aware signals, or full standard-deviation bands for a purely data-driven approach.
• Dual Signal Styles: “Impulsive” mode for raw crossovers; “Smooth” mode for filtered breakouts that favor trend persistence.
⚙️ Key Components (High-Level)
1. DEMA Regression Engine
o Smooths price with double-EMA, fits a rolling regression, then projects it forward.
2. Volatility Bands
o Computes ±N × SD around the projected line to capture current turbulence.
3. % Scaling & Smoothing
o Maps price into a 0–100% range within those bands, then applies a final EMA to stabilize.
4. Impulse Triggers
o Crosses of the % line vs. your chosen thresholds generate long/short flags.
5. Visualization & Alerts
o Color-coded candles, threshold lines, zone fills, arrow markers, plus alert conditions on crossover/crossunder.
💼 Use Cases & Advantages
• Swing-Entry Precision
Pinpoint true momentum bursts for tighter entries and stops—avoiding false breakouts in choppy environments.
• Trend Confirmation
Validate whether a breakout is a sustained impulse (e.g., > 75th percentile) or just a spike that quickly fades.
• Regime Adaptability
Automatically tune sensitivity in low-volatility consolidations versus high-volatility expansions—no manual adjustments needed.
• Multi-Asset Versatility
Works seamlessly on stocks, futures, FX, crypto, and commodities—because it normalizes entirely to volatility, not price scale.
• Clarity & Confidence
A single, easy-to-interpret % reading plus visual cues make momentum obvious at a glance—empowering quick, data-driven decisions.
• Couple of charts examples.
BTC 1D
ETH 12H
SOL 8H
DOGE 4H
📌 Disclaimer:
Backtest results are based on past performance and do not guarantee future success. Always incorporate real-time validation and risk management in live trading.
🎨 Default Settings (Example)
• EPMA Lookback: 21 bars, forward-project 50 bars
• Volatility Band: ±2 × SD over 20 bars
• Threshold Type: Percentile 75/25 over 70 bars
• Signal Mode: Impulsive, Bar Color = On
📌 In Summary
EPMA % Impulsive | QuantEdgeB is your forward-projecting, volatility-aware momentum meter—combining regression forecasting with adaptive scaling to surface only the most meaningful impulse moves. Whether you’re timing swing entries or validating breakouts, it turns raw price into a clear, normalized impulse signal that adapts to any market regime.
🔹 Disclaimer: Past performance is not indicative of future results. No trading strategy can guarantee success in financial markets.
🔹 Strategic Advice: Always backtest, optimize, and align parameters with your trading objectives and risk tolerance before live trading.
On-Chain Signals [LuxAlgo]The On-Chain Signals indicator uses fundamental blockchain metrics to provide traders with an objective technical view of their favorite cryptocurrencies.
It uses IntoTheBlock datasets integrated within TradingView to generate four key signals: Net Network Growth, In the Money, Concentration, and Large Transactions.
Together, these four signals provide traders with an overall directional bias of the market. All of the data can be visualized as a gauge, table, historical plot, or average.
🔶 USAGE
The main goal of this tool is to provide an overall directional bias based on four blockchain signals, each with three possible biases: bearish, neutral, or bullish. The thresholds for each signal bias can be adjusted on the settings panel.
These signals are based on IntoTheBlock's On-Chain Signals.
Net network growth: Change in the total number of addresses over the last seven periods; i.e., how many new addresses are being created.
In the Money: Change in the seven-period moving average of the total supply in the money. This shows how many addresses are profitable.
Concentration: Change in the aggregate addresses of whales and investors from the previous period. These are addresses holding at least 0.1% of the supply. This shows how many addresses are in the hands of a few.
Large Transactions: Changes in the number of transactions over $100,000. This metric tracks convergence or divergence from the 21- and 30-day EMAs and indicates the momentum of large transactions.
All of these signals together form the blockchain's overall directional bias.
Bearish: The number of bearish individual signals is greater than the number of bullish individual signals.
Neutral: The number of bearish individual signals is equal to the number of bullish individual signals.
Bullish: The number of bullish individual signals is greater than the number of bearish individual signals.
If the overall directional bias is bullish, we can expect the price of the observed cryptocurrency to increase. If the bias is bearish, we can expect the price to decrease. If the signal is neutral, the price may be more likely to stay the same.
Traders should be aware of two things. First, the signals provide optimal results when the chart is set to the daily timeframe. Second, the tool uses IntoTheBlock data, which is available on TradingView. Therefore, some cryptocurrencies may not be available.
🔹 Display Mode
Traders have three different display modes at their disposal. These modes can be easily selected from the settings panel. The gauge is set by default.
🔹 Gauge
The gauge will appear in the center of the visible space. Traders can adjust its size using the Scale parameter in the Settings panel. They can also give it a curved effect.
The number of bars displayed directly affects the gauge's resolution: More bars result in better resolution.
The chart above shows the effect that different scale configurations have on the gauge.
🔹 Historical Data
The chart above shows the historical data for each of the four signals.
Traders can use this mode to adjust the thresholds for each signal on the settings panel to fit the behavior of each cryptocurrency. They can also analyze how each metric impacts price behavior over time.
🔹 Average
This display mode provides an easy way to see the overall bias of past prices in order to analyze price behavior in relation to the underlying blockchain's directional bias.
The average is calculated by taking the values of the overall bias as -1 for bearish, 0 for neutral, and +1 for bullish, and then applying a triangular moving average over 20 periods by default. Simple and exponential moving averages are available, and traders can select the period length from the settings panel.
🔶 DETAILS
The four signals are based on IntoTheBlock's On-Chain Signals. We gather the data, manipulate it, and build the signals depending on each threshold.
Net network growth
float netNetworkGrowthData = customData('_TOTALADDRESSES')
float netNetworkGrowth = 100*(netNetworkGrowthData /netNetworkGrowthData - 1)
In the Money
float inTheMoneyData = customData('_INOUTMONEYIN')
float averageBalance = customData('_AVGBALANCE')
float inTheMoneyBalance = inTheMoneyData*averageBalance
float sma = ta.sma(inTheMoneyBalance,7)
float inTheMoney = ta.roc(sma,1)
Concentration
float whalesData = customData('_WHALESPERCENTAGE')
float inverstorsData = customData('_INVESTORSPERCENTAGE')
float bigHands = whalesData+inverstorsData
float concentration = ta.change(bigHands )*100
Large Transactions
float largeTransacionsData = customData('_LARGETXCOUNT')
float largeTX21 = ta.ema(largeTransacionsData,21)
float largeTX30 = ta.ema(largeTransacionsData,30)
float largeTransacions = ((largeTX21 - largeTX30)/largeTX30)*100
🔶 SETTINGS
Display mode: Select between gauge, historical data and average.
Average: Select a smoothing method and length period.
🔹 Thresholds
Net Network Growth : Bullish and bearish thresholds for this signal.
In The Money : Bullish and bearish thresholds for this signal.
Concentration : Bullish and bearish thresholds for this signal.
Transactions : Bullish and bearish thresholds for this signal.
🔹 Dashboard
Dashboard : Enable/disable dashboard display
Position : Select dashboard location
Size : Select dashboard size
🔹 Gauge
Scale : Select the size of the gauge
Curved : Enable/disable curved mode
Select Gauge colors for bearish, neutral and bullish bias
🔹 Style
Net Network Growth : Enable/disable historical plot and choose color
In The Money : Enable/disable historical plot and choose color
Concentration : Enable/disable historical plot and choose color
Large Transacions : Enable/disable historical plot and choose color

Correlation HeatMap [TradingFinder] Sessions Data Science Stats🔵 Introduction
n financial markets, correlation describes the statistical relationship between the price movements of two assets and how they interact over time. It plays a key role in both trading and investing by helping analyze asset behavior, manage portfolio risk, and understand intermarket dynamics. The Correlation Heatmap is a visual tool that shows how the correlation between multiple assets and a central reference asset (the Main Symbol) changes over time.
It supports four market types forex, stocks, crypto, and a custom mode making it adaptable to different trading environments. The heatmap uses a color-coded grid where warmer tones represent stronger negative correlations and cooler tones indicate stronger positive ones. This intuitive color system allows traders to quickly identify when assets move together or diverge, offering real-time insights that go beyond traditional correlation tables.
🟣 How to Interpret the Heatmap Visually ?
Each cell represents the correlation between the main symbol and one compared asset at a specific time.
Warm colors (e.g. red, orange) suggest strong negative correlation as one asset rises, the other tends to fall.
Cool colors (e.g. blue, green) suggest strong positive correlation both assets tend to move in the same direction.
Lighter shades indicate weaker correlations, while darker shades indicate stronger correlations.
The heatmap updates over time, allowing users to detect changes in correlation during market events or trading sessions.
One of the standout features of this indicator is its ability to overlay global market sessions such as Tokyo, London, New York, or major equity opens directly onto the heatmap timeline. This alignment lets traders observe how correlation structures respond to real-world session changes. For example, they can spot when assets shift from being inversely correlated to moving together as a new session opens, potentially signaling new momentum or macro flow. The customizable symbol setup (including up to 20 compared assets) makes it ideal not only for forex and crypto traders but also for multi-asset and sector-based stock analysis.
🟣 Use Cases and Advantages
Analyze sector rotation in equities by tracking correlation to major indices like SPX or DJI.
Monitor altcoin behavior relative to Bitcoin to find early entry opportunities in crypto markets.
Detect changes in currency alignment with DXY across trading sessions in forex.
Identify correlation breakdowns during market volatility, signaling possible new trends.
Use correlation shifts as confirmation for trade setups or to hedge multi-asset exposure
🔵 How to Use
Correlation is one of the core concepts in financial analysis and allows traders to understand how assets behave in relation to one another. The Correlation Heatmap extends this idea by going beyond a simple number or static matrix. Instead, it presents a dynamic visual map of how correlations shift over time.
In this indicator, a Main Symbol is selected as the reference point for analysis. In standard modes such as forex, stocks, or crypto, the symbol currently shown on the main chart is automatically used as the main symbol. This allows users to begin correlation analysis right away without adjusting any settings.
The horizontal axis of the heatmap shows time, while the vertical axis lists the selected assets. Each cell on the heatmap shows the correlation between that asset and the main symbol at a given moment.
This approach is especially useful for intermarket analysis. In forex, for example, tracking how currency pairs like OANDA:EURUSD EURUSD, FX:GBPUSD GBPUSD, and PEPPERSTONE:AUDUSD AUDUSD correlate with TVC:DXY DXY can give insight into broader capital flow.
If these pairs start showing increasing positive correlation with DXY say, shifting from blue to light green it could signal the start of a new phase or reversal. Conversely, if negative correlation fades gradually, it may suggest weakening relationships and more independent or volatile movement.
In the crypto market, watching how altcoins correlate with Bitcoin can help identify ideal entry points in secondary assets. In the stock market, analyzing how companies within the same sector move in relation to a major index like SP:SPX SPX or DJ:DJI DJI is also a highly effective technique for both technical and fundamental analysts.
This indicator not only visualizes correlation but also displays major market sessions. When enabled, this feature helps traders observe how correlation behavior changes at the start of each session, whether it's Tokyo, London, New York, or the opening of stock exchanges. Many key shifts, breakouts, or reversals tend to happen around these times, and the heatmap makes them easy to spot.
Another important feature is the market selection mode. Users can switch between forex, crypto, stocks, or custom markets and see correlation behavior specific to each one. In custom mode, users can manually select any combination of symbols for more advanced or personalized analysis. This makes the heatmap valuable not only for forex traders but also for stock traders, crypto analysts, and multi-asset strategists.
Finally, the heatmap's color-coded design helps users make sense of the data quickly. Warm colors such as red and orange reflect stronger negative correlations, while cool colors like blue and green represent stronger positive relationships. This simplicity and clarity make the tool accessible to both beginners and experienced traders.
🔵 Settings
Correlation Period: Allows you to set how many historical bars are used for calculating correlation. A higher number means a smoother, slower-moving heatmap, while a lower number makes it more responsive to recent changes.
Select Market: Lets you choose between Forex, Stock, Crypto, or Custom. In the first three options, the chart’s active symbol is automatically used as the Main Symbol. In Custom mode, you can manually define the Main Symbol and up to 20 Compared Symbols.
Show Open Session: Enables the display of major trading sessions such as Tokyo, London, New York, or equity market opening hours directly on the timeline. This helps you connect correlation shifts with real-world market activity.
Market Mode: Lets you select whether the displayed sessions relate to the forex or stock market.
🔵 Conclusion
The Correlation Heatmap is a robust and flexible tool for analyzing the relationship between assets across different markets. By tracking how correlations change in real time, traders can better identify alignment or divergence between symbols and gain valuable insights into market structure.
Support for multiple asset classes, session overlays, and intuitive visual cues make this one of the most effective tools for intermarket analysis.
Whether you’re looking to manage portfolio risk, validate entry points, or simply understand capital flow across markets, this heatmap provides a clear and actionable perspective that you can rely on.

Table ATH and DayQuotes in the middle of a chartJust important things at a glance ..
AlltimeHigh and Daily High/Low


Sat Stacking Strategies Simulation (SSSS)Sat Stacking Strategies Simulation (SSSS)
This indicator simulates and compares different Bitcoin stacking strategies over time, allowing you to visualize performance, cost basis, and stacking behavior directly on your chart.
Core Features:
Three Stacking Strategies
• Trend-Based – Stack only when price is above/below a long-term SMA.
• Stack the Dip – Buy during sharp pullbacks or oversold conditions.
• Price Zone – Stack only in “cheap”, “fair”, or “expensive” zones based on a simulated Short-Term Holder (STH) cost basis.
Always Stack Benchmark
Compare your chosen strategy against a simple “Always Stack” approach for a real-world DCA reference.
Performance Metrics Table
Track:
• Total Fiat Added
• Total BTC Accumulated
• Current Value
• Average Cost per BTC
• PnL %
• CAGR
• Sharpe Ratio & Stdev
• Stack Events & Time Underwater
Advanced Options
• Simulate cash-secured puts on unused fiat.
• Simulate covered calls on BTC holdings.
• Roll over unused stacking amounts for future buys.
This tool is designed for Bitcoiners, stackers, and DCA enthusiasts who want to backtest and visualize their stacking plan—whether you keep it simple or go full quant.
Sometimes the best alpha is just showing up every week with your wallet open… and occasionally wearing a helmet. 🪖💰


Crypto Options Greeks & Volatility Analyzer [BackQuant]Crypto Options Greeks & Volatility Analyzer
Overview
The Crypto Options Greeks & Volatility Analyzer is a comprehensive analytical tool that calculates Black-Scholes option Greeks up to the third order for Bitcoin and Ethereum options. It integrates implied volatility data from VOLMEX indices and provides multiple visualization layers for options risk analysis.
Quick Introduction to Options Trading
Options are financial derivatives that give the holder the right, but not the obligation, to buy or sell an underlying asset at a predetermined price (strike price) within a specific time period (expiration date). Understanding options requires grasping two fundamental concepts:
Call Options : Give the right to buy the underlying asset at the strike price. Calls increase in value when the underlying price rises above the strike price.
Put Options : Give the right to sell the underlying asset at the strike price. Puts increase in value when the underlying price falls below the strike price.
The Language of Options: Greeks
Options traders use "Greeks" - mathematical measures that describe how an option's price changes in response to various factors:
Delta : How much the option price moves for each $1 change in the underlying
Gamma : How fast delta changes as the underlying moves
Theta : Daily time decay - how much value erodes each day
Vega : Sensitivity to implied volatility changes
Rho : Sensitivity to interest rate changes
These Greeks are essential for understanding risk. Just as a pilot needs instruments to fly safely, options traders need Greeks to navigate market conditions and manage positions effectively.
Why Volatility Matters
Implied volatility (IV) represents the market's expectation of future price movement. High IV means:
Options are more expensive (higher premiums)
Market expects larger price swings
Better for option sellers
Low IV means:
Options are cheaper
Market expects smaller moves
Better for option buyers
This indicator helps you visualize and quantify these critical concepts in real-time.
Back to the Indicator
Key Features & Components
1. Complete Greeks Calculations
The indicator computes all standard Greeks using the Black-Scholes-Merton model adapted for cryptocurrency markets:
First Order Greeks:
Delta (Δ) : Measures the rate of change of option price with respect to underlying price movement. Ranges from 0 to 1 for calls and -1 to 0 for puts.
Vega (ν) : Sensitivity to implied volatility changes, expressed as price change per 1% change in IV.
Theta (Θ) : Time decay measured in dollars per day, showing how much value erodes with each passing day.
Rho (ρ) : Interest rate sensitivity, measuring price change per 1% change in risk-free rate.
Second Order Greeks:
Gamma (Γ) : Rate of change of delta with respect to underlying price, indicating how quickly delta will change.
Vanna : Cross-derivative measuring delta's sensitivity to volatility changes and vega's sensitivity to price changes.
Charm : Delta decay over time, showing how delta changes as expiration approaches.
Vomma (Volga) : Vega's sensitivity to volatility changes, important for volatility trading strategies.
Third Order Greeks:
Speed : Rate of change of gamma with respect to underlying price (∂Γ/∂S).
Zomma : Gamma's sensitivity to volatility changes (∂Γ/∂σ).
Color : Gamma decay over time (∂Γ/∂T).
Ultima : Third-order volatility sensitivity (∂²ν/∂σ²).
2. Implied Volatility Analysis
The indicator includes a sophisticated IV ranking system that analyzes current implied volatility relative to its recent history:
IV Rank : Percentile ranking of current IV within its 30-day range (0-100%)
IV Percentile : Percentage of days in the lookback period where IV was lower than current
IV Regime Classification : Very Low, Low, High, or Very High
Color-Coded Headers : Visual indication of volatility regime in the Greeks table
Trading regime suggestions based on IV rank:
IV Rank > 75%: "Favor selling options" (high premium environment)
IV Rank 50-75%: "Neutral / Sell spreads"
IV Rank 25-50%: "Neutral / Buy spreads"
IV Rank < 25%: "Favor buying options" (low premium environment)
3. Gamma Zones Visualization
Gamma zones display horizontal price levels where gamma exposure is highest:
Purple horizontal lines indicate gamma concentration areas
Opacity scaling : Darker shading represents higher gamma values
Percentage labels : Shows gamma intensity relative to ATM gamma
Customizable zones : 3-10 price levels can be analyzed
These zones are critical for understanding:
Pin risk around expiration
Potential for explosive price movements
Optimal strike selection for gamma trading
Market maker hedging flows
4. Probability Cones (Expected Move)
The probability cones project expected price ranges based on current implied volatility:
1 Standard Deviation (68% probability) : Shown with dashed green/red lines
2 Standard Deviations (95% probability) : Shown with dotted green/red lines
Time-scaled projection : Cones widen as expiration approaches
Lognormal distribution : Accounts for positive skew in asset prices
Applications:
Strike selection for credit spreads
Identifying high-probability profit zones
Setting realistic price targets
Risk management for undefined risk strategies
5. Breakeven Analysis
The indicator plots key price levels for options positions:
White line : Strike price
Green line : Call breakeven (Strike + Premium)
Red line : Put breakeven (Strike - Premium)
These levels update dynamically as option premiums change with market conditions.
6. Payoff Structure Visualization
Optional P&L labels display profit/loss at expiration for various price levels:
Shows P&L at -2 sigma, -1 sigma, ATM, +1 sigma, and +2 sigma price levels
Separate calculations for calls and puts
Helps visualize option payoff diagrams directly on the chart
Updates based on current option premiums
Configuration Options
Calculation Parameters
Asset Selection : BTC or ETH (limited by VOLMEX IV data availability)
Expiry Options : 1D, 7D, 14D, 30D, 60D, 90D, 180D
Strike Mode : ATM (uses current spot) or Custom (manual strike input)
Risk-Free Rate : Adjustable annual rate for discounting calculations
Display Settings
Greeks Display : Toggle first, second, and third-order Greeks independently
Visual Elements : Enable/disable probability cones, gamma zones, P&L labels
Table Customization : Position (6 options) and text size (4 sizes)
Price Levels : Show/hide strike and breakeven lines
Technical Implementation
Data Sources
Spot Prices : INDEX:BTCUSD and INDEX:ETHUSD for underlying prices
Implied Volatility : VOLMEX:BVIV (Bitcoin) and VOLMEX:EVIV (Ethereum) indices
Real-Time Updates : All calculations update with each price tick
Mathematical Framework
The indicator implements the full Black-Scholes-Merton model:
Standard normal distribution approximations using Abramowitz and Stegun method
Proper annualization factors (365-day year)
Continuous compounding for interest rate calculations
Lognormal price distribution assumptions
Alert Conditions
Four categories of automated alerts:
Price-Based : Underlying crossing strike price
Gamma-Based : 50% surge detection for explosive moves
Moneyness : Deep ITM alerts when |delta| > 0.9
Time/Volatility : Near expiration and vega spike warnings
Practical Applications
For Options Traders
Monitor all Greeks in real-time for active positions
Identify optimal entry/exit points using IV rank
Visualize risk through probability cones and gamma zones
Track time decay and plan rolls
For Volatility Traders
Compare IV across different expiries
Identify mean reversion opportunities
Monitor vega exposure across strikes
Track higher-order volatility sensitivities
Conclusion
The Crypto Options Greeks & Volatility Analyzer transforms complex mathematical models into actionable visual insights. By combining institutional-grade Greeks calculations with intuitive overlays like probability cones and gamma zones, it bridges the gap between theoretical options knowledge and practical trading application.
Whether you're:
A directional trader using options for leverage
A volatility trader capturing IV mean reversion
A hedger managing portfolio risk
Or simply learning about options mechanics
This tool provides the quantitative foundation needed for informed decision-making in cryptocurrency options markets.
Remember that options trading involves substantial risk and complexity. The Greeks and visualizations provided by this indicator are tools for analysis - they should be combined with proper risk management, position sizing, and a thorough understanding of options strategies.
As crypto options markets continue to mature and grow, having professional-grade analytics becomes increasingly important. This indicator ensures you're equipped with the same analytical capabilities used by institutional traders, adapted specifically for the unique characteristics of 24/7 cryptocurrency markets.

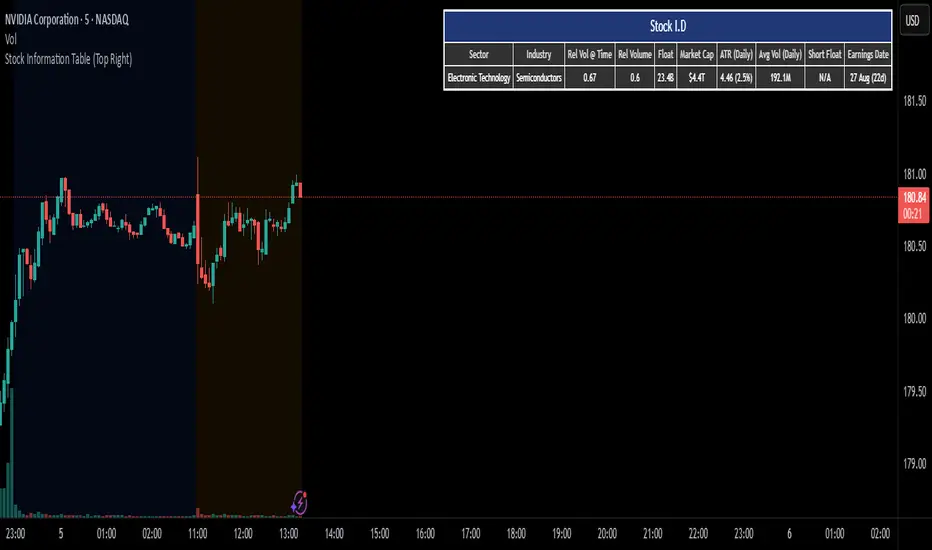
Stock I.Dshows information on a given stock for intra day trading
1. sector
2. industry
3. relative volume at time
4. relative volume
5. float
6. market cap
7. average true range(daily)
8. average volume (daily)
9. short float
10. earnings date
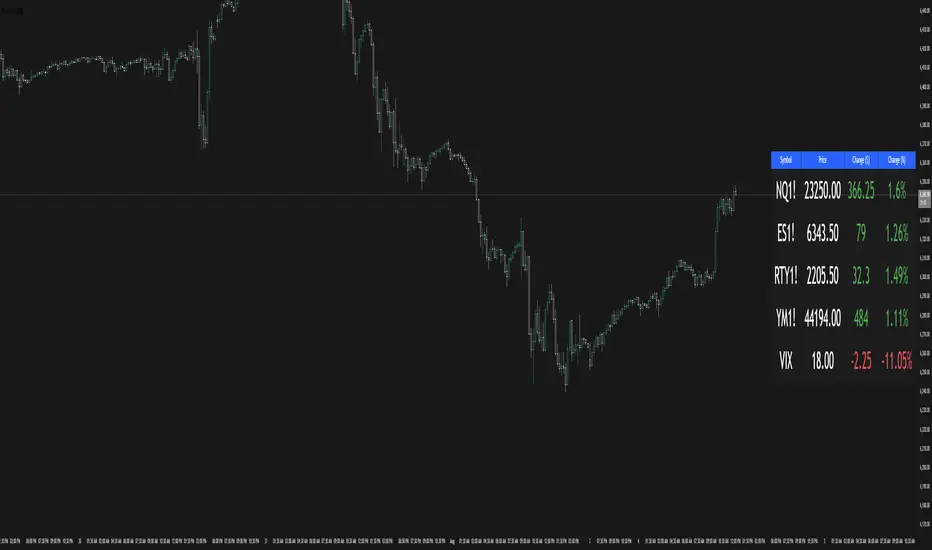
Multi-Ticker TableMulti-Ticker Table
A customizable TradingView indicator that displays a clean, organized table of up to 10 user-defined ticker symbols with their current daily price, daily dollar change, and daily percentage change.
Key features include:
Enable/disable individual tickers with custom symbols
Customizable font sizes and colors for header and body rows
Customizable table background colors for header and data rows
Flexible table positioning anywhere on the chart (top/middle/bottom × left/center/right)
Highlights positive changes in green and negative changes in red for quick visual analysis
Hides chart candles to display the table as a standalone dashboard
Ideal for traders who want a quick, at-a-glance summary of multiple markets or instruments without cluttering the chart.
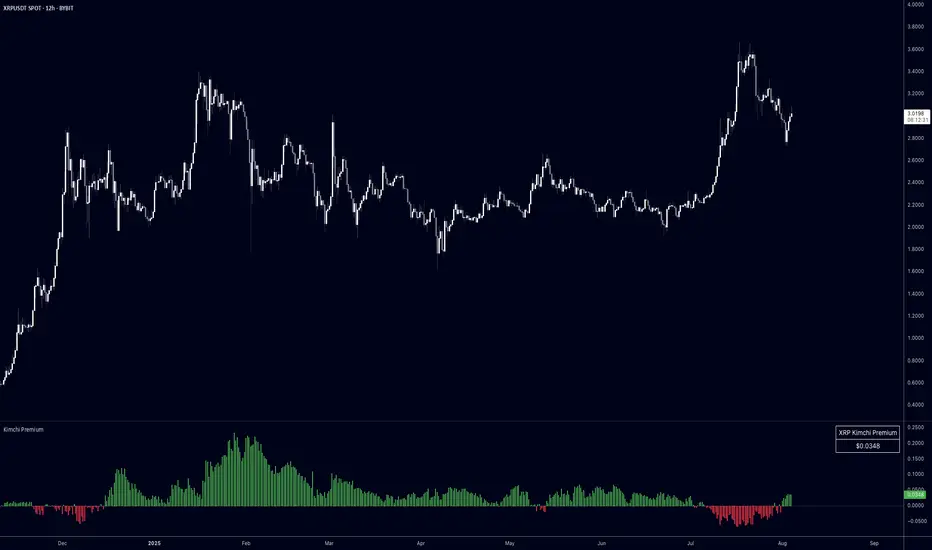
Kimchi PremiumKimchi Premium Indicator
Track the price difference between Korean cryptocurrency exchanges and global markets - a key metric for understanding regional market sentiment and arbitrage opportunities.
What is the Kimchi Premium?
The Kimchi Premium measures how much more (or less) cryptocurrencies trade on Korean exchanges compared to global exchanges. Named after Korea's famous fermented dish, this premium often reflects Korean retail investor sentiment and capital flow restrictions.
How It Works:
• Fetches prices from Korean exchanges (Upbit, Bithumb) in KRW
• Compares against global exchanges (Binance, Coinbase, Kraken, Bybit, OKX) in USD/USDT
• Automatically converts KRW to USD using Pepperstone's USD/KRW rate
• Calculates the premium as: (Korean Price USD - Global Price) / Global Price * 100
Visual Indicators:
• Green bars = Korean exchanges trading at a premium (more expensive)
• Red bars = Korean exchanges trading at a discount (cheaper)
• Histogram style with zero baseline for easy interpretation
Key Features:
• Exchange Selection: Choose individual Korean/global exchanges or averaged prices across multiple venues
• Display Options: View premium in percentage (%) or absolute dollar ($) terms
• Inverse Mode: Flip perspective to show global premium over Korean prices
• Moving Average: Smooth out noise with customizable MA period
• Live Table: Real-time premium display in top-right corner
• Auto-Detection: Works with any crypto pair on your chart (BTC, ETH, XRP, etc.)
Trading Applications:
• Sentiment Analysis: Extreme premiums (>5%) often signal Korean retail FOMO - potential reversal zones
• Arbitrage Identification: Large premiums/discounts highlight profit opportunities (consider logistics/capital controls)
• Regional Flow Tracking: Monitor capital movement into/out of Korean crypto markets
• Risk Management: Historical data shows massive premiums often coincide with local tops
Customization Options:
• Korean exchanges: Averaged out, Upbit, Bithumb
• Global exchanges: Averaged out, Binance, Coinbase, Kraken, Bybit, OKX
• Display format: Percentage or dollar amount
• Moving average toggle and period adjustment
• Table display on/off
• Inverse premium view
Pro Tips:
• Use "Averaged out" settings for most reliable data across multiple venues
• Watch for premium spikes above 3-5% as potential sentiment extremes
• Negative premiums can indicate Korean selling pressure or efficient arbitrage
• Combine with volume analysis for stronger signals
Hann Window FIR Filter Ribbon [BigBeluga]🔵 OVERVIEW
The Hann Window FIR Filter Ribbon is a trend-following visualization tool based on a family of FIR filters using the Hann window function. It plots a smooth and dynamic ribbon formed by six Hann filters of progressively increasing length. Gradient coloring and filled bands reveal trend direction and compression/expansion behavior. When short-term trend shifts occur (via filter crossover), it automatically anchors visual support/resistance zones at the nearest swing highs or lows.
🔵 CONCEPTS
Hann FIR Filter: A finite impulse response filter that uses a Hann (cosine-based) window for weighting past price values, resulting in a non-lag, ultra-smooth output.
hannFilter(length)=>
var float hann = na // Final filter output
float filt = 0
float coef = 0
for i = 1 to length
weight = 1 - math.cos(2 * math.pi * i / (length + 1))
filt += price * weight
coef += weight
hann := coef != 0 ? filt / coef : na
Ribbon Stack: The indicator plots 6 Hann FIR filters with increasing lengths, creating a smooth "ribbon" that adapts to price shifts and visually encodes volatility.
Gradient Coloring: Line colors and fill opacity between layers are dynamically adjusted based on the distance between the filters, showing momentum expansion or contraction.
Dynamic Swing Zones: When the shortest filter crosses its nearest neighbor, a swing high/low is located, and a triangle-style level is anchored and projected to the right.
Self-Extending Levels: These dynamic levels persist and extend until invalidated or replaced by a new opposite trend break.
🔵 FEATURES
Plots 6 Hann FIR filters with increasing lengths (controlled by Ribbon Size input).
Automatically colors each filter and the fill between them with smooth gradient transitions.
Detects trend shifts via filter crossover and anchors visual resistance (red) or support (green) zones.
Support/resistance zones are triangle-style bands built around recent swing highs/lows.
Levels auto-extend right and adapt in real time until invalidated by price action.
Ribbon responds smoothly to price and shows contraction or expansion behavior clearly.
No lag in crossover detection thanks to FIR architecture.
Adjustable sensitivity via Length and Ribbon Size inputs.
🔵 HOW TO USE
Use the ribbon gradient as a visual trend strength and smooth direction cue.
Watch for crossover of shortest filters as early trend change signals.
Monitor support/resistance zones as potential high-probability reaction points.
Combine with other tools like momentum or volume to confirm trend breaks.
Adjust ribbon thickness and length to suit your trading timeframe and volatility preference.
🔵 CONCLUSION
Hann Window FIR Filter Ribbon blends digital signal processing with trading logic to deliver a visually refined, non-lagging trend tool. The adaptive ribbon offers insight into momentum compression and release, while swing-based levels give structure to potential reversals. Ideal for traders who seek smooth trend detection with intelligent, auto-adaptive zone plotting.

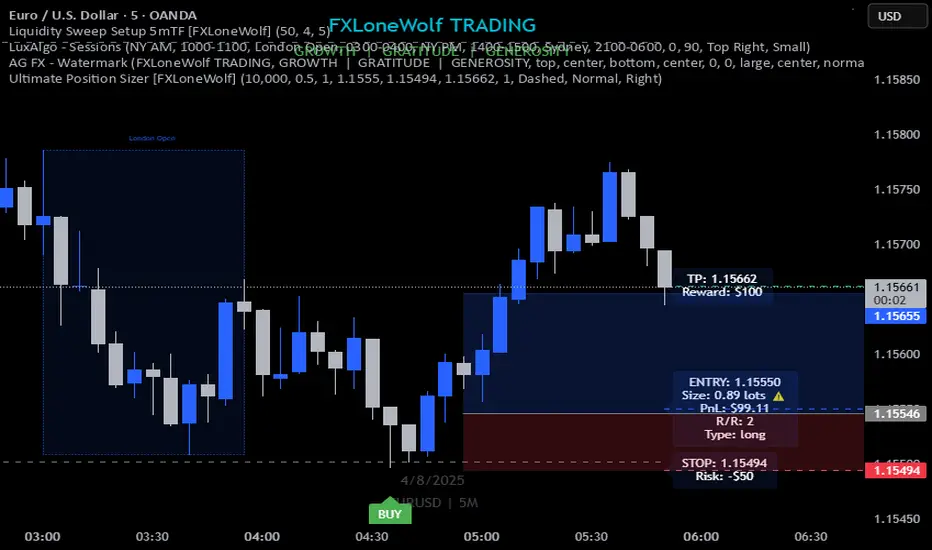
Ultimate Position Sizer [FXLoneWolf]Ultimate Position Sizer is your all-in-one risk management tool built specifically for Forex, Commodities, Indices, and Cryptocurrency traders. Whether you're trading XAUUSD, NAS100, BTCUSDT, or DAX, this powerful indicator ensures precise and professional position sizing based on your capital, risk percentage, stop loss distance, and account leverage.
With real-time calculations and intuitive visuals, the tool helps you take control of your risk per trade — a cornerstone of professional trading discipline. From scalpers to swing traders, this tool adapts seamlessly to any asset class and trading strategy.
🔧 Key Features:
Works on all asset classes: Forex, Commodities (XAUUSD, USOIL), Indices (SPX500, US30), Crypto (BTC, ETH), and more.
Dynamic position size calculation based on stop loss, risk %, and leverage.
Auto-calculates lot size, risk in USD, and potential reward.
Visual trade metrics: SL, Entry, TP, and Risk:Reward labels.
Clean, intuitive UI with customizable inputs.
Supports both long and short positions.
Helps enforce professional risk management discipline.
Enhance your trading accuracy, protect your capital, and gain confidence with the Ultimate Position Sizer – trusted by disciplined traders worldwide.
Sample:
Futures Risk Contract TableFutures risk table for NQ MNQ YM MYM ES and MES
changeable capital and risk percentage along with points.

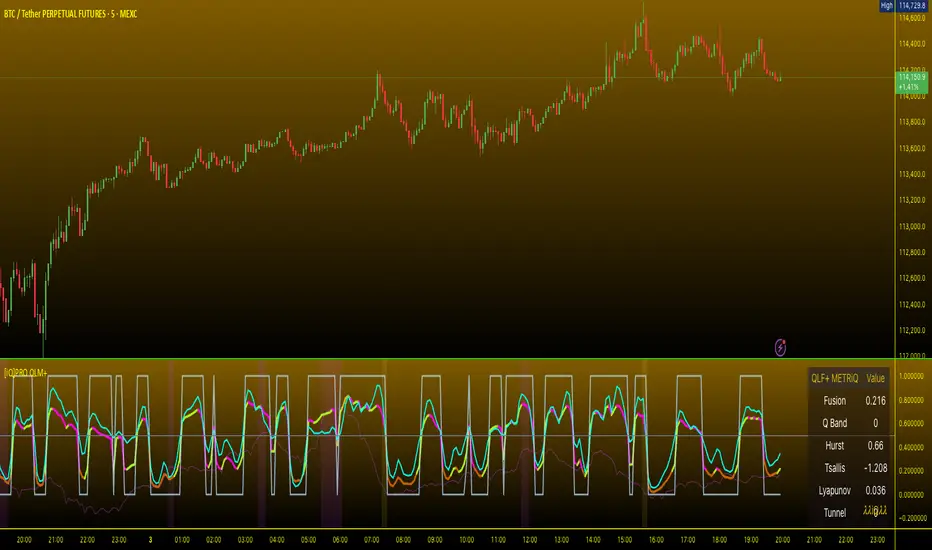
[iQ]PRO Quantum LagMan+ PRO Quantum LagMan+ (QLM+) — A Fusion Oscillator for Regime-Aware Entries
Overview
PRO Quantum LagMan+ is a next‑generation oscillator built for precision timing in dynamic markets. It blends advanced signal processing (multi-mode Laguerre smoothing) with physics-inspired analytics (Tsallis entropy, Hurst exponent, Lyapunov dynamics, and a tunneling probability model) to create a single fusion signal designed to adapt across regimes. The result is an actionable, regime-aware oscillator with adaptive thresholds, quantum energy band context, volatility gating, and optional trend filtering—complete with alerts, signal markers, and an information panel.
What it does
Normalizes momentum: Converts a Laguerre-based oscillator to a stable 0–1 scale for clear, cross-market comparability.
Maps “quantum” states: Assigns the oscillator to discrete energy bands to estimate state transitions and momentum intensity.
Fuses chaos and structure: Blends oscillator intensity, quantum momentum, and measured complexity/entropy into a single fusion line.
Filters by regime: Volatility and trend filters aim to suppress low-quality signals in quiet or unfavorable conditions.
Generates clean signals: Adaptive long/short thresholds with cooldown logic and coherence checks to reduce noise.
Explains itself: An info table displays fusion value, band index, entropy and chaos metrics, tunneling probability, and filter status.
Core components
Laguerre Multi-Mode Engine
Function: and1lag computes an ultimate smoother (ult), optional blended Laguerre filters, and a robust z-scored oscillator.
Control: period, lag, lagmode , RMSP add flexibility across timeframes and instruments.
Quantum Engine
Quantum Energy Levels: Discrete “bands” derived from normalized oscillator statistics.
Quantum Momentum: A 0–1 measure based on the current band position to capture intensity of state.
Coherence: Proximity between the oscillator and its active band (higher coherence = higher confidence).
Tunneling Probability: A barrier-like model that estimates the probability of a transition through local resistance/support structure.
Advanced Physics Layer (optional, heavy CPU)
Tsallis Entropy: A generalized entropy measure; elevated values can correspond to more complex or uncertain dynamics.
Lyapunov Exponent: A proxy for local sensitivity to initial conditions; higher values suggest chaotic/unstable behavior.
Hurst Exponent: A measure of persistence vs. mean reversion (H > 0.5 persistent, H < 0.5 mean-reverting).
These terms are summarized for trader context; the script uses bounded, practical implementations tuned for charting.
Fusion Oscillator
Composition: 50% normalized oscillator + 25% quantum momentum + 25% chaos/entropy blend.
Range: Constrained to for intuitive thresholds and consistent interpretation.
Regime Filters and Signals
Trend Filter: trendEMA with configurable trendLen to align signals with primary direction.
Volatility Filter: ATR-based gating with atrMultMin/atrMultMax bands, focusing on tradable volatility.
Adaptive Thresholds: Dynamic long/short thresholds scale with observed volatility.
Cooldown: signalCooldownBars limits rapid-fire signals to reduce whipsaw.
Alerts: Built-in alertcondition for automated notifications.
Visuals and UI
Main plots:
Fusion (thick, color-changing by state)
Norm Laguerre Osc (baseline momentum)
Quantum Momentum (band-based intensity)
Chaos Resonance (entropy/chaos contribution)
Bands and zones:
Quantum band visualization for context
Entropy zones via background shading (high/low extremes)
Info Table (showInfoTable):
Fusion, Quantum Band index, Hurst, Tsallis, Lyapunov, Tunneling Probability, Coherence, Volatility OK
Signal Markers:
Long: triangle up at bottoms
Short: triangle down at tops
Suggested usage
Entries:
Long bias when Fusion rises from low zones toward midline with high coherence, tunnel probability above threshold, trend filter positive, and volatility OK.
Short bias when Fusion falls from high zones with similar filter alignment and coherence.
Exits:
Consider scaling out near extremes (Fusion > 0.8 or < 0.2), during entropy spikes, or when coherence weakens.
Regime awareness:
Adjust trendLen for your timeframe.
Tighten atrMultMin to avoid low-vol chop.
Use adaptiveThresholds for cross-asset consistency.
Key inputs
Quantum Core: quantumLevels, planckConst, massDensity, tunnelThreshold
Advanced Physics: enableAdvanced, tsallisQ, lyapunovDim, entropyLength
Filters: useTrendFilter, trendLen, useVolFilter, atrLen, atrMultMin, atrMultMax
Signals: adaptiveThresholds, signalCooldownBars, showSignals
Display: showQuantumBands, showComponents, showEntropyZones, showInfoTable
Lag Options: source, period, lag, lagmode, RMSP
One glance clarity: A single Fusion line encapsulates momentum, state, and complexity.
Regime-adaptive: Thresholds and filters tune to volatility and trend.
Signal discipline: Coherence and cooldown aim to reduce false triggers.
Transparent context: The info table tells you why a signal is firing, not just that it is.
Notes and best practices
Multi-timeframe confirmation is recommended for higher-conviction entries.
The Advanced Physics layer can be CPU heavy; disable it for lightweight scanning or enable for precision.
Optimize inputs per asset class and timeframe (crypto vs FX vs equities).
This is an analytical tool, not financial advice. Always validate with risk management.
Alerts
Hybrid QLF Long: triggers on qualified long conditions
Hybrid QLF Short: triggers on qualified short conditions
Attribution and license
Pine Script code is licensed under the Mozilla Public License 2.0.
© MarketMakerIQ
Quick start
Add to chart and enable showInfoTable to understand live readings.
Start with defaults; toggle useTrendFilter and useVolFilter to match your style.
If performance allows, enable Advanced Physics and tune tsallisQ, lyapunovDim, entropyLength.
Set alerts on the included conditions and forward-test across sessions.
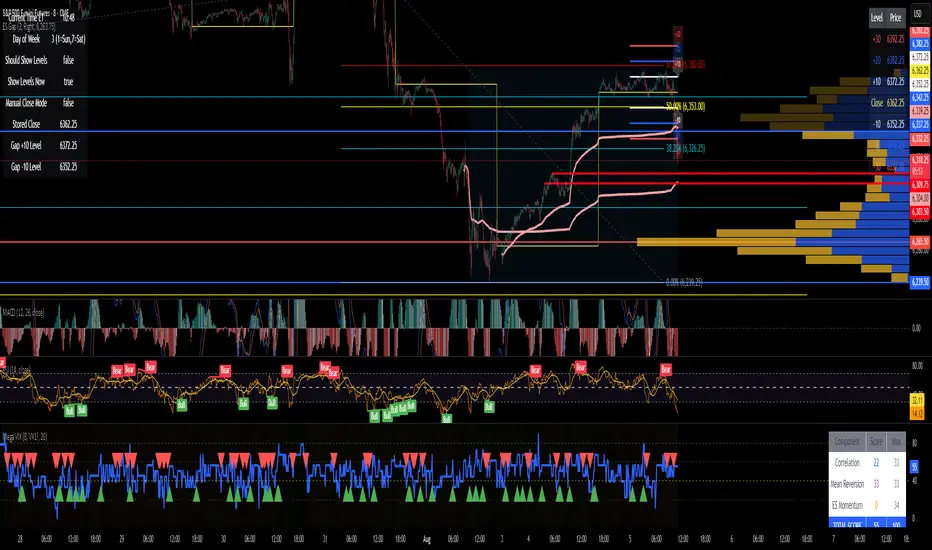
ES Gap Trading LevelsImproved closing time handling so that the gap is based on the last bar to capture the 3:59:59 closing price.
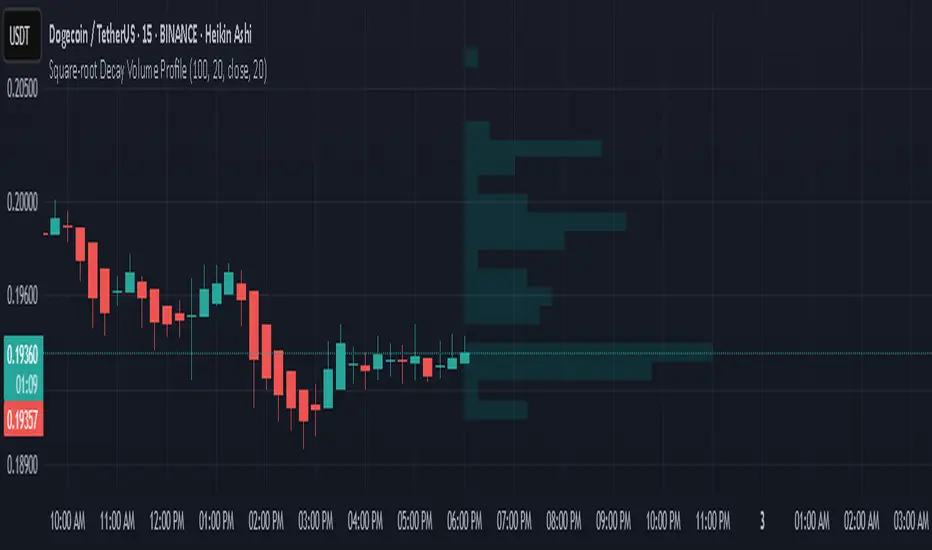
Square-root Decay Volume ProfileThis indicator displays a custom price profile that mimics a volume profile using occurrence-based weighting rather than actual volume. It counts how often the selected price source (e.g., close) falls within each price bin over a lookback period. What makes it unique is the use of square-root time decay: more recent price occurrences are given greater importance, while older data is discounted proportionally to the inverse square root of its age.
Each bin's relative weight is visualized as a horizontal bar aligned to the right edge of the chart, showing where price has "spent time" more recently. This allows traders to identify areas of interest, balance zones, and potential support/resistance levels based on decayed price density.
Key Features:
Square-root decay weighting favors recent price action
Adjustable lookback period, bin count, and histogram width
Works with any price source (close, hl2, etc.)
Plots boxes directly on the chart for clear visualization
This tool is especially useful for discretionary traders seeking a price-centric alternative to traditional volume profiles, with an added emphasis on recency.
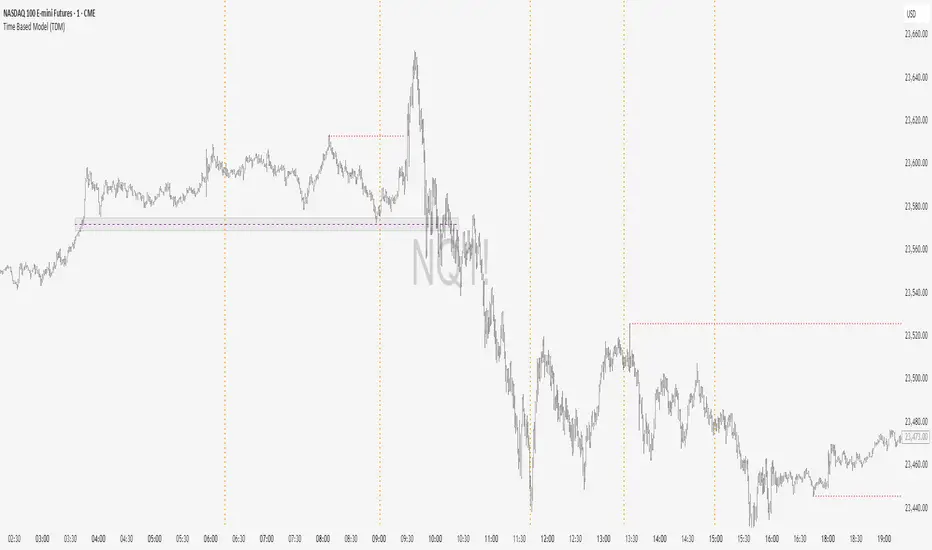
Time Based Model (TDM)This indicator is based on TDM's Time-Based Model, designed primarily for trading indices during the New York session.
The Time-Based Model follows the DC framework with some key adjustments:
It focuses on the New York session time, specifically from 14:00 to 14:00 EST.
The model pulls time Fibonacci levels between these 14:00-to-14:00 periods to identify potential market turning points.
Additionally, it applies the time Fibonacci retracement again on the last two segments to refine timing analysis.
This approach helps traders anticipate when price action is more likely to react, based on time cycles rather than just price levels, improving timing precision within the NY session.
Chaos Theory : Expansion Analysis Uncovering Probable Price PathWhat is Chaos Theory?
Chaos theory is the study of complex systems that appear random but actually follow deterministic mathematical laws. Discovered by meteorologist Edward Lorenz in the 1960s, it revealed that seemingly chaotic behavior often hides precise mathematical patterns.
Key Concepts:
The Butterfly Effect
The famous principle that tiny changes in initial conditions can lead to vastly different outcomes. In markets, this means a small price movement at a critical juncture can cascade into major trend changes. Named after Lorenz's discovery that a butterfly flapping its wings in Brazil could theoretically cause a tornado in Texas.
Sensitive Dependence on Initial Conditions
Chaotic systems are extremely sensitive to their starting state. While we cannot predict exact long-term outcomes, we can identify probability zones where the system is likely to evolve. This is why weather forecasts work for days, not months - and why our indicator predicts price destinations, not timing.
Strange Attractors
In chaos theory, systems tend to evolve toward certain states called attractors. Price doesn't move randomly - it's drawn toward these mathematical attractors that we identify as probability zones.
Fractals and Self-Similarity
Chaotic systems display similar patterns at different scales. This is why price charts look similar whether viewing 1-minute or daily timeframes - the same mathematical forces operate across all time scales.
Deterministic Chaos
The paradox at the heart of chaos theory: systems that are completely deterministic (following precise mathematical rules) can produce behavior that appears random. Markets aren't random - they're chaotic, which means they're predictable within probability bounds.
Why This Matters for Trading
Traditional technical analysis assumes markets are either random (efficient market hypothesis) or follow simple patterns (support/resistance). Chaos theory reveals a third truth: markets are complex dynamical systems that follow mathematical laws we can model and predict - not with certainty, but with probability.
This is the foundation of our indicator: applying the same mathematics that predicts weather patterns and planetary orbits to identify where price is mathematically likely to travel next.
🌟 Welcome to the World of Chaos Theory
We hope to provide our clients with a program that will define future points to which we believe price will expand to, based on a given probability % of one event occurring rather than another. In this case, the other event = price not expanding to our predicted area and reaching an invalidation state. This entire theory and the work done assumes that price behaves like a complex dynamical system that is highly sensitive to initial conditions.
🔮 Predictive vs. Reactive Systems
Pay special attention to the language used. Our belief is that we can provide you a tool that is predictive, not reactive - the latter of which falls into the class of descriptive systems. Although the term of price action study is referred to as time-series forecasting, most if not all of the works done under this umbrella do not forecast anything. They only describe the current or recent past state of affairs using averages, volume, volatility, and other concepts.
📊 Understanding Probability-Based Prediction
A predictive system conjured from the world of chaos theory is not a final solution to the mystery of price. In reality, we only can give you probabilities of where price may end up - this would be a point in space, not time, which we believe would be more likely than another, depending on the analysis of the initial conditions.
To make the point of the last paragraph crystal clear: while we can tell you, with respect to the probabilities, where price will end up in terms of a price point, we don't know WHEN. That is another part of the mystery that perhaps only clairvoyance can hope to uncover.
📈 Performance Statistics
For the question of what the probabilities are, meaning the success of the follow through of price, the answer is given in a stats panel, which measures the success of promises made by the indicator - that price would reach a certain point before being invalidated by moving too far in the opposing direction. It's not helpful to advertise or make false claims, therefore one should take advantage that we offer a free version, and using a pre-defined lookback window, confirm the probability calculations and determine the follow through rate with respect to the specific symbol and timeframe that the user decides to use.
⚠️ What This Is Not
What this is not → Descriptive. We have zero interest in describing what price is doing. In fact, the entire industry of price forecasting is dedicated to this task, therefore you can rest assured that any coincidence with an RSI or any type of moving average etc. is simply that - coincidence. We do not use any known pre-made indicators or formulas.
It has been our belief that price has an underlying mathematical pattern that can be predicted within probability bounds. If you read that carefully, we are predicting the pattern, not looking to find and describe some sort of underlying structure.
🧩 Understanding Market Complexity
It should be understood that price is a complex system, even if our initial assessment of the conditions are correct. We have to remember that price is a fractal structure - there are always different initial conditions clashing, as well as forming. This is without taking into account the manipulation of the system, as well as external intervention in the natural progression of the system by news or other significant events.
---
📋 To Summarize:
🔬 1. Chaos Theory Application to Markets
- Novel Concept: Treating price as a chaotic particle rather than random movement
- What This Means: Chaotic systems have underlying mathematical patterns that can be predicted within probability bounds
- Your Benefit: Access to predictive mathematics previously used only in physics and meteorology
🧮 2. Complex Systems Mathematics
- Novel Concept: Applying non-linear dynamical systems theory to financial markets
- What This Means: Markets behave like complex adaptive systems with emergent properties
- Your Benefit: Understanding market behavior at a fundamental mathematical level
🎯 3. Probability Field Mapping
- Novel Concept: Creating mathematical probability fields for future price locations
- What This Means: Each zone represents a calculated probability destination, not arbitrary support/resistance
- Your Benefit: Trade toward mathematically-derived targets instead of guessing
---
💡 Why This is Fundamentally Different from All Other Indicators
📉 Traditional Indicators:
- Use historical price data to create lagging signals
- Based on statistical averages and linear mathematics
- Assume markets are random or follow simple patterns
- React to what already happened
🚀 This Chaos Theory Approach:
- Uses mathematical modeling to predict future probability zones
- Based on non-linear complex systems mathematics
- Treats markets as chaotic but predictable systems
- Proactively identifies where price is likely to go
No Curve Fitting: Unlike indicators optimized for specific timeframes or instruments, chaos theory principles are universal mathematical laws that apply consistently across all markets.
---
🎁 Concrete Benefits You Receive
💫 1. Predictive Intelligence
- Know probable price destinations before they're reached
- Eliminate guesswork in setting profit targets
- Make informed decisions about trade direction
🎯 2. Mathematical Precision
- Every zone placement has mathematical justification
- No subjective interpretation required
- Consistent application across all market conditions
🌍 3. Universal Market Application
- Works identically on forex, stocks, crypto, commodities
- No need to adjust parameters for different instruments
- Mathematical principles transcend market types
🏆 4. Professional-Grade Analysis
- Access to institutional-level mathematical modeling
- Same complexity as quantitative hedge fund systems
- Simplified visual output for practical trading
✅ 5. Real-Time Performance Validation
- Built-in statistics track actual prediction accuracy
- Transparent performance measurement
- Data-driven confidence in signal quality
🛡️ 6. Risk Management Precision
- Mathematically-defined probable targets of desired and undesired price locations
- Systematic approach eliminates emotional decisions
⏱️ 7. Multi-Timeframe Consistency
- Zones maintain mathematical validity across timeframes
- Higher timeframe bias with lower timeframe precision
- Coherent analysis from scalping to position trading
---
🌟 Novel Trading Advantages
Probability-Based Targeting: Instead of hoping price reaches your target, you're trading toward mathematically-calculated probability zones.
Chaos Pattern Recognition: Probability-based predictions of the underlying chaotic patterns that govern price movement gives you an edge other traders don't possess.
Dynamic Adaptation: Unlike static indicators, this system continuously recalculates based on evolving market mathematics.
---
🔄 Why This Represents a Trading Evolution
From Reactive to Predictive: Traditional analysis tells you what happened. Chaos theory mathematics tells you what's likely to happen.
From Subjective to Objective: No more debating support and resistance levels. Mathematics determines probable price destinations.
From Curve-Fitted to Universal: Based on fundamental mathematical principles that work consistently across all markets and timeframes.
From Emotional to Systematic: Clear mathematical signals eliminate the psychological challenges that destroy most traders.
This indicator doesn't just give you another way to analyze markets - it gives you access to an entirely different mathematical framework for understanding price behavior. You're not getting a variation of existing concepts; you're getting a completely novel approach based on advanced mathematical principles that treat markets as the complex systems they actually are.
---
📚 How to Use the Indicator
🎨 Zone Mechanics
• Orange Zones: Target areas for price expansion
• Activation Trigger: Price must close outside any zone (full candle body, not just wicks)
• Primary Rule: Price travels to the next zone before closing back behind the originating zone border
🔴 Understanding the Red Dots
• Red dots on chart: Represent areas where we had valid zone sets available for trading
• Empty spaces indicate: Areas where price closed past the highest/lowest zone or where zone invalidation occurred
• Important note: We cannot always identify zones. Simply wait or switch timeframe/symbol
