Uptrick: ATR ModelIntroduction
The Uptrick: ATR Model is a multi-regime directional tool designed to adapt to various trading styles and timeframes. It combines trend assessment, market state evaluation, visual overlays, and signal filtering into a single, highly configurable system. This indicator is intended to help traders interpret directional conditions, structure their entries and exits, and view real-time shifts in market context, all without relying on external scripts or multiple chart layers.
Core Functionality
At its foundation, the Uptrick: ATR Model builds a framework that responds to user-defined structure and market behavior. Through a wide range of inputs, traders can adjust the internal responsiveness, signal frequency, and volatility interaction of the system. The core behavior of the model can be shaped via:
Custom starting date for signal activation
Flexible smoothing structure
Adjustable expansion control for range boundaries
Signal persistence settings to limit noise
Conditional plotting of directional signals
Real-time bar coloring and overlays
Custom routing between long, short, and neutral positioning
This indicator is not tied to a single interpretation of market movement. Instead, it adapts to how the user defines structural behavior, volatility confirmation, and trend alignment.
Multi-Regime Architecture
The script includes four unique operating regimes, each offering a distinct model of interpreting market conditions:
Trend Mode
This regime focuses on trend state transitions over time. Signal behavior is aligned with directional market shifts and transitions are plotted with visual labels. Optional filters and persistence settings help control signal quality and responsiveness.
Cloud Close Mode
Cloud Close mode detects transitions when price interacts with dynamic boundaries. Signals are generated when the asset moves in or out of these ranges. This regime supports state memory to avoid repeated signals and emphasizes confirmation over reactivity.
Lightning Trend Mode
This mode evaluates momentum alignment across selected structures. Its behavior is based on composite assessments and dynamically reflects changes in directional agreement. This regime is well-suited for intraday or high-resolution users seeking visual confirmation of trend shifts.
Final Verdict Mode
A meta-regime that combines the output of the other three modes into a single directional consensus. A live decision table is displayed on-screen, showing the current verdict of each regime and a final, averaged output. This mode is designed for high-conviction or conservative traders who prefer confirmation across multiple systems.
Each regime can be enabled through a single selector, and the indicator adapts its signal behavior and bar coloring to reflect the active mode.
Signal System and Visual Feedback
The indicator generates Long, Short, or Cash (neutral/exit) signals depending on the active regime, directional configuration, and filter conditions. Signal shapes are plotted only once per state transition and are color-coded for clarity.
Users can define:
Whether signals should support both long and short, or long-only
Whether repeated signals are allowed (pyramiding control)
Whether to enforce a minimum number of confirming bars before a signal is allowed (persistence)
Signals are accompanied by real-time bar coloring, giving users an instant visual cue of the current state without relying on shape markers alone. These signals adjust based on the selected regime and are subject to any active confirmation filters.
Confirmation Filters
To reduce noise and improve the relevance of each signal, the model includes two optional filters:
Strength Filter
[Applies a condition based on the asset’s momentum. When enabled, signals will only fire if this condition aligns with the trade direction. Includes parameters for sensitivity and smoothness.
Trend Filter
Applies a directional filter based on a broader trend context. Signals will only trigger when this larger structure supports the directional bias. This filter is useful for avoiding signals during counter-trend moves or consolidations.
Both filters can be toggled independently. When disabled, the model will operate with fewer restrictions.
Dynamic Structure Customization
Users can control how the internal structure of the model behaves using:
Source selection (e.g., close, open, high, etc.)
Smoothing configuration using a tiered structure with up to three stages
Custom length inputs to adjust responsiveness
Selectable method options for each layer
Expansion settings to adjust the distance of dynamic boundaries
Signal persistence threshold to delay entries until confirmation is met
This modular control allows traders to define whether they want faster reaction to movement or more conservative, delayed responses depending on their strategy.
Final Verdict Table
The Final Verdict table is a live display that summarizes the signal output of the three core regimes (Trend, Cloud Close, and Lightning Trend). It includes:
Regime names and their current directional state
Directional scores for each regime
A final averaged score and directional label
The table is updated every bar and is fully customizable:
Position on screen (top left, center, bottom right, etc.)
Text size for readability
Color-coded state labels for fast interpretation
This feature is designed to offer structured decision support by showing consensus or divergence across all logic models in real time.
Static Levels Module
An optional module allows the user to anchor a high point (typically an all-time high) from a user-defined historical date. From that anchor, multiple levels are projected downward using fixed ratios. These levels are:
Automatically updated when new highs occur
Visualized using horizontal step-lines
Fully customizable in terms of count, color, and source
These levels serve as contextual guides and can assist with price projection, risk management, or discretionary confluence zones.
Directional Control
The model supports both Long & Short and Long Only signal modes. In Long Only mode, exit signals are routed to neutral (Cash) instead of Short. This allows users to align the indicator with personal strategy, risk appetite, or portfolio rules. Neutral signals are also plotted with distinct labels and coloring to indicate a directional reset.
Input Summary
All components of the script are user-configurable through the following inputs:
Start date selector to restrict signal generation
Source selection for core price input
Custom lengths and responsiveness settings
Smoothing structure with optional stacking
Expansion control for range width
Signal persistence threshold
Signal type selector (long-only or long & short)
Regime selector between four logic systems
Filters: strength-based and trend-based
Verdict table display settings (position and size)
Static levels: anchor date, count, source, and visual customization
Originality
What sets the Uptrick: ATR Model apart is its integration of multiple directional systems into a single, configurable interface. Each regime is distinct and interprets market behavior from a unique perspective, while the Final Verdict mode offers a consolidated view that few tools provide in a fully visual and non-redundant format. The Lightning Trend scoring engine and modular structural design offer a level of control and flexibility uncommon in single-layer indicators. The combination of signal gating, decision tables, and state tracking creates a cohesive, structured environment for directional evaluation.
Summary
The Uptrick: ATR Model is a complete directional and volatility analysis system designed for customizable trend evaluation, signal clarity, and strategic filtering. It adapts to different trader needs through its configurable regimes, state-aware signals, dynamic overlays, and visual decision tools. It is suitable for discretionary traders seeking structured guidance, as well as systematic users who require configurable state management and signal control.
Disclaimer
This tool is provided for informational and research purposes only. It does not constitute investment advice or a recommendation to buy or sell any financial instrument. All trading involves risk, and past performance does not guarantee future results. Users are solely responsible for their own decisions.
Statistics

Z-Score Trend Channels [BackQuant]Z-Score Trend Channels
A self-contained price-statistics framework that turns a rolling z-score into price channels, bias states, and trade markers. Run either trend-following or mean-reversion from the same tool with clear, on-chart context.
What it is
A rolling statistical map that measures how far price is from its recent average in standard-deviation units (z-score).
Adaptive channels drawn in price space from fixed z thresholds, so the rails breathe with volatility.
A simple trend proxy from z-score momentum to separate trending from ranging conditions.
On-chart signals for pullback entries, stretched extremes, and practical exits.
Core idea (plain English math)
Rolling mean and volatility - Over a lookback you get the average price and its standard deviation.
Z-score - How many standard deviations the current price is above or below its average: z = (price - mean) / stdev. z near 0 means near average; positive is above; negative is below.
Noise control - An EMA smooths the raw z to reduce jitter and false flickers.
Channels back in price - Fixed z levels are converted back to price to form the upper, lower, and extreme rails.
Trend proxy - A smoothed change in z is used as a lightweight trend-strength line. Positive strength with positive z favors uptrend; negative strength with negative z favors downtrend.
What you see on the chart
Channels and fills - Mean, upper, lower, and optional extreme lines. The area mean->upper tints with the bearish color, mean->lower tints with the bullish color.
Background tint (optional) - Soft green, red, or neutral based on detected trend state.
Signals - Bullish Entry (triangle up) when z exits the oversold zone upward; Bearish Entry (triangle down) when z exits the overbought zone downward; Extreme markers (diamonds) at the extreme bands with a one-bar turn.
Table - Current z, trend state, trend strength, distance to bands, market state tag, and a quick volatility regime label.
Edge labels - MEAN, OB, and OS labels slightly projected forward with level values.
Inputs you will actually use
Z-Score Period - Lookback for mean and stdev. Larger = slower and steadier rails, smaller = more reactive.
Smoothing Period - EMA on z. Lower = earlier but choppier flips; higher = later but cleaner.
Price Source - Default hlc3. Choose close if you prefer session-close logic.
Upper and Lower Thresholds - Default around +2.0 and -2.0. Tighten for more signals, widen for fewer and stronger.
Extreme Upper and Lower - Deeper stretch guards, e.g., +/- 2.5.
Strength Period - EMA on z momentum. Sets how fast the trend proxy flips.
Trend Threshold - Minimum absolute z to accept a directional bias.
Visual toggles - Channels, signals, background tint, stats table, colors, and optional last-bar trend label.
How to use it: trend-following playbook
Read the state - Uptrend when z > Trend Threshold and trend strength > 0. Downtrend when z < -Trend Threshold and trend strength < 0. Neutral otherwise.
Entries - In an uptrend, prefer Bullish Entry signals that fire near the lower channel. In a downtrend, prefer Bearish Entry signals that fire near the upper channel.
Stops - Conservative: beyond the extreme channel on your side. Tighter: just outside the standard band that framed the signal.
Exits - For longs, exit or trim on a cross back through z = 0 or a clean tag of the upper threshold. For shorts, mirror with z = 0 up-cross or tag of the lower threshold. You can also reduce if trend strength flips against you.
Adds - In strong trends, additional signals near your side’s band can be add points. Avoid adding once z hovers near the opposite band for several bars.
How to use it: mean-reversion playbook
Find stretch - Standard reversions: Bullish Entry when z leaves the oversold zone upward; Bearish Entry when z leaves the overbought zone downward. Aggressive reversions: Extreme markers at extreme bands with a one-bar turn.
Entries - Take the signal as price exits the zone. Prefer setups where trend strength is near zero or tilting against the prior push.
Targets - First target is the mean line. A runner can aim for the opposite standard channel if momentum keeps flipping.
Stops - Outside the extreme band beyond your entry. If fading without extremes, place risk just beyond the opposite standard band.
Filters - Optional: skip counter-trend fades against a very strong trend state unless your risk is tight and predefined.
Reading the stats table
Current Z-Score - Magnitude and sign of displacement now.
Trend State - Uptrend, Downtrend, or Ranging.
Trend Strength - Smoothed z momentum. Higher absolute values imply stronger directional conviction.
Distance to Upper/Lower - Percent distance from price to each band, useful for sizing targets or judging room left.
Market State - Overbought, Oversold, Extreme OB, Extreme OS, or Normal.
Volatility Regime - High, Normal, or Low relative to recent distribution. Expect bands to widen in High and tighten in Low.
Parameter guidance (conceptual)
Z-Score Period - Choose longer for a structural mean, shorter for a reactive mean.
Smoothing Period - Lower for earlier but noisier reads; higher for slower but steadier reads.
Thresholds - Start around +/- 2.0. Tighten for scalping or quiet ranges. Widen for noisy or fast markets.
Trend Threshold and Strength Period - Raise to avoid weak, transient bias. Lower to capture earlier regime shifts.
Practical examples
Trend pullback long - State shows Uptrend. Price tests the lower channel; z dips near or below the lower threshold; a Bullish Entry prints. Stop just below extreme lower; first target mean; keep a runner if trend strength stays positive.
Mean-revert short - State is Ranging. z tags the extreme upper, an Extreme Bearish marker prints, then a Bearish Entry prints on the leave. Stop above extreme upper; target the mean; consider a runner toward the lower channel if strength turns negative.
Potential Questions you might have
Why z-score instead of fixed offsets - Because the bands adapt with volatility. When the tape gets quiet the rails tighten, when it runs hot the rails expand. Your entries stay normalized.
Do I need both modes - No. Many users run only trend pullbacks or only mean-reversions. The tool lets you toggle what you need and keep the chart readable.
Multi-timeframe workflow - A common approach is to set bias from a higher timeframe’s trend state and execute on a lower timeframe’s signals that align with it.
Summary
Z-Score Trend Channels gives you an adaptive mean, volatility-aware rails, a simple trend lens, and clear signals. Trade the trend by buying pullbacks in green and selling pullbacks in red, or fade stretched extremes back to the mean with defined risk. One framework, two strategies, consistent logic.

Week Start/End Bar CoordinatesGive the Bar Index for the First and Last of the Week,
input the coordinates directly into the Fixed Range Volume Profile

AKB - Aggressive ParticipationAggressive Participation - This indicator is made to allow traders identify which side (Bulls or Bears) is controlling the market at a specific time.

ORB Storico + Box Multipli + Notifiche (final clean v2)Session ORB Live Pro — Pre-Market Boxes & MA Suite
Description (EN):
Session ORB Live Pro is a Pine v6 indicator built for intraday traders who rely on Opening Range Breakouts. It draws session boxes for London, New York, and Asia—plus configurable Pre-London and Pre-New York windows—live from the very first candle (no waiting for 10 bars). The high/low levels update in real time, and optional breakout alerts fire the moment price closes beyond the range. To keep charts clean and relevant for scalping, the boxes auto-hide on chart timeframes above 20 minutes.
Beyond ranges, the tool adds a compact moving-average suite: SMA-50 and RMA-200 out of the box, plus three fully customizable MAs (SMA/EMA/RMA/WMA/HMA) with selectable color, thickness, and style (line, stepline, circles). Each session and pre-session can be toggled on/off and tinted with its own color, so you can tailor the visual map of liquidity grabs and range breaks to your strategy.
Key features
Live ORB boxes for London, New York, Asia (no 10-bar delay).
Pre-sessions: Pre-London & Pre-New York with independent time windows and colors.
Auto visibility filter: boxes show only on ≤ 20m chart TF; hidden on higher TFs.
Breakout alerts when price closes above/below the session range (ready for alert() rules).
MA toolkit: SMA-50, RMA-200 + 3 user MAs (SMA/EMA/RMA/WMA/HMA) with color, style, and width.
Clean inputs using input.session; robust, low-friction UX.
How to use
Set your ORB calculation timeframe (e.g., 15m) and choose which sessions/pre-sessions to display.
Pick colors for each box and enable alerts if you want instant breakout notifications.
Configure the MA suite for trend bias and dynamic S/R (e.g., SMA-50 for momentum, RMA-200 for bias).
Trade the first clean break or the retest of the ORB extremes—your choice. The visual map updates tick by tick.

NOK Basket (Equal-Weighted)Measures the Norwegian crown's relative value to a basket of other currencies: EUR, USD, GBP, SEK AND DKK.

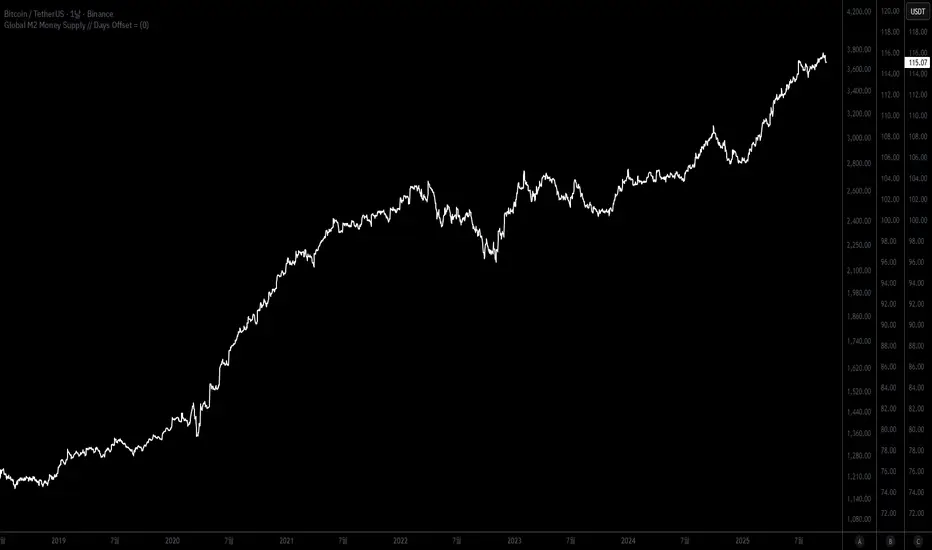
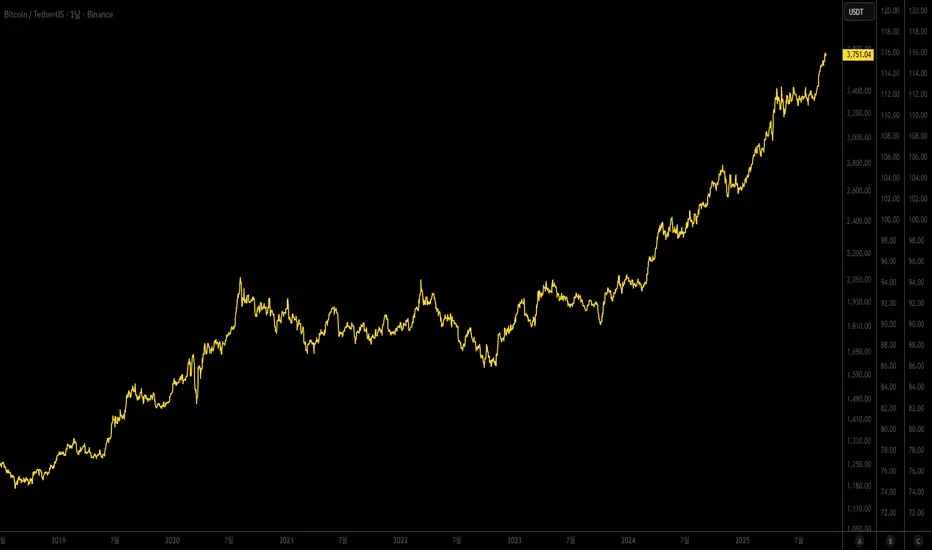
Global M2 Money SupplyThis indicator calculates and plots an aggregated estimate of the Global M2 money supply, expressed in U.S. dollar terms. It combines M2 data from major economies and regions—including the U.S., Eurozone, Canada, the U.K., Switzerland, China, Japan, India, Brazil, and others—and adjusts each by its respective FX rate to USD. By summing these series, the script provides a broad view of worldwide liquidity conditions in one line.
A user-defined offset in days allows you to shift the global M2 line forward or backward, making it easier to visually compare liquidity trends against asset prices such as Bitcoin, gold, or equities. This tool is designed for traders and macro observers who want to study how global money supply growth or contraction correlates with financial markets over time.
이 지표는 전 세계 주요 국가와 지역의 M2 통화량을 달러 기준으로 합산하여 글로벌 유동성 지표로 보여줍니다. 미국, 유로존, 캐나다, 영국, 스위스, 중국, 일본, 인도, 브라질 등 여러 지역의 M2 데이터를 각 통화의 환율(USD 환산)로 조정한 뒤 합산해 하나의 흐름으로 표현합니다. 이를 통해 글로벌 차원의 통화 공급 변화를 한눈에 파악할 수 있습니다.
또한 사용자가 지정한 일 단위 오프셋 기능을 통해 글로벌 M2 라인을 앞뒤로 이동시켜, 비트코인·금·주식 등 다양한 자산 가격과의 시차적 관계를 직관적으로 비교할 수 있습니다. 거시경제 환경과 자산시장 간의 상관성을 연구하거나 시장 유동성 추이를 모니터링하려는 투자자에게 유용한 도구입니다.
Gold Lagging (N days)This indicator overlays the price of gold (XAUUSD) on any chart with a customizable lag in days. You can choose the price source (open, high, low, close, hlc3, ohlc4), shift the series by a set number of daily bars, and optionally normalize the values so that the first visible bar equals 100. The original gold line can also be displayed alongside the lagged series for direct comparison.
It is especially useful for analyzing delayed correlations between gold and other assets, observing shifts in safe-haven demand, or testing hypotheses about lagging market reactions. Since the lag is calculated on daily data, it remains consistent even if applied on intraday charts, while the indicator itself can be plotted on a separate price scale for clarity.
이 지표는 금(XAUUSD) 가격을 원하는 차트 위에 N일 지연된 형태로 표시합니다. 가격 소스(시가, 고가, 저가, 종가, hlc3, ohlc4)를 선택할 수 있으며, 지정한 일 수만큼 시리즈를 뒤로 이동시킬 수 있습니다. 또한 첫 값 기준으로 100에 맞춰 정규화하거나, 원래 금 가격선을 함께 표시해 비교할 수도 있습니다.
금과 다른 자산 간의 지연 상관관계를 분석하거나 안전자산 수요 변화를 관찰할 때 유용하며, 시장 반응의 시차 효과를 검증하는 데에도 활용할 수 있습니다. 지연은 일봉 데이터 기준으로 계산되므로 단기 차트에 적용해도 일 단위 기준이 유지되며, 별도의 가격 스케일에 표시되어 가독성을 높일 수 있습니다.
Session Volume Profile HVN210
Session Volume Profile HVN - Comprehensive Indicator Description
Overview
The Session Volume Profile HVN is an advanced volume analysis indicator that provides traders with a visual representation of volume distribution across price levels within defined trading sessions. This powerful tool combines traditional volume profile analysis with High Volume Node (HVN) detection and Volume Point of Control (VPOC) tracking to help identify key support and resistance areas based on trading activity.
Key Features
1. Dynamic Volume Profile Visualization
Creates a comprehensive volume profile for each trading session (daily, weekly, or custom timeframes)
Displays volume distribution as a horizontal histogram, showing where the most trading activity occurred
Automatically scales to fit the price range of each session
Customizable number of price levels (rows) for granular or broad analysis
Profile extension capability to project volume areas into subsequent sessions
2. Volume Point of Control (VPOC)
Automatically identifies and marks the price level with the highest volume in each session
Displays VPOC as a prominent horizontal line that can extend into future sessions
Tracks multiple historical VPOCs with customizable extension limits
Optional date labels for easy identification of when each VPOC was formed
Particularly useful for identifying potential support/resistance levels based on peak trading activity
3. High Volume Node (HVN) Detection
Sophisticated algorithm that identifies significant volume clusters within the profile
Validates HVNs based on customizable strength criteria
Two display options:
Levels: Shows HVNs as horizontal lines (solid for VPOC, dotted for other nodes)
Areas: Displays HVNs as shaded boxes covering the full price range of the node
Color-coded based on price position relative to previous close:
Bullish color for HVNs below the previous close (potential support)
Bearish color for HVNs above the previous close (potential resistance)
4. Multi-Timeframe Analysis
Profile Timeframe: Defines the session boundaries (e.g., daily, weekly, monthly)
Resolution Timeframe: Uses lower timeframe data for more accurate volume distribution
Automatically adjusts to ensure compatibility with chart timeframe
Enables precise volume analysis even on higher timeframe charts
Practical Applications
Support and Resistance Identification
VPOCs and HVNs often act as significant support/resistance levels
Multiple confluent HVNs can indicate strong price zones
Historical VPOC levels provide context for potential price reactions
Trading Strategy Development
Entry/exit points near HVN boundaries
Stop loss placement beyond significant volume nodes
Trend continuation or reversal signals when price breaks through HVN areas
Market Structure Analysis
Identify accumulation/distribution zones
Recognize price acceptance or rejection at specific levels
Understand market participant behavior through volume concentration
Customization Options
Visual Settings
Adjustable colors for profile, VPOC lines, and HVN areas
Line width controls for better visibility
Label size options from tiny to huge
Profile transparency for chart clarity
Technical Parameters
Number of price levels (rows) for profile resolution
HVN detection strength for sensitivity adjustment
VPOC extension count for historical reference
Profile extension percentage for future projection
Display Preferences
Toggle VPOC visibility
Enable/disable HVN display
Choose between line or area representation for HVNs
Control date label display based on timeframe
Best Practices
Timeframe Selection: Choose profile timeframes that align with your trading style (day traders might use hourly profiles, swing traders daily or weekly)
HVN Strength Calibration: Adjust the HVN strength parameter based on market volatility and desired sensitivity
Multiple Timeframe Confirmation: Use different profile timeframes to identify confluence zones
Combination with Other Indicators: Enhance analysis by combining with trend indicators, momentum oscillators, or price action patterns
Performance Considerations
The indicator is optimized for smooth performance while maintaining accuracy through:
Efficient data processing algorithms
Smart memory management for historical data
Automatic cleanup of old visual elements
Scalable architecture supporting up to 500 visual elements
Ideal For
Day Traders: Identifying intraday support/resistance levels
Swing Traders: Finding multi-day accumulation zones
Position Traders: Analyzing longer-term volume structures
Market Analysts: Understanding market participant behavior
Algorithmic Traders: Incorporating volume-based levels into automated strategies

SSMT & PSP- Made this one public so that people can search for it and get it without link
- Same code used in the private one
- Credits to VX, Fruits and Solidarity for allowing me to make this <3

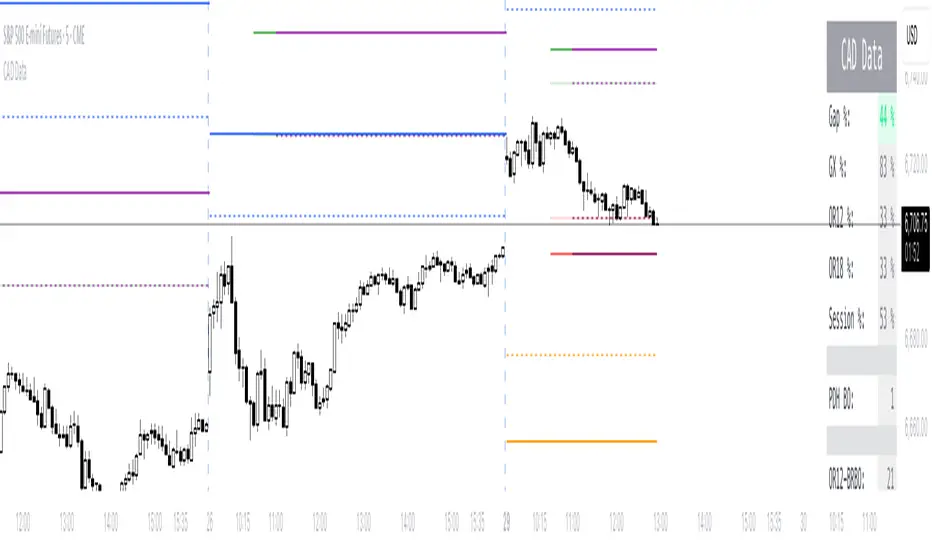
CAD DataThis indicator provides all of the data required to use the Context Analysis Dashboard (CAD) for live trading.
Morning Peak FadeMorning Peak Fade is an intraday analysis tool that identifies and measures the probability of early session rallies turning into sharp pullbacks.
📊 Core Idea
• Many stocks surge after the open, reaching an intraday peak before fading lower.
• This script anchors at the first significant morning high and tracks the drawdowns that follow within a customizable time window.
• It provides:
• Probability of a fade after the peak
• Average and maximum drawdown statistics
• Event-day hit rate (how often such setups occur)
🎯 Use Cases
• Spot potential “fade setups” where early enthusiasm exhausts quickly.
• Quantify how often chasing the morning high turns into a losing trade.
• Backtest opening range failure or fade strategies with hard data.
⚙️ Features
• Customizable thresholds for the initial surge (relative to prior close).
• Marks the peak (max) and subsequent low (min) used in calculations.
• Draws a reference line at the surge threshold to visualize when the fade triggers.
• Outputs summary stats directly on the chart.

Premarket Power MovePremarket Power Move is an intraday research tool that tracks what happens after strong premarket or opening gaps.
📊 Core Idea
• When a stock opens +X% above the prior close, it often attracts momentum traders.
• This script measures whether the stock continues to follow through higher or instead fades back down within the first trading hour.
• It calculates:
• The probability of a post-gap rally vs. a drawdown
• Average and maximum retracements after the surge
• Event-day hit rate (how many days actually triggered the condition)
🎯 Use Cases
• Identify “gap-and-go” opportunities where strong premarket strength leads to further gains.
• Spot potential fade setups where early enthusiasm quickly reverses.
• Backtest your intraday strategies with objective statistics instead of gut feeling.
⚙️ Features
• Customizable thresholds for premarket/open surge (%) and follow-through window (minutes).
• Marks the chart with reference lines:
• Prior close
• Surge threshold (e.g. +6%)
• Intraday high/low used for probability calculations.
• Outputs summary statistics (probabilities, averages, counts) directly on the chart.
🔔 Note
This is not a buy/sell signal generator. It is a probability and behavior analysis tool that helps traders understand how often strong premarket gaps continue vs. fade.

Z-AxisZ-Axis is a new and unique indicator that can visualize volume. This indicator is all the stuff I used to do manually on charts. It shows where individual big bags of money are. It flags statistically significant volume by making a ray, higher volume will be different colors. Same color scheme as fire - white hot.
Some people try to wonder what the "market maker" thinks or where did they buy. I personally think of the elusive "market maker" like a school of fish moving together. Squeeze the timeframe down to 1 minute, and you see all the fish that think the same way.
Purple means that candle is in the top 7 standard deviations, or 7x.
Red is 10x
Orange is 15x
Yellow is 20x
White is 25x, and triggers an AVWAP.
25 Standard deviations is 99% followed by "9" for 137 decimal spaces... and it still triggers. ye ha.
Once price has moved 2% against the opening of the candle, it's dimmed/liquidated. When this happens, that means that anyone who bought at that candle open at 50x leverage, they are now a ghost.
Price is often drawn to "liquidity wells", visualized here as the black space between pivots.

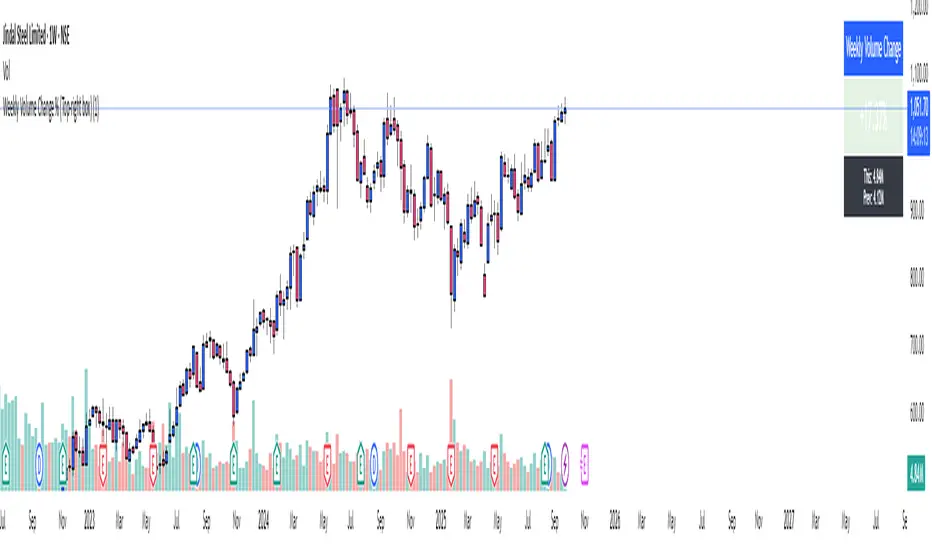
Weekly Volume ChangeWeekly Volume Change %
See weekly volume trends at a glance! This indicator shows current vs. previous week’s volume, calculates percent change, and highlights increases (green) or decreases (red). Features customizable look-back weeks and table color for easy visualization.
PongExperience PONG! The classic arcade game, now on your charts!
With this indicator, you can finally achieve your lifelong dream of beating the Markets. . . at PONG!
Pong is jam-packed with features! Such as:
2 Paddles
A moving dot
Floating numbers
The idea of a net
This indicator is solely a visualization, it serves simply as an exercise to depict what is capable through PineScript. It can be used to re-skin other indicators or data, but on its own, is not intended as a market indicator.
With that out of the way...
> PONG
The Pong indicator is a recreation of the classic arcade game Pong developed to pit the markets against the cold hard logic of a CPU player.
Given the lack of interaction that is capable, the game is not played in the typical sense, by a player and computer or 2 players.
This version of Pong uses the chart price movements to control the "Market" Paddle, and it is contrasted by a (not AI) "CPU" Paddle, which is controlled by its own set of logic.
> Market Paddle
The Market Paddle is controlled by a data source which can be input by the user.
By default (Auto Mode), the Market Paddle is controlled through a fixed length Donchian channel range, pinning the range high to 100 and range low to 0. As seen below.
This can be altered to use data from different symbols or indicators, and can optionally be smoothed using multiple types of Moving Averages.
In the chart below, you can see how the RSI indicator is imported and smoothed to control the Market Paddle.
Note: The Market Paddle follows the moving average. If not desired, simply set the "Smoothing" input to "NONE".
> CPU Paddle
In simple terms, the CPU Paddle is a handicapped Aimbot.
Its logic is, more or less, "move directly towards the ball's vertical location".
If it were allowed to have full range of the screen, it would be impossible for it to lose a point. Due to this, we must slow it down to "play fair"... as fair as that may be.
The CPU Paddle is allowed to move at a rate specified by a certain Percent of its vertical width. By default, this is set to 2%.
Each update, the CPU Paddle can advance up or down 2% of its vertical width. The directional movement is determined based on the angle of the ball, and it's current position relative to the CPU Paddle's position. Given that it is not a direct follow, it may at times seem more... "human".
When a point is scored, the CPU paddle maintains its position, similar to the original Pong game, the paddles were controlled solely by the raw output of the controllers and did not reset.
> Ball
At the start of each point, the ball begins at the center of the screen and moves in a randomly determined angle at its base speed.
The direction is determined by the player who scored the last point. The loser of the last point "serves" the ball.
Given the circumstances, serving is a gigantic advantage. So the loser serving is just another place where the Market is given an advantage.
The ball's base speed is 1, it will move 1 (horizontal) bar on each update of the script. This speed can "technically" increase to infinity over time, if given the perfect rally. This is due to the hit logic as described below.
Note: The minimum ball speed is also 1.
> Bonk Math
When the ball hits a paddle, essentially 3 outcomes can occur, each resulting in the ball's direction being changed from positive to negative.
Action A: Its angle is doubled, and its speed is doubled.
Action B: Its angle is reversed, and its speed is decreased if it is going faster than base speed.
Action C: Its angle is preserved, and its speed is preserved. "Basic Bounce"
Each paddle is segmented into 3 zones, with the higher and lower tips (20%) of the paddles producing special actions.
The central 60% of each paddle produces a basic bounce. The special actions are determined by the trajectory of the ball and location on the paddle.
> Custom Mode
As stated above, the script loads in "Auto Mode" by default. While this works fine to simply watch the gameplay, the Custom Mode unlocks the ability to visualize countless possibilities of indicators and analyses playing Pong!
In the chart below, we have set up the game to use the NYSE TICK Index as our Market Player. The NYSE TICK Index shows the number of NYSE stocks trading on an uptick minus those on a downtick. Its values fluctuate throughout the day, typically ranging between +1000 and -1000.
Therefore, we have set up Pong to use Ticker USI:TICK and set the Upper Boundary to 1000 and Lower Boundary to -1000. With this method, the paddle is directly controlled by the overall (NYSE) market behaviors.
As seen in a chart earlier, you can also take advantage of the Custom Mode to overlay Pong onto traditional oscillators for use anywhere!
> Styles
This version of Pong comes stocked with 5 colorways to suit your chart vibes!
> Pro Tips & Additional Information
- This game has sound! For the full experience, set alerts for this indicator and a notification sound will play on each hit!*
*Due to server processing, the notification sounds are not precisely played at each hit. :(
- In auto mode, decreasing the length used will give an advantage to the market, as its actions become more sporadic over this window.
- The CPU logic system actually allows the market to have a "technical" edge, since the Market Paddle is not bound to any speed, and is solely controlled by the raw market movements/data input.
- This type of visualization only works on live charts, charts without updates will not see any movement.
- Indicator sources can only be imported from other indicators on the same chart.
- The base screen resolution is 159 bars wide, with the height determined by the boundaries.
- When using a symbol and an outside source, be mindful that the script is attempting to pull the source from the input symbol. Data can appear wonky when not considering the interactions of these inputs.
There are many small interesting details that can't be seen through the description. For example, the mid-line is made from a box. This is because a line object would not appear on top of the box used for the screen. For those keen eye'd coders, feel free to poke around in the source code to make the game truly custom.
Just remember:
The market may never be fair, but now at least it can play Pong!
Enjoy!

Sessions - Full HeightEN : Full-height background sessions using bgcolor(). Asia, London, and New York sessions with configurable time windows, colors, and timezone. Open-source for learning and reuse.
RU : Индикатор заливает фон сессий на всю высоту графика (Азия, Лондон, Нью-Йорк). Настраиваемые окна времени и цвета.

StoxAI Magic Trend Indicator V2StoxAI Magic Trend Indicator V2 is here. Get live Trade Stats and Strength Scores with AI weights for each candlestick chart.


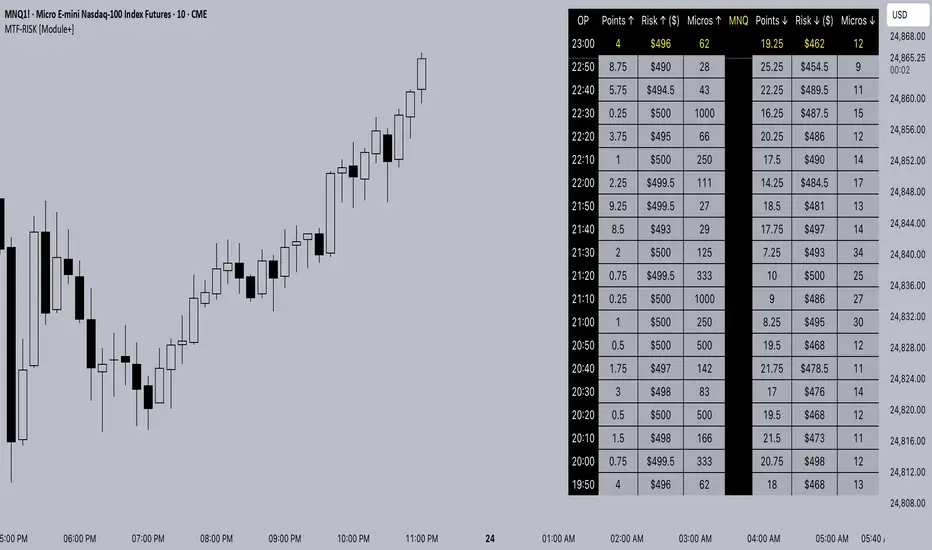
MTF-RISK [Module+]Description
MTF-RISK is a futures risk management tool that calculates standardized position sizing across multiple CME micro contracts, anchored to higher-timeframe structure. By combining multi-timeframe reference levels with a contract-based dollar-per-point model, it allows traders to maintain consistent risk across different futures markets.
Example:
User has selected the 1H timeframe for the risk table. Once an hourly candle closes, the high and low of that completed hour are locked as reference boundaries.
Lower timeframe candles (e.g., 1m, 5m, 15m) reference these established 1H boundaries to calculate:
Distance in points from the current close to the HTF high or low.
Corresponding dollar risk based on the user-defined Max Risk per Trade ($) setting.
The risk table updates in real-time, showing the current stop distance, calculated contract size, and resulting risk in dollars for both upward and downward directions.
Benefit: Traders always maintain a fixed dollar risk, regardless of intraday price movement, while using HTF structure as the anchor for accurate and consistent position sizing.
1. Higher Timeframe Anchor
Always uses the last fully closed candle from the selected higher timeframe (default: 60m).
Captures the prior HTF high and low as reference boundaries.
Lower timeframe closers (e.g., 1m, 5m, 15m bars) reference these established HTF boundaries to measure stop distances and calculate risk.
Use: Ensures all position sizing is tied to completed HTF structure, providing a consistent framework for intraday trades.
2. Risk Model Engine
Traders define maximum dollar risk per trade.
The system calculates allowable micro contracts based on stop distance (current close → HTF high/low).
Supported contracts and their point values:
MNQ (Micro Nasdaq 100): $2.00 per point
MES (Micro S&P 500): $5.00 per point
MYM (Micro Dow Jones): $0.50 per point
MGC (Micro Gold): $10.00 per point
Formula:
Contracts = Max Risk ÷ (Stop Distance × TSE:VALUE per Point)
Risk ↑: Based on distance to HTF high.
Risk ↓: Based on distance to HTF low.
Use: Provides consistent dollar risk sizing across different futures contracts and multiple intraday timeframes.
3. Risk Table Overlay
Compact, real-time on-chart table with customizable styling.
Columns:
OP: Operation time (adjusted by user’s timezone offset).
Points ↑ / ↓: Stop distances in points relative to HTF boundaries.
Risk ↑ / ↓ ($): Dollar exposure at those stops.
Micros ↑ / ↓: Allowable contract count.
Asset: Displays selected futures contract in the header.
Custom features:
Independent text/background colors per column.
Highlighted latest row for clarity.
Adjustable outline, row colors, and text size.
Use: Gives traders immediate insight into position sizing without leaving the chart.
Intended Use:
This is a risk visualization module, not a trade signal generator. Traders can use it to:
Standardize risk sizing across multiple CME micro futures.
Quickly evaluate trade setups relative to HTF structure.
Measure stop distances from lower timeframe closes while referencing HTF boundaries.
Maintain consistency in risk management regardless of the instrument traded.
Limitations & Disclaimers:
Calculations assume standard CME tick values for MNQ, MES, MYM, and MGC.
Other markets may not align with these dollar-per-point values.
This indicator does not predict direction, generate entries, or guarantee outcomes.
For educational and informational purposes only.
Trading involves risk; always use proper risk management.
Closed-source (Protected): Logic is visible on charts, but source code is hidden.
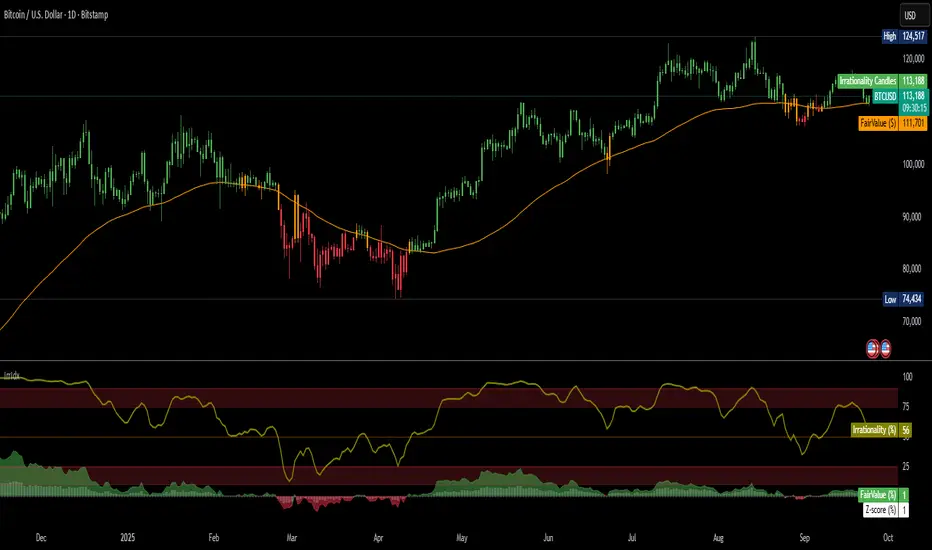
Irrationality Index by CRYPTO_ADA_BTC"The market can be irrational longer than you can stay solvent" ~ John Maynard Keynes
This indicator, the Irrationality Index, measures how far the current market price has deviated from a smoothed estimate of its "fair value," normalized for recent volatility. It provides traders with a visual sense of when the market may be behaving irrationally, without giving direct buy or sell signals.
How it works:
1. Fair Value Calculation
The indicator estimates a "fair value" for the asset using a combination of a long-term EMA (exponential moving average) and a linear regression trend over a configurable period. This fair value serves as a smoothed baseline for price, balancing trend-following and mean-reversion.
2. Volatility-Adjusted Z-Score
The deviation between price and fair value is measured in standard deviations of recent log returns:
Z = (log(price) - log(fairValue)) / volatility
This standardization accounts for different volatility environments, allowing comparison across assets.
3. Irrationality Score (0–100)
The Z-score is transformed using a logistic mapping into a 0–100 scale:
- 50 → price near fair value (rational zone)
- >75 → high irrationality, price stretched above fair value
- >90 → extreme irrationality, unsustainable extremes
- <25 → high irrationality, price stretched below fair value
- <10 → extreme bearish irrationality
4. Price vs Fair Value (% deviation)
The indicator plots the percentage difference between price and fair value:
pctDiff = (price - fairValue) / fairValue * 100
- Positive values → Percentage above fair value (optimistic / overvalued)
- Negative values → Percentage below fair value (pessimistic / undervalued)
Visuals:
- Irrationality (%) Line (0–100) shows irrationality level.
- Background Colors: Yellow= high bullish irrationality, Green= extreme bullish irrationality, Orange= high bearish irrationality, Red= extreme bearish irrationality.
- Price - FairValue (%) plot: price deviation vs fair value (%), Colored green above 0 and red below 0.
- Label: display actual price, estimated fair value, and Z-score for the latest bar.
- Alerts: configurable thresholds for high and extreme irrationality.
How to read it:
- 50 → Market trading near fair value.
- >75 / >90 → Price may be irrationally high; risk of pullback increases.
- <25 / <10 → Price may be irrationally low; potential rebound zones, but trends can continue.
- Price - FairValue (%) plot → visual guide for % price stretch relative to fair value.
Notes / Warnings:
- Measures relative deviation, not fundamental value!
- High irrationality scores do not automatically indicate trades; markets can remain can be irrational longer than you can stay solvent .
- Best used with other tools: momentum, volume, divergence, and multi-timeframe analysis.
Volume ClusteringThis Volume Clustering script is a powerful tool for analyzing intraday trading dynamics by combining two key metrics: volume Z-Score and Cumulative Volume Delta (CVD). By categorizing market activity into distinct clusters, it helps you identify high-conviction trading opportunities and understand underlying market pressure.
How It Works
The script operates on a simple, yet effective, premise: it classifies each trading bar based on its statistical significance (volume Z-Score) and buying/selling pressure (CVD).
Volume Z-Score
The volume Z-Score measures how far the current bar's volume is from its average, helping to identify periods of unusually high or low volume. This metric is a powerful way to spot when institutional or large players might be entering the market. A high Z-Score suggests a significant event is taking place, regardless of direction.
Cumulative Volume Delta (CVD)
CVD tracks the net buying and selling pressure across different timeframes. The script uses a lower timeframe (e.g., 1-minute) and anchors it to a higher timeframe (e.g., 1-day) to capture intraday pressure. A positive CVD indicates more buying pressure, while a negative CVD suggests more selling pressure.
Cluster Categories
The script analyzes the confluence of these two metrics to assign a cluster to each bar, providing actionable insights. The clusters are color-coded and labeled to make them easy to interpret:
🟢 High Conviction Bullish: Unusually high volume (high Z-Score) combined with significant buying pressure (high CVD). This cluster suggests strong bullish momentum.
🔴 High Conviction Bearish: Unusually high volume (high Z-Score) coupled with significant selling pressure (low CVD). This cluster suggests strong bearish momentum.
🟡 Low Conviction/Noise: Low to moderate volume and mixed buying/selling pressure. This represents periods of indecision or consolidation, where market noise is more prevalent.
🟣 Other Clusters: The script also identifies other combinations, such as high volume with moderate CVD, or low volume with high CVD, which can provide additional context for understanding market dynamics.
Key Features & Customization
The script offers several customizable settings to tailor the analysis to your specific trading style:
Z-Score Lookback Length: Adjust the lookback period for calculating the average volume. A shorter period focuses on recent volume trends, while a longer period provides a broader context.
CVD Anchor & Lower Timeframe: Define the timeframes used for CVD calculation. You can anchor the analysis to a daily or weekly timeframe while using a lower timeframe (e.g., 1-minute) to capture granular intraday pressure.
High/Low Volume Mode: Toggle between "High Volume" mode (which uses 90th and 10th percentiles for clustering) and "Low Volume" mode (which uses 75th and 25th percentiles). This allows you to choose whether to focus on extreme events or more subtle shifts in market sentiment.

Combined Cluster & Market StructureI barrowed code from the Mxwll Price Action Suite script as appreciated the structure in which the script defined structure, however I renamed variables and reduced the original script to define only the outer structure. I added volume and CVD clustering to define ranges and initiation market structures and add the ADX to assist with determining trend strength prior to labeling market structure breaks.
Combined Cluster & Market Structure indicator, a powerful and comprehensive tool for technical analysis. This script integrates two core concepts to provide a holistic view of market dynamics:
Z-Score Clustering & Volume Analysis: The indicator calculates Z-scores for both volume and Cumulative Volume Delta (CVD) to categorize market activity into six distinct clusters:
High-Conviction Bullish/Bearish: Signals of strong directional momentum based on high volume and corresponding CVD.
Effort vs. Result: High volume with moderate CVD, suggesting potential indecision or absorption.
Quiet Accumulation/Distribution: Low-volume periods with strong CVD, often preceding major moves.
Low Conviction/Noise: Represents periods of low market participation and weak signals.
These clusters are visually marked on the chart to provide real-time insight into market sentiment.
Market Structure Mapping: The indicator automatically detects and labels significant structural points to help you navigate price action. It identifies:
Higher Highs (HH) and Lower Lows (LL) to show the primary trend direction.
Breaks of Structure (BoS), indicating trend continuation.
Changes of Character (CHoCH), signaling a potential trend reversal.
Additionally, the script features consolidation box detection, which automatically highlights periods of low-conviction market activity, helping you avoid choppy, sideways markets. An integrated ADX filter ensures that structural breaks are only labeled during periods of strong trend strength, reducing false signals.
I want to thank Mxwll Capital for their contribution to the Combined Cluster & Market Structure indicator.
