Uptrick: Acceleration ShiftsIntroduction
Uptrick: Acceleration Shifts is designed to measure and visualize price momentum shifts by focusing on acceleration —the rate of change in velocity over time. It uses various moving average techniques as a trend filter, providing traders with a clearer perspective on market direction and potential trade entries or exits.
Purpose
The main goal of this indicator is to spot strong momentum changes (accelerations) and confirm them with a chosen trend filter. It attempts to distinguish genuine market moves from noise, helping traders make more informed decisions. The script can also trigger multiple entries (smart pyramiding) within the same trend, if desired.
Overview
By measuring how quickly price velocity changes (acceleration) and comparing it against a smoothed average of itself, this script generates buy or sell signals once the acceleration surpasses a given threshold. A trend filter is added for further validation. Users can choose from multiple smoothing methods and color schemes, and they can optionally enable a small table that displays real-time acceleration values.
Originality and Uniqueness
This script offers an acceleration-based approach, backed by several different moving average choices. The blend of acceleration thresholds, a trend filter, and an optional extra-entry (pyramiding) feature provides a flexible toolkit for various trading styles. The inclusion of multiple color themes and a slope-based coloring of the trend line adds clarity and user customization.
Inputs & Features
1. Acceleration Length (length)
This input determines the number of bars used when calculating velocity. Specifically, the script computes velocity by taking the difference in closing prices over length bars, and then calculates acceleration based on how that velocity changes over an additional length. The default is 14.
2. Trend Filter Length (smoothing)
This sets the lookback period for the chosen trend filter method. The default of 50 results in a moderately smooth trend line. A higher smoothing value will create a slower-moving trend filter.
3. Acceleration Threshold (threshold)
This multiplier determines when acceleration is considered strong enough to trigger a main buy or sell signal. A default value of 2.5 means the current acceleration must exceed 2.5 times the average acceleration before signaling.
4. Smart Pyramiding Strength (pyramidingThreshold)
This lower threshold is used for additional (pyramiding) entries once the main trend has already been identified. For instance, if set to 0.5, the script looks for acceleration crossing ±0.5 times its average acceleration to add extra positions.
5. Max Pyramiding Entries (maxPyramidingEntries)
This sets a limit on how many extra positions can be opened (beyond the first main signal) in a single directional trend. The default of 3 ensures traders do not become overexposed.
6. Show Acceleration Table (showTable)
When enabled, a small table displaying the current acceleration and its average is added to the top-right corner of the chart. This table helps monitor real-time momentum changes.
7. Smart Pyramiding (enablePyramiding)
This toggle decides whether additional entries (buy or sell) will be generated once a main signal is active. If enabled, these extra signals act as filtered entries, only firing when acceleration re-crosses a smaller threshold (pyramidingThreshold). These signals have a '+' next to their signal on the label.
8. Select Color Scheme (selectedColorScheme)
Allows choosing between various pre-coded color themes, such as Default, Emerald, Sapphire, Golden Blaze, Mystic, Monochrome, Pastel, Vibrant, Earth, or Neon. Each theme applies a distinct pair of colors for bullish and bearish conditions.
9. Trend Filter (TrendFilter)
Lets the user pick one of several moving average approaches to determine the prevailing trend. The options include:
Short Term (TEMA)
EWMA
Medium Term (HMA)
Classic (SMA)
Quick Reaction (DEMA)
Each method behaves differently, balancing reactivity and smoothness.
10. Slope Lookback (slopeOffset)
Used to measure the slope of the trend filter over a set number of bars (default is 10). This slope then influences the coloring of the trend filter line, indicating bullish or bearish tilt.
Note: The script refers to this as the "Massive Slope Index," but it effectively serves as a Trend Slope Calculation, measuring how the chosen trend filter changes over a specified period.
11. Alerts for Buy/Sell and Pyramiding Signals
The script includes built-in alert conditions that can be enabled or configured. These alerts trigger whenever the script detects a main Buy or Sell signal, as well as extra (pyramiding) signals if Smart Pyramiding is active. This feature allows traders to receive immediate notifications or automate a trading response.
Calculation Methodology
1. Velocity and Acceleration
Velocity is derived by subtracting the closing price from its value length bars ago. Acceleration is the difference in velocity over an additional length period. This highlights how quickly momentum is shifting.
2. Average Acceleration
The script smooths raw acceleration with a simple moving average (SMA) using the smoothing input. Comparing current acceleration against this average provides a threshold-based signal mechanism.
3. Trend Filter
Users can pick one of five moving average types to form a trend baseline. These range from quick-reacting methods (DEMA, TEMA) to smoother options (SMA, HMA, EWMA). The script checks whether the price is above or below this filter to confirm trend direction.
4. Buy/Sell Logic
A buy occurs when acceleration surpasses avgAcceleration * threshold and price closes above the trend filter. A sell occurs under the opposite conditions. An additional overbought/oversold check (based on a longer SMA) refines these signals further.
When price is considered oversold (i.e., close is below a longer-term SMA), a bullish acceleration signal has a higher likelihood of success because it indicates that the market is attempting to reverse from a lower price region. Conversely, when price is considered overbought (close is above this longer-term SMA), a bearish acceleration signal is more likely to be valid. This helps reduce false signals by waiting until the market is extended enough that a reversal or continuation has a stronger chance of following through.
5. Smart Pyramiding
Once a main buy or sell signal is triggered, additional (filtered) entries can be taken if acceleration crosses a smaller multiplier (pyramidingThreshold). This helps traders scale into strong moves. The script enforces a cap (maxPyramidingEntries) to limit risk.
6. Visual Elements
Candles can be recolored based on the active signal. Labels appear on the chart whenever a main or pyramiding entry signal is triggered. An optional table can show real-time acceleration values.
Color Schemes
The script includes a variety of predefined color themes. For bullish conditions, it might use turquoise or green, and for bearish conditions, magenta or red—depending on which color scheme the user selects. Each scheme aims to provide clear visual differentiation between bullish and bearish market states.
Why Each Indicator Was Part of This Component
Acceleration is employed to detect swift changes in momentum, capturing shifts that may not yet appear in more traditional measures. To further adapt to different trading styles and market conditions, several moving average methods are incorporated:
• TEMA (Triple Exponential Moving Average) is chosen for its ability to reduce lag more effectively than a standard EMA while still reacting swiftly to price changes. Its construction layers exponential smoothing in a way that can highlight sudden momentum shifts without sacrificing too much smoothness.
• DEMA (Double Exponential Moving Average) provides a faster response than a single EMA by using two layers of exponential smoothing. It is slightly less smoothed than TEMA but can alert traders to momentum changes earlier, though with a higher risk of noise in choppier markets.
• HMA (Hull Moving Average) is known for its balance of smoothness and reduced lag. Its weighted calculations help track trend direction clearly, making it useful for traders who want a smoother line that still reacts fairly quickly.
• SMA (Simple Moving Average) is the classic baseline for smoothing price data. It offers a clear, stable perspective on long-term trends, though it reacts more slowly than other methods. Its simplicity can be beneficial in lower-volatility or more stable market environments.
• EWMA (Exponentially Weighted Moving Average) provides a middle ground by emphasizing recent price data while still retaining some degree of smoothing. It typically responds faster than an SMA but is less aggressive than DEMA or TEMA.
Alongside these moving average techniques, the script employs a slope calculation (referred to as the “Massive Slope Index”) to visually indicate whether the chosen filter is sloping upward or downward. This adds an extra layer of clarity to directional analysis. The indicator also uses overbought/oversold checks, based on a longer-term SMA, to help filter out signals in overstretched markets—reducing the likelihood of false entries in conditions where the price is already extensively extended.
Additional Features
Alerts can be set up for both main signals and additional pyramiding signals, which is helpful for automated or semi-automated trading. The optional acceleration table offers quick reference values, making momentum monitoring more intuitive. Including explicit alert conditions for Buy/Sell and Pyramiding ensures traders can respond promptly to market movements or integrate these triggers into automated strategies.
Summary
This script serves as a comprehensive momentum-based trading framework, leveraging acceleration metrics and multiple moving average filters to identify potential shifts in market direction. By combining overbought/oversold checks with threshold-based triggers, it aims to reduce the noise that commonly plagues purely reactive indicators. The flexibility of Smart Pyramiding, customizable color schemes, and built-in alerts allows users to tailor their experience and respond swiftly to valid signals, potentially enhancing trading decisions across various market conditions.
Disclaimer
All trading involves significant risk, and users should apply their own judgment, risk management, and broader analysis before making investment decisions.
Sma

Best MA Pair Finder (Crossover Strategy)This indicator automatically identifies the optimal pair of moving averages (MAs) for a crossover strategy using all available historical data. It offers several MA options—including SMA, EMA, and TEMA—allowing users to select the desired type in the settings. The indicator supports two strategy modes: “Long Only” and “Buy & Sell”, which can be chosen via the options.
For each MA pair combination, the indicator performs a backtest and calculates the profit factor, considering only those pairs where the total number of trades meets or exceeds the user-defined "Minimum Trades" threshold. This parameter ensures that the selected optimal pair is based on a statistically meaningful sample rather than on a limited number of trades.
The results provided by this indicator are based on historical data and backtests, which may not guarantee future performance. Users should conduct their own analysis and use proper risk management before making trading decisions.

ROC + SMI Auto Adjust
This indicator combines the Rate of Change (ROC) and the Stochastic Momentum Index (SMI) with automatically adjusted parameters for different time frames (short, medium, long). It normalizes the ROC to match the SMI levels, displays the ROC as a histogram and the SMI as lines, highlights overbought/oversold zones and includes a settings table. Ideal for analyzing momentum on different time frames.
Key Features:
Automatic Parameter Adjustment:
The script detects the current chart time frame (e.g. 1-minute, 1-hour, daily) and adjusts the parameters for the ROC and SMI accordingly.
Parameters such as ROC length, SMI length and smoothing periods are optimized for short, medium and long term time frames.
Rate of Change (ROC):
ROC measures the percentage change in price over a specified period.
The script normalizes the ROC values to match the SMI range, making it easier to compare the two indicators on the same scale.
The ROC is displayed as a histogram, where positive values are colored green and negative values are colored red.
Stochastic Momentum Index (SMI):
SMI is a momentum oscillator that identifies overbought and oversold conditions.
The script calculates the SMI and its signal line, plotting them on the chart.
Overbought and oversold levels are displayed as dotted lines for convenience.
SMI and SMI Signal Crossover:
When the main SMI crosses the signal line from below upwards, it may be a buy signal (bullish signal).
When the SMI crosses the signal line from above downwards, it may be a sell signal (bearish signal).
Configurable Inputs:
Users can use the automatically adjusted settings or manually override the parameters (e.g. ROC length, SMI length, smoothing periods).
Overbought and oversold levels for SMI are also configurable.
Parameter Table:
A table is displayed on the chart showing the current parameters (e.g. timeframe, ROC length, SMI length) for transparency and debugging.
The position of the table is configurable (e.g. top left, bottom right).
How it works:
The script first detects the chart timeframe and classifies it as short-term (e.g. 1M, 5M), medium-term (e.g. 1H, 4H) or long-term (e.g. D1, W1).
Based on the timeframe, it sets default values for the ROC and SMI parameters.
ROC and SMI are calculated and normalized so that they can be compared on the same scale.
ROC is displayed as a histogram, while SMI and its signal line are displayed as lines.
Overbought and oversold levels are displayed as horizontal lines.
Use cases:
Trend identification: ROC helps to identify the strength of the trend, while SMI indicates overbought/oversold conditions.
Momentum analysis: The combination of ROC and SMI provides insight into both price momentum and potential reversals.
Time frame flexibility: The auto-adjustment feature makes the script suitable for scalping (short-term), swing trading (medium-term) and long-term investing.

Volume Flow Indicator Signals | iSolani
Volume Flow Indicator Signals | iSolani: Decoding Trend Momentum with Volume Precision
In markets where trends are fueled by institutional participation, discerning genuine momentum from false moves is critical. The Volume Flow Indicator Signals | iSolani cuts through this noise by synthesizing price action with volume dynamics, generating high-confidence signals when capital flows align with directional bias. This tool reimagines traditional volume analysis by incorporating volatility-adjusted thresholds and dual-layer smoothing, offering traders a laser-focused approach to trend identification.
Core Methodology
The indicator employs a multi-stage calculation to quantify volume-driven momentum:
Volatility-Adjusted Filter: Measures price changes via log returns, scaling significance using a 30-bar standard deviation multiplied by user-defined sensitivity (default: 2x).
Volume Normalization: Caps extreme volume spikes at 3x the 50-bar moving average, preventing distortion from anomalous trades.
Directional Volume Flow: Assigns positive/negative values to volume based on whether price movement exceeds volatility-derived thresholds.
Dual Smoothing: Applies consecutive SMA (3-bar) and EMA (14-bar) to create the Volume Flow Indicator (VFI) and its signal line, filtering out transient fluctuations.
Breaking New Ground
This implementation introduces three key innovations:
Adaptive Noise Gates: Unlike static volume oscillators, the sensitivity coefficient dynamically adjusts to market volatility, reducing false signals during choppy conditions.
Institutional Volume Capping: The vcoef parameter limits the influence of outlier volume spikes, focusing on sustained institutional activity rather than one-off trades.
Non-Repainting Signals: Generates single-per-trend labels (buy below bars, sell above) to avoid chart clutter while maintaining visual clarity.
Engine Under the Hood
The script executes through five systematic stages:
Data Preparation: Computes HLC3 typical price and its logarithmic rate of change.
Threshold Calculation: Derives dynamic cutoff levels using 30-period volatility scaled by user sensitivity.
Volume Processing: Filters raw volume through a 50-bar SMA, capping extremes at 3x average.
VFI Construction: Sums directional volume flow over 50 bars, smoothed with a 3-bar SMA.
Signal Generation: Triggers alerts when VFI crosses zero, confirmed by a 14-bar EMA crossover.
Standard Configuration
Optimized defaults balance responsiveness and reliability:
Volume MA: 50-bar smoothing window
Sensitivity: 2.0 (doubles volatility threshold)
Signal Smoothing: 14-bar EMA
Volume Cap: 3x average (hidden parameter)
VFI Smoothing: Enabled (3-bar SMA)
By fusing adaptive volume filtering with price confirmation logic, the Volume Flow Indicator Signals | iSolani transforms raw market data into institutional-grade trend signals. Its ability to mute choppy price action while amplifying high-conviction volume moves makes it particularly effective for spotting early trend reversals in equities, forex, and futures markets.

RSI Signal Pro[UgurTash]Introducing RSI Signal Pro for TradingView
RSI Signal Pro is a refined version of the standard Relative Strength Index (RSI) , designed to improve signal accuracy by generating alerts in real-time instead of waiting for multiple candle confirmations. This enhancement allows traders to react faster to market movements while maintaining the familiar RSI structure.
What Makes RSI Signal Pro Unique?
✅ Real-Time RSI Signals: Unlike the traditional RSI, which waits for candle confirmations, this version provides immediate buy and sell signals upon key level crossovers.
✅ Dual Trading Modes: Choose between Simple Mode (standard RSI crossovers) and Advanced Mode (momentum-adjusted signals with price validation).
✅ Customizable RSI-Based Moving Average (MA): Optionally apply SMA, EMA, WMA, or VWMA to smooth RSI fluctuations and identify longer-term trends.
✅ Adaptive Signal Filtering: The Advanced Mode reduces false signals by filtering RSI movements with a momentum threshold and historical RSI validation.
✅ User-Friendly Interface: Simple ON/OFF toggles allow easy customization of the indicator's behavior.
How This Indicator Works
🔹 Simple Mode: Identical to traditional RSI, triggering signals when RSI crosses 30 (bullish) or 70 (bearish).
🔹 Advanced Mode: Uses historical RSI pivots, momentum verification, and price confirmation to refine signal accuracy—ideal for traders looking for more precise entries.
🔹 RSI-Based MA: Optionally overlay moving averages onto the RSI, providing additional trend confirmation.
How to Use RSI Signal Pro
1️⃣ Select a mode: Use Simple Mode for frequent alerts or Advanced Mode for refined signals.
2️⃣ Enable RSI-Based MA: Apply SMA, EMA, WMA, or VWMA to smooth RSI fluctuations.
3️⃣ Set alerts: TradingView notifications allow you to react to real-time RSI movements instantly.
4️⃣ Apply to multiple markets: Effective for crypto, forex, stocks, and commodities.
Why Use RSI Signal Pro Instead of Standard RSI?
While RSI Signal Pro maintains the core functionality of the standard RSI, its real-time signal generation allows traders to make faster decisions without the typical delay caused by waiting for candle confirmations. Additionally, the optional momentum filtering and moving average smoothing ensure fewer false signals and better trade accuracy.

Sma Indicator with Ratio (pr)SMA Indicator with Ratio (PR) is a technical analysis tool designed to provide insights into the relationship between multiple Simple Moving Averages (SMAs) across different time frames. This indicator combines three key SMAs: the 111-period SMA, 730-period SMA, and 1400-period SMA. Additionally, it introduces a ratio-based approach, where the 730-period SMA is multiplied by factors of 2, 3, 4, and 5, allowing users to analyze potential market trends and price movements in relation to different SMA levels.
What Does This Indicator Do?
The primary function of this indicator is to track the movement of prices in relation to several SMAs with varying periods. By visualizing these SMAs, users can quickly identify:
Short-term trends (111-period SMA)
Medium-term trends (730-period SMA)
Long-term trends (1400-period SMA)
Additionally, the multiplied versions of the 730-period SMA provide deeper insights into potential price reactions at different levels of market volatility.
How Does It Work?
The 111-period SMA tracks the shorter-term price trend and can be used for identifying quick market movements.
The 730-period SMA represents a longer-term trend, helping users gauge overall market sentiment and direction.
The 1400-period SMA acts as a very long-term trend line, giving users a broad perspective on the market’s movement.
The ratio-based SMAs (2x, 3x, 4x, 5x of the 730-period SMA) allow for an enhanced understanding of how the price reacts to higher or lower volatility levels. These ratios are useful for identifying key support and resistance zones in a dynamic market environment.
Why Use This Indicator?
This indicator is useful for traders and analysts who want to track the interaction of price with different moving averages, enabling them to make more informed decisions about potential trend reversals or continuations. The added ratio-based values enhance the ability to predict how the market might react at different levels.
How to Use It?
Trend Confirmation: Traders can use the indicator to confirm the direction of the market. If the price is above the 111, 730, or 1400-period SMA, it may indicate an uptrend, and if below, a downtrend.
Support/Resistance Levels: The multiplied versions of the 730-period SMA (2x, 3x, 4x, 5x) can be used as dynamic support or resistance levels. When the price approaches or crosses these levels, it might indicate a change in the trend.
Volatility Insights: By observing how the price behaves relative to these SMAs, traders can gauge market volatility. Higher multiples of the 730-period SMA can signal more volatile periods where price movements are more pronounced.

Smooth Moving Average (SMA) MTF Trend PanelDescription:
The SMA MTF Trend Panel is a multi-timeframe (MTF) trend visualization tool designed to help traders quickly assess market conditions across multiple timeframes based on the Simple Moving Average (SMA). This script calculates the trend direction (Bullish, Bearish, or Neutral) and the trend strength percentage for each selected timeframe. It displays the information in an intuitive panel that is dynamically updated in real-time.
How It Works:
1. SMA Calculation:
• For each timeframe, the script calculates the SMA based on a user-defined length (default: 50).
2. Trend Identification:
• Compares the current price to the SMA and assigns a label: “Bull,” “Bear,” or “Neutral.”
3. Panel Display:
• Displays trends, strengths, and shifts for each timeframe in an interactive table.
4. Real-Time Updates:
• Continuously monitors price movements and updates the panel to reflect the latest data.
Customizable Inputs:
1. Panel Settings:
• Orientation: Choose vertical or horizontal layout.
• Position: Select panel location on the chart.
• Border Width/Color: Adjust panel borders for better visualization.
2. Trend Colors:
• Define custom colors for bullish, bearish, neutral, and shift conditions.
3. SMA Length:
• Adjust the SMA period to suit your trading style (e.g., short-term scalping or long-term trend following).
4. Timeframes:
• Set specific timeframes to analyze based on your trading strategy.

BK Multiple MA, RMA, SMA, HMA, VWAP, Rolling VWAP **Indicator Description**
I’m incredibly proud to introduce my third indicator to the TradingView community: **BK Multiple MA with HMA, VWAP, and Rolling VWAP**! This tool has been a game-changer in my trading strategy, and I’m excited to share it with others who are navigating the markets.
This indicator holds a special place in my heart because it represents the first technical analysis concept introduced to me by my mentor when I began apprenticing under him. His wisdom, guidance, and passion for trading—and for life—left an indelible mark on my journey. I dedicate this work, and every indicator I introduce, to the foundation he helped me build, while giving glory first and foremost to God.
**Moving Averages (MAs)** are one of the most widely used tools in technical analysis, and this indicator takes them to the next level. It allows you to plot **six fully customizable moving averages simultaneously**, with options including:
- **Exponential Moving Average (EMA)**
- **Simple Moving Average (SMA)**
- **Relative Moving Average (RMA)**
- **Hull Moving Average (HMA)**
- **Volume Weighted Average Price (VWAP)**
- **Rolling VWAP**
This flexibility makes the indicator highly versatile, whether you’re a day trader, swing trader, or long-term investor. By customizing periods, colors, and line widths for each MA, you can tailor the indicator to perfectly suit your trading style.
**Key Features**
1. **Six Fully Customizable MAs**:
- Adjust periods, line colors, and widths to match your preferences.
- Select from EMA, SMA, RMA, HMA, VWAP, or Rolling VWAP for each line.
2. **Unique Rolling VWAP Option**:
- Rolling VWAP calculates the volume-weighted average price over a user-defined period, such as 200 candles.
- This feature is ideal for traders seeking volume-weighted levels that don’t reset with each session, making it invaluable for trend-following and swing trading.
3. **HMA for Smoother Trends**:
- The Hull Moving Average (HMA) is designed to reduce lag and provide a responsive, noise-free view of price trends.
- It’s a powerful tool for spotting reversals and confirming directional momentum.
4. **Session VWAP**:
- Traditional VWAP resets with each trading session, making it a reliable benchmark for intraday support and resistance levels.
**How It Works**
- **VWAP**: Reflects the average price weighted by volume for the current trading session, commonly used by institutional traders to identify key price levels.
- **Rolling VWAP**: Extends VWAP functionality by calculating over a user-defined period, allowing for flexible multi-timeframe analysis.
- **HMA**: A fast, smooth moving average that reacts quickly to price changes while filtering out noise.
The combination of these options provides traders with a comprehensive view of market dynamics, enabling better decision-making.
**Final Thoughts**
This indicator is deeply meaningful to me because it represents the first concept my mentor introduced when I began apprenticing under him. His wisdom, guidance, and passion for trading—and for life—left an indelible mark on my journey. I dedicate this work, and every indicator I introduce, to the foundation he helped me build, while giving glory first and foremost to God.
If this indicator helps you succeed, I humbly ask that you honor the blessings in your life by giving back—whether through acts of kindness, philanthropy, or helping others in need.
May the Almighty guide us all toward wisdom and success in our endeavors. All glory belongs to God!
EMA/SMA + Multi-Timeframe Dashboard (Vertical)20/50 ema and 200 sma
The EMA SMA Trading Indicator combines the power of Exponential Moving Averages (EMA) and Simple Moving Averages (SMA) to help traders identify trends, reversals, and key entry/exit points.
Features:
Dual Moving Averages: Tracks both EMA and SMA to provide a balanced view of short-term and long-term market trends.
Customizable Periods: Allows users to set unique periods for EMA and SMA to suit their trading style and timeframe (e.g., day trading, swing trading, or investing).
Cross Alerts: Highlights EMA and SMA crossover points, which often indicate potential buy or sell signals.
Color-Coded Lines: Visual differentiation between EMA (dynamic and responsive) and SMA (smooth and lagging) for better readability.
Multi-Timeframe Compatibility: Suitable for scalping, intraday trading, and long-term analysis.
Usage:
Trend Confirmation: When the EMA is above the SMA, it signals a bullish trend; when it is below the SMA, it signals a bearish trend.
Crossover Strategy: Use crossovers as potential buy (EMA crosses above SMA) or sell (EMA crosses below SMA) signals.
Dynamic Support/Resistance: EMA can act as short-term support/resistance, while SMA represents long-term levels.
This indicator is perfect for traders who want to combine EMA's speed with SMA's stability for improved decision-making in volatile markets. Customizable alerts and visual cues make it user-friendly for beginners and experienced traders.
Make informed decisions and take your trading to the next level with the EMA SMA Trading Indicator!

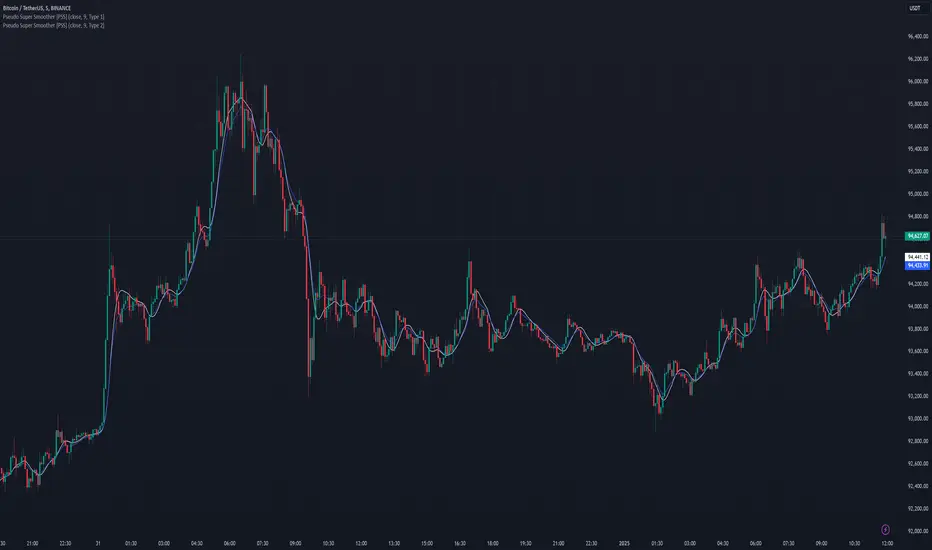
Pseudo Super Smoother [PSS]The Pseudo Super Smoother (PSS) is a a Finite Impulse Response (FIR) filter. It provides a smoothed representation of the underlying data. This indicator can be considered a variation of a moving average, offering a unique approach to filtering price or other data series.
The PSS is inspired by the Super Smoother filter, known for its ability to reduce noise while maintaining a relatively low delay. However, the Super Smoother is an Infinite Impulse Response (IIR) filter. The PSS attempts to approximate some characteristics of the Super Smoother using an FIR design, which offers inherent stability.
The indicator offers two distinct filter types, selectable via the "Filter Style" input: Type 1 and Type 2 . Type 1 provides a smoother output with a more gradual response to changes in the input data. It is characterized by a greater attenuation of high-frequency components. Type 2 exhibits increased reactivity compared to Type 1 , allowing for a faster response to shifts in the underlying data trend, albeit with a potential overshoot. The choice between these two types will depend on the specific application and the preference for responsiveness versus smoothness.
The PSS calculates the FIR filter coefficients based on a decaying exponential function, adjusted according to the selected filter type and the user-defined period. The filter then applies these coefficients to a window of past data, effectively creating a weighted average that emphasizes more recent data points to varying degrees. The PSS uses a specific initialization technique that uses the first non-null data point to pre-fill the input window, which helps it start right away.
The PSS is an approximation of the Super Smoother filter using an FIR design. While it try's to emulate some of the Super Smoother's smoothing characteristics, users should be aware that the frequency response and overall behavior will differ due to it being a rough approximation. The PSS should be considered an experimental indicator and used in conjunction with other analysis techniques. This is, effectively, just another moving average, but its novelty lies in its attempt to bridge the gap between FIR and IIR filter designs for a specific smoothing goal.
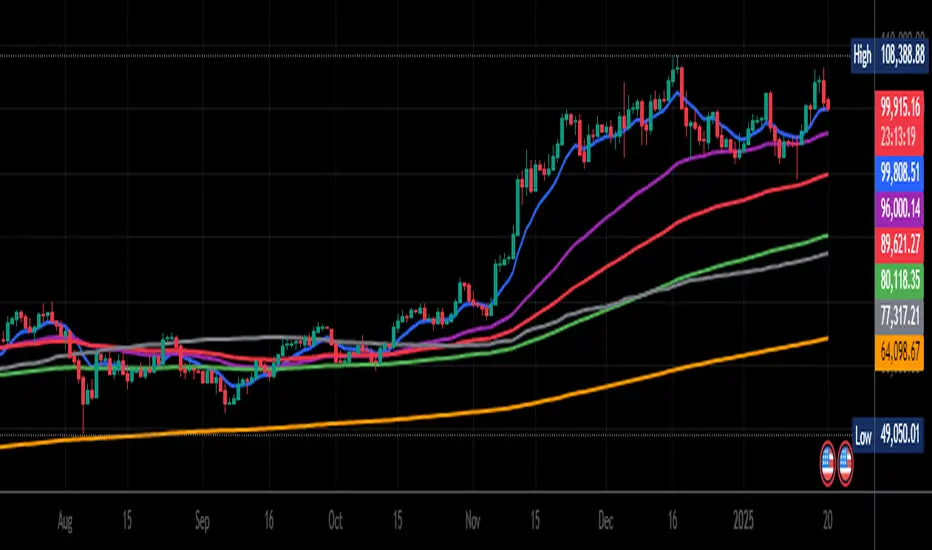
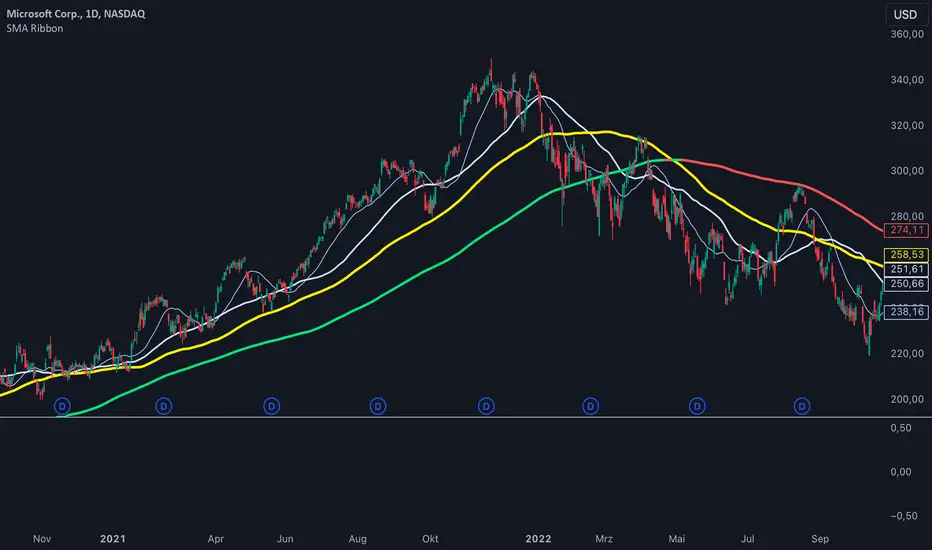
SMA Ribbon [A]SMA Ribbon with Adjustable MA200
20, 50, 100, and 200 -period Simple Moving Averages (SMAs) for trend analysis.
The SMA200 dynamically changes color based on its direction—green when rising and red when falling. Additionally, you can lock the SMA200 to the daily timeframe , allowing it to display the 200-day moving average on lower timeframes, such as 4-hour or 1-hour charts.
Features:
Dynamic SMA200 Color: Automatically adjusts to show upward (green) or downward (red) trends.
Daily SMA200 Option: Enables the SMA200 to represent the 200-day moving average on intraday charts for long-term trend insights.
Smart Adaptation: The daily SMA200 setting is automatically disabled on daily or higher timeframes, ensuring accurate period calculations.
How to Use:
Use this script to identify key support/resistance levels and overall market trends.
Adjust the "Daily MA for MA200" option in the settings to toggle between timeframe-specific and daily-locked SMA200.
This script is ideal for traders seeking a clean and customizable tool for long-term and short-term trend analysis.
2-Year MA Multiplier [UAlgo]The 2-Year MA Multiplier is a technical analysis tool designed to assist traders and investors in identifying potential overbought and oversold conditions in the market. By plotting the 2-year moving average (MA) of an asset's closing price alongside an upper band set at five times this moving average, the indicator provides visual cues to assess long-term price trends and significant market movements.
🔶 Key Features
2-Year Moving Average (MA): Calculates the simple moving average of the asset's closing price over a 730-day period, representing approximately two years.
Visual Indicators: Plots the 2-year MA in forest green and the upper band in firebrick red for clear differentiation.
Fills the area between the 2-year MA and the upper band to highlight the normal trading range.
Uses color-coded fills to indicate overbought (tomato red) and oversold (cornflower blue) conditions based on the asset's closing price relative to the bands.
🔶 Idea
The concept behind the 2-Year MA Multiplier is rooted in the cyclical nature of markets, particularly in assets like Bitcoin. By analyzing long-term price movements, the indicator aims to identify periods of significant deviation from the norm, which may signal potential buying or selling opportunities.
2-year MA smooths out short-term volatility, providing a clearer view of the asset's long-term trend. This timeframe is substantial enough to capture major market cycles, making it a reliable baseline for analysis.
Multiplying the 2-year MA by five establishes an upper boundary that has historically correlated with market tops. When the asset's price exceeds this upper band, it may indicate overbought conditions, suggesting a potential for price correction. Conversely, when the price falls below the 2-year MA, it may signal oversold conditions, presenting potential buying opportunities.
🔶 Disclaimer
Use with Caution: This indicator is provided for educational and informational purposes only and should not be considered as financial advice. Users should exercise caution and perform their own analysis before making trading decisions based on the indicator's signals.
Not Financial Advice: The information provided by this indicator does not constitute financial advice, and the creator (UAlgo) shall not be held responsible for any trading losses incurred as a result of using this indicator.
Backtesting Recommended: Traders are encouraged to backtest the indicator thoroughly on historical data before using it in live trading to assess its performance and suitability for their trading strategies.
Risk Management: Trading involves inherent risks, and users should implement proper risk management strategies, including but not limited to stop-loss orders and position sizing, to mitigate potential losses.
No Guarantees: The accuracy and reliability of the indicator's signals cannot be guaranteed, as they are based on historical price data and past performance may not be indicative of future results.

Simple Moving Average with Regime Detection by iGrey.TradingThis indicator helps traders identify market regimes using the powerful combination of 50 and 200 SMAs. It provides clear visual signals and detailed metrics for trend-following strategies.
Key Features:
- Dual SMA System (50/200) for regime identification
- Colour-coded candles for easy trend visualisation
- Metrics dashboard
Core Signals:
- Bullish Regime: Price < 200 SMA
- Bearish Regime: Price > 200 SMA
- Additional confirmation: 50 SMA Cross-over or Cross-under (golden cross or death cross)
Metrics Dashboard:
- Current Regime Status (Bull/Bear)
- SMA Distance (% from price to 50 SMA)
- Regime Distance (% from price to 200 SMA)
- Regime Duration (bars in current regime)
Usage Instructions:
1. Apply the indicator to your chart
2. Configure the SMA lengths if desired (default: 50/200)
3. Monitor the color-coded candles:
- Green: Bullish regime
- Red: Bearish regime
4. Use the metrics dashboard for detailed analysis
Settings Guide:
- Length: Short-term SMA period (default: 50)
- Source: Price calculation source (default: close)
- Regime Filter Length: Long-term SMA period (default: 200)
- Regime Filter Source: Price source for regime calculation (default: close)
Trading Tips:
- Use bullish regimes for long positions
- Use bearish regimes for capital preservation or short positions
- Consider regime duration for trend strength
- Monitor distance metrics for potential reversals
- Combine with other systems for confluence
#trend-following #moving average #regime #sma #momentum
Risk Management:
- Not a standalone trading system
- Should be used with proper position sizing
- Consider market conditions and volatility
- Always use stop losses
Best Practices:
- Monitor multiple timeframes
- Use with other confirmation tools
- Consider fundamental factors
Version: 1.0
Created by: iGREY.Trading
Release Notes
// v1.1 Allows table overlay customisation
// v1.2 Update to v6 pinescript

4-Hour Moving AveragesTitle: 4-Hour Moving Averages Indicator
Description:
The "4-Hour Moving Averages" indicator is designed to help traders easily visualize key moving averages derived from the 4-hour timeframe, regardless of the chart interval they are using. This indicator plots four moving averages: a 15-period SMA (Short-Term), a 35-period SMA (Intermediate-Term), an 80-period SMA (Long-Term), and a 130-period SMA (Confirmation).
These moving averages provide a balanced approach for identifying short, medium, and long-term trends, as well as confirming significant market movements. Ideal for swing traders and those looking for clear trend signals, the indicator can be used for various markets, including stocks, forex, and cryptocurrencies.
The 4-hour moving averages overlay directly on the price chart, allowing for easy analysis of current price movements relative to important trend indicators. Use this script to enhance your trading decisions, identify opportunities, and avoid market traps by relying on consistent moving average trends.
Features:
- 15 SMA for Short-Term Trends (in red)
- 35 SMA for Intermediate-Term Trends (in orange)
- 80 SMA for Long-Term Trends (in green)
- 130 SMA for Confirmation (in blue)
Feel free to modify the settings to suit your specific strategy and market conditions.

VD Zig Zag with SMAIntroduction
The VD Zig Zag with SMA indicator is a powerful tool designed to streamline technical analysis by combining Zig Zag swing lines with a Simple Moving Average (SMA). It offers traders a clear and intuitive way to analyze price trends, market structure, and potential reversals, all within a customizable framework.
Definition
The Zig Zag indicator is a trend-following tool that highlights significant price movements by filtering out smaller fluctuations. It visually connects swing highs and lows to reveal the underlying market structure. When paired with an SMA, it provides an additional layer of trend confirmation, helping traders align their strategies with market momentum.
Calculations
Zig Zag Logic:
Swing highs and lows are determined using a user-defined length parameter.
The highest and lowest points within the specified range are identified using the ta.highest() and ta.lowest() functions.
Zig Zag lines dynamically connect these swing points to visually map price movements.
SMA Logic:
The SMA is calculated using the closing prices over a user-defined period.
It smooths out price action to provide a clearer view of the prevailing trend.
The indicator allows traders to adjust the Zig Zag length and SMA period to suit their preferred trading timeframe and strategy.
Takeaways
Enhanced Trend Analysis: The Zig Zag lines clearly define the market's structural highs and lows, helping traders identify trends and reversals.
Customizable Parameters: Both the swing length and SMA period can be tailored for short-term or long-term trading strategies.
Visual Clarity: By filtering out noise, the indicator simplifies chart analysis and enables better decision-making.
Multi-Timeframe Support: Adapts seamlessly to the chart's timeframe, ensuring usability across all trading horizons.
Limitations
Lagging Nature: As with any indicator, the Zig Zag and SMA components are reactive and may lag during sudden price movements.
Sensitivity to Parameters: Improper parameter settings can lead to overfitting, where the indicator reacts too sensitively or misses significant trends.
Does Not Predict: This indicator identifies trends and structure but does not provide forward-looking predictions.
Summary
The VD Zig Zag with SMA indicator is a versatile and easy-to-use tool that combines the strengths of Zig Zag swing analysis and moving average trends. It helps traders filter market noise, visualize structural patterns, and confirm trends with greater confidence. While it comes with limitations inherent to all technical tools, its customizable features and multi-timeframe adaptability make it an excellent addition to any trader’s toolkit.
Additional Features
Have an idea or a feature you'd like to see added?
Feel free to reach out or share your suggestions here—I’m always open to updates!

Adaptive Fibonacci Trend Ribbon[FibonacciFlux]Adaptive Fibonacci Trend Ribbon (FibonacciFlux)
Overview
The Adaptive Fibonacci Trend Ribbon is a versatile technical analysis tool designed for traders who want to leverage the power of multiple moving averages while integrating Fibonacci numbers. This indicator provides a dynamic visual representation of market trends, enhancing decision-making processes in trading.
Key Features
1. Multi-Moving Averages
- The indicator calculates eight different moving averages based on user-defined periods, including Fibonacci numbers such as 5, 8, 13, 21, 34, 55, 89, and 144.
- Traders can choose from various moving average types, including EMA, HMA, WMA, VWMA, ALMA, SMA, RMA, and TMA , allowing for tailored analysis based on market conditions.
2. Trend Detection
- Each moving average is color-coded based on its trend direction, with green indicating an upward trend and red indicating a downward trend.
- This visual clarity helps traders quickly assess market sentiment and make informed decisions.
3. Fill Areas for Enhanced Insight
- The indicator features fill areas between the moving averages, which dynamically change color according to their relative positions.
- This provides a clear visual cue of trend strength and potential reversal points, allowing traders to identify key areas of interest.
4. Customizable Inputs
- Users can easily adjust the source data, moving average lengths, and ALMA parameters (offset and sigma) to fit their trading strategies.
- This flexibility ensures that traders can adapt the tool to various market conditions and personal preferences.
Insights and Applications
1. Fibonacci Integration
- By incorporating Fibonacci numbers into the moving average periods, this indicator allows traders to align their strategies with key levels of support and resistance.
- This can enhance the accuracy of entry and exit points, particularly in trending markets.
2. Trend Continuation and Reversal Analysis
- The adaptive nature of the moving averages provides insights into potential trend continuations or reversals.
- Traders can use the indicator to identify when to enter or exit positions based on the interaction between the moving averages.
3. Visual Clarity for Quick Decisions
- The color-coded moving averages and fill areas offer immediate visual feedback on market conditions, helping traders react swiftly to changing dynamics.
- This is especially useful in fast-moving markets where timely decisions are critical.
Conclusion
The Adaptive Fibonacci Trend Ribbon is an essential tool for traders looking to enhance their technical analysis capabilities. By combining multiple moving averages with Fibonacci integration and dynamic visual cues, this indicator offers a robust framework for understanding market trends. Its flexibility and clarity make it an invaluable asset for both novice and experienced traders alike.
Open Source Contribution
This indicator is open source, inviting contributions and improvements from the trading community. Feel free to fork, enhance, and share your insights with the world, helping to foster a collaborative environment for traders everywhere.

Volumetric Volatility Breaker Blocks [UAlgo]The "Volumetric Volatility Breaker Blocks " indicator is designed for traders who want a comprehensive understanding of market volatility combined with volume analysis. This indicator provides a clear visualization of significant volatility areas (or blocks), characterized by price movements that exceed a specific volatility threshold, as calculated using the ATR (Average True Range). The concept is enhanced by integrating volume-based insights, offering a view of market activity that helps users to recognize when significant price changes are being supported by an appropriate level of market participation.
The indicator calculates breaker blocks for both bullish and bearish market conditions, providing distinct visual elements that identify periods of high volatility and substantial volume divergence. The focus on both volume and volatility makes this tool versatile, allowing traders to assess the strength of price movements as well as areas where price might break above or below previously established levels.
It supports adjustable parameters, such as volatility length, smoothness factor, and volume display, allowing traders to fine-tune the indicator according to their trading strategy and market environment. The highlighted breaker blocks assist in identifying zones of potential price reversal or continuation, which can be critical for making informed trading decisions.
🔶 Key Features
Volatility-Based Block Identification: The indicator uses the Average True Range (ATR) to determine the volatility of the market. When the ATR exceeds a specified threshold (smooth ATR multiplied by a user-defined multiplier), it highlights these areas as volatility blocks. The idea is to mark periods where price activity is significantly divergent from normal conditions, which often signals market opportunities.
Volume Integrated Analysis: In addition to tracking volatility, the indicator incorporates volume data, allowing traders to see the amount of activity that occurs during these high-volatility periods. This helps in identifying whether a price movement is likely sustainable or whether it lacks market support.
User Adjustable Parameters: The indicator offers customization options for the volatility length (using ATR), smooth length, and multiplier for sensitivity adjustment. These settings enable users to modify the indicator’s responsiveness to market conditions.
The option to display the last few volatility blocks allows traders to manage clutter on their charts and focus only on the most recent significant data.
Mitigation Method: Users can select between different mitigation methods ("Close" or "Wick") to determine how blocks are broken. This adds an extra layer of adaptability, allowing traders to modify the indicator's response based on different price action strategies.
Dynamic Visual Representation: The indicator dynamically draws boxes for volatility blocks and shades them according to market direction, with split areas showing the bullish and bearish strength contributions. It also provides percentage volume for each block, helping traders understand the relative market participation during these moves.
🔶 Interpreting the Indicator
Identifying High Volatility Areas: When a new volatility block appears, it signifies that the market is experiencing higher-than-usual volatility, driven by increased ATR values. Traders should pay attention to these blocks, as they often indicate that a significant price move is occurring. Bullish blocks suggest upward pressure, whereas bearish blocks indicate downward pressure.
Volume Insights: The volume associated with each volatility block provides an insight into how much market participation accompanies these moves. Higher volume within a block implies that the market is actively supporting the price change, which may be a sign of continuation. Low volume suggests that the movement may lack the strength to persist.
Bullish vs. Bearish Strength Analysis: Each block is split into bullish and bearish strength, giving a clearer picture of what’s happening within the volatility period. If the bullish portion dominates, it indicates strong upward sentiment during that period. Conversely, if the bearish side is more prominent, there is more selling pressure. This breakdown helps in understanding intra-block market dynamics.
Volume Percentage Display: The indicator also displays the volume percentage in each block, which provides context for the strength of the move relative to recent market activity. Higher percentages mean more market engagement, which could confirm the legitimacy of a trend or a significant breakout.
🔶 Disclaimer
Use with Caution: This indicator is provided for educational and informational purposes only and should not be considered as financial advice. Users should exercise caution and perform their own analysis before making trading decisions based on the indicator's signals.
Not Financial Advice: The information provided by this indicator does not constitute financial advice, and the creator (UAlgo) shall not be held responsible for any trading losses incurred as a result of using this indicator.
Backtesting Recommended: Traders are encouraged to backtest the indicator thoroughly on historical data before using it in live trading to assess its performance and suitability for their trading strategies.
Risk Management: Trading involves inherent risks, and users should implement proper risk management strategies, including but not limited to stop-loss orders and position sizing, to mitigate potential losses.
No Guarantees: The accuracy and reliability of the indicator's signals cannot be guaranteed, as they are based on historical price data and past performance may not be indicative of future results.

TechniTrend: Average VolatilityTechniTrend: Average Volatility
Description:
The "Average Volatility" indicator provides a comprehensive measure of market volatility by offering three different types of volatility calculations: High to Low, Body, and Shadows. The indicator allows users to apply various types of moving averages (SMA, EMA, SMMA, WMA, and VWMA) on these volatility measures, enabling a more flexible approach to trend analysis and volatility tracking.
Key Features:
Customizable Volatility Types:
High to Low: Measures the range between the highest and lowest prices in the selected period.
Body: Measures the absolute difference between the opening and closing prices of each candle (just the body of the candle).
Shadows: Measures the difference between the wicks (shadows) of the candle.
Flexible Moving Averages:
Choose from five different types of moving averages to apply on the calculated volatility:
SMA (Simple Moving Average)
EMA (Exponential Moving Average)
SMMA (RMA) (Smoothed Moving Average)
WMA (Weighted Moving Average)
VWMA (Volume-Weighted Moving Average)
Custom Length:
Users can customize the period length for the moving averages through the Length input.
Visualization:
Three separate plots are displayed, each representing the average volatility of a different type:
Blue: High to Low volatility.
Green: Candle body volatility.
Red: Candle shadows volatility.
-------------------------------------------
This indicator offers a versatile and highly customizable tool for analyzing volatility across different components of price movement, and it can be adapted to different trading styles or market conditions.

Dynamic ConfluenceThe Dynamic MA Confluence Indicator is a powerful tool designed to simplify your trading experience by automatically identifying the most influential moving average (MA) lengths on your chart. Whether you're using Simple Moving Averages (SMA) or Exponential Moving Averages (EMA), this indicator helps you pinpoint the MA length that holds the greatest confluence, allowing you to make informed trading decisions with ease.
How It Works:
This indicator analyzes a wide range of moving averages, from short-term to long-term, to determine which ones are closest to each other. By setting a "Proximity Percentage," you can control how close these MAs need to be to be considered as having confluence. The indicator then calculates the average of these close MAs to establish a dynamic support or resistance level on your chart.
Why Use This Indicator?
Automatic Optimization: Unsure of which MA length to apply? The indicator automatically highlights the MA length with the most confluence, giving you a clear edge in identifying significant market levels.
Adaptability: Choose between SMA and EMA to suit your trading strategy and market conditions.
Enhanced Decision-Making: By focusing on the MA length with the greatest influence, you can better anticipate market movements and adjust your strategies accordingly.
Customizable Sensitivity: Adjust the Proximity Percentage to fine-tune the indicator's sensitivity, ensuring it aligns with your trading preferences.
Key Feature:
Current Key Confluence MA Length: Displayed in an optional table, this feature shows the MA length that currently has the most impact on the confluence level, providing you with actionable insights at a glance.
Whether you're a seasoned trader or just starting, the Dynamic MA Confluence Indicator offers a streamlined approach to understanding market dynamics, helping you trade smarter and with more confidence. This presentation text is designed to clearly communicate the purpose, functionality, and benefits of the indicator, making it easy for users to understand its value and how it can enhance their trading strategies.
The Dynamic MA Confluence Indicator is a tool designed to assist traders in analyzing market trends. It should not be considered as financial advice or a guarantee of future performance. Trading involves significant risk, and it is possible to lose more than your initial investment. Users should conduct their own research and consider their financial situation before making trading decisions. Always consult with a financial advisor if you are unsure about any trading strategies or decisions. This disclaimer is intended to remind users of the inherent risks in trading and the importance of conducting their own due diligence.

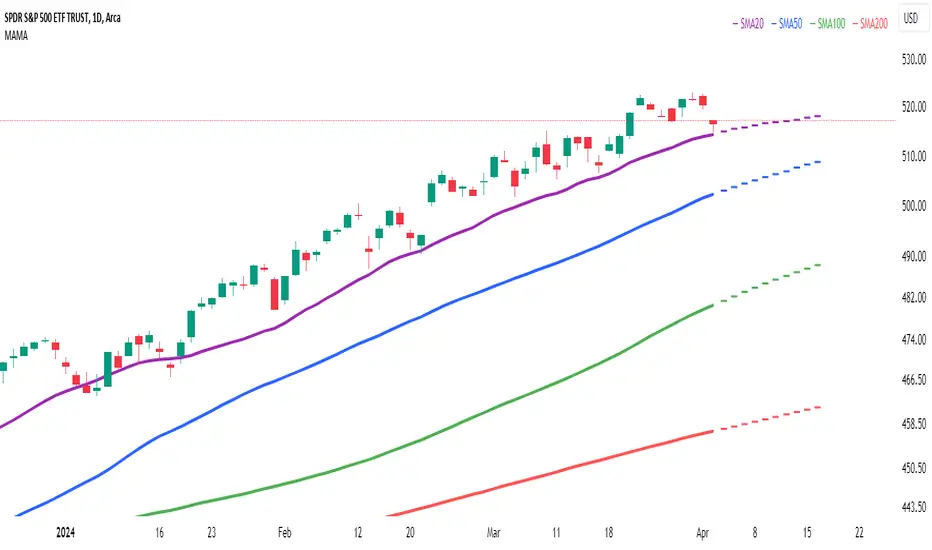
Multi Adaptive Moving Average (MAMA)The Multi Adaptive Moving Average (MAMA) indicator is an advanced tool for technical analysis, designed to provide traders with a detailed understanding of market trends and potential future price movements. This indicator utilizes multiple Simple Moving Averages (SMAs) and forecasting techniques to enhance decision-making processes.
Simple Moving Averages (SMAs):
Short MA (20-period): This moving average is highly responsive to price changes, making it ideal for capturing short-term trends. It helps traders identify quick market shifts and potential entry or exit points.
Mid MA (50-period): This average strikes a balance between short- and long-term trends, offering insights into the market's intermediate direction. It aids in confirming the sustainability of short-term trends.
Long MA (100-period): By smoothing out price data over a longer period, this moving average is useful for identifying long-term trends and filtering out short-term volatility.
Very Long MA (200-period): Often considered a critical indicator for determining the overall market trend, this average helps confirm the direction and strength of long-term movements.
Forecasting:
Flat Forecast: This approach assumes that prices will remain constant in the near future, which is particularly useful in markets trading sideways without a clear trend direction.
Linear Regression Forecast: This method uses historical data to project future price movements, offering a dynamic forecast based on existing trends. It helps traders anticipate potential price changes and plan their strategies accordingly.
Advantages:
Comprehensive Trend Analysis: By incorporating four different SMAs, the indicator provides a layered view of market trends across various timeframes. This enables traders to identify potential trend reversals and continuations with greater accuracy.
Predictive Insights: The forecasting feature offers traders a forward-looking perspective, enabling them to anticipate market movements and adjust their trading strategies proactively. This can be especially advantageous in volatile markets.
Customization: The MAMA indicator is highly customizable, allowing traders to adjust parameters such as the source of price data and the inclusion of the current unclosed candle. This flexibility ensures that the indicator can be tailored to fit different trading styles and market conditions.
Visual Clarity: The use of distinct colors for each SMA and their forecasts enhances visual interpretation, making it easier for traders to quickly assess market conditions and make informed decisions. The inclusion of a legend further aids in distinguishing between the different moving averages and their respective forecasts.
How to Use:
Trend Confirmation: Use the alignment of the SMAs to confirm market trends. For example, when the Short MA crosses above the Mid and Long MAs, it may indicate a bullish trend, while the opposite could suggest a bearish trend.
Entry and Exit Points: Look for crossovers between the SMAs as potential signals for entering or exiting trades. The forecasts can help in timing these decisions by providing an expectation of future price movements.
Risk Management: Utilize the Very Long MA to set stop-loss and take-profit levels, as it reflects the long-term trend and can help in avoiding trades against the prevailing market direction.
The MAMA indicator is intended to support technical analysis and should not be used as the sole basis for making trading decisions. Financial markets are inherently uncertain, and past performance does not guarantee future results. Traders should use this tool in conjunction with other analytical methods and consider their risk tolerance and investment objectives. It is advisable to conduct thorough research and consult with a financial advisor before making significant trading decisions. Always be aware of the risks involved in trading and invest only what you can afford to lose.
Uptrend & SMAThe "Uptrend and Close to SMA" indicator is designed to help traders identify when the price of a stock is in an uptrend and is trading near its Simple Moving Average (SMA) over a user-defined period. The indicator uses multi-timeframe analysis, allowing the user to select different timeframes for calculating the SMA.
Key Features:
SMA Calculation: The indicator calculates the SMA for a selected timeframe (e.g., daily, weekly, monthly) based on a user-specified period (default is 150 periods).
Multi-Timeframe Options: Users can choose between multiple timeframes (1 day, 1 week, 1 month, 3 months, 6 months, 12 months) to calculate the SMA, providing flexibility in trend analysis.
Proximity Threshold: The indicator includes a proximity threshold in percentage terms, allowing users to define how close the real-time price needs to be to the SMA to trigger a visual alert.
Uptrend Identification: The indicator identifies an uptrend when the real-time price is above the selected SMA.
Visual Alerts: If the price is above the SMA and within the defined proximity threshold, the background color of the chart will change to green, signaling that the stock is in an uptrend and close to the SMA.
Alert Condition: The indicator includes an alert condition that triggers when the price is in an uptrend and within the proximity threshold, allowing traders to be notified when their criteria are met.
Percentage Difference Display: A table displays the percentage difference between the real-time price and the SMA, providing a quick reference to see how far the price is from the SMA in percentage terms.
This indicator is especially useful for traders looking for potential buying opportunities when a stock is trending upwards but still near its moving average, indicating potential continuation or momentum.

Volumetric Volatility Blocks [UAlgo]The Volumetric Volatility Blocks indicator is designed to identify significant volatility blocks based on price and volume data. It utilizes a combination of the Average True Range (ATR) and Simple Moving Average (SMA) to determine the volatility level and identify periods of heightened market activity. The indicator highlights these volatility blocks, providing traders with visual cues for potential trading opportunities. It differentiates between bullish and bearish volatility by analyzing price movement and volume, offering a nuanced view of market sentiment. This tool is particularly useful for traders looking to capitalize on periods of high volatility and momentum shifts.
🔶 Key Features
Volatility Measurement Length: Controls the period used to calculate the ATR.
Smooth Length of Volatility: Defines the period for the SMA used to smooth the ATR.
Multiplier of SMA: Sets the minimum threshold for the ATR to be considered a "high volatility" block.
Show Last X Volatility Blocks: Determines how many of the most recent volatility blocks are displayed on the chart.
Mitigation Method: Choose between "Close" or "Wick" price to filter volatility blocks based on price action. This helps avoid highlighting blocks broken by the chosen price level.
Volume Info: Displaying the volume associated with each block.
Up/Down Block Color: Sets the color for bullish and bearish volatility blocks.
🔶 Usage
The Volumetric Volatility Blocks indicator visually represents periods of high volatility with blocks on the chart. Green blocks indicate bullish volatility, while red blocks indicate bearish volatility.
Bullish Volatility Blocks: When the ATR surpasses the smoothed ATR multiplied by the set multiplier, and the price closes higher than it opened, a bullish block is formed. These blocks are generally used to identify potential buying opportunities as they indicate upward momentum.
Bearish Volatility Blocks: Conversely, bearish blocks form under the same conditions, but when the price closes lower than it opened. These blocks can signal potential selling opportunities as they highlight downward momentum.
Volume Information: Each block can display volume data, providing insight into the strength of the market movement. The percentage shown on the block indicates the relative volume contribution of that block, helping traders assess the significance of the volatility.
The volume percentages in the Volumetric Volatility Blocks indicator are calculated based on the total volume of the most recent volatility blocks. For each of the most recent volatility blocks, the percentage of the total volume is calculated by dividing the block's volume by the total volume:
🔶 Disclaimer
Use with Caution: This indicator is provided for educational and informational purposes only and should not be considered as financial advice. Users should exercise caution and perform their own analysis before making trading decisions based on the indicator's signals.
Not Financial Advice: The information provided by this indicator does not constitute financial advice, and the creator (UAlgo) shall not be held responsible for any trading losses incurred as a result of using this indicator.
Backtesting Recommended: Traders are encouraged to backtest the indicator thoroughly on historical data before using it in live trading to assess its performance and suitability for their trading strategies.
Risk Management: Trading involves inherent risks, and users should implement proper risk management strategies, including but not limited to stop-loss orders and position sizing, to mitigate potential losses.
No Guarantees: The accuracy and reliability of the indicator's signals cannot be guaranteed, as they are based on historical price data and past performance may not be indicative of future results.

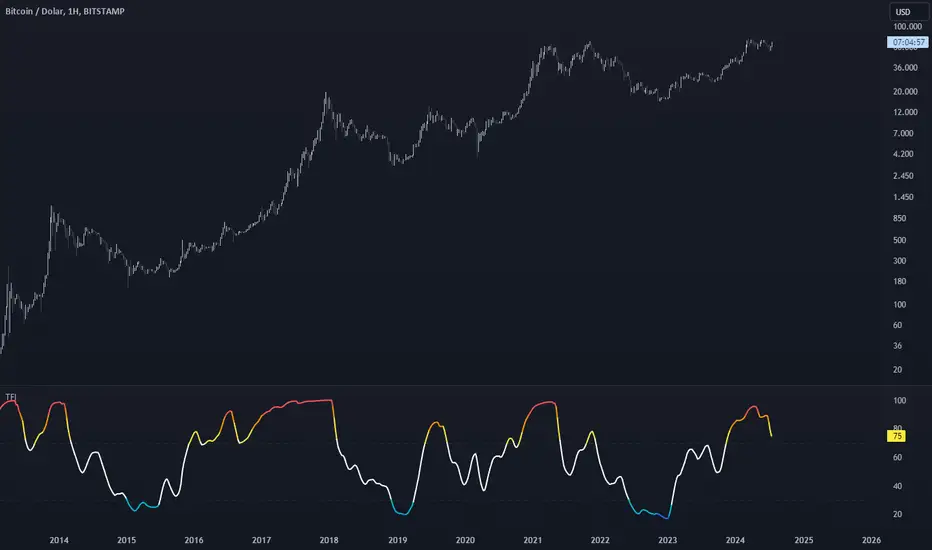
Trend Follower IndexDescription
The purpose of this index is to give an idea about the possible direction of the trend. The index is overbought between 70 and 100, and oversold between 30 and 0. Unlike a typical RSI calculation, the 6-bar simple moving average of the price is calculated first. Then, the 21-bar RSI value of this moving average is calculated.
Why
The 6-bar average is often one of the best averages to show the direction of prices. Closes below this average give strong indications of a trend reversal. To display this average on the horizontal plane, I used the RSI function and took 21 bar as the reference length. Because in my research, I realized that 21 bar length is the most ideal upper and lower points. That's why I coded an indicator that shows where a trend is going and how far that trend needs to go.
Use
It becomes oversold when the Moving Average falls below 30. Here we encounter 3 types of colors;
Light Blue: Indicates that the average is between 30 and 20. It indicates the stage when small purchases begin and the decline rate of the trend begins to decrease.
Blue: Indicates that the average is between 20 and 10. It indicates the stage when purchases begin to become more frequent and the rate of trend decline begins to decrease slightly.
Green: Indicates that the average has fallen below 10. It is the ideal level for purchasing. This indicates the stage when buying pressure has increased significantly and the trend is ready to reverse upward.
As the level decreases, purchases should increase.
Again, when the average value exceeds 70, it becomes overbought. Here we encounter three types of colors;
Yellow: Indicates that the average is between 70 and 80. It indicates the stage when small sales begin and the rate of increase in the trend begins to decrease.
Orange: Indicates that the average is between 80 and 90. It indicates the stage when sales begin to become more frequent and the upward trend begins to decrease somewhat.
Red: Indicates the average is above 90. It is an ideal level for sales. It now marks the stage where selling pressure has increased significantly and the trend is ready to turn downwards.
As the level increases, sales should increase.
Originality
First of all, this moving average is not an RSI. RSI is only used to establish the average on a flat basis. The RSI is merely a helpful tool in determining how much the moving average will rise or fall.
The 6-bar average of the value obtained by calculating Bar (Opening + Closing + High + Low) / 4 gives information about the main trend. In my research and usage, I have observed that as long as the price remains above this average, the price continues to move upwards, and when it remains below it, it is willing to move downwards.
Disclaimer
This indicator is for informational purposes only and should be used for educational purposes only. You may lose money if you rely on this to trade without additional information. Use at your own risk.
Version
v1.0