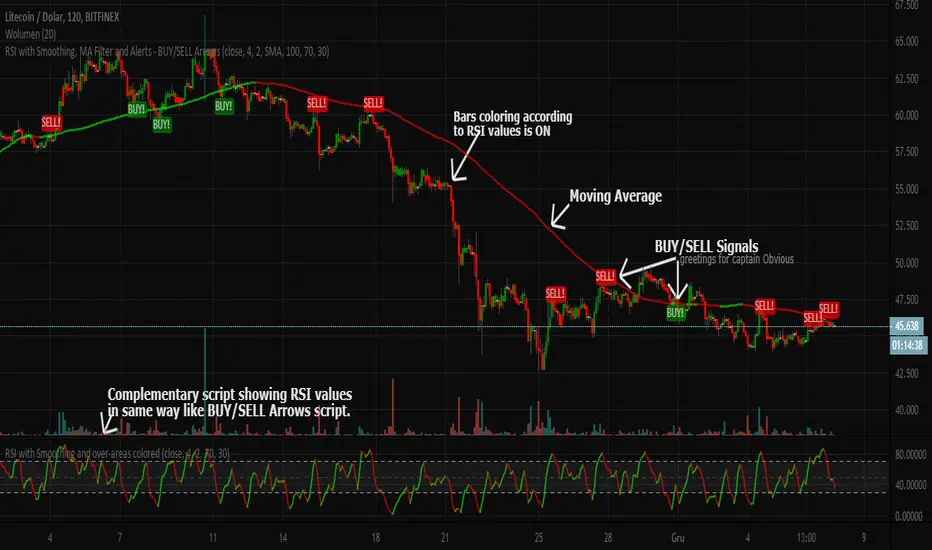
RSI with Smoothing, MA Filter and Alerts - BUY/SELL ArrowsEnglish description:
Here you have kind of better RSI (with smoothing) that can improve your decision-making process when you would like to trade.
Script has the following characteristics:
- Candles colorization
- RSI length
- RSI smoothing
- Moving Average Filter
- Moving Average to choose between: SMA and EMA
- Few differents methods of BUY/SELL signals to choose from and combine together
- Possibility to set Upper/Lower bands for over-bought/sold areas
This BUY/SELL Arrows script is invite-only for the members of our trading group (info in signature).
If you would like to have the oscillator visible on chart above, here is the complementary script:
Polish description:
Niniejszy skrypt, dzięki nieco ulepszonym wskaźniku RSI (z opcją wygładzenia jego linii sygnałowej) ma za zadanie wspomóc proces decyzyjny przy zakładaniu pozycji na giełdzie.
Możliwości są następujące:
- Kolorowanie świec na wykresie zgodnie z kierunkiem danych ustaleń wskaźnika RSI
- Długość/okres RSI
- Wygładzenie RSI
- Filtrowanie sygnałów Średnią Kroczącą
- Wybór pomiędzy dwoma rodzajami średnich kroczących: SMA i EMA
- Kilka różnych metod generowania sygnałów KUPNA/SPRZEDAŻY, które można włączać/wyłączać lub łączyć razem
- Możliwość ręcznego ustawienia domyślnych wartości górnej i dolnej bandy wskaźnika RSI, czyli stref wykupienia/wyprzedania.
Skrypt jest publikowany na zasadzie invite-only(zasada przydzielania dostępu na TradingView), a zatem dostępny jest tylko dla aktywnych użytkowników naszej grupy traderskiej, do której link można znaleść w mojej sygnaturze poniżej.
Jeśli chciałbyś również mieć na wykresie oscylator widoczny w oknie powyżej, tutaj jest odnośnik do skryptu uzupełniającego:
Sma
Multi Moving Averages @Hendo 4C (14 Types)A script containing 14 different types of Moving Averages, a total of 4 can be added per chart (allowing multiple Moving Averages under a smaller TradingView plan).
It also comes with: Adaptive coloring, settings for the source of calculations, customizable colors and lengths. Most importantly, as mentioned: 14 different types found below.
Simple Moving Average (SMA)
Exponential Moving Average (EMA)
Double Exponential Moving Average (DEMA)
Triple Exponential Moving Average (TEMA)
Running Moving Average (RMA)
Kaufman's Adaptive Moving Average (KAMA)
Hull's Moving Average (HMA)
Least Square Moving Average (LSMA)
Weighted Moving Average (WMA)
A. Legoux Moving Average (ALMA)
Volume Weighted Moving Average (VWMA)
Symetrically Weighted Moving Average (SWMA)
Smoothed Moving Average (SMMA)
Elastic Volume Weighted Moving Average (eVWMA)
The goal of creating this script was to allow people with a small TradingView subscription to have access to multiple Moving Averages. Of course it’s not unique in that use case, the thing that makes this script is unique is the fact that it comes with 14 different Moving Averages that can be selected independently. You want a RMA paired with 2 EMA’s and one HMA? Go ahead!
I’m open to add any requests that you guys might have. Feel free to ask so in the comments.
Check out my “Volatility Stop Loss Helper” too! And happy trading.
Last: I think it’s pretty clear to say that this was not “my idea” to build. But I found most of the similar scripts available pretty lacking in terms of settings and additions.
{{Settings overview}}
“Adaptive Colouring”: If enabled the Moving Average colours will be determined by their relation to price. If price is above the Moving Average it’s green, and red if price is below.
“Plot First MA”: Disable or enable the first moving average
“Moving Average Type 1”: The type of Moving Average that the first MA should be. 14 choices.
“Moving Average Length 1”: The length of the first Moving Average.
“Source of Calculation MA1”: The source that is used to calculate the Moving Average. Default is “Close”.
“Plot Second MA”: Enable if you want to use 2 Moving Averages
Settings are the same as described above. But then for the second MA.
“Plot Third MA”: Enable if you want to use 3 Moving Averages
Settings are the same as described above. But then for the third MA.
“Plot Fourth MA”: Enable if you want to use 4 Moving Averages
Settings are the same as described above. But then for the fourth MA.
It is recommended to click the little left arrow to hide your indicators in the top corner while using this indicator. Due to the length of the settings menu.
Settings can be added due to requests. Please check the update notes below:

$0 Exponential & Simple MAs with HigherTFMultiple Moving Averages (Simple/SMA & Exponential/EMA) in one indicator
Support for a fixed time frame for the MAs
MAs default period length are key ones, provided by experienced traders in crypto, greetings to xpressive
Live update or Non-repainting modes support: with the non-repainting mode the previous candle's close is considered instead of latest/current bar's changing close
Features:
7 EMAs with editable length
4 SMAs with editable length
Choice of the price/data source from a predefined list
Activate or not the usage of an higher TF
Target Higher time frame resolution. Not using the predefined lists for more possibilities, e.g M1="M", H12="720", D3="3D", 5M="5"
Configurable lines' width in one setting. Hide or change the MAs color from the indicator's style settings

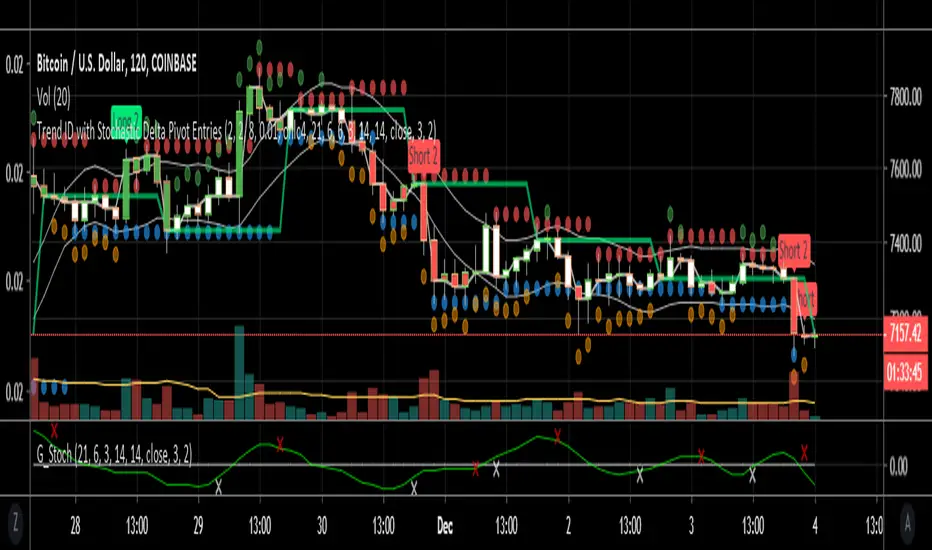
Trend ID with early entry signalsThis script is a combination of two. Firstly a trend is identified as up down or sideways. Higher highs and higher lows makes for an uptrend, lower highs and lower lows similarly allows for a downtrend to be registered. Users can adjust the number of bars to include for detection of the pivot points to increase the accuracy of trend changes but this significantly reduces signals. Sideways movement is determined if the average candle price is within a variance of a short SMA. The SMA follows the close of each candle going back 6 candles by default. The variance is 1% by default so if the price is within 1% of the SMA it's considered sideways and no entries can be issued in this condition.
The indicator is designed to identify the trend for longing or shorting, and then provides the entries based on stochastics converging or diverging (not crosses). The convergence and divergence of stochastics is amalgamated into a short EMA which also has length 6 and can be tuned by the user.
The default values of this script best work on 1h and 2h timeframes for specific pairs like BTCUSD. For other time frames and pairs the settings will need to be tweaked but is possible to identify specific parameters for many different pairs and time frames.
I've written several scripts for personal use however this is my first published script so please use at your own risk! It's not perfect!
MrCryptoBos - EMA/SMAThe MrCryptoBos - EMA/SMA indicator contains essential Exponential Moving Averages and Simple Moving Averages that matches with important levels on the timeframes.

Colored Moving Averages with Zero Lag and ATR BandsEnglish description:
- You can choose from 6 different Moving Averages: SMA , EMA , WMA , VWMA , RMA, SWMA
- Turn ON/OFF the Zero Lag alghorithm
- Make it 2 colors for better visibility of a trend
- Turn ON/OFF the ATR Bands up to 5 multiplicator
- Set the offset on the time axis
Polski opis:
- Możesz wybierać z 6 różnych średnich kroczących: SMA , EMA , WMA , VWMA , RMA, SWMA
- Włączyć/Wyłączyć algorytm Zero Lag
- Włączyć opcję 2 kolorowej średniej żeby lepiej widzieć trendy
- Włączyć/Wyłączyć wstęgi ATR z maksymalnym mnożnikiem x5
- Ustawić przesunięcie względem osi czasu

[BA] Multi Time Frame Moving Averages for BTCThis is a multi time frame moving average script. It includes 7 moving averages. Most of them are SMAs and WMAs but EMA were also used. Time frame was set to 1 day. It means that you can change the time frame of your chart freely without losing your lines. Levels will not change.
I wrote this script just to trade BTC. I prefer daily and weekly charts with this script but lower time frames are also preferable.
Since some of the lengths are too high; older exchanges are recommended due to their relatively deep historical data.
While MA1 is for taking actions like 'take profit' or 'stop loss' or just to follow 'price action' easily, other MAs are for seeing supports and resistances.
MA6 and MA7 are disabled by default in order to minimize the confusion but you can enable them from settings if you need to.
Since some newer exchanges have less historical data, you may not see MA4 and MA5 on the daily chart. In such circumstances MA6 and MA7 might be helpful to use as substitution. Some may like to use all of them.
I am using this script just for BTC but it can be useful for other coins as well.

Multi Timeframe Moving AveragesThis indicator allows you to view a moving average (EMA or SMA) of your choosing on other time frames than what you are currently on.
The reason I wanted to develop this was for use as a filter. Let's say you wanted to make sure the daily time frame was trading above a certain moving average so you could be sure you were playing with the trend. But you wanted to make your entries and exits on a smaller time frame. This Multi-Timeframe Moving Average indicator can then be used to keep an eye on that daily moving average while looking at the shorter term time frames on the same chart.

Hashem OBV+EMA/MAThe On Balance Volume indicator (OBV) is used to measure buying and selling pressure.
It is a cumulative indicator meaning that on days where price went up, that day's volume is added to the cumulative OBV total. If price went down, then that day's volume is subtracted from the OBV total.
The OBV value is then plotted as a line for easy interpretation. OBV is primarily used to confirm or identify overall price Trends or to anticipate price movements after Divergences .
In addition to OBV, EMA and SMA are included. the EMA is used for Support and Resistances for the OBV. and the SMA is used by its Slope (can be S/R as well).

Rhaps SMAEMA Combo v1.1There's many versions of this sort of thing around the Tradingview library, but i guess we all like things to our own specifications.
So this is my take on the SMA and EMA version combined.
Bunch of SMA's & EMA's, with labels, and G&D Cross Labels and Alerts.
These values can of course be changed to any you may prefer.
Rhapsodyy's Combo SMAEMA's v1.1
SMA's with Painted Labels : 10/30/50/80/200
EMA's with Painted Labels : 21/50/89/200/377
50SMA / 200SMA Golden & Death Crosses on Current Timeframe & Alerts
Daily 50SMA / 200SMA Golden & Death Crosses overlayed onto Current Timeframe & Alerts
50EMA / 200EMA Golden & Death Crosses on Current Timeframe & Alerts
Daily 50EMA / 200EMA Golden & Death Crosses overlayed onto Current Timeframe & Alerts

FibMAThis study visually demonstrates Fibonacci moving averages.
The darker the color, the stronger the signal is for either buying or selling.
Buys/Sells only take place when each moving average is above/below the its adjactent fibonacci sequence, i.e 5<8<13<21<34<55<89<144 for buying..
Alerts are provided as BUY ASSET and SELL ASSET.
Multiple moving averages are also provided.

Moving Average(MA) CollectionA simple collection of Simple Moving Averages and Exponential Moving Averages. 4 moving averages enabled by default from a total of 10.
Turn MAs on/off and edit the line style/colour via MA Collection settings.
Default Moving Averages and Default Line Styles
21 EMA (Thin, Purple)
50 SMA (Medium, Yellow)
100 EMA (Medium, Dove Gray)
200 SMA (Thick, Radical Red)
Other Optional Moving Averages and Default Line Styles
5 SMA (Thin, Gray)
8 EMA (Thin, Strkemaster)
13 EMA (Thin, Stiletto)
40 EMA (Medium, Rio Grande)
100 SMA (Medium, Silver)
314 EMA (Thick, Olive)

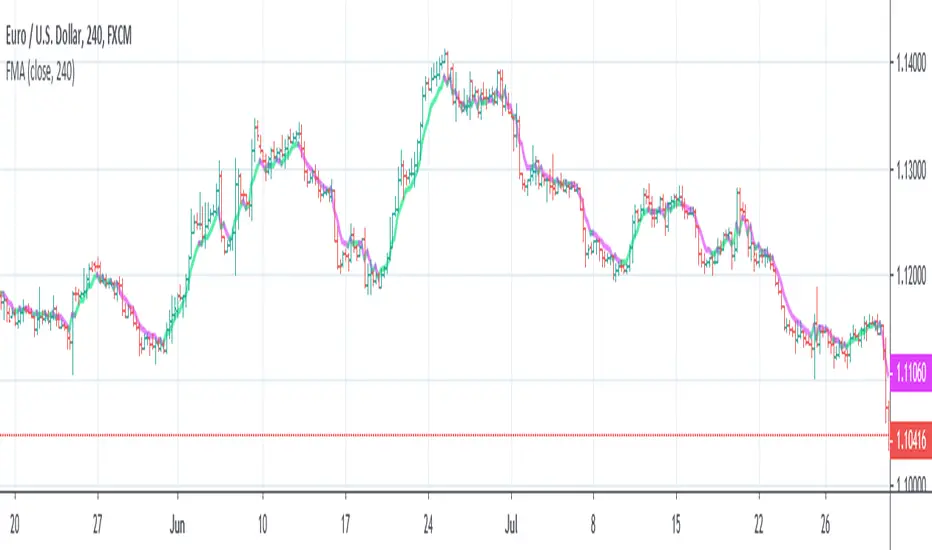
FMA - Fibonacci Moving Average [NXT2017]HI BIG PLAYERS,
I present you a new moving average indicator that relates the values to the lenght of Fibonacci sequence.
Kind regards
NXT2017
MasterMAThis study demonstrates 15 different common moving averages.
SMA, Double SMA, Triple SMA
EMA, Double EMA, Triple EMA
WMA, Double WMA, Triple WMA
VWMA, Double VWMA, Triple VWMA
Hull, Double Hull, Triple Hull
Buy/Sell alerts are given for crossover/under conditions.
Triangles at the bottom, pointing up are buy signals. Triangles at the top, pointing down, are sell signals

Reliability[UO]This is an SMA based indicator. It gives a sense of long term behavior of the asset to make a reliable trade setup
How reliable is your asset to trade without gambling? Is there a reliable trend?
Is this price dip an opportunity to buy?
Is this price spike an opportunity to sell? Or would you avoid buying now and rather wait a bit for prices to fall down to a more reasonable level?
You can recognize all of those points on this indicator. The best to do is to look at the prices and patterns on the indicator to learn about those points.

RSI with Moving Averages[UO]This RSI indicator is one of my favorite indicators. This powerful indicator is implemented by Phi-Deltalytics. I modified the drawing so that it is easier (at least for me) to see the signals and trends (it would not matter if you're doing algorithmic trading).
Trends and signals. For detailed instructions and tutorial see Phi-Deltalytics page

All in One OverlayAll in One Overlay
SMA 1-3 / EMA 1-3 / H-L 1-3 / VWAP
VWAP is Volume-Weighted Average Price
SMA 1-3 is 1,2,or 3 Simple Moving Average Line(s).
EMA 1-3 is 1,2,or 3 Exponential Moving Average Line(s).
H-L 1-3 is the Highest high and Lowest low of x bars from the current bar.
Function is where you choose SMA 1, SMA 2, SMA 3, or EMA1, EMA 2, EMA 3, or H-L 1, H-L 2, H-L 3 to show up on your chart.
Input 1-3 is the number of bars the Function uses to generate its value, Input 1 determines SMA 1 or EMA 1 or H-L 1, Input 2 determines SMA 2 or EMA 2 or H-L 2, and Input 3 determines SMA 3 or EMA 3 or H-L 3.

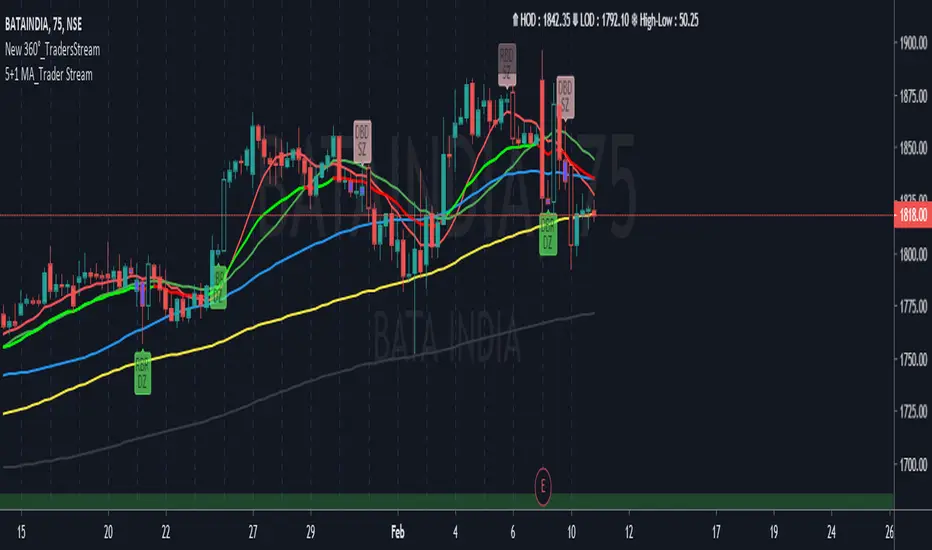
Moving Averages Traders StreamHello Guys this is a new set of Multiple Moving Averages with Bullish and Bearish coloured. Our Tool Includes SMA, EMA, RMA, VMA and VWMA. So if any comments than please.......
Chingas MTF SMASuper simple Multi Time Frame Simple Moving Average.
This is hard coded to auto select the 200 SMA from multiple timeframes such as the 30m, 1H, 4H, Daily and Weekly.
I am hopeful in another version to be able to get the 12H available in a drop down but at the present moment, it is not an option.
This script will give the convenience of seeing where a Moving Average on another timeframe sits, no matter what timeframe you are currently displaying.

Golden Ratio Fibonacci Multipliers Top Detector [UO]Fibonacci levels that show the critical top and bottom levels. There is no way to miss the top and bottom. And a top detector.
Also the most important SMA lines (SMA 50, 200), EMA21. Those are the most frequently used lines by traders.
This indicator is based on the work of www.tradingview.com
His work set me thinking. Could I also see the bottom using Fibonacci numbers? Yes, of course.
My favorite timeframes with this indicator are 6H, 1D, 3D.
Intensively used for BTC and BNB. And useful for any other coin.

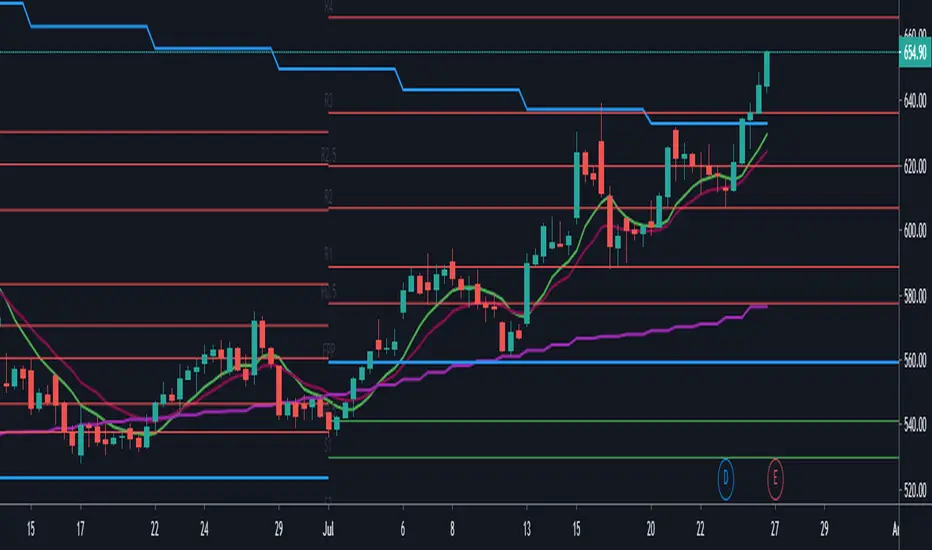
[C] SMA multi TimeFrame with Ext. Fib PPThis script adds multi time frame Simple moving Average on a single time frame. It enables you to judge the moving average of a larger period on a small time frame. The added bonus of Fibonacci levels with additional support and resistance points works well with most NSE equity items on a intraday 5 min time frame.
CompoundMACDCompoundMACD is a study that modifies the basic MACD to use four moving averages.
The fast line of the MACD (red line) is calculated from a fast (alpha) and slow (beta) double EMA.
The slow line of the MACD (blue line) is calculated from a fast (alpha) and slow (beta) smooth moving average (SMA).
The delta (green line) is calculated from the fast and slow lines of the MACD.
Buy signals occur when the candlestick is below momentum and the fast and slow lines crossover each other while under the delta. These are marked by triangles at the bottom pointing up. A BUY ASSET alert is also provided.
Sell signals occur when the candlestick is above momentum and the fast and slow lines crossunder each other while above the delta. These are marked by triangles at the top pointing down. A SELL ASSET alert is also provided.
User configurable setting:
Momentum
MACD fast line: Fast (Alpha) DEMA, Slow (Beta) DEMA
MACD slow line: Fast (Alpha) SMA, Slow (Beta) SMA
MACD Smoothing

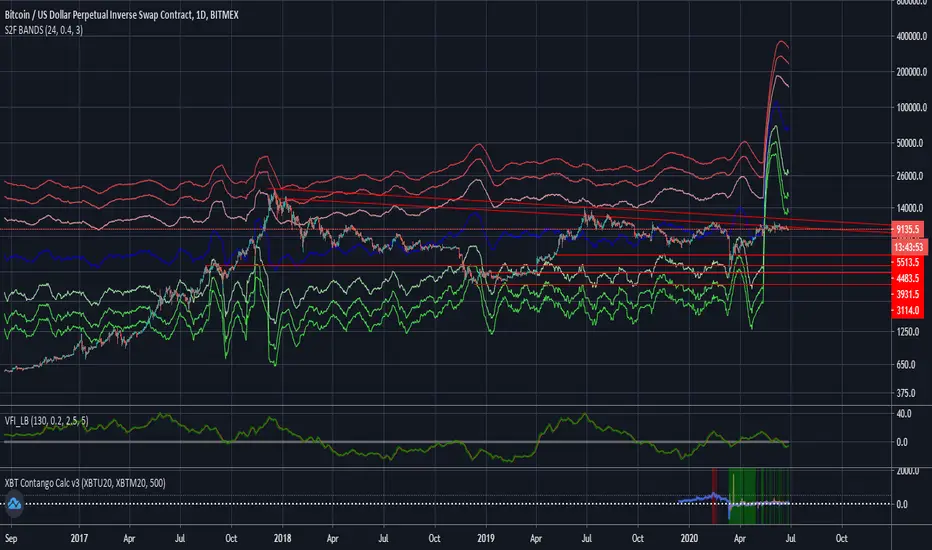
Stock to Flow Model with Standard Deviation BandsThis Study takes the Stock to Flow Model for Bitcoin as presented by 100trillionUSD and smoothes it using an SMA. Then it calculates the close's standard deviation from it and displays the 2-Sigma Bands.
The stock to flow model seems to be one of the best predictions of Bitcoins price.
The standard deviation bands are supposed to show situations in which Bitcoin is significantly over- or under-bought.