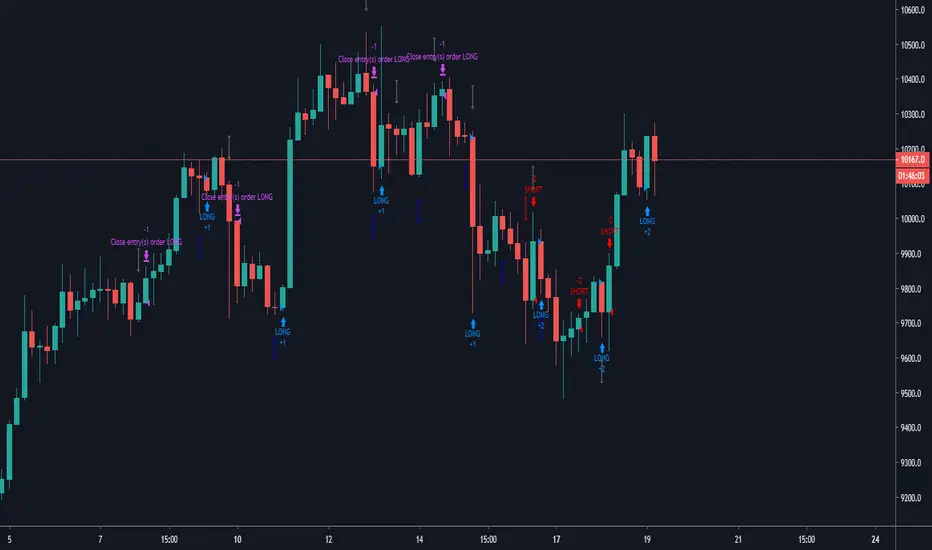
[strategy][1H] SPY slow stochastics
SPY slow stochastics
Overview
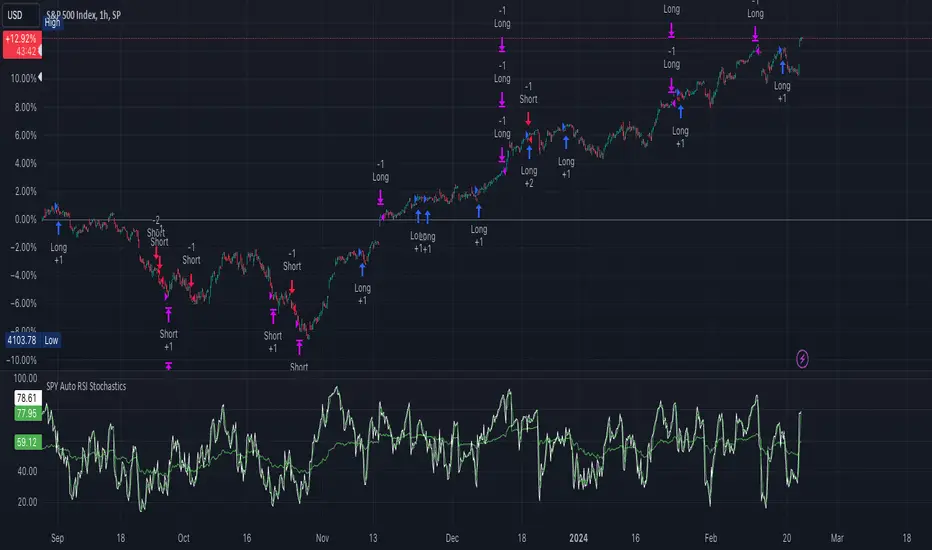
The "SPY Auto RSI Stochastics" strategy is designed to leverage a combination of Relative Strength Index (RSI) and Stochastic indicators to identify potential entry and exit points in trading the SPY $SP:SPX.
The technicals:
A simple yet effective strategy for identifying (reversal) trends on SPY (or any asset).
The logic is as follows:
1. Slow stochastics are effective at predicting momentum. They can also be used to effectively identify reversals.
2. A combination of slow and fast RSI (along with an SMA for the fast RSI) can be used to see potential changes in the directional trend of the underlying asset.
3. In order to reduce noise, a band in the middle of RSI values is ignored; think of this as the price converging and potential explosions (sometimes fake) on either side.
4. Outside this noise band, a crossover of fast RSI on slow RSI indicates an upward trend incoming.
5. A crossunder of fast RSI on slow RSI indicates a downward trend incoming.
Strategy Specific Notes -
1. Load this strategy on SPREADEX:SPX on an hourly chart for the best results.
2. This is a generic strategy, use it on anything - index, stocks, etc. You will need to adjust the parameters for the best results.
3. The RSI Upper defines the cutoff for two things -- threshold for entering a long AND exit signal for short. Likewise for RSI Lower.
4. To have alerts on the strategy, add this to your chart, be content with the backtesting results, select "strategy tester", the alert icon, replace the message body with "{{strategy.order.alert_message}}" without the ".
5. In my experience, the strategy won't be immediately profitable upon a signal but it does get there in the backtested results. Intuitively, this makes sense. Reversals take some time to kick in completely.
Inputs
- **slowRSILength**: Length parameter for the slow RSI calculation.
- **fastRSILength**: Length parameter for the fast RSI calculation.
- **smaRSILength**: Length parameter for the Simple Moving Average (SMA) of the fast RSI.
- **RSIUpperThreshold**: Upper threshold for the RSI, used in exit conditions.
- **RSILowerThreshold**: Lower threshold for the RSI, used in exit conditions.
- **RSIUpperDeadzone**: Upper deadzone threshold for the RSI.
- **RSILowerDeadzone**: Lower deadzone threshold for the RSI.
Strategy Logic
- **RSI Calculation**: The script calculates both slow and fast RSI values based on the provided lengths.
- **Entry Condition**: Entry conditions for long and short positions are based on the crossing of fast RSI over slow RSI and SMA RSI, respectively, along with avoidance of RSI deadzones and validation of trade time.
- **Exit Condition**: Exit conditions for both long and short positions are based on crossing RSI thresholds or opposite entry conditions.
Trade Management
- **Position Entry**: Long and short positions are entered based on predefined entry conditions.
- **Position Exit**: Positions are exited based on predefined exit conditions.
- **Alerts**: The script provides alert messages for entry and exit points.
Plotting
- **Slow RSI**: Plots the slow RSI on the chart.
- **SMA RSI**: Plots the Simple Moving Average of fast RSI on the chart.
Example Usage
The defaults work well for SPY on a 1H timeframe.
If you apply this to anything else DAX, EUSTX50, FTSE, CAC (these are what i have); tweak the input parameters.
Plotting
plot(slowRSI, "Slow RSI", color=color.green) //or fastRSI
plot(smaRSI, "SMA RSI", color=color.white)
Conclusion
The "SPY Auto RSI Stochastics" strategy combines RSI and Stochastic indicators to provide potential trade signals for the SPY ETF. Traders can use this strategy with proper risk management and analysis to enhance their trading decisions.
SLOW
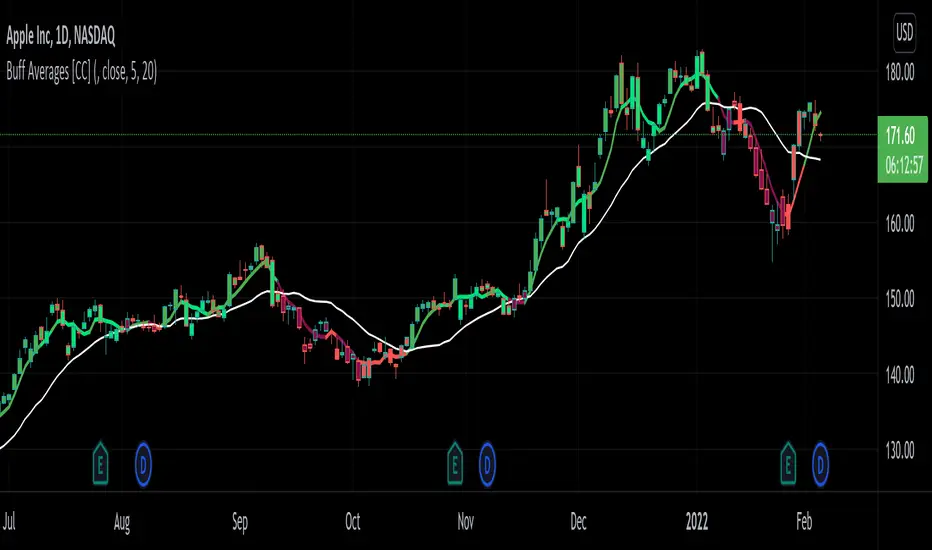
Buff Averages [CC]The Buff Averages were created by Buff Dormeier (Stocks and Commodities Feb 2001) and this is another hidden gem that is a combo of a volume weighted indicator and a moving average crossover system. It uses a special method to calculate the weighting based on volume. The colored line (fast buff) will follow the price closely and you use the other line to act as a trend confirmation. I have included strong buy and sell signals in addition to normal ones so strong signals are darker in color and normal signals are lighter in color. Buy when the line turns green and sell when it turns red.
Let me know if there are any other indicators or scripts you would like to see me publish!
RSI Cross [xaurr]This is simple but profitable rsi cross strategy, to find optimal values you can change rsi and ema periods.
Good Luck!

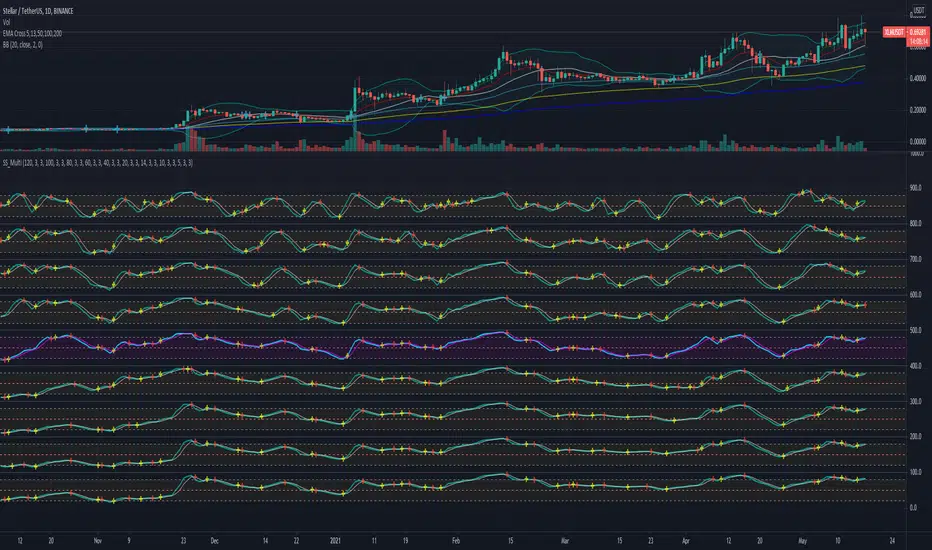
Slow Stochastic MultiFrame - AFPThis script enables you to use 9 slow stochastic with timeframe 5, 10, 14, 20, 40, 60, 80, 100, 120; on purposes to see from longterm and short term condition of a stock.
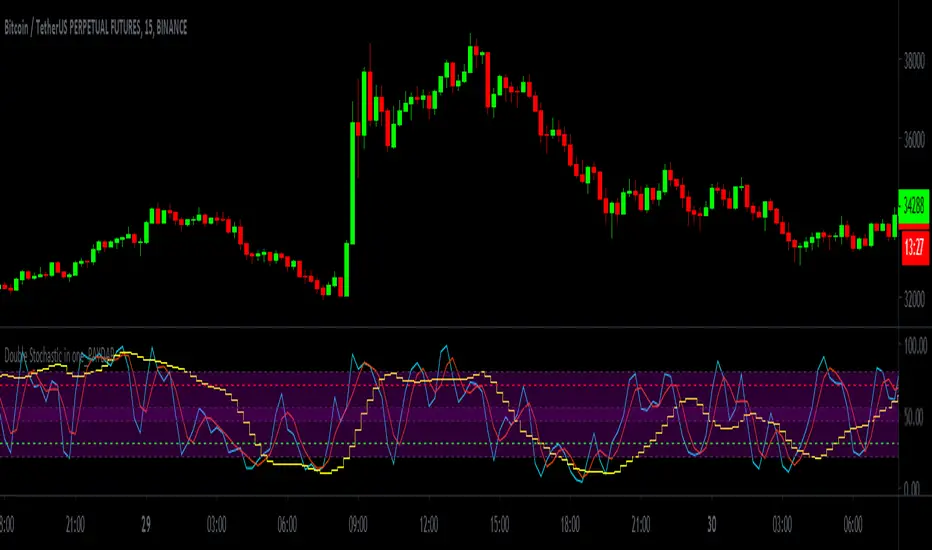
Double Stochastic in one_PAYDARDouble Stochastic in one_PAYDAR
Hello dear friends;
Double Stochastic in one_PAYDAR function:
It actually means that I have used two stochastic oscillators in one oscillator with several lines in different degrees,
First Stochastic: or "Fast Stochastic", as its name implies, is a stochastic oscillator with fast parameters and is capable of detecting small oscillations and small trends.
Second Stochastic : or "slow stochastic" means a stochastic oscillator with slow parameters and is capable of detecting slightly larger fluctuations and trends.
(Of course, here I just put parameter D, because I did not want it to be crowded.)
*** This system just Suggests you for points. ***
_____________________________________________________________________________
How to use this system ( just Suggests you) :
Buy: Whenever the first stochastic (fast stochastic ) crosses in the range of 20 or below and moves upwards, and at the same time the second stochastic (slow stochastic ) moves or crosses the green 30 line, a good time To buy or take a long position.
Sell: Whenever the first stochastic (fast stochastic ) crosses in the range of 80 or above and moves down, and at the same time the second stochastic (slow stochastic ) moves or crosses the red 70 line, a good time For sale or short position.
_____________________________________________________________________________
*** This system just Suggests you for points. ***
My suggestion is not to use this system alone and conclude about entry and exit points according to charts, news, market fluctuations and trend direction.
This system was created by Stochastic Oscillator, which is public and open source on the TradingView site.
***I used the Stochastic Oscillator as a public domain and open source on the TradingView site***
In fast stochastics the values of the parameters are set as fast motion and in slow stochastics the values of the parameters are set as slow motion. In fact, these values of the parameters according to the function and price movement in the candles are fast and slow, and I have determined these values at my suggestion, which, of course, I have consulted with several people.
For easier use and personalization for each person, I have left access to the parameters in this system and you can easily change the parameters as you like and use it optimally for yourself.
Of course, my suggestion is to use the numbers and values of the parameters I have written.
I have put different values, which I think will be very useful for trading swings and even below the daily, but you can change the values of different parameters to your liking.
This oscillator is made of a stochastic oscillator that is open source and public on the TradingView site , of course, due to the changes I have made in the parameter values and the inclusion of two stochastics in one oscillator.
*** In this system, the main and basic oscillators is used, It is available as open source and public on the TradingView site ***
Please comment on the use of this oscillator as well as how to use it and your experiences, I will definitely welcome comments and criticisms.
I am very grateful and very loyal to TradingView ,
Be successful and profitable.
Doble stochastic oscillator fast and slowThis is a two stochastic in one indicator :
We have a normal stochastic, and a slower one in order to identify changes in the price movement.
At the same time I added more levels, so its easier visually to identify in each scenario we are.
The slower oscillator, also change color based on direction it has.
Green color = long direction - > buy
Red color = short direction - > sell

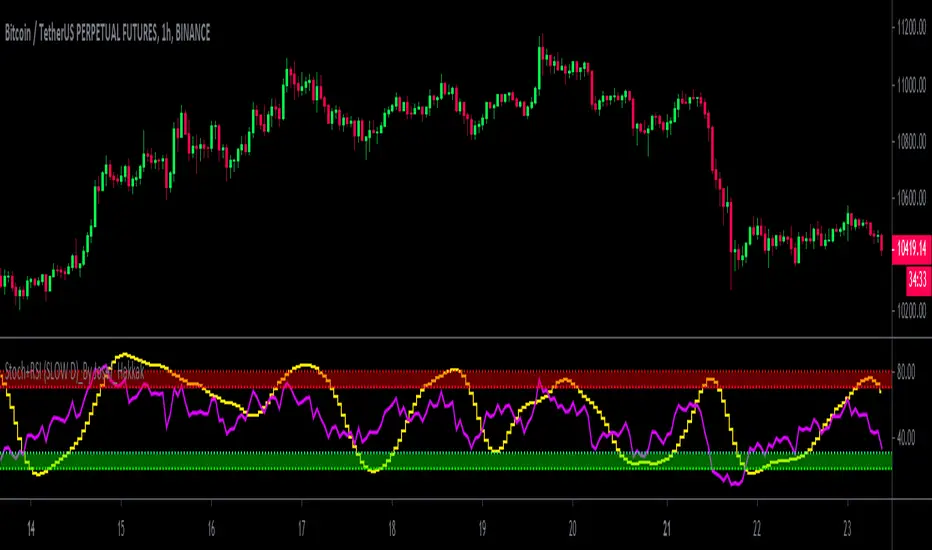
Stoch+RSI (SLOW D)_By Josef_HakkakStoch+RSI (SLOW D)_By Josef_Hakkak
Stochastic and RSI by SLOW D%
-> How to use:
B UY = When the yellow line (D of Slow Stoch ) goes out of the green range, it is better that the purple line ( RSI ) is be low
SELL = When the yellow line (D of Slow Stoch ) goes out of the red range, it is better to have the purple line ( RSI ) is be high
This script was previously written by RRanjanFX and has now been edited by me and changes have been made to optimize for shorter timeframes.
Edited and updated and optimized from:
RRanjanFX
Many thanks and loyal to RRanjanFX
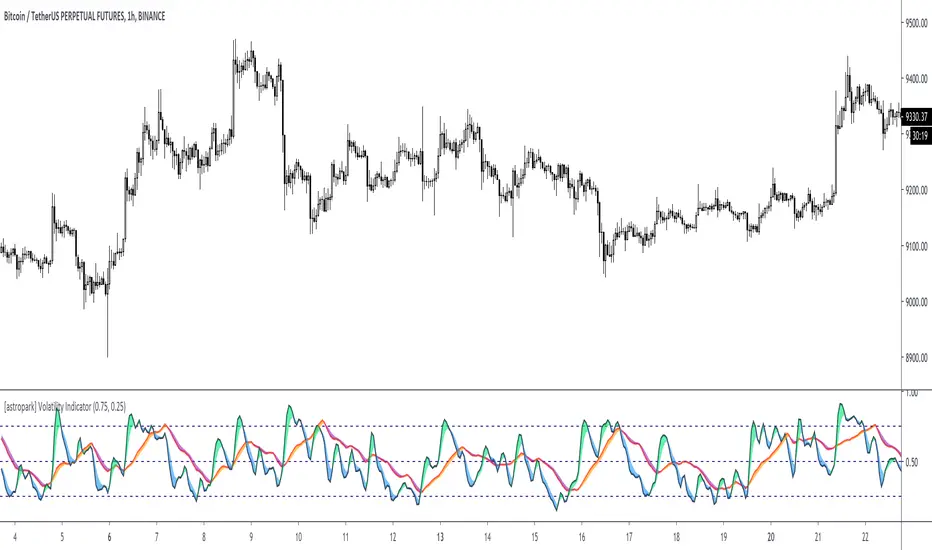
[astropark] Volatility IndicatorDear Followers,
today another interesting script: Volatility Indicator .
This indicator measures the volatility of the market you see in the timeframe you see, in a scale between 0 and 1.
It works on cryptocurrencies, commodities, stocks, indexes and forex.
You will see 2 volatility waves:
a black one (with green and blue shadow for increasing and decreasing mode), which is the "faster" one
a red one (with orange and purple shadow for increasing and decreasing mode), which is the "slower" one
The indicator highlights high volatility when it's near the top (1), while low volatility when near the bottom (0).
You can combine this indicator with your own strategy and indicators to validate them :
on low volatility it often happens that a signal fails to be profitable, as it lacks fuel
while it's better if volatility is over low level as price has more room to run while volatility increasing to the top
This indicator also lets you set alerts when volatility exceeds high level or low level.
This is a premium indicator , so send me a private message in order to get access to this script.
Slow Heiken Ashi and Exponential Moving average Strategy 2.2Strategy using Slow Heiken Ashi by Glaz and Exponential moving averages. Looking for someone to help me turn the strategy into non-reoccuring alerts as I am having trouble doing so.
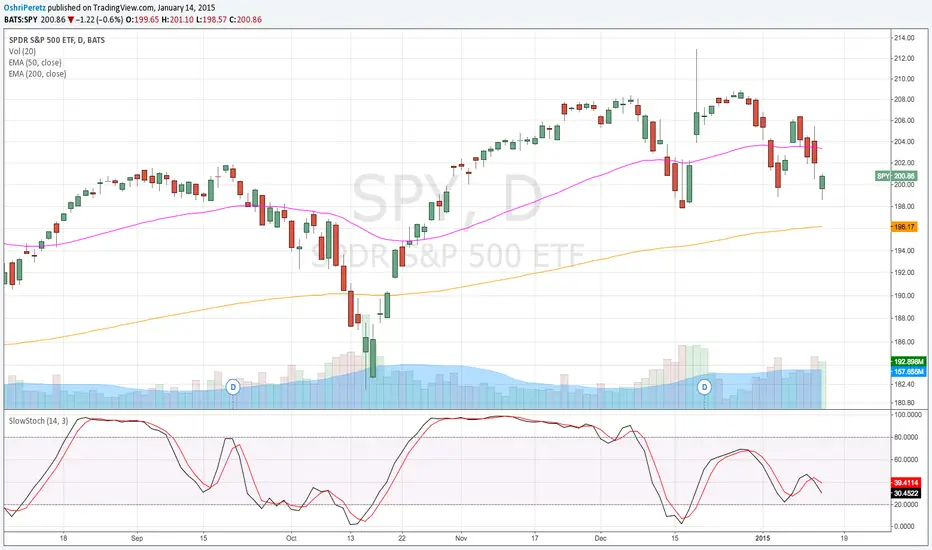
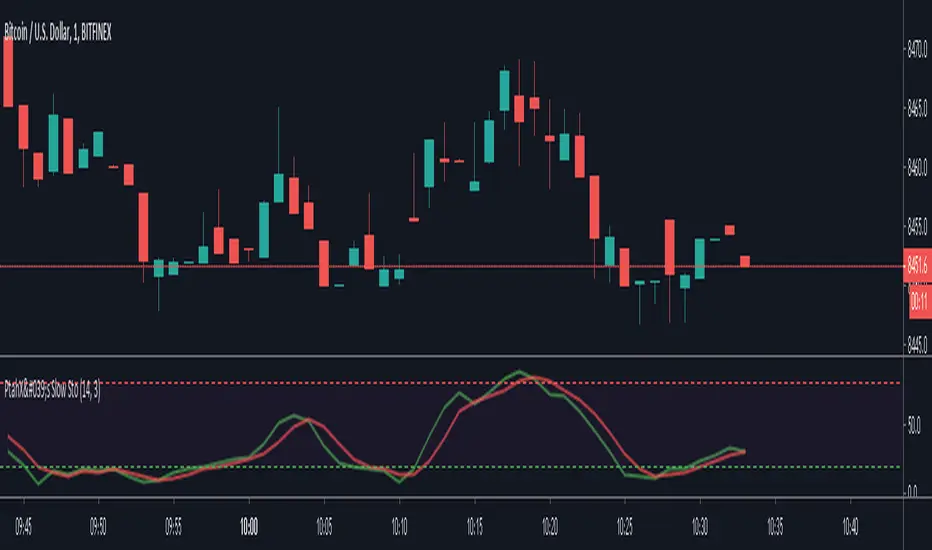
PtahX's Slow Stochastic with AlertsPtahX Slow Stochastic
converted to Pinescript Version 4
initial code thanks to Oshri17 !!
PtahX Version
converted to version 4
modified color scheme
Upper and lower band crossing alerts added (Entrance & Exit)
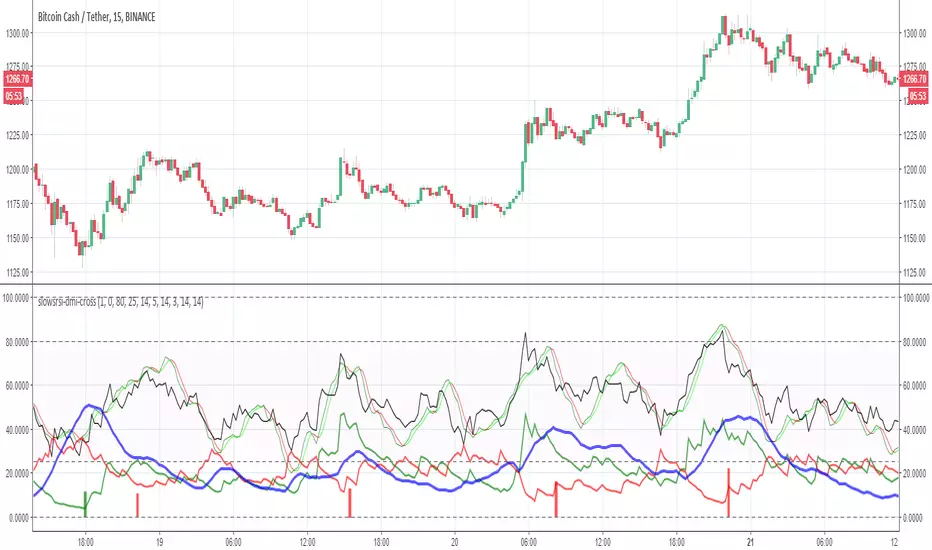
slowsrsi-dmi-crossThis model is based on buy and sell points according to rsi +DMI and the cross up of slow stoch
Slow StochasticThe slow stochastic indicator is a price oscillator that compares a security’s closing price over “n” range. The most commonly used range for the slow stochastic indicator is 14.
Defaults K=14, D=3