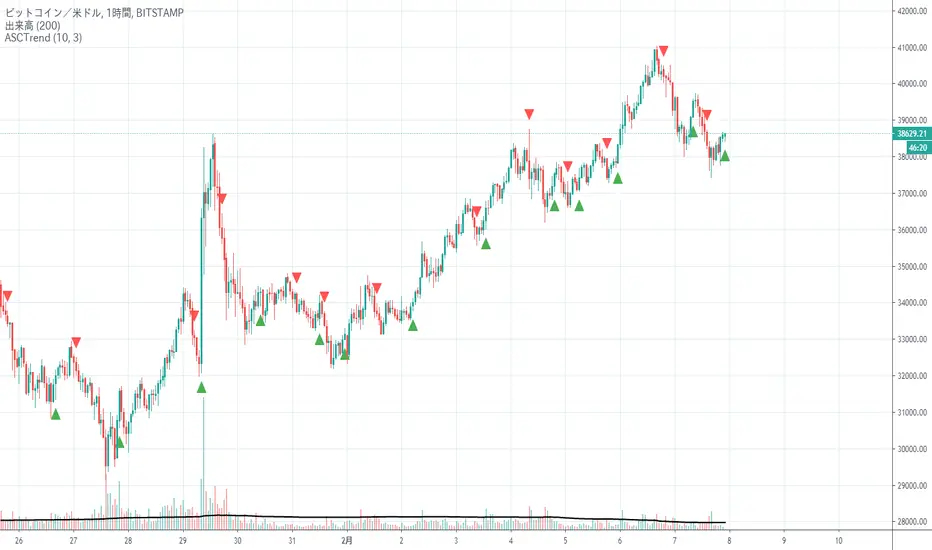
ASCTrendThis is a signal type inge displayed on the candlestick.
Very famous in the world, ASCTrend is one of the oldest signal type indicators, and it seems that the base was completed around MT3, the predecessor of MT4.
I ported it because it was not in TradingView for some reason.
ローソク足上に表示されるシグナル型のインジです。
世界的に非常に有名で、ASCTrendはシグナル型のインジケーターの中でも歴史は古く、ベースはMT4の前身であるMT3の頃には出来上がっていたようです。
なぜかTradingViewにないので移植してみました。
Signals
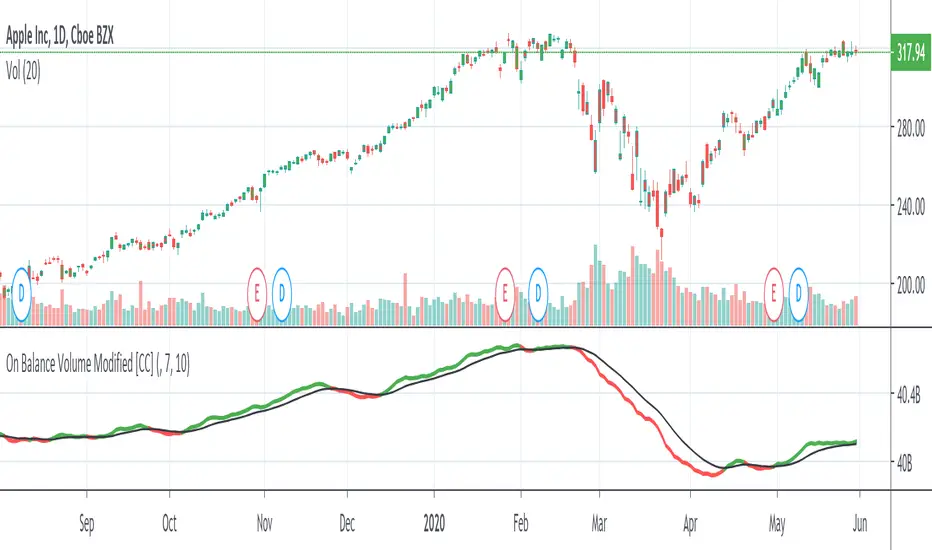
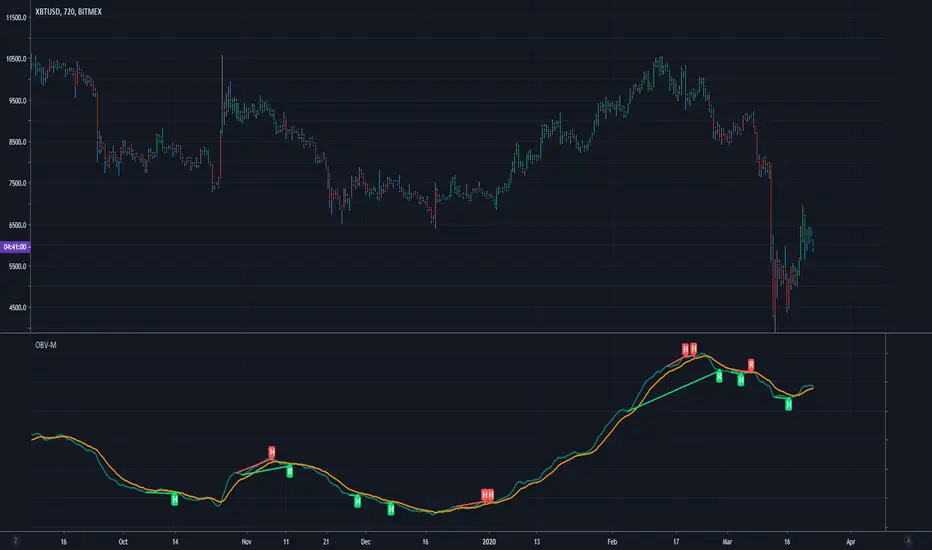
On Balance Volume ModifiedHere is a smoothed version of the classic OBV indicator with a signal line. You can use it to look for signal line crossovers and divergences. The signal line is a 10-day EMA of the OBVM line. Typically, the signal line can vary from 10 to 50.
This was just published by Vitali Apirine in the latest issue of Stocks & Commodities (April 2020) p22-25
Please let me know if you want me to publish any other indicators or if you have any questions!
Modified OBV w/ Divergence Detection by CryptorhythmsApirine OBV-M Modified OBV w/ MA Selection by Cryptorhythms
Intro
Released in the April 2020 issue of TASC, and created by Vitali Apirine.
Description
OBV-M is of course based on the classic indicator on balance volume originally developed by Joe Granville. Apirine then smooths the calculation and adds a signal line to help denote entry and exit points.
As the author points out uts also great at showing divergences!
Extras
As usual when porting indicators to the library here on tradingview, I like to add some extra flare!
💠MA selection to allow you to experiment with alternate settings
💠Bar coloration based on trade state for easy visual at a glance chart checking
💠Divergence Detection and plotting thanks for Ricardo Santos' script
Enjoy!
👍 We hope you enjoyed this indicator and find it useful! We post free crypto analysis, strategies and indicators regularly. This is our 78th script on Tradingview!
BO - CCI Arrow with AlertBO - CCI Arrow with Alert base on CCI indicator to get signal for trade Binary Option.
Rules of BO - CCI Arrow with Alert below:
A. Setup Menu
1. cciLength:
* Default CCI lenght = 14
2. Linear Regression Length:
* Periods to calculate Linear Regression of CCI,
* Default value = 5
3. Extreme Level:
* Default top extreme level = 100
* Default bottom extreme level = -100
4. Filter Length:
* Periods to define highest or lowest Linear Regression
* Default value = 6
B. Rule Of Alert Bar
1. Put Alert Bar
* Current Linear Regression Line created temporrary peak
* Peak of Linear Regression Line greater than Top Extreme Level (100)
* Previous Linear Regression is highest of Filter Length (6)
* Previous Linear Regression is greater than previous peak of Linear Regression Line
* Current price greater than previous low
* CCI(14) less than Linear Regression Line
2. Call Alert Bar
* Current Linear Regression Line created temporrary bottom
* Bottom of Linear Regression Line less than Bottom Extreme Level (-100)
* Previous Linear Regression is lowest of Filter Length (6)
* Previous Linear Regression is less than previous bottom of Linear Regression Line
* Current price less than previous lhigh
* CCI(14) greater than Linear Regression Line
B. Rule Of Entry Bar and Epiry.
1. Put Entry with expiry 3 bars:
* After Put Alert Bar close with signal confirmed, put Arrow appear, and after 3 bars, result label will appear to show win trade, loss trade or draw trade
2. Call Entry with expiry 3 bars:
* After Call Alert Bar close with signal confirmed, call Arrow appear, and after 3 bars, result label will appear to show win trade, loss trade or draw trade.
3. While 1 trade is opening no more any signal
C. Popup Alert/Mobile Alert
1. Signal alert: Put Alert or Call Alert will send to mobile or show popup on chart
2. Put Alert: only Put Alert will send to mobile or show popup on chart
3. Call Alert: only Call Alert will send to mobile or show popup on chart

RSI LevelsRSI Levels
- The relative strength index ( RSI ) is a technical indicator used in the analysis of financial markets.
It is intended to chart the current and historical strength or weakness of a stock or market based on the closing prices of a recent trading period.
- This indicator allows us to visualize the levels of rsi in the chart, so that we can calculate take profit and stop points in a simple way,
knowing what position the price is currently in relation to these levels and how much space we have.
- We can also visualize the slope of the three levels of rsi , overbought, oversold and level 50, something that is not possible in the oscillator version.
- It allows you to display 2 rsi values at the same time.
- Allows to change the color of candlesticks based on rsi.

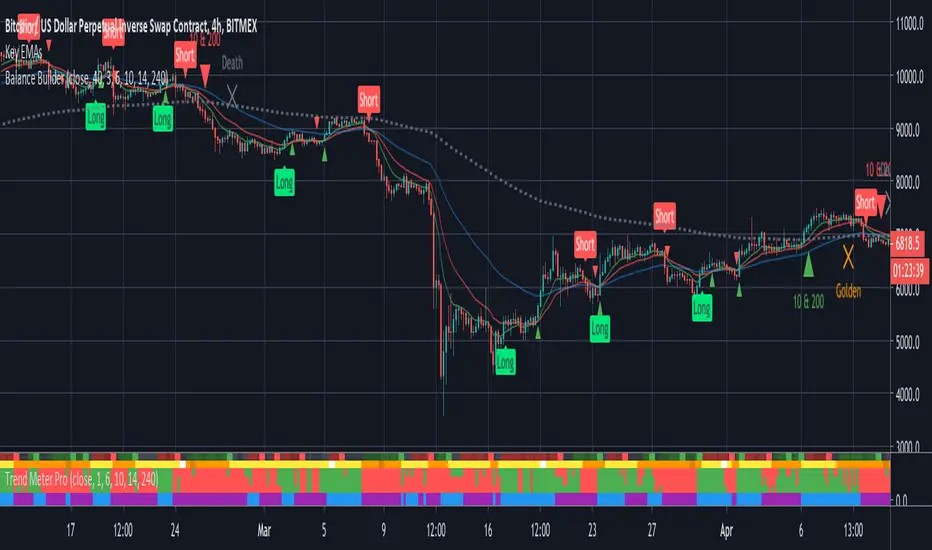
Balance BuilderBalance Builder is the culmination of everything I've learned over the last few years and will be my exclusive FOREX and crypto trading indicator going forward. I will be developing and updating it on a regular basis.
The unique signals it generates do not repaint, nor do they lag. What you are seeing is real-time and will not change once the current candle closes.
This technology analyses trend strength, momentum and the outcome of previous candles to determine the best time to accurately go long or short.
Use the labels to influence your own manual trading decisions or enable the built in alerts to hook in to your trading bot of choice and automatically trade around the clock.
The system can be applied to any instrument but the defaults are tuned for trading Bitcoin on the 4 hour chart. Higher time frames such as this are recommended to increase the win-rate but the parameters can easily be tweaked to cater for shorter term trading.
Important: I personally use Heikin Ashi candles with this script to further filter entries. An option is available within the script settings to toggle this on/off should you wish to do the same.
This is a premium script. Please DM me for access.
Bullyena SignalsWhat is Bullyena Signals?
-It is an indicator that aids the trader in making entry/exit decisions.
-Note that this is optimized for swing traders but you can also use this for scalping.
-The algorithm contains multiple modern indicators and some of them are proprietary.
Bullyena Signals usage:
-Gives entry/exit signals
-Shows the trend of the price using a bar color overlay.
-Shows trailing stops
-Shows buy/long and take profit signals
-Ichimoku cloud for trend confirmation
Installation
- For candlestacks, make sure to Right click > Settings > Symbol > disable wicks and borders.
Access and Documentation
- Message or PM me to know how to get access

VWAP Standard DeviationsVWAP Standard Deviations
VWAPSD is an indicator that can be used to identify Support & Resistance lines based on Volume per Price.
Such an indicator can be easily used to place a limit order on the SR levels

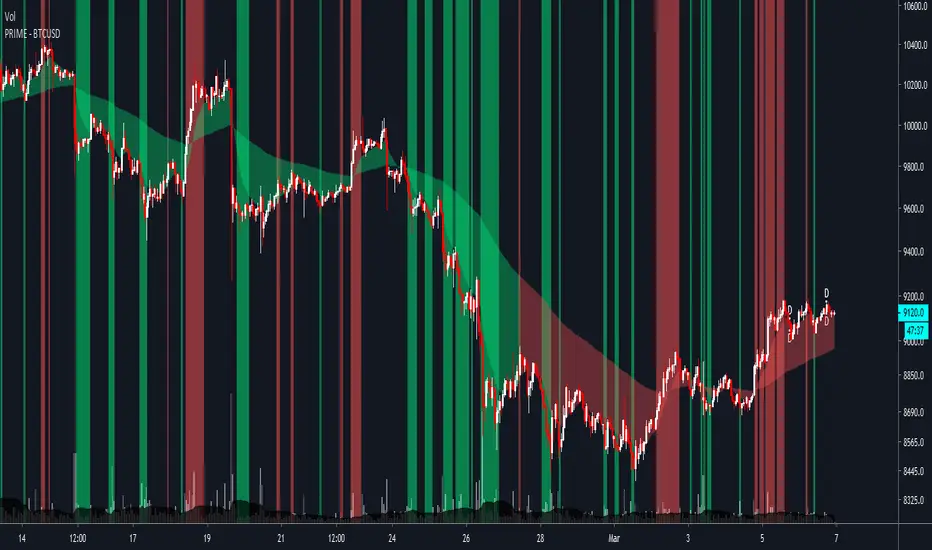
PRIME - BTCUSD - BYBITPRIME is a hyper-focused indicator made for a specific asset and timeframes. The goal of the indicator is to help you simplify and optimize your trading.
As of writing this, the indicator is optimized for the 1H and 4H timeframes.
The indicator will provide you with:
Potential buy and sell zones (the green and red vertical lines/flashes).
The trend of the market, with the cloud as support/resistance.
And the daily, weekly and monthly closes (as D, W and M).
In addition to these, the indicator also comes with the following alerts:
BUY ZONE
SELL ZONE
STOPPED FLASHING
CLOUD TOP X
CLOUD BOTTOM X
These alerts will allow you to know when some of the best opportunities in the market might be present.
This specific version of the indicator is for BTCUSD . However, I can adjust it to your favorite asset.
For access, questions, and full documentation, please message me here on TradingView.
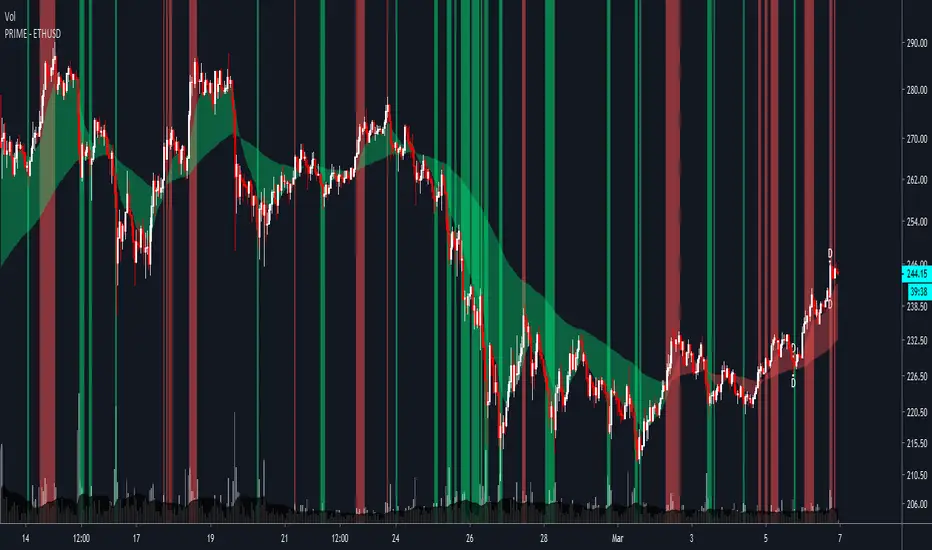
PRIME - ETHUSD - BYBITPRIME is a hyper-focused indicator made for a specific asset and timeframes. The goal of the indicator is to help you simplify and optimize your trading.
As of writing this, the indicator is optimized for the 1H and 4H timeframes.
The indicator will provide you with:
Potential buy and sell zones (the green and red vertical lines/flashes).
The trend of the market, with the cloud as support/resistance.
And the daily, weekly and monthly closes (as D, W and M).
In addition to these, the indicator also comes with the following alerts:
BUY ZONE
SELL ZONE
STOPPED FLASHING
CLOUD TOP X
CLOUD BOTTOM X
These alerts will allow you to know when some of the best opportunities in the market might be present.
This specific version of the indicator is for ETHUSD . However, I can adjust it to your favorite asset.
For access, questions, and full documentation, please message me here on TradingView.
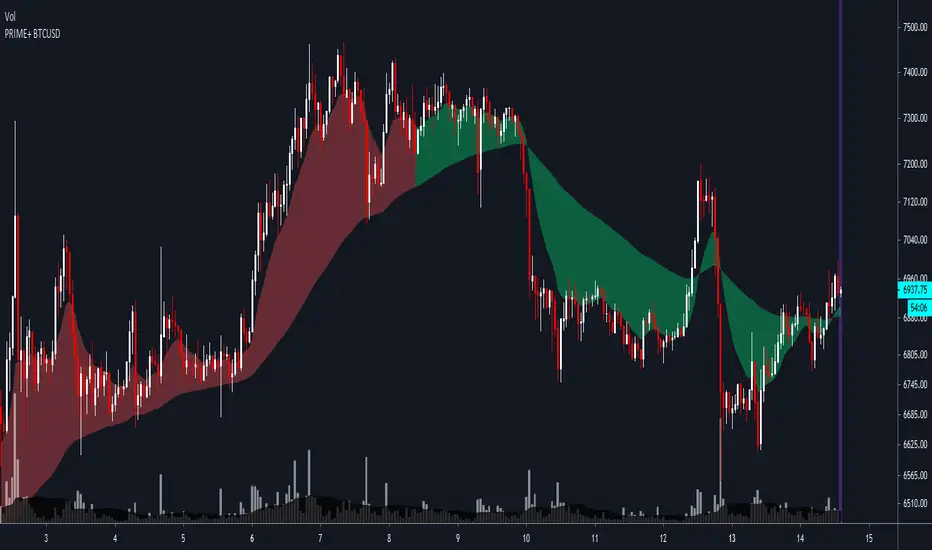
PRIME+ BTCUSDPRIME+ is a hyper-focused indicator made for a specific asset and timeframes. The goal of the indicator is to help you simplify and optimize your trading.
As of writing this, the indicator is optimized for the 3m and 1H timeframes.
The indicator will provide you with:
Potential buy and sell zones (the green and red vertical lines/flashes).
The trend of the market, with the cloud as support/resistance.
The daily, weekly and monthly closes (as D, W and M).
And additional tools for the 3m for best entries and exits.
In addition to these, the indicator also comes with alerts for the flashes:
BUY ZONE
SELL ZONE
These alerts will allow you to know when some of the best opportunities in the market might be present.
This specific version of the indicator is for BTCUSD . However, I can adjust it to your favorite asset.
For access and questions, please message me here on TradingView.
Dekidaka-Ashi - Candles And Volume Teaming Up (Again)The introduction of candlestick methods for market price data visualization might be one of the most important events in the history of technical analysis, as it totally changed the way to see a trading chart. Candlestick charts are extremely efficient, as they allow the trader to visualize the opening, high, low and closing price (OHLC) each at the same time, something impossible with a traditional line chart. Candlesticks are also cleaner than bars charts and make a more efficient use of space. Japanese peoples are always better than everyone at an incredible amount of stuff, look at what they made, the candlesticks/renko/kagi/heikin-ashi charts, the Ichimoku, manga, ecchi...
However classical candlesticks only include historical market price data, and won't include other type of data such as volume, which is considered by many investors a key information toward effective financial forecasting as volume is an indicator of trading activity. In order to tackle to this problem solutions where proposed, the most common one being to adapt the width of the candle based on the amount of volume, this method is the most commonly accepted one when it comes to visualizing both volume and OHLC data using candlesticks.
Now why proposing an additional tool for volume data visualization ? Because the classical width approach don't provide usable data regarding volume (as the width is directly related to the volume data). Therefore a new trading tool based on candlesticks that allow the trader to gain access to information about the volume is proposed. The approach is based on rescaling the volume directly to the price without the direct use of user settings. We will also see that this tool allow to create support and resistances as well as providing signals based on a breakout methodology.
Dekidaka-Ashi - Kakatte Koi Yo!
"Dekidaka" (出来高) mean "Volume" in a financial context, while "Ashi" (足) mean "leg" or "bar". In general methods based on candlesticks will have "Ashi" in their name.
Now that the name of the indicator has been explained lets see how it works, the indicator should be overlayed directly to a candlestick chart. The proposed method don't alter the shape of the candlesticks and allow to visualize any information given by the candles. As you can see on the figure below the candle body of the proposed tool only return the border of the candle, this allow to show the high/low wick of the candle.
The body size of the candle is based on two things : the absolute close/open difference, and the volume, if the absolute close/open difference is high and the volume is high then the body of the candle will be clearly visible, if the volume is high but the absolute close/open difference is low, then the body will be less visible. This approach is used because of the rescaling method used, the volume is divided by the sum between the current volume value and the precedent volume value, this rescale the volume in a (0,1) range, this result is multiplied by the absolute close/open difference and added/subtracted to the high/low price. The original approach was based on normalization using the rolling maximum, but this approach would have led to repainting.
You have access to certain settings that can help you obtain a better visualization, the first one being the body size setting, with higher values increasing the body amplitude.
In green body with size 2, in red with size 1. The smooth parameter will smooth the volume data before being used, this allow to create more visible bodies.
Here smooth = 100.
Making Bands From The Dekidaka-Ashi
This tool is made so it output two rescaled volume values, with the highest value being denoted as "Dekidaka-high" and the lowest one as "Dekidaka-low". In order to get bands we must use two moving averages, one using the Dekidaka-high as input and the other one using Dekidaka-low, the body size parameter should be fairly high, therefore i will hide the tool as it could cause trouble visualizing the bands.
Bands with both MA's of period 20 and the body size equal to 20. Larger periods of the MA's will require a larger amount of body size.
Breakout Signals
There is a wide variety of signals that can be made from candles, ones i personally like comes from the HA candles. The proposed tool is no exception and can produce a wide variety of signals. The signals generated are basic ones based on a breakout methodology, here is each signal with their associated label :
Strong Bullish signal "⇈" : The high price cross the Dekidaka-high and the closing price is greater than the opening price
Strong Bearish signal "⇊" : The low price cross the Dekidaka-low and the closing price is lower than the opening price
Weak Bullish signal "↑" : The high price cross the Dekidaka-high and the closing price is lower than the opening price
Weak Bearish signal "↓" : The low price cross the Dekidaka-low and the closing price is greater than the opening price
Uncertain "↕" : The high price cross the Dekidaka-high and the low price cross the the Dekidaka-low
In order to see the signals on the chart check the "Show signals" option. Note that such signals are not based on an advanced study, and even if they are based on a breakout methodology we can see that volatile movement rarely produce signals, therefore signals mostly occur during low volume/volatility periods, which isn't necessarily a great thing.
Conclusion
A trading tool based on candlesticks that aim to include volume information has been presented and a brief methodology has been introduced. A study of the signals generated is required, however i'am not confident at all on their accuracy, i could work on that in the future. We have also seen how to make bands from the tool.
Candlesticks remain a beautiful charting technique that can provide an enormous amount of information to the trader, and even if the accuracy of patterns based on candlesticks is subject to debates, we can all agree that candlesticks will remain the most widely used type of financial chart.
On a side note i mostly use a dark color for a bullish candle, and a light gray for a bearish candle, with the border color being of the same color as the bullish candle. This is in my opinion the best setup for a candlestick chart, as candles using the traditional green/red can kill the eyes and because this setup allow to apply a wide variety of colors to the plot of overlayed indicators without the fear of causing conflict with the candles color.
Thanks for reading ! :3 Nya
A Word
This morning i received some hateful messages on twitter, the users behind them certainly coming from tradingview, so lets be clear, i know i'am not the most liked person in this community, i know that perfectly, but no one merit to be receive hateful messages. I'am not responsible for the losses of peoples using my indicators, nor is tradingview, using technical indicators does not guarantee long term returns, your ability to be profitable will mostly be based on the quality and quantity of knowledge you have.

PRIME - XBTUSDPRIME - XBTUSD is an indicator made specifically for XBTUSD on the 1 hour timeframe .
The indicator will help you know:
Potential areas to buy and sell (the flashes).
The trend of the market (the wavy cloud).
Important support/resistance areas (the wavy cloud).
And the daily, weekly and monthly closes (as D, W and M).
The indicator comes with the following alerts:
BUY BTC (1H)
SELL BTC (1H)
The alerts must be set on the 1 hour timeframe.
The goal of the indicator is to make trading simple and sustainable regardless of your lifestyle.
PS. The buy and sell flashes only show on the 1 hour; and the cloud and closes up to the 12 hour (to keep the chart clean).
PPS. For access and questions, message me here on TradingView. If you need it for another asset, I can adjust the settings for you.

PRIME - BTCUSDPRIME - BTCUSD is an indicator made specifically for BTCUSD on the 1 hour timeframe .
The indicator will help you know:
Potential areas to buy and sell (the flashes).
The trend of the market (the wavy cloud).
Important support/resistance areas (the wavy cloud).
And the daily, weekly and monthly closes (as D, W and M).
The indicator comes with the following alerts:
BUY BTC (1H)
SELL BTC (1H)
The alerts must be set on the 1 hour timeframe.
The goal of the indicator is to make trading simple and sustainable regardless of your lifestyle.
PS. The buy and sell flashes only show on the 1 hour; and the cloud and closes up to the 12 hour (to keep the chart clean).
PPS. For access and questions, message me here on TradingView. If you need it for another asset, I can adjust the settings for you.

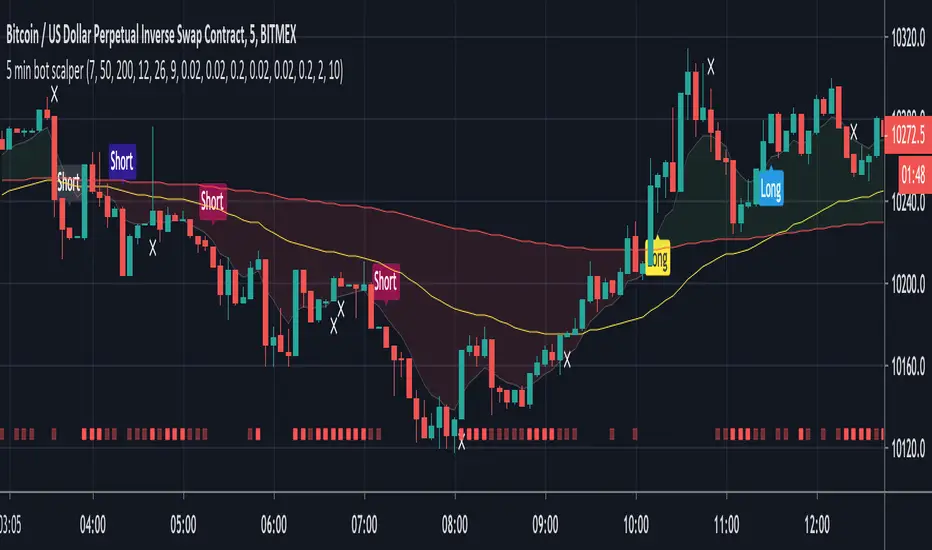
5 min bot scalperSAR signals (Parabolic and Lucid) combined with UT pivots, all filtered by the 200 MA. Golden and death crosses are also included to catch larger moves out-with long/short trends. These are filtered by my chop indicator to remove sideways signals.
This is designed for the 5 minute chart but may be useful elsewhere with some tweaking.
Alerts are included for long, short and exit signals.
QQE signalsConverted the QQE oscillator to in-chart long and short signals with built in alerts. This is multi-timeframe and quite robust.

BO - Bar M15 2/3 SignalBO - Bar M15 2/3 Signal show the signal to trade Binary Option with rule below:
A. Indicator
* Bollinger Band (20,2): avoid waterfall
B. Rule of Signal
1. Rule1: Split Bar M15 to 3 part and load them on M5 chart (recommend use M5 IDC chart)
2. Rule 2: Delay 10' after bar M15 open => wait for price's pattern
3. Rule 3: Put Signal row 30-32
* Delay 10' after bar M15 open.
* Direction of 1/3 and 2/3 Bar M15 is upward
* close of 2/3 Bar M15 below upper band Bb(20,2) on M5 chart => avoid strong buy
4. Rule 4: Call Signal row 36-38
* Delay 10' after bar M15 open.
* Direction of 1/3 and 2/3 Bar M15 is downward
* close of 2/3 Bar M15 above lower band Bb(20,2) on M5 chart => avoid strong sell
C. Recommend Expiry time: Bar M15 close
* We try to catch the shadow of Bar M15 but dont trade when price run on the upper or lower band of BB(20,2,M5)

Sour ∀This script is based off of the angles from an MA I pieced together a few days ago.
This version is to be used for exits, such as if you have a solid entry and don't know where to exit but want to remain "safe" then close when this fires off. If anyone wants an alerts version for this then lmk in the comments (No one will remember this exists in 48 hours)
The length should be played with for each market (that has volume) + timeframe to see what has the best results.
Each chart has slightly different settings but each has the OS/OB as the default.
Enjoy.
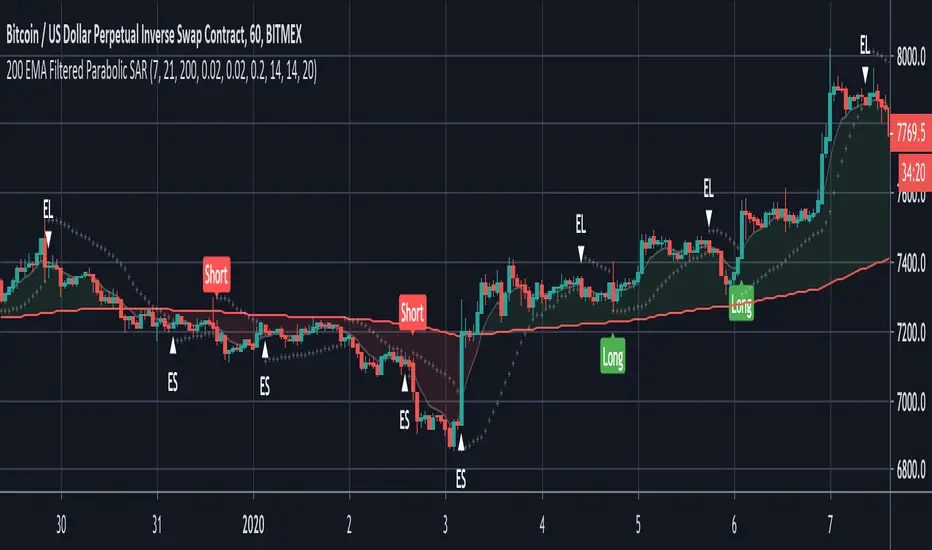
200 EMA Filtered Parabolic SARThis script uses Parabolic SAR with the 200 EMA to determine long and short trends. Only long signals are given when the price is above the 200MA and shorts when it is below. Signals are further filtered using ADX to reduce noise.
Suitable for trading bots where open positions in the same type are set to be ignored.
Alerts are built in.
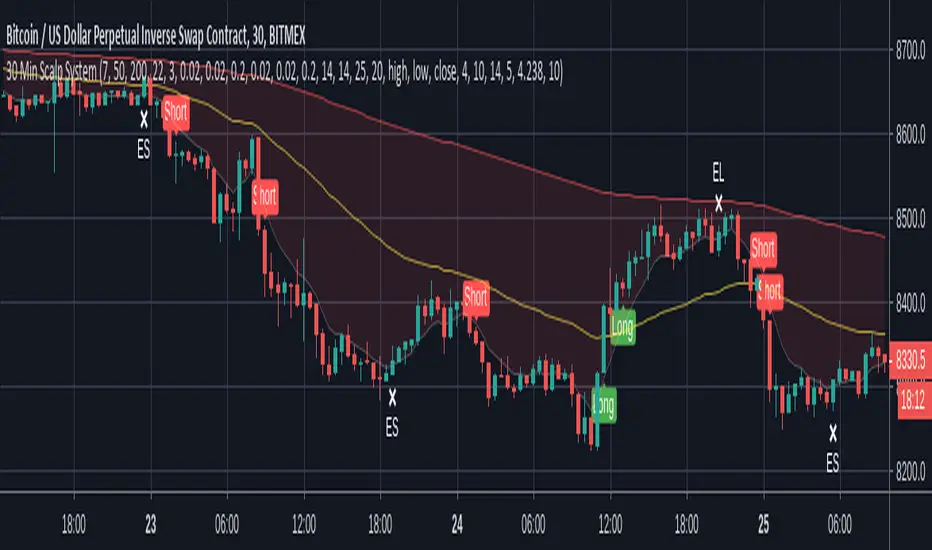
30 Min Scalp SystemA scalping script for the 30 min chart that is designed and tuned to be used with trading bots such as ProfitView or Autoview. I personally trade with this on Bitmex.
This trading system is built upon 4 established trading indicators that compliment each other. All signals are filtered in a number of ways to avoid chop and only trigger when a strong trend or crossover is identified.
Alerts are included for longs, shorts and exits in both directions.
Recommended setup:
- Trade with leverage and take 75%-80% out at 0.5% profit, leaving the rest to run
- Initial stop-loss of 1%, initiating a trailing stop of 0.75% when TP is hit
- Ensure bots are set to ignore open orders in the same direction
I use this in conjunction with ProfitView where I run three custom scripts to manage my position entries, monitor profit levels, dynamically move my stop and then exit positions where appropriate.
Note: Exit signals are show here even when trades aren't open because it's only possible to hide these when using a strategy script. This is coded as an indicator so that alerts can be sent to your chosen bot.
Disclaimer: The signals aren't perfect but no script is. The above cannot be considered financial advice and I take no responsibility from any losses incurred. A test account is recommended to verify the win rate before trading on a live platform.
BO - Bar M15 Signal* This script show the signal base on volatility of previous bar M15 to trade Binary Option.
* Rule of Signal is below:
A. Rule 1: Wait for prices created temporary peak and bottom
Row 18: 10 minutes till close
B. Rule 2: Reversal previous bar's direction
1. Put Signal - Row 22 - 25:
- Delay 5' after bar M15 open
- previous bar's direction is upward
- price less than previous close
- temporary bottom greater than previous open
2. Call Signal - Row 29 - 32:
- Delay 5' after bar M15 open
- previous bar's direction is downward
- price greater than previous close
- temporary peak less than previous open
C. Rule 3: Follow previous bar's direction
1. Put Signal - Row 37 - 40:
- Delay 5' after bar M15 open
- previous bar's direction is downward
- price greater than previous open
- temporary peak less than previous peak
2. Call Signal - Row 43 - 46:
- Delay 5' after bar M15 open
- previous bar's direction is upward
- price less than previous open
- temporary bottom greater than previous bottom
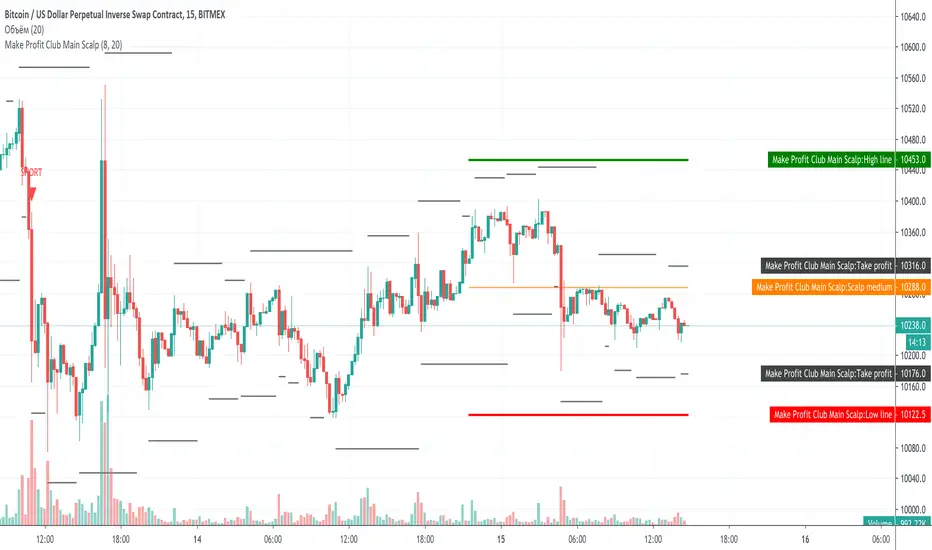
Make Profit Club Main ScalpThe main scalping indicator.
We use this indicator to trade for a short time in a TF of 5-15 minutes.
We have created takeprofit zones for you so that you can understand where we can get to and take your profit. these points are mostly very helpful.
There are basic settings that allow you to adjust the indicator individually for each situation; because of this, this indicator can be used for any exchange and any currency pair.
For Scalp trading, we use 3 different strategies available to our clients. If you enter them correctly, you can never see the minus sign.
Use the link below to obtain access to this indicator.
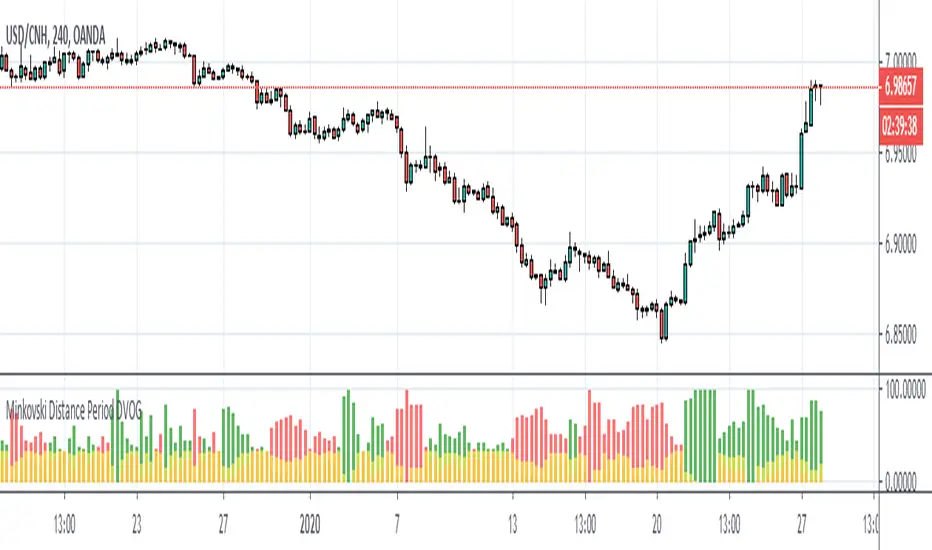
Minkovski Distance Period DVOGThis script was created by building my Dependent Variable Odd Generator script on the Minkovski Distance Adaptive Period.
I have tried this on MACD before.
Script related to MACD :
I used an older version that does not use Dow Factor to suit multi timeframe analysis.
In this way, market situations provide the opportunity to see histograms in an adaptive period as a Multi Timeframe.
Minkowski Distance Function Original Script by RicardoSantos :
Regards.