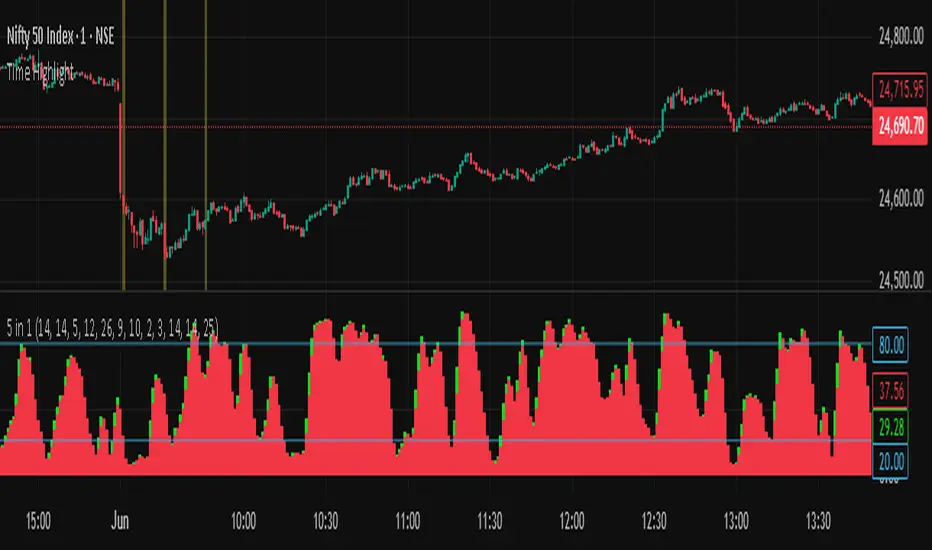
Time HighlightHow This Works:
Time Conversion: The script converts the current time to HHMM format (e.g., 9:16 becomes 916) for easy comparison.
Timeframe Detection: It checks the current chart's timeframe:
For 1-minute charts: Exactly matches the target times
For 5-minute charts: Checks if the target time falls within the 5-minute window
For 15-minute charts: Checks if the target time falls within the 15-minute window
Highlighting: When the condition is met, it highlights the candle with a semi-transparent yellow color.
Note:
The script will work on 1-minute, 5-minute, and 15-minute timeframes only
The highlight appears on the candle that contains the specified time
The transparency is set to 70% so you can still see the candle through the highlight
You can adjust the transparency level by changing the transp parameter (0 = fully opaque, 100 = fully transparent).
make a pine script which change the color of the candle in yellow color in 1,5,15 timeframe at the time of 9:16, 9:31, 9:46
ค้นหาในสคริปต์สำหรับ "股票开盘前15分钟交易规则"
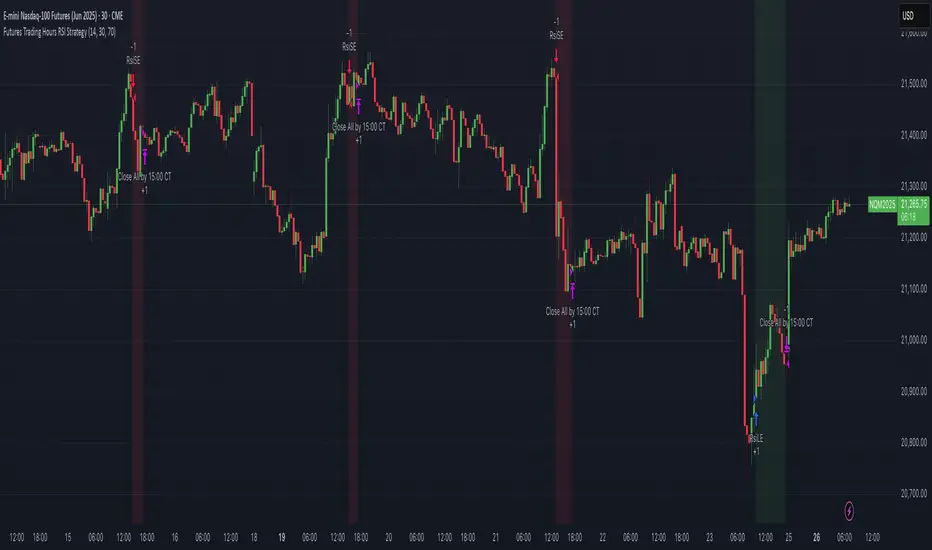
Futures Trading Hours RSI StrategyFutures Trading Hours RSI Strategy
A lightweight, session-filtered RSI strategy designed for equity-index futures (e.g. NQ, ES, YM) on a 30-minute chart. It dynamically enters long when RSI crosses above your oversold threshold and short when RSI crosses below your overbought threshold—but only during regular U.S. trading hours (08:30–15:00 CT, Monday–Friday). All positions are set to close at 15:00 CT to avoid overnight risk, and optional background shading highlights your open longs (green) and shorts (red).
⸻
Key Features
• RSI-based entries: configurable length, oversold, and overbought levels
• Session filter: trades only between 08:30–15:00 CT, Monday through Friday
• Automatic exit: closes all positions at or after 15:00 CT each day
• Visual cues: optional background shading for open long/short positions
• Easy customization: adjust length, overSold, overBought, and time offsets
Backtest Performance (NQ Jun 2025, 30 min)
• Total P&L: +$10,230 (+1.02%)
• Profit Factor: 4.61
• Win Rate: 57.1% (4 wins / 7 trades)
• Max Drawdown: $2,215 (0.22%)
(Results shown are for illustrative purposes only; past performance does not guarantee future returns.)
How to Use
1. Add this script to your 30-minute futures chart.
2. Tweak the RSI parameters and time-zone offset to suit your instrument.
3. Enable “background shading” if you’d like a visual reminder of open positions.
4. Run in paper-trade mode to validate performance before going live.
⸻
⚠️ Disclaimer: Trading carries risk. Always backtest and paper-trade before using real capital. Adjust position sizing and risk controls to your own tolerance.
Topological Market Stress (TMS) - Quantum FabricTopological Market Stress (TMS) - Quantum Fabric
What Stresses The Market?
Topological Market Stress (TMS) represents a revolutionary fusion of algebraic topology and quantum field theory applied to financial markets. Unlike traditional indicators that analyze price movements linearly, TMS examines the underlying topological structure of market data—detecting when the very fabric of market relationships begins to tear, warp, or collapse.
Drawing inspiration from the ethereal beauty of quantum field visualizations and the mathematical elegance of topological spaces, this indicator transforms complex mathematical concepts into an intuitive, visually stunning interface that reveals hidden market dynamics invisible to conventional analysis.
Theoretical Foundation: Topology Meets Markets
Topological Holes in Market Structure
In algebraic topology, a "hole" represents a fundamental structural break—a place where the normal connectivity of space fails. In markets, these topological holes manifest as:
Correlation Breakdown: When traditional price-volume relationships collapse
Volatility Clustering Failure: When volatility patterns lose their predictive power
Microstructure Stress: When market efficiency mechanisms begin to fail
The Mathematics of Market Topology
TMS constructs a topological space from market data using three key components:
1. Correlation Topology
ρ(P,V) = correlation(price, volume, period)
Hole Formation = 1 - |ρ(P,V)|
When price and volume decorrelate, topological holes begin forming.
2. Volatility Clustering Topology
σ(t) = volatility at time t
Clustering = correlation(σ(t), σ(t-1), period)
Breakdown = 1 - |Clustering|
Volatility clustering breakdown indicates structural instability.
3. Market Efficiency Topology
Efficiency = |price - EMA(price)| / ATR
Measures how far price deviates from its efficient trajectory.
Multi-Scale Topological Analysis
Markets exist across multiple temporal scales simultaneously. TMS analyzes topology at three distinct scales:
Micro Scale (3-15 periods): Immediate structural changes, market microstructure stress
Meso Scale (10-50 periods): Trend-level topology, medium-term structural shifts
Macro Scale (50-200 periods): Long-term structural topology, regime-level changes
The final stress metric combines all scales:
Combined Stress = 0.3×Micro + 0.4×Meso + 0.3×Macro
How TMS Works
1. Topological Space Construction
Each market moment is embedded in a multi-dimensional topological space where:
- Price efficiency forms one dimension
- Correlation breakdown forms another
- Volatility clustering breakdown forms the third
2. Hole Detection Algorithm
The indicator continuously scans this topological space for:
Hole Formation: When stress exceeds the formation threshold
Hole Persistence: How long structural breaks maintain
Hole Collapse: Sudden topology restoration (regime shifts)
3. Quantum Visualization Engine
The visualization system translates topological mathematics into intuitive quantum field representations:
Stress Waves: Main line showing topological stress intensity
Quantum Glow: Surrounding field indicating stress energy
Fabric Integrity: Background showing structural health
Multi-Scale Rings: Orbital representations of different timeframes
4. Signal Generation
Stable Topology (✨): Normal market structure, standard trading conditions
Stressed Topology (⚡): Increased structural tension, heightened volatility expected
Topological Collapse (🕳️): Major structural break, regime shift in progress
Critical Stress (🌋): Extreme conditions, maximum caution required
Inputs & Parameters
🕳️ Topological Parameters
Analysis Window (20-200, default: 50)
Primary period for topological analysis
20-30: High-frequency scalping, rapid structure detection
50: Balanced approach, recommended for most markets
100-200: Long-term position trading, major structural shifts only
Hole Formation Threshold (0.1-0.9, default: 0.3)
Sensitivity for detecting topological holes
0.1-0.2: Very sensitive, detects minor structural stress
0.3: Balanced, optimal for most market conditions
0.5-0.9: Conservative, only major structural breaks
Density Calculation Radius (0.1-2.0, default: 0.5)
Radius for local density estimation in topological space
0.1-0.3: Fine-grained analysis, sensitive to local changes
0.5: Standard approach, balanced sensitivity
1.0-2.0: Broad analysis, focuses on major structural features
Collapse Detection (0.5-0.95, default: 0.7)
Threshold for detecting sudden topology restoration
0.5-0.6: Very sensitive to regime changes
0.7: Balanced, reliable collapse detection
0.8-0.95: Conservative, only major regime shifts
📊 Multi-Scale Analysis
Enable Multi-Scale (default: true)
- Analyzes topology across multiple timeframes simultaneously
- Provides deeper insight into market structure at different scales
- Essential for understanding cross-timeframe topology interactions
Micro Scale Period (3-15, default: 5)
Fast scale for immediate topology changes
3-5: Ultra-fast, tick/minute data analysis
5-8: Fast, 5m-15m chart optimization
10-15: Medium-fast, 30m-1H chart focus
Meso Scale Period (10-50, default: 20)
Medium scale for trend topology analysis
10-15: Short trend structures
20-25: Medium trend structures (recommended)
30-50: Long trend structures
Macro Scale Period (50-200, default: 100)
Slow scale for structural topology
50-75: Medium-term structural analysis
100: Long-term structure (recommended)
150-200: Very long-term structural patterns
⚙️ Signal Processing
Smoothing Method (SMA/EMA/RMA/WMA, default: EMA) Method for smoothing stress signals
SMA: Simple average, stable but slower
EMA: Exponential, responsive and recommended
RMA: Running average, very smooth
WMA: Weighted average, balanced approach
Smoothing Period (1-10, default: 3)
Period for signal smoothing
1-2: Minimal smoothing, noisy but fast
3-5: Balanced, recommended for most applications
6-10: Heavy smoothing, slow but very stable
Normalization (Fixed/Adaptive/Rolling, default: Adaptive)
Method for normalizing stress values
Fixed: Static 0-1 range normalization
Adaptive: Dynamic range adjustment (recommended)
Rolling: Rolling window normalization
🎨 Quantum Visualization
Fabric Style Options:
Quantum Field: Flowing energy visualization with smooth gradients
Topological Mesh: Mathematical topology with stepped lines
Phase Space: Dynamical systems view with circular markers
Minimal: Clean, simple display with reduced visual elements
Color Scheme Options:
Quantum Gradient: Deep space blue → Quantum red progression
Thermal: Black → Hot orange thermal imaging style
Spectral: Purple → Gold full spectrum colors
Monochrome: Dark gray → Light gray elegant simplicity
Multi-Scale Rings (default: true)
- Display orbital rings for different time scales
- Visualizes how topology changes across timeframes
- Provides immediate visual feedback on cross-scale dynamics
Glow Intensity (0.0-1.0, default: 0.6)
Controls the quantum glow effect intensity
0.0: No glow, pure line display
0.6: Balanced, recommended setting
1.0: Maximum glow, full quantum field effect
📋 Dashboard & Alerts
Show Dashboard (default: true)
Real-time topology status display
Current market state and trading recommendations
Stress level visualization and fabric integrity status
Show Theory Guide (default: true)
Educational panel explaining topological concepts
Dashboard interpretation guide
Trading strategy recommendations
Enable Alerts (default: true)
Extreme stress detection alerts
Topological collapse notifications
Hole formation and recovery signals
Visual Logic & Interpretation
Main Visualization Elements
Quantum Stress Line
Primary indicator showing topological stress intensity
Color intensity reflects current market state
Line style varies based on selected fabric style
Glow effect indicates stress energy field
Equilibrium Line
Silver line showing average stress level
Reference point for normal market conditions
Helps identify when stress is elevated or suppressed
Upper/Lower Bounds
Red upper bound: High stress threshold
Green lower bound: Low stress threshold
Quantum fabric fill between bounds shows stress field
Multi-Scale Rings
Aqua circles : Micro-scale topology (immediate changes)
Orange circles: Meso-scale topology (trend-level changes)
Provides cross-timeframe topology visualization
Dashboard Information
Topology State Icons:
✨ STABLE: Normal market structure, standard trading conditions
⚡ STRESSED: Increased structural tension, monitor closely
🕳️ COLLAPSE: Major structural break, regime shift occurring
🌋 CRITICAL: Extreme conditions, reduce risk exposure
Stress Bar Visualization:
Visual representation of current stress level (0-100%)
Color-coded based on current topology state
Real-time percentage display
Fabric Integrity Dots:
●●●●● Intact: Strong market structure (0-30% stress)
●●●○○ Stressed: Weakening structure (30-70% stress)
●○○○○ Fractured: Breaking down structure (70-100% stress)
Action Recommendations:
✅ TRADE: Normal conditions, standard strategies apply
⚠️ WATCH: Monitor closely, increased vigilance required
🔄 ADAPT: Change strategy, regime shift in progress
🛑 REDUCE: Lower risk exposure, extreme conditions
Trading Strategies
In Stable Topology (✨ STABLE)
- Normal trading conditions apply
- Use standard technical analysis
- Regular position sizing appropriate
- Both trend-following and mean-reversion strategies viable
In Stressed Topology (⚡ STRESSED)
- Increased volatility expected
- Widen stop losses to account for higher volatility
- Reduce position sizes slightly
- Focus on high-probability setups
- Monitor for potential regime change
During Topological Collapse (🕳️ COLLAPSE)
- Major regime shift in progress
- Adapt strategy immediately to new market character
- Consider closing positions that rely on previous regime
- Wait for new topology to stabilize before major trades
- Opportunity for contrarian plays if collapse is extreme
In Critical Stress (🌋 CRITICAL)
- Extreme market conditions
- Significantly reduce risk exposure
- Avoid new positions until stress subsides
- Focus on capital preservation
- Consider hedging existing positions
Advanced Techniques
Multi-Timeframe Topology Analysis
- Use higher timeframe TMS for regime context
- Use lower timeframe TMS for precise entry timing
- Alignment across timeframes = highest probability trades
Topology Divergence Trading
- Most powerful at regime boundaries
- Price makes new high/low but topology stress decreases
- Early warning of potential reversals
- Combine with key support/resistance levels
Stress Persistence Analysis
- Long periods of stable topology often precede major moves
- Extended stress periods often resolve in regime changes
- Use persistence tracking for position sizing decisions
Originality & Innovation
TMS represents a genuine breakthrough in applying advanced mathematics to market analysis:
True Topological Analysis: Not a simplified proxy but actual topological space construction and hole detection using correlation breakdown, volatility clustering analysis, and market efficiency measurement.
Quantum Aesthetic: Transforms complex topology mathematics into an intuitive, visually stunning interface inspired by quantum field theory visualizations.
Multi-Scale Architecture: Simultaneous analysis across micro, meso, and macro timeframes provides unprecedented insight into market structure dynamics.
Regime Detection: Identifies fundamental market character changes before they become obvious in price action, providing early warning of structural shifts.
Practical Application: Clear, actionable signals derived from advanced mathematical concepts, making theoretical topology accessible to practical traders.
This is not a combination of existing indicators or a cosmetic enhancement of standard tools. It represents a fundamental reimagining of how we measure, visualize, and interpret market dynamics through the lens of algebraic topology and quantum field theory.
Best Practices
Start with defaults: Parameters are optimized for broad market applicability
Match timeframe: Adjust scales based on your trading timeframe
Confirm with price action: TMS shows market character, not direction
Respect topology changes: Reduce risk during regime transitions
Use appropriate strategies: Adapt approach based on current topology state
Monitor persistence: Track how long topology states maintain
Cross-timeframe analysis: Align multiple timeframes for highest probability trades
Alerts Available
Extreme Topological Stress: Market fabric under severe deformation
Topological Collapse Detected: Regime shift in progress
Topological Hole Forming: Market structure breakdown detected
Topology Stabilizing: Market structure recovering to normal
Chart Requirements
Recommended Markets: All liquid markets (forex, stocks, crypto, futures)
Optimal Timeframes: 5m to Daily (adaptable to any timeframe)
Minimum History: 200 bars for proper topology construction
Best Performance: Markets with clear regime characteristics
Academic Foundation
This indicator draws from cutting-edge research in:
- Algebraic topology and persistent homology
- Quantum field theory visualization techniques
- Market microstructure analysis
- Multi-scale dynamical systems theory
- Correlation topology and network analysis
Disclaimer
This indicator is for educational and research purposes only. It does not constitute financial advice or provide direct buy/sell signals. Topological analysis reveals market structure characteristics, not future price direction. Always use proper risk management and combine with your own analysis. Past performance does not guarantee future results.
See markets through the lens of topology. Trade the structure, not the noise.
Bringing advanced mathematics to practical trading through quantum-inspired visualization.
Trade with insight. Trade with structure.
— Dskyz , for DAFE Trading Systems

VWAP + Candle-Rating SELL (close, robust)This multi‐timeframe setup first scans the 15-minute chart for strong bearish candles (body position in the bottom 40% of their range, i.e. rating 4 or 5) that close below the session VWAP. When it finds the first such “setup” of a trading period, it pins the low of that 15-minute candle as a trigger level and draws a persistent red line there. On the 5-minute chart, the strategy then waits for a similarly strong bearish candle (rating 4 or 5) to close below that marked low—at which point it emits a one‐time SELL signal. The trigger level remains in place (and additional sell signals are locked out) until the market “rescues” the price: a 15-minute bullish candle (rating 1 or 2) closing back above VWAP clears the old setup and allows the next valid bearish 15-minute candle to form a new trigger. This design ensures you only trade the most significant breakdowns after a clear bearish bias and avoids repeated signals until a genuine bullish reversal resets the system.

10 Monday's 1H Avg Range + 30-Day Daily RangeWhat This Script Does
This indicator is designed for traders who want to monitor volatility and range behavior at the start of the trading week . It focuses specifically on the first four 15-minute candles of each Monday and tracks their combined high-low range over time.
How It Works
Monday 1H Range Detection:
Each week, it automatically detects and highlights the first 4 candles of Monday on a 15-minute chart (1 hour total). It calculates the range between the highest high and lowest low of these candles.
10-Week Average of Monday 1H Ranges:
It stores and averages the last 10 such ranges, displaying this average in a table for weekly comparison.
30-Day Daily Range Average:
Separately, it calculates the average daily range (high – low) of the last 30 daily candles. This value helps put the Monday 1H range into broader context and can guide Stop Loss or TP planning.
Dynamic Labeling & Visual Highlights:
The script visually highlights the first 4 candles of Monday and places a label showing the pip range once the 4 candles have completed. It also updates a small table with the two averages described above.
How to Use It
Use it on the 15-minute timeframe to activate the Monday 1H logic.
Compare the current week’s Monday range to the 10-week average to see if volatility is increasing or decreasing.
Use the 30-day daily range to determine if the Monday opening movement is unusually large or small.
Consider adjusting trade entries, stops, or targets if the Monday range is disproportionately large compared to recent historical behavior.
What Makes It Original?
This is not a typical volatility indicator like ATR or standard deviation. Instead, it’s a purpose-built tool combining:
Time-specific behavior (first hour of the week),
Historical contextualization (10-week average tracking),
A dual-timeframe analysis (15-min + daily),
A user-friendly table and visual interface.
This script helps intraday or swing traders spot abnormal volatility early in the week and adjust their strategies accordingly—especially in fast-moving Forex or Index markets.

[blackcat] L2 Angle Trend TrackerOVERVIEW
The " L2 Angle Trend Tracker" is a sophisticated technical analysis tool designed to monitor trend direction and momentum using multiple Exponential Moving Averages (EMAs) with different periods. 📈 This script calculates the angles of 5 EMAs (5, 8, 10, 12, and 15 periods) and displays them with gradient colors, providing a comprehensive view of market momentum. When all EMAs cross above or below specified threshold levels, it generates Buy or Sell signals with visual alerts. The indicator helps traders identify trend reversals, potential entry/exit points, and market sentiment shifts with precision. 🚀 This powerful tool is particularly useful for traders who want to combine multiple timeframe analysis with angle-based momentum confirmation.
FEATURES
Calculates angles for 5 EMAs with customizable periods (5, 8, 10, 12, and 15)
Displays angle values with distinct colors for each EMA (Green, Blue, Purple, Orange, and Red)
Generates Buy signals when all EMAs cross above the lower threshold
Generates Sell signals when all EMAs cross below the upper threshold
Shows a zero line and threshold lines for easy reference
Customizable threshold levels for Buy/Sell signals
Visual alerts with "Buy" and "Sell" labels at the point of signal generation
The script uses a mathematical formula to calculate the angle of each EMA relative to its position 11 bars ago
Angle values are converted from radians to degrees for easier interpretation
The zero line represents no change in the EMA angle
The indicator is not overlayed on the price chart by default, but can be adjusted in the script settings 📊
HOW TO USE
Adjust the EMA periods to match your trading strategy 🛠️
Shorter periods (5, 8) are more sensitive to price changes
Longer periods (10, 12, 15) provide smoother trend confirmation
Set appropriate threshold values for Buy/Sell signals based on your risk tolerance
Default thresholds are 70 for upper threshold and -70 for lower threshold
Consider adjusting thresholds based on market volatility
Watch for Buy signals when all EMAs cross above the lower threshold (default: -70)
The signal appears as a green "Buy" label on the chart
This indicates a potential trend reversal to the upside
Watch for Sell signals when all EMAs cross below the upper threshold (default: 70)
The signal appears as a red "Sell" label on the chart
This indicates a potential trend reversal to the downside
Combine with other indicators for confirmation before making trading decisions 🧠
Consider using volume confirmation, support/resistance levels, or other oscillators
The angle tracker works well with trend-following strategies
Use the angle values to gauge momentum strength
Steeper angles indicate stronger momentum
Flatter angles suggest weakening momentum or consolidation
CONFIGURATION
EMA Periods: The script uses five different EMA periods that can be customized:
EMA Period 5: Short-term trend indicator
EMA Period 8: Medium-short term trend indicator
EMA Period 10: Medium-term trend indicator
EMA Period 12: Medium-long term trend indicator
EMA Period 15: Long-term trend indicator
Threshold Settings:
Threshold Top: Sets the upper boundary for Sell signals (default: 70)
Threshold Bot: Sets the lower boundary for Buy signals (default: -70)
These thresholds can be adjusted based on market conditions and trading style
LIMITATIONS
The script may generate false signals in ranging markets or during periods of high volatility
All EMAs must cross the threshold for a signal to appear, which may filter some valid signals
The angle calculation uses a 11-bar lookback period, which may not be suitable for all timeframes
Works best in trending markets and may produce whipsaws in choppy conditions ⚠️
The indicator is more effective on higher timeframes (4H, 1D) than on very short timeframes (1M, 5M)
Signal generation requires confirmation from multiple EMAs, which may delay entry/exit points
The angle calculation method may not be suitable for all financial instruments
ADVANCED TIPS
Use multiple instances of this indicator with different EMA settings for multi-timeframe analysis
Combine with volume analysis to confirm the strength of signals
Look for confluence with support and resistance levels for more reliable signals
Consider using the angle values as a filter for other trading strategies
The indicator can be used to identify momentum exhaustion points when angles flatten
For swing trading, consider using the Buy and Sell signals as potential entry/exit points
For day trading, you may want to use shorter EMA periods and adjust threshold values accordingly
NOTES
The script uses a mathematical formula to calculate the angle of each EMA relative to its position 11 bars ago
The angle values are converted from radians to degrees for easier interpretation
The zero line represents no change in the EMA angle
The indicator is not overlayed on the price chart by default, but can be adjusted in the script settings 📊
The angle calculation provides a dynamic view of momentum that traditional moving averages don't offer
The threshold values are based on empirical testing and can be fine-tuned for specific instruments
THANKS
Special thanks to the TradingView community for their support and feedback on this indicator. If you find this script helpful, please consider leaving a comment or sharing your experiences with it. Your feedback helps improve the tool for everyone. 🙏
Also, a nod to the original concept developers who pioneered angle-based trend analysis. This script builds upon those foundational ideas to provide a more comprehensive view of market momentum. 🌟

Canuck Trading IndicatorOverview
The Canuck Trading Indicator is a versatile, overlay-based technical analysis tool designed to assist traders in identifying potential trading opportunities across various timeframes and market conditions. By combining multiple technical indicators—such as RSI, Bollinger Bands, EMAs, VWAP, MACD, Stochastic RSI, ADX, HMA, and candlestick patterns—the indicator provides clear visual signals for bullish and bearish entries, breakouts, long-term trends, and options strategies like cash-secured puts, straddles/strangles, iron condors, and short squeezes. It also incorporates 20-day and 200-day SMAs to detect Golden/Death Crosses and price positioning relative to these moving averages. A dynamic table displays key metrics, and customizable alerts help traders stay informed of market conditions.
Key Features
Multi-Timeframe Adaptability: Automatically adjusts parameters (e.g., ATR multiplier, ADX period, HMA length) based on the chart's timeframe (minute, hourly, daily, weekly, monthly) for optimal performance.
Comprehensive Signal Generation: Identifies short-term entries, breakouts, long-term bullish trends, and options strategies using a combination of momentum, trend, volatility, and candlestick patterns.
Candlestick Pattern Detection: Recognizes bullish/bearish engulfing, hammer, shooting star, doji, and strong candles for precise entry/exit signals.
Moving Average Analysis: Plots 20-day and 200-day SMAs, detects Golden/Death Crosses, and evaluates price position relative to these averages.
Dynamic Table: Displays real-time metrics, including zone status (bullish, bearish, neutral), RSI, MACD, Stochastic RSI, short/long-term trends, candlestick patterns, ADX, ROC, VWAP slope, and MA positioning.
Customizable Alerts: Over 20 alert conditions for entries, exits, overbought/oversold warnings, and MA crosses, with actionable messages including ticker, price, and suggested strategies.
Visual Clarity: Uses distinct shapes, colors, and sizes to plot signals (e.g., green triangles for bullish entries, red triangles for bearish entries) and overlays key levels like EMA, VWAP, Bollinger Bands, support/resistance, and HMA.
Options Strategy Signals: Suggests opportunities for selling cash-secured puts, straddles/strangles, iron condors, and capitalizing on short squeezes.
How to Use
Add to Chart: Apply the indicator to any TradingView chart by selecting "Canuck Trading Indicator" from the Pine Script library.
Interpret Signals:
Bullish Signals: Green triangles (short-term entry), lime diamonds (breakout), blue circles (long-term entry).
Bearish Signals: Red triangles (short-term entry), maroon diamonds (breakout).
Options Strategies: Purple squares (cash-secured puts), yellow circles (straddles/strangles), orange crosses (iron condors), white arrows (short squeezes).
Exits: X-cross shapes in corresponding colors indicate exit signals.
Monitor: Gray circles suggest holding cash or monitoring for setups.
Review Table: Check the top-right table for real-time metrics, including zone status, RSI, MACD, trends, and MA positioning.
Set Alerts: Configure alerts for specific signals (e.g., "Short-Term Bullish Entry" or "Golden Cross") to receive notifications via TradingView.
Adjust Inputs: Customize input parameters (e.g., RSI period, EMA length, ATR period) to suit your trading style or market conditions.
Input Parameters
The indicator offers a wide range of customizable inputs to fine-tune its behavior:
RSI Period (default: 14): Length for RSI calculation.
RSI Bullish Low/High (default: 35/70): RSI thresholds for bullish signals.
RSI Bearish High (default: 65): RSI threshold for bearish signals.
EMA Period (default: 15): Main EMA length (15 for day trading, 50 for swing).
Short/Long EMA Length (default: 3/20): For momentum oscillator.
T3 Smoothing Length (default: 5): Smooths momentum signals.
Long-Term EMA/RSI Length (default: 20/15): For long-term trend analysis.
Support/Resistance Lookback (default: 5): Periods for support/resistance levels.
MACD Fast/Slow/Signal (default: 12/26/9): MACD parameters.
Bollinger Bands Period/StdDev (default: 15/2): BB settings.
Stochastic RSI Period/Smoothing (default: 14/3/3): Stochastic RSI settings.
Uptrend/Short-Term/Long-Term Lookback (default: 2/2/5): Candles for trend detection.
ATR Period (default: 14): For volatility and price targets.
VWAP Sensitivity (default: 0.1%): Threshold for VWAP-based signals.
Volume Oscillator Period (default: 14): For volume surge detection.
Pattern Detection Threshold (default: 0.3%): Sensitivity for candlestick patterns.
ROC Period (default: 3): Rate of change for momentum.
VWAP Slope Period (default: 5): For VWAP trend analysis.
TradingView Publishing Compliance
Originality: The Canuck Trading Indicator is an original script, combining multiple technical indicators and custom logic to provide unique trading signals. It does not replicate existing public scripts.
No Guaranteed Profits: This indicator is a tool for technical analysis and does not guarantee profits. Trading involves risks, and users should conduct their own research and risk management.
Clear Instructions: The description and usage guide are detailed and accessible, ensuring users understand how to apply the indicator effectively.
No External Dependencies: The script uses only built-in Pine Script functions (e.g., ta.rsi, ta.ema, ta.vwap) and requires no external libraries or data sources.
Performance: The script is optimized for performance, using efficient calculations and adaptive parameters to minimize lag on various timeframes.
Visual Clarity: Signals are plotted with distinct shapes and colors, and the table provides a concise summary of market conditions, enhancing usability.
Limitations and Risks
Market Conditions: The indicator may generate false signals in choppy or low-liquidity markets. Always confirm signals with additional analysis.
Timeframe Sensitivity: Performance varies by timeframe; test settings on your preferred chart (e.g., 5-minute for day trading, daily for swing trading).
Risk Management: Use stop-losses and position sizing to manage risk, as suggested in alert messages (e.g., "Stop -20%").
Options Trading: Options strategies (e.g., straddles, iron condors) carry unique risks; consult a financial advisor before trading.
Feedback and Support
For questions, suggestions, or bug reports, please leave a comment on the TradingView script page or contact the author via TradingView. Your feedback helps improve the indicator for the community.
Disclaimer
The Canuck Trading Indicator is provided for educational and informational purposes only. It is not financial advice. Trading involves significant risks, and past performance is not indicative of future results. Always perform your own due diligence and consult a qualified financial advisor before making trading decisions.

ORB-HL1. Opening Range Detection
Automatically calculates the high and low of the first 15 minutes after the selected session opens.
Supported sessions:
New York (Futures): 08:30–08:45 EST
New York (Equities): 09:30–09:45 EST
London: 03:00–03:15 GMT
Asia: 19:00–19:15 JST
Plots ORB high/low lines for the rest of the day.
2. Breakout Signals
Highlights the first valid breakout above or below the ORB range on the:
5-minute timeframe
15-minute timeframe
Green arrows = breakout up (long)
Red arrows = breakout down (short)
3. 1-Minute Projection
When a breakout is confirmed on a higher timeframe (5m or 15m), a projection label (e.g., "5m", "15m") appears on the 1-minute chart.
Purple label = 5m breakout
Teal label = 15m breakout
Helps you confirm momentum in real time while on the 1-minute chart.
4. Trailing Stop System
Uses ATR to create an adaptive trailing stop after breakout.
Turns green when price is above stop (bullish), red when below (bearish).
Optional Buy / Sell signal labels appear on crossover events.
5. Session High/Low Visualization
Tracks and displays the previous session’s High and Low for:
Tokyo
London
New York
Lines extend into the current session to act as S/R reference.
Labels like "NY High", "Asia Low" are placed at the end of each line.
6. Alerts
Built-in alerts for:
First 5m or 15m breakout (long/short)
Trailing stop Buy/Sell crossover
7. Customization Options
Turn session H/L lines on/off per session
Customize projection visibility
Adjust ATR period and sensitivity
Set how far each session line extends using bar offsets

Camarilla Pivot Plays█ OVERVIEW
This indicator implements the Camarilla Pivot Points levels and a system for suggesting particular plays. It only calculates and shows the 3rd, 4th, and 6th levels, as these are the only ones used by the system. In total, there are 12 possible plays, grouped into two groups of six. The algorithm constantly evaluates conditions for entering and exiting the plays and indicates them in real time, also triggering user-configurable alerts.
█ CREDITS
The Camarilla pivot plays are defined in a strategy developed by Thor Young, and the whole system is explained in his book "A Complete Day Trading System" . The indicator is published with his permission, and he is a user of it. The book is not necessary in order to understand and use the indicator; this description contains sufficient information to use it effectively.
█ FEATURES
Automatically draws plays, suggesting an entry, stop-loss, and maximum target
User can set alerts on chosen ticker to call these plays, even when not currently viewing them
Highly configurable via many options
Works for US/European stocks and US futures (at least)
Works correctly on both RTH and ETH charts
Automatically switches between RTH and ETH data
Optionally also shows the "other" set of pivots (RTH vs ETH data)
Configurable behaviour in the pre-market, not active in the post-market
Configurable sensitivity of the play detection algorithm
Can also show weekly and monthly Camarilla pivots
Well-documented options tooltips
Sensible defaults which are suitable for immediate use
Well-documented and high-quality open-source code for those who are interested
█ HOW TO USE
The defaults work well; at a minimum, just add the indicator and watch the plays being called. To avoid having to watch securities, by selecting the three dots next to the indicator name, you can set an alert on the indicator and choose to be alerted on play entry or exit events—or both. The following diagram shows several plays activated in the past (with the "Show past plays" option selected).
By default, the indicator draws plays 5 days back; this can be changed up to 20 days. The labels can be shifted left/right using the "label offset" option to avoid overlapping with other labels in this indicator or those of another indicator.
An information box at the top-right of the chart shows:
The data currently in use for the main pivots. This can switch in the pre-market if the H/L range exceeds the previous day's H/L, and if it does, you will see that switch at the time that it happens
Whether the current day's pivots are in a higher or lower range compared to the previous day's. This is based on the RTH close, so large moves in the post-market won't be reflected (there is an advanced option to change this)
The width of the value relationship in the current day compared to the previous day
The currently active play. If multiple plays are active in parallel, only the last activated one is shown
The resistance pivots are all drawn in the same colour (red by default), as are the support pivots (green by default). You can change the resistance and support colours, but it is not possible to have different colours for different levels of the same kind. Plays will always use the correct colour, drawing over the pivots. For example, R4 is red by default, but if a play treats R4 as a support, then the play will draw a green line (by default) over the red R4 line, thereby hiding it while the play is active.
There are a few advanced parameters; leave these as default unless you really know what they do. Please note the script is complicated—it does a lot. You might need to wait a few seconds while it (re)calculates on new tickers or when changing options. Give it time when first loading or changing options!
█ CONCEPTS
The indicator is focused around daily Camarilla pivots and implements 12 possible plays: 6 when in a higher range, 6 when in a lower range. The plays are labelled by two letters—the first indicates the range, the second indicates the play—as shown in this diagram:
The pivots can be calculated using only RTH (Regular Trading Hours) data, or ETH (Extended Trading Hours) data, which includes the pre-market and post-market. The indicator implements logic to automatically choose the correct data, based on the rules defined by the strategy. This is user-overridable. With the default options, ETH will be used when the H/L range in the previous day's post-market or current day's pre-market exceeds that of the previous day's regular market. In auto mode, the chosen pivots are considered the main pivots for that day and are the ones used for play evaluation. The "other" pivots can also be shown—"other" here meaning using ETH data when the main pivots use RTH data, and vice versa.
When displaying plays in the pre-market, since the RTH open is not yet known (and that value is needed to evaluate play pre-conditions), the pre-market open is used as a proxy for the RTH open. After the regular market opens, the correct RTH open is used to evaluate play conditions.
█ NOTE FOR FUTURES
Futures always use full ETH data in auto mode. Users may, however, wish to use the option "Always use RTH close," which uses the 3 p.m. Central Time (CME/Chicago) as a basis for the close in the pivot calculations (instead of the 4 p.m. actual close).
Futures don't officially have a pre-market or post-market like equities. Let's take ES on CME as an example (CME is in Chicago, so all times are Central Time, i.e., 1 hour behind Eastern Time). It trades from 17:00 Sunday to 16:00 Friday, with a daily pause between 16:00 and 17:00. However, most of the trading activity is done between 08:30 and 15:00 (Central), which you can tell from the volume spikes at those times, and this coincides with NYSE/NASDAQ regular hours (09:30–16:00 Eastern). So we define a pseudo-pre-market from 17:00 the previous day to 08:30 on the current day, then a pseudo-regular market from 08:30 to 15:00, then a pseudo-post-market from 15:00 to 16:00.
The indicator then works exactly the same as with equities—all the options behave the same, just with different session times defined for the pre-, regular, and post-market, with "RTH" meaning just the regular market and "ETH" meaning all three. The only difference from equities is that the auto calculation mode always uses ETH instead of switching based on ETH range compared to RTH range. This is so users who just leave all the defaults are not confused by auto-switching of the calculation mode; normally you'll want the pivots based on all the (ETH) data. However, both "Force RTH" and "Use RTH close with ETH data" work the same as with equities—so if, in the calculations, you really want to only use RTH data, or use all ETH H/L data but use the RTH close (at 15:00), you can.
█ LIMITATIONS
The pivots are very close to those shown in DAS Trader Pro. They are not to-the-cent exact, but within a few cents. The reasons are:
TradingView uses real-time data from CBOE One, so doesn't have access to full exchange data (unless you pay for it in TradingView), and
the close/high/low are taken from the intraday timeframe you are currently viewing, not daily data—which are very close, but often not exactly the same. For example, the high on the daily timeframe may differ slightly from the daily high you'll see on an intraday timeframe.
I have occasionally seen larger than a few cents differences in the pivots between these and DAS Trader Pro—this is always due to differences in data, for example a big spike in the data in TradingView but not in DAS Trader Pro, or vice versa. The more traded the stock is, the less the difference tends to be. Highly traded stocks are usually within a few cents. Less traded stocks may be more (for example, 30¢ difference in R4 is the highest I've seen). If it bothers you, official NYSE/NASDAQ data in TradingView is quite inexpensive (but even that doesn't make the 8am candle identical).
The 6th Camarilla level does not have a standard definition and may not match the level shown on other platforms. It does match the definition used by DAS Trader Pro.
The indicator is an intraday indicator (despite also being able to show weekly and monthly pivots on an intraday chart). It deactivates on a daily timeframe and higher. It is untested on sub-minute timeframes; you may encounter runtime errors on these due to various historical data referencing issues. Also, the play detection algorithm would likely be unpredictable on sub-minute timeframes. Therefore, sub-minute timeframes are formally unsupported.
The indicator was developed and tested for US/European stocks and US futures. It may or may not work as intended for stocks and futures in different locations. It does not work for other security types (e.g., crypto), where I have no evidence that the strategy has any relevance.

Liquid Pulse Liquid Pulse by Dskyz (DAFE) Trading Systems
Liquid Pulse is a trading algo built by Dskyz (DAFE) Trading Systems for futures markets like NQ1!, designed to snag high-probability trades with tight risk control. it fuses a confluence system—VWAP, MACD, ADX, volume, and liquidity sweeps—with a trade scoring setup, daily limits, and VIX pauses to dodge wild volatility. visuals include simple signals, VWAP bands, and a dashboard with stats.
Core Components for Liquid Pulse
Volume Sensitivity (volumeSensitivity) controls how much volume spikes matter for entries. options: 'Low', 'Medium', 'High' default: 'High' (catches small spikes, good for active markets) tweak it: 'Low' for calm markets, 'High' for chaos.
MACD Speed (macdSpeed) sets the MACD’s pace for momentum. options: 'Fast', 'Medium', 'Slow' default: 'Medium' (solid balance) tweak it: 'Fast' for scalping, 'Slow' for swings.
Daily Trade Limit (dailyTradeLimit) caps trades per day to keep risk in check. range: 1 to 30 default: 20 tweak it: 5-10 for safety, 20-30 for action.
Number of Contracts (numContracts) sets position size. range: 1 to 20 default: 4 tweak it: up for big accounts, down for small.
VIX Pause Level (vixPauseLevel) stops trading if VIX gets too hot. range: 10 to 80 default: 39.0 tweak it: 30 to avoid volatility, 50 to ride it.
Min Confluence Conditions (minConditions) sets how many signals must align. range: 1 to 5 default: 2 tweak it: 3-4 for strict, 1-2 for more trades.
Min Trade Score (Longs/Shorts) (minTradeScoreLongs/minTradeScoreShorts) filters trade quality. longs range: 0 to 100 default: 73 shorts range: 0 to 100 default: 75 tweak it: 80-90 for quality, 60-70 for volume.
Liquidity Sweep Strength (sweepStrength) gauges breakouts. range: 0.1 to 1.0 default: 0.5 tweak it: 0.7-1.0 for strong moves, 0.3-0.5 for small.
ADX Trend Threshold (adxTrendThreshold) confirms trends. range: 10 to 100 default: 41 tweak it: 40-50 for trends, 30-35 for weak ones.
ADX Chop Threshold (adxChopThreshold) avoids chop. range: 5 to 50 default: 20 tweak it: 15-20 to dodge chop, 25-30 to loosen.
VWAP Timeframe (vwapTimeframe) sets VWAP period. options: '15', '30', '60', '240', 'D' default: '60' (1-hour) tweak it: 60 for day, 240 for swing, D for long.
Take Profit Ticks (Longs/Shorts) (takeProfitTicksLongs/takeProfitTicksShorts) sets profit targets. longs range: 5 to 100 default: 25.0 shorts range: 5 to 100 default: 20.0 tweak it: 30-50 for trends, 10-20 for chop.
Max Profit Ticks (maxProfitTicks) caps max gain. range: 10 to 200 default: 60.0 tweak it: 80-100 for big moves, 40-60 for tight.
Min Profit Ticks to Trail (minProfitTicksTrail) triggers trailing. range: 1 to 50 default: 7.0 tweak it: 10-15 for big gains, 5-7 for quick locks.
Trailing Stop Ticks (trailTicks) sets trail distance. range: 1 to 50 default: 5.0 tweak it: 8-10 for room, 3-5 for fast locks.
Trailing Offset Ticks (trailOffsetTicks) sets trail offset. range: 1 to 20 default: 2.0 tweak it: 1-2 for tight, 5-10 for loose.
ATR Period (atrPeriod) measures volatility. range: 5 to 50 default: 9 tweak it: 14-20 for smooth, 5-9 for reactive.
Hardcoded Settings volLookback: 30 ('Low'), 20 ('Medium'), 11 ('High') volThreshold: 1.5 ('Low'), 1.8 ('Medium'), 2 ('High') swingLen: 5
Execution Logic Overview trades trigger when confluence conditions align, entering long or short with set position sizes. exits use dynamic take-profits, trailing stops after a profit threshold, hard stops via ATR, and a time stop after 100 bars.
Features Multi-Signal Confluence: needs VWAP, MACD, volume, sweeps, and ADX to line up.
Risk Control: ATR-based stops (capped 15 ticks), take-profits (scaled by volatility), and trails.
Market Filters: VIX pause, ADX trend/chop checks, volatility gates. Dashboard: shows scores, VIX, ADX, P/L, win %, streak.
Visuals Simple signals (green up triangles for longs, red down for shorts) and VWAP bands with glow. info table (bottom right) with MACD momentum. dashboard (top right) with stats.
Chart and Backtest:
NQ1! futures, 5-minute chart. works best in trending, volatile conditions. tweak inputs for other markets—test thoroughly.
Backtesting: NQ1! Frame: Jan 19, 2025, 09:00 — May 02, 2025, 16:00 Slippage: 3 Commission: $4.60
Fee Typical Range (per side, per contract)
CME Exchange $1.14 – $1.20
Clearing $0.10 – $0.30
NFA Regulatory $0.02
Firm/Broker Commis. $0.25 – $0.80 (retail prop)
TOTAL $1.60 – $2.30 per side
Round Turn: (enter+exit) = $3.20 – $4.60 per contract
Disclaimer this is for education only. past results don’t predict future wins. trading’s risky—only use money you can lose. backtest and validate before going live. (expect moderators to nitpick some random chart symbol rule—i’ll fix and repost if they pull it.)
About the Author Dskyz (DAFE) Trading Systems crafts killer trading algos. Liquid Pulse is pure research and grit, built for smart, bold trading. Use it with discipline. Use it with clarity. Trade smarter. I’ll keep dropping badass strategies ‘til i build a brand or someone signs me up.
2025 Created by Dskyz, powered by DAFE Trading Systems. Trade smart, trade bold.

C&B Auto MK5C&B Auto MK5.2ema BullBear
Overview
The C&B Auto MK5.2ema BullBear is a versatile Pine Script indicator designed to help traders identify bullish and bearish market conditions across various timeframes. It combines Exponential Moving Averages (EMAs), Relative Strength Index (RSI), Average True Range (ATR), and customizable time filters to generate actionable signals. The indicator overlays on the price chart, displaying EMAs, a dynamic cloud, scaled RSI levels, bull/bear signals, and market condition labels, making it suitable for swing trading, day trading, or scalping in trending or volatile markets.
What It Does
This indicator generates bull and bear signals based on the interaction of two EMAs, filtered by RSI thresholds, ATR-based volatility, a 50/200 EMA trend filter, and user-defined time windows. It adapts to market volatility by adjusting EMA lengths and RSI thresholds. A dynamic cloud highlights trend direction or neutral zones, with candlestick coloring in neutral conditions. Market condition labels (current and historical) provide real-time trend and volatility context, displayed above the chart.
How It Works
The indicator uses the following components:
EMAs: Two EMAs (short and long) are calculated on a user-selected timeframe (1, 5, 15, 30, or 60 minutes). Their crossover or crossunder triggers potential bull/bear signals. EMA lengths adjust based on volatility (e.g., 10/20 for volatile markets, 5/10 for non-volatile).
Dynamic Cloud: The area between the EMAs forms a cloud, colored green for bullish trends, red for bearish trends, or a user-defined color (default yellow) for neutral zones (when EMAs are close, determined by an ATR-based threshold). Users can widen the cloud for visibility.
RSI Filter: RSI is scaled to price levels and plotted on the chart (optional). Signals are filtered to ensure RSI is within volatility-adjusted bull/bear thresholds and not in overbought/oversold zones.
ATR Volatility Filter: An optional filter ensures signals occur during sufficient volatility (ATR(14) > SMA(ATR, 20)).
50/200 EMA Trend Filter: An optional filter restricts bull signals to bullish trends (50 EMA > 200 EMA) and bear signals to bearish trends (50 EMA < 200 EMA).
Time Filter: Signals are restricted to a user-defined UTC time window (default 9:00–15:00), aligning with active trading sessions.
Market Condition Labels: Labels above the chart display the current trend (Bullish, Bearish, Neutral) and optionally volatility (e.g., “Bullish Volatile”). Up to two historical labels persist for a user-defined number of bars (default 5) to show recent trend changes.
Visual Aids: Bull signals appear as green triangles/labels below the bar, bear signals as red triangles/labels above. Candlesticks in neutral zones are colored (default yellow).
The indicator ensures compatibility with standard chart types (e.g., candlestick or bar charts) to produce realistic signals, avoiding non-standard types like Heikin Ashi or Renko.
How to Use It
Add to Chart: Apply the indicator to a candlestick or bar chart on TradingView.
Configure Settings:
Timeframe: Choose a timeframe (1, 5, 15, 30, or 60 minutes) to match your trading style.
Filters:
Enable/disable the ATR volatility filter to focus on high-volatility periods.
Enable/disable the 50/200 EMA trend filter to align signals with the broader trend.
Enable the time filter and set custom UTC hours/minutes (default 9:00–15:00).
Cloud Settings: Adjust the cloud width, neutral zone threshold, color, and transparency.
EMA Colors: Use default trend-based colors or set custom colors for short/long EMAs.
RSI Display: Toggle the scaled RSI and its thresholds, with customizable colors.
Signal Settings: Toggle bull/bear labels and set signal colors.
Market Condition Labels: Toggle current/historical labels, include/exclude volatility, and adjust decay period.
Interpret Signals:
Bull Signal: A green triangle or “Bull” label below the bar indicates potential bullish momentum (EMA crossover, RSI above bull threshold, within time window, passing filters).
Bear Signal: A red triangle or “Bear” label above the bar indicates potential bearish momentum (EMA crossunder, RSI below bear threshold, within time window, passing filters).
Neutral Zone: Yellow candlesticks and cloud (if enabled) suggest a lack of clear trend; consider range-bound strategies or avoid trading.
Market Condition Labels: Check labels above the chart for real-time trend (Bullish, Bearish, Neutral) and volatility status to confirm market context.
Monitor Context: Use the cloud, RSI, and labels to assess trend strength and volatility before acting on signals.
Unique Features
Volatility-Adaptive EMAs: Automatically adjusts EMA lengths based on ATR to suit volatile or non-volatile markets, reducing manual configuration.
Neutral Zone Detection: Uses an ATR-based threshold to identify low-trend periods, helping traders avoid choppy markets.
Scaled RSI Visualization: Plots RSI and thresholds directly on the price chart, simplifying momentum analysis relative to price.
Flexible Time Filtering: Supports precise UTC-based trading windows, ideal for day traders targeting specific sessions.
Historical Market Labels: Displays recent trend changes (up to two) with a decay period, providing context for market shifts.
50/200 EMA Trend Filter: Aligns signals with the broader market trend, enhancing signal reliability.
Notes
Use on standard candlestick or bar charts to ensure accurate signals.
Test the indicator on a demo account to optimize settings for your market and timeframe.
Combine with other analysis (e.g., support/resistance, volume) for better decision-making.
The indicator is not a standalone system; use it as part of a broader trading strategy.
Limitations
Signals may lag in fast-moving markets due to EMA-based calculations.
Neutral zone detection may vary in extremely volatile or illiquid markets.
Time filters are UTC-based; ensure your platform’s timezone settings align.
This indicator is designed for traders seeking a customizable, trend-following tool that adapts to volatility and provides clear visual cues with robust filtering for bullish and bearish market conditions.

Green*DiamondGreen*Diamond (GD1)
Unleash Dynamic Trading Signals with Volatility and Momentum
Overview
GreenDiamond is a versatile overlay indicator designed for traders seeking actionable buy and sell signals across various markets and timeframes. Combining Volatility Bands (VB) bands, Consolidation Detection, MACD, RSI, and a unique Ribbon Wave, it highlights high-probability setups while filtering out noise. With customizable signals like Green-Yellow Buy, Pullback Sell, and Inverse Pullback Buy, plus vibrant candle and volume visuals, GreenDiamond adapts to your trading style—whether you’re scalping, day trading, or swing trading.
Key Features
Volatility Bands (VB): Plots dynamic upper and lower bands to identify breakouts or reversals, with toggleable buy/sell signals outside consolidation zones.
Consolidation Detection: Marks low-range periods to avoid choppy markets, ensuring signals fire during trending conditions.
MACD Signals: Offers flexible buy/sell conditions (e.g., cross above signal, above zero, histogram up) with RSI divergence integration for precision.
RSI Filter: Enhances signals with customizable levels (midline, oversold/overbought) and bullish divergence detection.
Ribbon Wave: Visualizes trend strength using three EMAs, colored by MACD and RSI for intuitive momentum cues.
Custom Signals: Includes Green-Yellow Buy, Pullback Sell, and Inverse Pullback Buy, with limits on consecutive signals to prevent overtrading.
Candle & Volume Styling: Blends MACD/RSI colors on candles and scales volume bars to highlight momentum spikes.
Alerts: Set up alerts for VB signals, MACD crosses, Green*Diamond signals, and custom conditions to stay on top of opportunities.
How It Works
Green*Diamond integrates multiple indicators to generate signals:
Volatility Bands: Calculates bands using a pivot SMA and standard deviation. Buy signals trigger on crossovers above the lower band, sell signals on crossunders below the upper band (if enabled).
Consolidation Filter: Suppresses signals when candle ranges are below a threshold, keeping you out of flat markets.
MACD & RSI: Combines MACD conditions (e.g., cross above signal) with RSI filters (e.g., above midline) and optional volume spikes for robust signals.
Custom Logic: Green-Yellow Buy uses MACD bullishness, Pullback Sell targets retracements, and Inverse Pullback Buy catches reversals after downmoves—all filtered to avoid consolidation.
Visuals: Ribbon Wave shows trend direction, candles blend momentum colors, and volume bars scale dynamically to confirm signals.
Settings
Volatility Bands Settings:
VB Lookback Period (20): Adjust to 10–15 for faster markets (e.g., 1-minute scalping) or 25–30 for daily charts.
Upper/Lower Band Multiplier (1.0): Increase to 1.5–2.0 for wider bands in volatile stocks like AEHL; decrease to 0.5 for calmer markets.
Show Volatility Bands: Toggle off to reduce chart clutter.
Use VB Signals: Enable for breakout-focused trades; disable to focus on Green*Diamond signals.
Consolidation Settings:
Consolidation Lookback (14): Set to 5–10 for small caps (e.g., AEHL) to catch quick consolidations; 20 for higher timeframes.
Range Threshold (0.5): Lower to 0.3 for stricter filtering in choppy markets; raise to 0.7 for looser signals.
MACD Settings:
Fast/Slow Length (12/26): Shorten to 8/21 for scalping; extend to 15/34 for swing trading.
Signal Smoothing (9): Reduce to 5 for faster signals; increase to 12 for smoother trends.
Buy/Sell Signal Options: Choose “Cross Above Signal” for classic MACD; “Histogram Up” for momentum plays.
Use RSI Div + MACD Cross: Enable for high-probability reversal signals.
RSI Settings:
RSI Period (14): Drop to 10 for 1-minute charts; raise to 20 for daily.
Filter Level (50): Set to 55 for stricter buys; 45 for sells.
Overbought/Oversold (70/30): Tighten to 65/35 for small caps; widen to 75/25 for indices.
RSI Buy/Sell Options: Select “Bullish Divergence” for reversals; “Cross Above Oversold” for momentum.
Color Settings:
Adjust bullish/bearish colors for visibility (e.g., brighter green/red for dark themes).
Border Thickness (1): Increase to 2–3 for clearer candle outlines.
Volume Settings:
Volume Average Length (20): Shorten to 10 for scalping; extend to 30 for swing trades.
Volume Multiplier (2.0): Raise to 3.0 for AEHL’s volume surges; lower to 1.5 for steady stocks.
Bar Height (10%): Increase to 15% for prominent bars; decrease to 5% to reduce clutter.
Ribbon Settings:
EMA Periods (10/20/30): Tighten to 5/10/15 for scalping; widen to 20/40/60 for trends.
Color by MACD/RSI: Disable for simpler visuals; enable for dynamic momentum cues.
Gradient Fill: Toggle on for trend clarity; off for minimalism.
Custom Signals:
Enable Green-Yellow Buy: Use for momentum confirmation; limit to 1–2 signals to avoid spam.
Pullback/Inverse Pullback % (50): Set to 30–40% for small caps; 60–70% for indices.
Max Buy Signals (1): Increase to 2–3 for active markets; keep at 1 for discipline.
Tips and Tricks
Scalping Small Caps (e.g., AEHL):
Use 1-minute charts with VB Lookback = 10, Consolidation Lookback = 5, and Volume Multiplier = 3.0 to catch $0.10–$0.20 moves.
Enable Green-Yellow Buy and Inverse Pullback Buy for quick entries; disable VB Signals to focus on Green*Diamond logic.
Pair with SMC+ green boxes (if you use them) for reversal confirmation.
Day Trading:
Try 5-minute charts with MACD Fast/Slow = 8/21 and RSI Period = 10.
Enable RSI Divergence + MACD Cross for high-probability setups; set Max Buy Signals = 2.
Watch for volume bars turning yellow to confirm entries.
Swing Trading:
Use daily charts with VB Lookback = 30, Ribbon EMAs = 20/40/60.
Enable Pullback Sell (60%) to exit after rallies; disable RSI Color for cleaner candles.
Check Ribbon Wave gradient for trend strength—bright green signals strong bulls.
Avoiding Noise:
Increase Consolidation Threshold to 0.7 on volatile days to skip false breakouts.
Disable Ribbon Wave or Volume Bars if the chart feels crowded.
Limit Max Buy Signals to 1 for disciplined trading.
Alert Setup:
In TradingView’s Alerts panel, select:
“GD Buy Signal” for standard entries.
“RSI Div + MACD Cross Buy” for reversals.
“VB Buy Signal” for breakout plays.
Set to “Once Per Bar Close” for confirmed signals; “Once Per Bar” for scalping.
Backtesting:
Replay on small caps ( Float < 5M, Price $0.50–$5) to test signals.
Focus on “GD Buy Signal” with yellow volume bars and green Ribbon Wave.
Avoid signals during gray consolidation squares unless paired with RSI Divergence.
Usage Notes
Markets: Works on stocks, forex, crypto, and indices. Best for volatile assets (e.g., small-cap stocks, BTCUSD).
Timeframes: Scalping (1–5 minutes), day trading (15–60 minutes), or swing trading (daily). Adjust settings per timeframe.
Risk Management: Combine with stop-losses (e.g., 1% risk, $0.05 below AEHL entry) and take-profits (3–5%).
Customization: Tweak inputs to match your strategy—experiment in replay to find your sweet spot.
Disclaimer
Green*Diamond is a technical tool to assist with trade identification, not a guarantee of profits. Trading involves risks, and past performance doesn’t predict future results. Always conduct your own analysis, manage risk, and test settings before live trading.
Feedback
Love Green*Diamond? Found a killer setup?

Custom NYSE Hourly Intervals (Gris Extra Claro/T)NYSE Custom Hourly Intervals (Background Shading)
Indicator Overview:
This TradingView indicator visually highlights specific hourly intervals during the NYSE trading session (9:30 AM - 4:00 PM ET) using background shading. Its purpose is to help traders easily identify these key periods while analyzing price action.
Features:
Hourly Segmentation: Clearly marks the following hourly blocks within the NYSE session:
9:30 - 10:00 ET
10:00 - 11:00 ET
11:00 - 12:00 ET
12:00 - 13:00 ET
13:00 - 14:00 ET
14:00 - 15:00 ET
15:00 - 16:00 ET
Alternating Background: Uses a subtle, alternating background pattern for visual distinction:
Transparent: Applied during the 9:30-10:00, 11:00-12:00, 13:00-14:00, and 15:00-16:00 intervals (shows your default chart background).
Very Light Gray: Applied during the 10:00-11:00, 12:00-13:00, and 14:00-15:00 intervals.
Timeframe Restriction: The background shading is active only on chart timeframes of 30 minutes or less (e.g., 30m, 15m, 5m, 1m). It will not appear on higher timeframes.
Session Restriction: Shading only occurs during the defined NYSE session hours (9:30 AM - 4:00 PM ET).
Customization: The color and transparency level of the "Very Light Gray" shading can be adjusted in the indicator's settings.
Purpose & Use Case:
This indicator is ideal for intraday traders who want a clean visual guide to track price movement within specific hourly segments of the NYSE trading day, without needing complex overlays.

ATM Option Selling StrategyATM Option Selling Strategy – Explained
This strategy is designed for intraday option selling based on the 9/15 EMA crossover, 50/80 MA trend filter, and RSI 50 level. It ensures that all trades are exited before market close (3:24 PM IST).
. Indicators Used:
9 EMA & 15 EMA → For short-term trend identification.
50 MA & 80 MA → To determine the overall trend.
RSI (14) → To confirm momentum (above or below 50 level).
2. Entry Conditions:
🔴 Sell ATM Call (CE) when:
Price is below 50 & 80 MA (Bearish trend).
9 EMA crosses below 15 EMA (Short-term trend turns bearish).
RSI is below 50 (Momentum confirms weakness).
🟢 Sell ATM Put (PE) when:
Price is above 50 & 80 MA (Bullish trend).
9 EMA crosses above 15 EMA (Short-term trend turns bullish).
RSI is above 50 (Momentum confirms strength).
3. Position Sizing & Risk Management:
Sell 375 quantity per trade (Lot size).
50-Point Stop Loss → If option premium moves against us by 50 points, exit.
50-Point Take Profit → If option premium moves in our favor by 50 points, book profit.
Exit all trades at 3:24 PM IST → No overnight positions.
4. Exit Conditions:
✅ Stop Loss or Take Profit Hits → Automatically exits based on a 50-point move.
✅ Time-Based Exit at 3:24 PM → Ensures no open positions at market close.
Why This Works?
✔ Trend Confirmation → 50/80 MA ensures we only sell options in the direction of the market trend.
✔ Momentum Confirmation → RSI prevents entering weak trades.
✔ Controlled Risk → SL and TP protect against large losses.
✔ No Overnight Risk → All trades close before market close.

IWMA - DolphinTradeBot1️⃣ WHAT IS IT ?
▪️ The Inverted Weighted Moving Average (IWMA) is the reversed version of WMA, where older prices receive higher weights, while recent prices receive lower weights. As a result, IWMA focuses more on past price movements while reducing sensitivity to new prices.
2️⃣ HOW IS IT WORK ?
🔍 To understand the IWMA(Inverted Weighted Moving Average) indicator, let's first look at how WMA (Weighted Moving Average) is calculated.
LET’S SAY WE SELECTED A LENGTH OF 5, AND OUR CURRENT CLOSING VALUES ARE .
▪️ WMA Calculation Method
When calculating WMA, the most recent price gets the highest weight, while the oldest price gets the lowest weight.
The Calculation is ;
( 10 ×1)+( 12 ×2)+( 21 ×3)+( 24 ×4)+( 38 ×5) = 10+24+63+96+190 = 383
1+2+3+4+5 = 15
WMA = 383/15 ≈ 25.53
WMA = ta.wma(close,5) = 25.53
▪️ IWMA Calculation Method
The Inverted Weighted Moving Average (IWMA) is the reversed version of WMA, where older prices receive higher weights, while recent prices receive lower weights. As a result, IWMA focuses more on past price movements while reducing sensitivity to new prices.
The Calculation is ;
( 10 ×5)+( 12 ×4)+( 21 ×3)+( 24 ×2)+( 38 ×1) = 50+48+63+48+38 = 247
1+2+3+4+5 = 15
IWMA = 247/15 ≈ 16.46
IWMA = iwma(close,5) = 16.46
3️⃣ SETTINGS
in the indicator's settings, you can change the length and source used for calculation.
With the default settings, when you first add the indicator, only the iwma will be visible. However, to observe how much it differs from the normal wma calculation, you can enable the "show wma" option to see both indicators with the same settings or you can enable the Show Signals to see IWMA and WMA crossover signals .
4️⃣ 💡 SOME IDEAS
You can use the indicator for support and resistance level analysis or trend analysis and reversal detection with short and long moving averages like regular moving averages.
Another option is to consider whether the iwma is above or below the normal wma or to evaluate the crossovers between wma and iwma.

Mogwai Method with RSI and EMA - BTCUSD 15mThis is a custom TradingView indicator designed for trading Bitcoin (BTCUSD) on a 15-minute timeframe. It’s based on the Mogwai Method—a mean-reversion strategy—enhanced with the Relative Strength Index (RSI) for momentum confirmation. The indicator generates buy and sell signals, visualized as green and red triangle arrows on the chart, to help identify potential entry and exit points in the volatile cryptocurrency market.
Components
Bollinger Bands (BB):
Purpose: Identifies overextended price movements, signaling potential reversions to the mean.
Parameters:
Length: 20 periods (standard for mean-reversion).
Multiplier: 2.2 (slightly wider than the default 2.0 to suit BTCUSD’s volatility).
Role:
Buy signal when price drops below the lower band (oversold).
Sell signal when price rises above the upper band (overbought).
Relative Strength Index (RSI):
Purpose: Confirms momentum to filter out false signals from Bollinger Bands.
Parameters:
Length: 14 periods (classic setting, effective for crypto).
Overbought Level: 70 (price may be overextended upward).
Oversold Level: 30 (price may be overextended downward).
Role:
Buy signal requires RSI < 30 (oversold).
Sell signal requires RSI > 70 (overbought).
Exponential Moving Averages (EMAs) (Plotted but not currently in signal logic):
Purpose: Provides trend context (included in the script for visualization, optional for signal filtering).
Parameters:
Fast EMA: 9 periods (short-term trend).
Slow EMA: 50 periods (longer-term trend).
Role: Can be re-added to filter signals (e.g., buy only when Fast EMA > Slow EMA).
Signals (Triangles):
Buy Signal: Green upward triangle below the bar when price is below the lower Bollinger Band and RSI is below 30.
Sell Signal: Red downward triangle above the bar when price is above the upper Bollinger Band and RSI is above 70.
How It Works
The indicator combines Bollinger Bands and RSI to spot mean-reversion opportunities:
Buy Condition: Price breaks below the lower Bollinger Band (indicating oversold conditions), and RSI confirms this with a reading below 30.
Sell Condition: Price breaks above the upper Bollinger Band (indicating overbought conditions), and RSI confirms this with a reading above 70.
The strategy assumes that extreme price movements in BTCUSD will often revert to the mean, especially in choppy or ranging markets.
Visual Elements
Green Upward Triangles: Appear below the candlestick to indicate a buy signal.
Red Downward Triangles: Appear above the candlestick to indicate a sell signal.
Bollinger Bands: Gray lines (upper, middle, lower) plotted for reference.
EMAs: Blue (Fast) and Orange (Slow) lines for trend visualization.
How to Use the Indicator
Setup
Open TradingView:
Log into TradingView and select a BTCUSD chart from a supported exchange (e.g., Binance, Coinbase, Bitfinex).
Set Timeframe:
Switch the chart to a 15-minute timeframe (15m).
Add the Indicator:
Open the Pine Editor (bottom panel in TradingView).
Copy and paste the script provided.
Click “Add to Chart” to apply it.
Verify Display:
You should see Bollinger Bands (gray), Fast EMA (blue), Slow EMA (orange), and buy/sell triangles when conditions are met.
Trading Guidelines
Buy Signal (Green Triangle Below Bar):
What It Means: Price is oversold, potentially ready to bounce back toward the Bollinger Band middle line.
Action:
Enter a long position (buy BTCUSD).
Set a take-profit near the middle Bollinger Band (bb_middle) or a resistance level.
Place a stop-loss 1-2% below the entry (or based on ATR, e.g., ta.atr(14) * 2).
Best Context: Works well in ranging markets; avoid during strong downtrends.
Sell Signal (Red Triangle Above Bar):
What It Means: Price is overbought, potentially ready to drop back toward the middle line.
Action:
Enter a short position (sell BTCUSD) or exit a long position.
Set a take-profit near the middle Bollinger Band or a support level.
Place a stop-loss 1-2% above the entry.
Best Context: Effective in ranging markets; avoid during strong uptrends.
Trend Filter (Optional):
To reduce false signals in trending markets, you can modify the script:
Add and ema_fast > ema_slow to the buy condition (only buy in uptrends).
Add and ema_fast < ema_slow to the sell condition (only sell in downtrends).
Check the Fast EMA (blue) vs. Slow EMA (orange) alignment visually.
Tips for BTCUSD on 15-Minute Charts
Volatility: BTCUSD can be erratic. If signals are too frequent, increase bb_mult (e.g., to 2.5) or adjust RSI levels (e.g., 75/25).
Confirmation: Use volume spikes or candlestick patterns (e.g., doji, engulfing) to confirm signals.
Time of Day: Mean-reversion works best during low-volume periods (e.g., Asian session in crypto).
Backtesting: Use TradingView’s Strategy Tester (convert to a strategy by adding entry/exit logic) to evaluate performance with historical BTCUSD data up to March 13, 2025.
Risk Management
Position Size: Risk no more than 1-2% of your account per trade.
Stop Losses: Always use stops to protect against BTCUSD’s sudden moves.
Avoid Overtrading: Wait for clear signals; don’t force trades in choppy or unclear conditions.
Example Scenario
Chart: BTCUSD, 15-minute timeframe.
Buy Signal: Price drops to $58,000, below the lower Bollinger Band, RSI at 28. A green triangle appears.
Action: Buy at $58,000, target $59,000 (middle BB), stop at $57,500.
Sell Signal: Price rises to $60,500, above the upper Bollinger Band, RSI at 72. A red triangle appears.
Action: Sell at $60,500, target $59,500 (middle BB), stop at $61,000.
This indicator is tailored for mean-reversion trading on BTCUSD. Let me know if you’d like to tweak it further (e.g., add filters, alerts, or alternative indicators)!

MTF Moving Averages (only EMA)MTF Moving Averages (only EMA)
This script provides a Multi-Timeframe (MTF) Exponential Moving Average (EMA) indicator for traders to visualize multiple EMAs across different timeframes directly on a single chart.
The indicator dynamically calculates and plots up to four EMAs per timeframe (15-minute, 30-minute, 1-hour, and Daily) with user-defined lengths, offering valuable insight into price trends and potential entry or exit points.
Key Features:
Multiple Timeframe Support: The script allows you to view EMAs from different timeframes simultaneously. This is especially useful for traders who follow trends across different timeframes to make more informed decisions.
Customizable Lengths: For each timeframe, the lengths of the EMAs are fully customizable. You can adjust the length of up to four EMAs per timeframe to suit your strategy.
EMA Calculation: The Exponential Moving Average (EMA) is used, which gives more weight to recent prices and reacts faster to price changes compared to the simple moving average (SMA).
Timeframe Flexibility: The indicator supports the following timeframes:
15-minute: Ideal for short-term traders and scalpers.
30-minute: For intraday trading with a slightly longer perspective.
1-hour: Suitable for swing traders and those who prefer a more medium-term view.
Daily: Great for longer-term trend-following strategies.
Interactive and User-Friendly: You can toggle the visibility of each EMA on each timeframe, allowing you to choose exactly which EMAs you wish to display, depending on your trading strategy.
Color-Coded for Clarity: The script uses distinct colors for each EMA on the chart:
Blue: EMA1
Green: EMA2
Red: EMA3
Purple: EMA4
Line Width Customization: Each plotted EMA line has a customizable width for better visual clarity.
Use Case:
Traders who use multiple timeframes for analysis (e.g., those using the "multi-timeframe analysis" technique) will find this script particularly useful. For example, a trader may look at the 15-minute chart to catch short-term movements, the 30-minute chart for intraday trends, the 1-hour chart for swing positions, and the Daily chart for identifying the overarching market trend. The script enables them to view the EMAs for all these timeframes in one glance without having to manually switch between them.
By observing the relationships between EMAs across multiple timeframes, traders can gain valuable insights into market conditions such as:
Crossovers: When a shorter-term EMA crosses above or below a longer-term EMA, it can signal a potential trend reversal or continuation.
Trend Strength: Multiple EMAs in alignment across different timeframes can indicate strong trend strength.
Support and Resistance: EMAs can act as dynamic support and resistance levels, guiding traders on price action levels to watch for potential price reversals.
Instructions:
Enable/Disable EMAs: Toggle on or off the EMAs for each timeframe (15-min, 30-min, 1-hour, Daily) using the script’s settings.
Adjust EMA Lengths: Change the default lengths for each EMA to match your preferred settings for different timeframes.
Monitor Key Levels: Watch how price interacts with the plotted EMAs to spot potential trading signals based on your strategy.
This indicator is designed to enhance your multi-timeframe analysis and help make more informed, data-driven trading decisions.

Expiry Day Special IndicatorExpiry Day Special Indicator
The Expiry Day Special Indicator is designed to detect catalytic price action patterns that commonly occur between 9:15 AM to 10:15 AM (IST) in the Nifty & Bank Nifty markets but not limited to these specific markets. While these patterns are particularly useful on expiry days, they are not limited to expiry trading alone. They can also be applied on other trading days when similar conditions arise, making them versatile for intraday traders.
How It Works
This indicator scans for bullish and bearish price action patterns within the first trading hour and plots potential buy and sell signals based on key market structures.
• Bearish Patterns: Identifies strong rejection zones and weakness in price action to signal potential short trades.
• Bullish Patterns: Recognizes reversal formations that indicate potential long trade opportunities.
• Time Filter: The setup is valid only between 9:15 AM - 10:15 AM (IST) to focus on high-impact market moves.
Why This Indicator?
1. Specialized for Nifty & Bank Nifty – Designed specifically for Indian markets.
2. Early Trend Identification – Helps traders capture moves early in the session.
3. Works Beyond Expiry Days – Although optimized for expiry trading, it can also detect similar patterns on regular days.
📌 Note: This indicator does not provide trading advice; always use proper risk management.
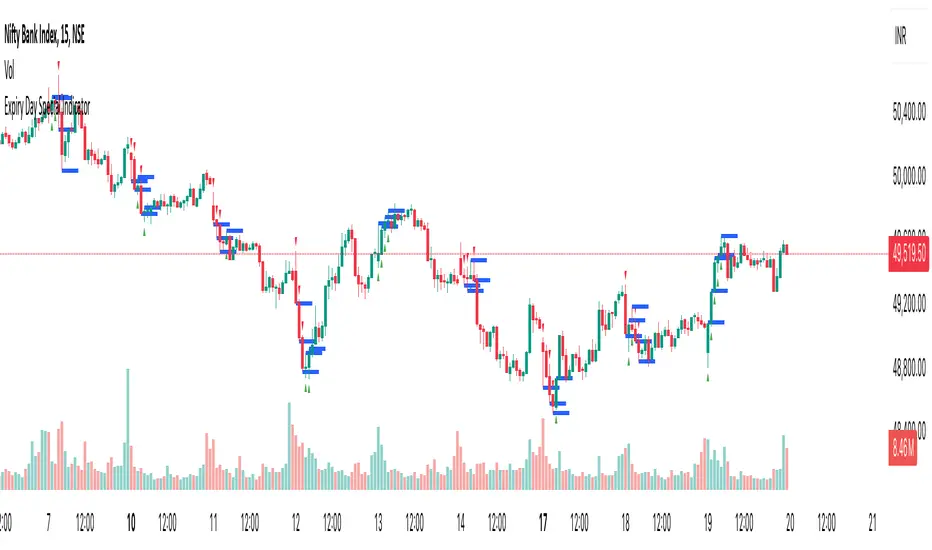
BTIC Range MidpointsThis code analyzes and displays price ranges from 15:15-15:44 ET, the Basis Trade at Index Close session.
It draws horizontal lines showing:
The high of each session
The low of each session
The midpoint (50%) of each session
Connections between different session ranges (50% points between highs and lows)
Key features include:
Works only on 15-minute timeframes or lower
Stores up to 20 days of historical sessions (configurable)
Filters out ranges too far from current price
Color-codes different session ranges
Provides customizable line styles and colors
Labels each range with identifiers
The indicator essentially helps traders identify important price levels from BTIC sessions, which could serve as potential support/resistance areas for future price action.

HMA 4H and 15M overlay Notes:
HMA Calculation: We calculate three HMAs for the 15-minute timeframe (ma1, ma2, ma3) based on the settings from your original script, but only ma3 is plotted to keep it consistent with your initial setup.
4-hour HMA: An additional HMA is calculated for the 4-hour timeframe (hma4h) using the hma3 period since it was the longest in your original setup, which might be suitable for a 4-hour chart comparison.
Plotting: Both the 15-minute ma3 and 4-hour hma4h HMAs are plotted with distinct colors for easy visual differentiation.
Timeframe Security: request.security() is used to fetch data from different timeframes. Remember, using request.security() with historical data can sometimes lead to misalignments or delayed data, especially during live trading.
This script will overlay the 15-minute HMA (using the ma3 from your settings) with a new 4-hour HMA on any chart timeframe you apply it to. Remember, if you're looking at a chart timeframe that's not 15 minutes or 4 hours, the HMAs might appear less smooth or aligned due to how Pine Script handles different timeframes.

Ticker Tape with Multiple Inputs# Ticker Tape
A customizable multi-symbol price tracker that displays real-time price information in a scrolling ticker format, similar to financial news tickers.
This indicator is inspired from Tradingciew's default tickertape indicator with changes in the way inputs are given.
### Overview
This indicator allows you to monitor up to 15 different symbols simultaneously across any supported exchanges on TradingView. It displays essential price information including current price, price change, and percentage change in an easy-to-read format at the bottom of your chart.
### Features
• Monitor up to 15 different symbols simultaneously
• Support for any exchange available on TradingView
• Real-time price updates
• Color-coded price changes (green for increase, red for decrease)
• Smooth scrolling animation (can be disabled)
• Customizable scroll speed and position offset
### Input Parameters
#### Ticker Tape Controls
• Running: Enable/disable the scrolling animation
• Offset: Adjust the starting position of the ticker tape
#### Symbol Settings
• Exchange (1-15): Enter the exchange name (e.g., NSE, BINANCE, NYSE)
• Symbol (1-15): Enter the symbol name (e.g., BANKNIFTY, RELIANCE, BTCUSDT)
### Display Format
For each symbol, the ticker shows:
1. Symbol Name
2. Current Price
3. Price Change (Absolute and Percentage)
### Example Usage
Input Settings:
Exchange 1: NSE
Symbol 1: BANKNIFTY
Exchange 2: NSE
Symbol 2: RELIANCE
The ticker tape will display:
`NIFTY BANK 46750.00 +350.45 (0.75%) | RELIANCE 2456.85 -12.40 (-0.50%) |`
### Use Cases
1. Multi-Market Monitoring: Track different markets simultaneously without switching between charts
2. Portfolio Tracking: Monitor all your positions in real-time
### Tips for Best Use
1. Group related symbols together for easier monitoring
2. Use the offset parameter to position important symbols in your preferred viewing area
3. Disable scrolling if you prefer a static display
4. Leave exchange field empty for default exchange symbols
### Notes
• Price updates occur in real-time during market hours
• Color coding helps quickly identify price direction
• The indicator adapts to any chart timeframe
• Empty input pairs are automatically skipped
### Performance Considerations
The indicator is optimized for efficiency, but monitoring too many high-frequency symbols might impact chart performance. It's recommended to use only the symbols you actively need to monitor.
Version: 2.0 Stock_Cloud
Last Updated: December 2024
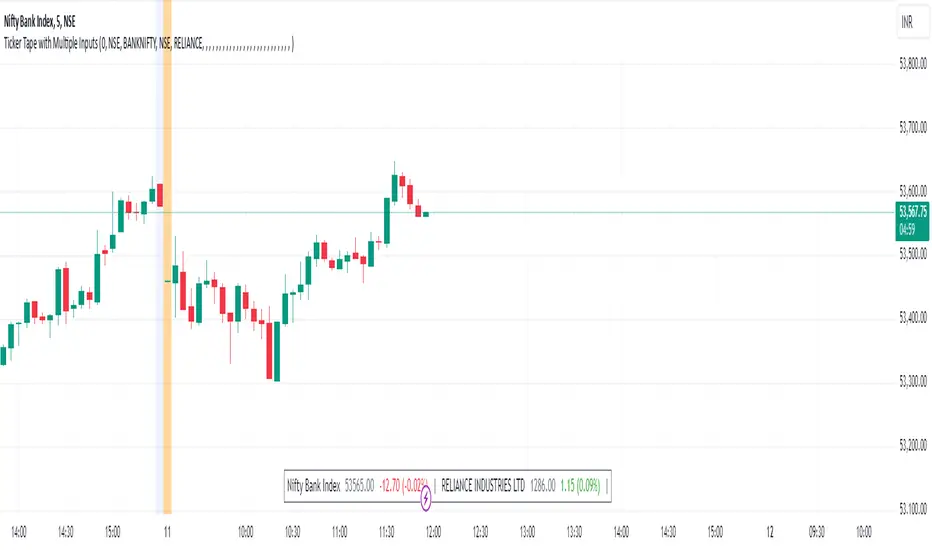
ICT Setup 03 [TradingFinder] Judas Swing NY 9:30am + CHoCH/FVG🔵 Introduction
Judas Swing is an advanced trading setup designed to identify false price movements early in the trading day. This advanced trading strategy operates on the principle that major market players, or "smart money," drive price in a certain direction during the early hours to mislead smaller traders.
This deceptive movement attracts liquidity at specific levels, allowing larger players to execute primary trades in the opposite direction, ultimately causing the price to return to its true path.
The Judas Swing setup functions within two primary time frames, tailored separately for Forex and Stock markets. In the Forex market, the setup uses the 8:15 to 8:30 AM window to identify the high and low points, followed by the 8:30 to 8:45 AM frame to execute the Judas move and identify the CISD Level break, where Order Block and Fair Value Gap (FVG) zones are subsequently detected.
In the Stock market, these time frames shift to 9:15 to 9:30 AM for identifying highs and lows and 9:30 to 9:45 AM for executing the Judas move and CISD Level break.
Concepts such as Order Block and Fair Value Gap (FVG) are crucial in this setup. An Order Block represents a chart region with a high volume of buy or sell orders placed by major financial institutions, marking significant levels where price reacts.
Fair Value Gap (FVG) refers to areas where price has moved rapidly without balance between supply and demand, highlighting zones of potential price action and future liquidity.
Bullish Setup :
Bearish Setup :
🔵 How to Use
The Judas Swing setup enables traders to pinpoint entry and exit points by utilizing Order Block and FVG concepts, helping them align with liquidity-driven moves orchestrated by smart money. This setup applies two distinct time frames for Forex and Stocks to capture early deceptive movements, offering traders optimized entry or exit moments.
🟣 Bullish Setup
In the Bullish Judas Swing setup, the first step is to identify High and Low points within the initial time frame. These levels serve as key points where price may react, forming the basis for analyzing the setup and assisting traders in anticipating future market shifts.
In the second time frame, a critical stage of the bullish setup begins. During this phase, the price may create a false break or Fake Break below the low level, a deceptive move by major players to absorb liquidity. This false move often causes smaller traders to enter positions incorrectly. After this fake-out, the price reverses upward, breaking the CISD Level, a critical point in the market structure, signaling a potential bullish trend.
Upon breaking the CISD Level and reversing upward, the indicator identifies both the Order Block and Fair Value Gap (FVG). The Order Block is an area where major players typically place large buy orders, signaling potential price support. Meanwhile, the FVG marks a region of supply-demand imbalance, signaling areas where price might react.
Ultimately, after these key zones are identified, a trader may open a buy position if the price reaches one of these critical areas—Order Block or FVG—and reacts positively. Trading at these levels enhances the chance of success due to liquidity absorption and support from smart money, marking an opportune time for entering a long position.
🟣 Bearish Setup
In the Bearish Judas Swing setup, analysis begins with marking the High and Low levels in the initial time frame. These levels serve as key zones where price could react, helping to signal possible trend reversals. Identifying these levels is essential for locating significant bearish zones and positioning traders to capitalize on downward movements.
In the second time frame, the primary bearish setup unfolds. During this stage, price may exhibit a Fake Break above the high, causing a brief move upward and misleading smaller traders into incorrect positions. After this false move, the price typically returns downward, breaking the CISD Level—a crucial bearish trend indicator.
With the CISD Level broken and a bearish trend confirmed, the indicator identifies the Order Block and Fair Value Gap (FVG). The Bearish Order Block is a region where smart money places significant sell orders, prompting a negative price reaction. The FVG denotes an area of supply-demand imbalance, signifying potential selling pressure.
When the price reaches one of these critical areas—the Bearish Order Block or FVG—and reacts downward, a trader may initiate a sell position. Entering trades at these levels, due to increased selling pressure and liquidity absorption, offers traders an advantage in profiting from price declines.
🔵 Settings
Market : The indicator allows users to choose between Forex and Stocks, automatically adjusting the time frames for the "Opening Range" and "Trading Permit" accordingly: Forex: 8:15–8:30 AM for identifying High and Low points, and 8:30–8:45 AM for capturing the Judas move and CISD Level break. Stocks: 9:15–9:30 AM for identifying High and Low points, and 9:30–9:45 AM for executing the Judas move and CISD Level break.
Refine Order Block : Enables finer adjustments to Order Block levels for more accurate price responses.
Mitigation Level OB : Allows users to set specific reaction points within an Order Block, including: Proximal: Closest level to the current price. 50% OB: Midpoint of the Order Block. Distal: Farthest level from the current price.
FVG Filter : The Judas Swing indicator includes a filter for Fair Value Gap (FVG), allowing different filtering based on FVG width: FVG Filter Type: Can be set to "Very Aggressive," "Aggressive," "Defensive," or "Very Defensive." Higher defensiveness narrows the FVG width, focusing on narrower gaps.
Mitigation Level FVG : Like the Order Block, you can set price reaction levels for FVG with options such as Proximal, 50% OB, and Distal.
CISD : The Bar Back Check option enables traders to specify the number of past candles checked for identifying the CISD Level, enhancing CISD Level accuracy on the chart.
🔵 Conclusion
The Judas Swing indicator helps traders spot reliable trading opportunities by detecting false price movements and key levels such as Order Block and FVG. With a focus on early market movements, this tool allows traders to align with major market participants, selecting entry and exit points with greater precision, thereby reducing trading risks.
Its extensive customization options enable adjustments for various market types and trading conditions, giving traders the flexibility to optimize their strategies. Based on ICT techniques and liquidity analysis, this indicator can be highly effective for those seeking precision in their entry points.
Overall, Judas Swing empowers traders to capitalize on significant market movements by leveraging price volatility. Offering precise and dependable signals, this tool presents an excellent opportunity for enhancing trading accuracy and improving performance

Exposure Oscillator (Cumulative 0 to ±100%)
Exposure Oscillator (Cumulative 0 to ±100%)
This Pine Script indicator plots an "Exposure Oscillator" on the chart, which tracks the cumulative market exposure from a range of technical buy and sell signals. The exposure is measured on a scale from -100% (maximum short exposure) to +100% (maximum long exposure), helping traders assess the strength of their position in the market. It provides an intuitive visual cue to aid decision-making for trend-following strategies.
Buy Signals (Increase Exposure Score by +10%)
Buy Signal 1 (Cross Above 21 EMA):
This signal is triggered when the price crosses above the 21-period Exponential Moving Average (EMA), where the current bar closes above the EMA21, and the previous bar closed below the EMA21. This indicates a potential upward price movement as the market shifts into a bullish trend.
buySignal1 = ta.crossover(close, ema21)
Buy Signal 2 (Trending Above 21 EMA):
This signal is triggered when the price closes above the 21-period EMA for each of the last 5 bars, indicating a sustained bullish trend. It confirms that the price is consistently above the EMA21 for a significant period.
buySignal2 = ta.barssince(close <= ema21) > 5
Buy Signal 3 (Living Above 21 EMA):
This signal is triggered when the price has closed above the 21-period EMA for each of the last 15 bars, demonstrating a strong, prolonged uptrend.
buySignal3 = ta.barssince(close <= ema21) > 15
Buy Signal 4 (Cross Above 50 SMA):
This signal is triggered when the price crosses above the 50-period Simple Moving Average (SMA), where the current bar closes above the 50 SMA, and the previous bar closed below it. It indicates a shift toward bullish momentum.
buySignal4 = ta.crossover(close, sma50)
Buy Signal 5 (Cross Above 200 SMA):
This signal is triggered when the price crosses above the 200-period Simple Moving Average (SMA), where the current bar closes above the 200 SMA, and the previous bar closed below it. This suggests a long-term bullish trend.
buySignal5 = ta.crossover(close, sma200)
Buy Signal 6 (Low Above 50 SMA):
This signal is true when the lowest price of the current bar is above the 50-period SMA, indicating strong bullish pressure as the price maintains itself above the moving average.
buySignal6 = low > sma50
Buy Signal 7 (Accumulation Day):
An accumulation day occurs when the closing price is in the upper half of the daily range (greater than 50%) and the volume is larger than the previous bar's volume, suggesting buying pressure and accumulation.
buySignal7 = (close - low) / (high - low) > 0.5 and volume > volume
Buy Signal 8 (Higher High):
This signal occurs when the current bar’s high exceeds the highest high of the previous 14 bars, indicating a breakout or strong upward momentum.
buySignal8 = high > ta.highest(high, 14)
Buy Signal 9 (Key Reversal Bar):
This signal is generated when the stock opens below the low of the previous bar but rallies to close above the previous bar’s high, signaling a potential reversal from bearish to bullish.
buySignal9 = open < low and close > high
Buy Signal 10 (Distribution Day Fall Off):
This signal is triggered when a distribution day (a day with high volume and a close near the low of the range) "falls off" the rolling 25-bar period, indicating the end of a bearish trend or selling pressure.
buySignal10 = ta.barssince(close < sma50 and close < sma50) > 25
Sell Signals (Decrease Exposure Score by -10%)
Sell Signal 1 (Cross Below 21 EMA):
This signal is triggered when the price crosses below the 21-period Exponential Moving Average (EMA), where the current bar closes below the EMA21, and the previous bar closed above it. It suggests that the market may be shifting from a bullish trend to a bearish trend.
sellSignal1 = ta.crossunder(close, ema21)
Sell Signal 2 (Trending Below 21 EMA):
This signal is triggered when the price closes below the 21-period EMA for each of the last 5 bars, indicating a sustained bearish trend.
sellSignal2 = ta.barssince(close >= ema21) > 5
Sell Signal 3 (Living Below 21 EMA):
This signal is triggered when the price has closed below the 21-period EMA for each of the last 15 bars, suggesting a strong downtrend.
sellSignal3 = ta.barssince(close >= ema21) > 15
Sell Signal 4 (Cross Below 50 SMA):
This signal is triggered when the price crosses below the 50-period Simple Moving Average (SMA), where the current bar closes below the 50 SMA, and the previous bar closed above it. It indicates the start of a bearish trend.
sellSignal4 = ta.crossunder(close, sma50)
Sell Signal 5 (Cross Below 200 SMA):
This signal is triggered when the price crosses below the 200-period Simple Moving Average (SMA), where the current bar closes below the 200 SMA, and the previous bar closed above it. It indicates a long-term bearish trend.
sellSignal5 = ta.crossunder(close, sma200)
Sell Signal 6 (High Below 50 SMA):
This signal is true when the highest price of the current bar is below the 50-period SMA, indicating weak bullishness or a potential bearish reversal.
sellSignal6 = high < sma50
Sell Signal 7 (Distribution Day):
A distribution day is identified when the closing range of a bar is less than 50% and the volume is larger than the previous bar's volume, suggesting that selling pressure is increasing.
sellSignal7 = (close - low) / (high - low) < 0.5 and volume > volume
Sell Signal 8 (Lower Low):
This signal occurs when the current bar's low is less than the lowest low of the previous 14 bars, indicating a breakdown or strong downward momentum.
sellSignal8 = low < ta.lowest(low, 14)
Sell Signal 9 (Downside Reversal Bar):
A downside reversal bar occurs when the stock opens above the previous bar's high but falls to close below the previous bar’s low, signaling a reversal from bullish to bearish.
sellSignal9 = open > high and close < low
Sell Signal 10 (Distribution Cluster):
This signal is triggered when a distribution day occurs three times in the rolling 7-bar period, indicating significant selling pressure.
sellSignal10 = ta.valuewhen((close < low) and volume > volume , 1, 7) >= 3
Theme Mode:
Users can select the theme mode (Auto, Dark, or Light) to match the chart's background or to manually choose a light or dark theme for the oscillator's appearance.
Exposure Score Calculation: The script calculates a cumulative exposure score based on a series of buy and sell signals.
Buy signals increase the exposure score, while sell signals decrease it. Each signal impacts the score by ±10%.
Signal Conditions: The buy and sell signals are derived from multiple conditions, including crossovers with moving averages (EMA21, SMA50, SMA200), trend behavior, and price/volume analysis.
Oscillator Visualization: The exposure score is visualized as a line on the chart, changing color based on whether the exposure is positive (long position) or negative (short position). It is limited to the range of -100% to +100%.
Position Type: The indicator also indicates the position type based on the exposure score, labeling it as "Long," "Short," or "Neutral."
Horizontal Lines: Reference lines at 0%, 100%, and -100% visually mark neutral, increasing long, and increasing short exposure levels.
Exposure Table: A table displays the current exposure level (in percentage) and position type ("Long," "Short," or "Neutral"), updated dynamically based on the oscillator’s value.
Inputs:
Theme Mode: Choose "Auto" to use the default chart theme, or manually select "Dark" or "Light."
Usage:
This oscillator is designed to help traders track market sentiment, gauge exposure levels, and manage risk. It can be used for long-term trend-following strategies or short-term trades based on moving average crossovers and volume analysis.
The oscillator operates in conjunction with the chart’s price action and provides a visual representation of the market’s current trend strength and exposure.
Important Considerations:
Risk Management: While the exposure score provides valuable insight, it should be combined with other risk management tools and analysis for optimal trading decisions.
Signal Sensitivity: The accuracy and effectiveness of the signals depend on market conditions and may require adjustments based on the user’s trading strategy or timeframe.
Disclaimer:
This script is for educational purposes only. Trading involves significant risk, and users should carefully evaluate all market conditions and apply appropriate risk management strategies before using this tool in live trading environments.
