EMA Crossover with RSI and DistanceEMA Crossover with RSI and Distance Strategy
This strategy combines Exponential Moving Averages (EMA) with Relative Strength Index (RSI) and distance-based conditions to generate buy, sell, and neutral signals. It is designed to help traders identify entry and exit points based on multiple technical indicators.
Key Components:
Exponential Moving Averages (EMA):
The strategy uses four EMAs: EMA 5, EMA 13, EMA 40, and EMA 55.
A buy signal (long) is triggered when EMA 5 crosses above EMA 13 and EMA 40 crosses above EMA 55.
A sell signal (short) is generated when EMA 55 crosses above EMA 40.
The distance between EMAs (5 and 13) is also important. If the current distance between EMA 5 and EMA 13 is smaller than the average distance over the last 5 candles, a neutral condition is triggered, preventing a signal even if all other conditions are met.
Relative Strength Index (RSI):
The 14-period RSI is used to determine market strength and direction.
The strategy requires RSI to be above 50 and greater than the average RSI (over the past 14 periods) for a buy signal.
If the RSI is above 60, a green signal is given, indicating a strong bullish condition, even if the EMA conditions are not fully met.
If the RSI is below 40, a red signal is given, indicating a strong bearish condition, regardless of the EMA crossover.
Distance Conditions:
The strategy calculates the distance between EMA 5 and EMA 13 on each candle and compares it to the average distance of the last 5 candles.
If the current distance between EMA 5 and EMA 13 is lower than the average of the last 5 candles, a neutral signal is triggered. This helps avoid entering a trade when the market is losing momentum.
Additionally, if the distance between EMA 40 and EMA 13 is greater than the previous distance, the previous signal is kept intact, ensuring that the trend is still strong enough for the signal to remain valid.
Signal Persistence:
Once a buy (green) or sell (red) signal is triggered, it remains intact as long as the price is closing above EMA 5 for long trades or below EMA 55 for short trades.
If the price moves below EMA 5 for long trades or above EMA 55 for short trades, the signal is recalculated based on the most recent conditions.
Signal Display:
Green Signals: Represent a strong buy signal and are shown below the candle when the RSI is above 60.
Red Signals: Represent a strong sell signal and are shown above the candle when the RSI is below 40.
Neutral Signals: Displayed when the conditions for entry are not met, specifically when the EMA distance condition is violated.
Long and Short Signals: Additional signals are shown based on the EMA crossovers and RSI conditions. These signals are plotted below the candle for long positions and above the candle for short positions.
Trade Logic:
Long Entry: Enter a long trade when EMA 5 crosses above EMA 13, EMA 40 crosses above EMA 55, and the RSI is above 50 and greater than the average RSI. Additionally, the current distance between EMA 5 and EMA 13 should be larger than the average distance of the last 5 candles.
Short Entry: Enter a short trade when EMA 55 crosses above EMA 40 and the RSI is below 40.
Neutral Condition: If the distance between EMA 5 and EMA 13 is smaller than the average distance over the last 5 candles, the strategy will not trigger a signal, even if other conditions are met.
ค้นหาในสคริปต์สำหรับ "细算江西救护车家长倒赚了四万三+-医疗花费13万(家长视频)++医保报"

13W High/Low/Fibs w/100D SMAIndicator: 13 Week High/100 Day SMA/13 Week Low with 0.382, 0.5, and 0.618 Fibonacci Levels
Description:
This indicator for TradingView, written in Pine Script version 6
It displays a table on the chart that provides a visual analysis of key price levels based on a 13-week timeframe and a 100-day Simple Moving Average (SMA).
Core Calculations:
100-Day SMA: The indicator calculates the 100-day Simple Moving Average of the closing price using daily data. The SMA is a widely used trend-following indicator.
13-Week High and Low: The indicator calculates the highest high and lowest low over the past 13 weeks using weekly data. This provides a longer-term perspective on the price range.
13-Week Fibonacci Retracement Levels: Based on the calculated 13-week high and low, the script determines the 0.382, 0.5, and 0.618 Fibonacci retracement levels.
The table includes the following information:
13W High: The highest price reached over the last 13 weeks.
100D SMA: The calculated 100-day Simple Moving Average value.
13W Low: The lowest price reached over the last 13 weeks.
Fibonacci Levels: The 0.382, 0.5, and 0.618 Fibonacci retracement levels, labeled as "↗," "|," and "↘," respectively.

Rainbow Fibonacci Momentum - SuperTrend🌈 "Rainbow Fibonacci Momentum - SuperTrend" Indicator 🌈
IMPORTANT: as this is a complex and elaborate TREND ANALYSIS on the graph, ALL INDICATORS REPAINT.
Experience the brilliance of "Rainbow Fibonacci Momentum - SuperTrend" for your technical analysis on TradingView! This versatile indicator allows you to visualize various types of Moving Averages, including Simple Moving Averages (SMA), Exponential Moving Averages (EMA), Weighted Moving Averages (WMA), Hull Moving Averages (HMA), and Volume Weighted Moving Averages (VWMA).
Each MA displayed in a unique color to create a stunning rainbow effect. This makes it easier for you to identify trends and potential trading opportunities.
Key Features:
📊 Multiple Moving Average Types - Choose from a range of moving average types to suit your analysis.
🎨 Stunning Color Gradient - Each moving average type is displayed in a unique color, creating a beautiful rainbow effect.
📉 Overlay Compatible - Use it as an overlay on your price chart for clear trend insights.
With the "Rainbow Fibonacci Momentum - SuperTrend" indicator, you'll add a burst of color to your trading routine and gain a deeper understanding of market trends.
HOW IT WORKS
MA Lines:
MA - 5: purple lines
MA - 8: blue lines
MA - 13: green lines
MA - 21: yellow lines
MA - 34: orange lines
MA - 55: red line
Header Color Indicators:
Purple: MA-5 is in uptrend on the chart
Blue: MA-5 and MA-8 are in the uptrend on the chart
Green: MA-5, MA-8 and MA-13 are in the uptrend on the chart
Yellow: MA-5, MA-8, MA-13 and MA-21 are in the uptrend on the chart
Orange: MA-5, MA-8, MA-13, MA-21 and MA-34 are in the uptrend on the chart
Red: MA-5, MA-8, MA-13, MA-21, MA-34 and MA-55 are in the uptrend on the chart
Red + White Arrow: All MAs are correctly aligned in the uptrend on the chart
Footer Color Indicators:
Purple: MA-5 is in downtrend on the chart
Blue: MA-5 and MA-8 are in the downtrend on the chart
Green: MA-5, MA-8 and MA-13 are in the downtrend on the chart
Yellow: MA-5, MA-8, MA-13 and MA-21 are in the downtrend on the chart
Orange: MA-5, MA-8, MA-13, MA-21 and MA-34 are in the downtrend on the chart
Red: MA-5, MA-8, MA-13, MA-21, MA-34 and MA-55 are in the downtrend on the chart
Red + White Arrow: All MAs are correctly aligned in the downtrend on the chart
Background Colors:
Light Red: All MAs are on the rise!
Red: All MAs are align correctly on the rise!
Light Green: All MAs are in freefall!
Green: All MAs are align correctly in freefall!
Tiny Arrows Indicators/Alerts:
Down Arrow: All MAs are in freefall!
Up Arrow: All MAs are on the rise!
Big Arrows Indicators/Alerts:
Down Arrow: All MAs are align correctly in freefall!
Up Arrow: All MAs are align correctly on the rise!

SCTI V28Indicator Overview | 指标概述
English: SCTI V28 (Smart Composite Technical Indicator) is a multi-functional composite technical analysis tool that integrates various classic technical analysis methods. It contains 7 core modules that can be flexibly configured to show or hide components based on traders' needs, suitable for various trading styles and market conditions.
中文: SCTI V28 (智能复合技术指标) 是一款多功能复合型技术分析指标,整合了多种经典技术分析工具于一体。该指标包含7大核心模块,可根据交易者的需求灵活配置显示或隐藏各个组件,适用于多种交易风格和市场环境。
Main Functional Modules | 主要功能模块
1. Basic Indicator Settings | 基础指标设置
English:
EMA Display: 13 configurable EMA lines (default shows 8/13/21/34/55/144/233/377/610/987/1597/2584 periods)
PMA Display: 11 configurable moving averages with multiple MA types (ALMA/EMA/RMA/SMA/SWMA/VWAP/VWMA/WMA)
VWAP Display: Volume Weighted Average Price indicator
Divergence Indicator: Detects divergences across 12 technical indicators
ATR Stop Loss: ATR-based stop loss lines
Volume SuperTrend AI: AI-powered super trend indicator
中文:
EMA显示:13条可配置EMA均线,默认显示8/13/21/34/55/144/233/377/610/987/1597/2584周期
PMA显示:11条可配置移动平均线,支持多种MA类型(ALMA/EMA/RMA/SMA/SWMA/VWAP/VWMA/WMA)
VWAP显示:成交量加权平均价指标
背离指标:12种技术指标的背离检测系统
ATR止损:基于ATR的止损线
Volume SuperTrend AI:基于AI预测的超级趋势指标
2. EMA Settings | EMA设置
English:
13 independent EMA lines, each configurable for visibility and period length
Default shows 21/34/55/144/233/377/610/987/1597/2584 period EMAs
Customizable colors and line widths for each EMA
中文:
13条独立EMA均线,每条均可单独配置显示/隐藏和周期长度
默认显示21/34/55/144/233/377/610/987/1597/2584周期的EMA
每条EMA可设置不同颜色和线宽
3. PMA Settings | PMA设置
English:
11 configurable moving averages, each with:
Selectable types (default EMA, options: ALMA/RMA/SMA/SWMA/VWAP/VWMA/WMA)
Independent period settings (12-1056)
Special ALMA parameters (offset and sigma)
Configurable data source and plot offset
Support for fill areas between MAs
Price lines and labels can be added
中文:
11条可配置移动平均线,每条均可:
选择不同类型(默认EMA,可选ALMA/RMA/SMA/SWMA/VWAP/VWMA/WMA)
独立设置周期长度(12-1056)
设置ALMA的特殊参数(偏移量和sigma)
配置数据源和绘图偏移
支持MA之间的填充区域显示
可添加价格线和标签
4. VWAP Settings | VWAP设置
English:
Multiple anchor period options (Session/Week/Month/Quarter/Year/Decade/Century/Earnings/Dividends/Splits)
3 configurable standard deviation bands
Option to hide on daily and higher timeframes
Configurable data source and offset settings
中文:
多种锚定周期选择(会话/周/月/季/年/十年/世纪/财报/股息/拆股)
3条可配置标准差带
可选择在日线及以上周期隐藏
支持数据源选择和偏移设置
5. Divergence Indicator Settings | 背离指标设置
English:
12 detectable indicators: MACD, MACD Histogram, RSI, Stochastic, CCI, Momentum, OBV, VWmacd, Chaikin Money Flow, MFI, Williams %R, External Indicator
4 divergence types: Regular Bullish/Bearish, Hidden Bullish/Bearish
Multiple display options: Full name/First letter/Hide indicator name
Configurable parameters: Pivot period, data source, maximum bars checked, etc.
Alert functions: Independent alerts for each divergence type
中文:
检测12种指标:MACD、MACD柱状图、RSI、随机指标、CCI、动量、OBV、VWmacd、Chaikin资金流、MFI、威廉姆斯%R、外部指标
4种背离类型:正/负常规背离,正/负隐藏背离
多种显示选项:完整名称/首字母/不显示指标名称
可配置参数:枢轴点周期、数据源、最大检查柱数等
警报功能:各类背离的独立警报
6. ATR Stop Loss Settings | ATR止损设置
English:
Configurable ATR length (default 13)
4 smoothing methods (RMA/SMA/EMA/WMA)
Adjustable multiplier (default 1.618)
Displays long and short stop loss lines
中文:
可配置ATR长度(默认13)
4种平滑方法(RMA/SMA/EMA/WMA)
可调乘数(默认1.618)
显示多头和空头止损线
7. Volume SuperTrend AI Settings | Volume SuperTrend AI设置
English:
AI Prediction:
Configurable neighbors (1-100) and data points (1-100)
Price trend length and prediction trend length settings
SuperTrend Parameters:
Length (default 3)
Factor (default 1.515)
5 MA source options (SMA/EMA/WMA/RMA/VWMA)
Signal Display:
Trend start signals (circle markers)
Trend confirmation signals (triangle markers)
6 Alerts: Various trend start and confirmation signals
中文:
AI预测功能:
可配置邻居数(1-100)和数据点数(1-100)
价格趋势长度和预测趋势长度设置
SuperTrend参数:
长度(默认3)
因子(默认1.515)
5种MA源选择(SMA/EMA/WMA/RMA/VWMA)
信号显示:
趋势开始信号(圆形标记)
趋势确认信号(三角形标记)
6种警报:各类趋势开始和确认信号
Usage Recommendations | 使用建议
English:
Trend Analysis: Use EMA/PMA combinations to determine market trends, with long-period EMAs (e.g., 144/233) as primary trend references
Divergence Trading: Look for potential reversals using price-indicator divergences
Stop Loss Management: Use ATR stop loss lines for risk management
AI Assistance: Volume SuperTrend AI provides machine learning-based trend predictions
Multiple Timeframes: Verify signals across different timeframes
中文:
趋势分析:使用EMA/PMA组合判断市场趋势,长周期EMA(如144/233)作为主要趋势参考
背离交易:结合价格与指标的背离寻找潜在反转点
止损设置:利用ATR止损线管理风险
AI辅助:Volume SuperTrend AI提供基于机器学习的趋势预测
多时间框架:建议在不同时间框架下验证信号
Parameter Configuration Tips | 参数配置技巧
English:
For short-term trading: Focus on 8-55 period EMAs and shorter divergence detection periods
For long-term investing: Use 144-2584 period EMAs with longer detection parameters
In ranging markets: Disable some EMAs, mainly rely on VWAP and divergence indicators
In trending markets: Enable more EMAs and SuperTrend AI
中文:
对于短线交易:可重点关注8-55周期的EMA和较短的背离检测周期
对于长线投资:建议使用144-2584周期的EMA和较长的检测参数
在震荡市:可关闭部分EMA,主要依靠VWAP和背离指标
在趋势市:可启用更多EMA和SuperTrend AI
Update Log | 更新日志
English:
V28 main updates:
Added Volume SuperTrend AI module
Optimized divergence detection algorithm
Added more EMA period options
Improved UI and parameter grouping
中文:
V28版本主要更新:
新增Volume SuperTrend AI模块
优化背离检测算法
增加更多EMA周期选项
改进用户界面和参数分组
Final Note | 最后说明
English: This indicator is suitable for technical traders with some experience. We recommend practicing with demo trading to familiarize yourself with all features before live trading.
中文: 该指标适合有一定经验的技术分析交易者使用,建议先通过模拟交易熟悉各项功能后再应用于实盘。

RSI Full Forecast [Titans_Invest]RSI Full Forecast
Get ready to experience the ultimate evolution of RSI-based indicators – the RSI Full Forecast, a boosted and even smarter version of the already powerful: RSI Forecast
Now featuring over 40 additional entry conditions (forecasts), this indicator redefines the way you view the market.
AI-Powered RSI Forecasting:
Using advanced linear regression with the least squares method – a solid foundation for machine learning - the RSI Full Forecast enables you to predict future RSI behavior with impressive accuracy.
But that’s not all: this new version also lets you monitor future crossovers between the RSI and the MA RSI, delivering early and strategic signals that go far beyond traditional analysis.
You’ll be able to monitor future crossovers up to 20 bars ahead, giving you an even broader and more precise view of market movements.
See the Future, Now:
• Track upcoming RSI & RSI MA crossovers in advance.
• Identify potential reversal zones before price reacts.
• Uncover statistical behavior patterns that would normally go unnoticed.
40+ Intelligent Conditions:
The new layer of conditions is designed to detect multiple high-probability scenarios based on historical patterns and predictive modeling. Each additional forecast is a window into the price's future, powered by robust mathematics and advanced algorithmic logic.
Full Customization:
All parameters can be tailored to fit your strategy – from smoothing periods to prediction sensitivity. You have complete control to turn raw data into smart decisions.
Innovative, Accurate, Unique:
This isn’t just an upgrade. It’s a quantum leap in technical analysis.
RSI Full Forecast is the first of its kind: an indicator that blends statistical analysis, machine learning, and visual design to create a true real-time predictive system.
⯁ SCIENTIFIC BASIS LINEAR REGRESSION
Linear Regression is a fundamental method of statistics and machine learning, used to model the relationship between a dependent variable y and one or more independent variables 𝑥.
The general formula for a simple linear regression is given by:
y = β₀ + β₁x + ε
β₁ = Σ((xᵢ - x̄)(yᵢ - ȳ)) / Σ((xᵢ - x̄)²)
β₀ = ȳ - β₁x̄
Where:
y = is the predicted variable (e.g. future value of RSI)
x = is the explanatory variable (e.g. time or bar index)
β0 = is the intercept (value of 𝑦 when 𝑥 = 0)
𝛽1 = is the slope of the line (rate of change)
ε = is the random error term
The goal is to estimate the coefficients 𝛽0 and 𝛽1 so as to minimize the sum of the squared errors — the so-called Random Error Method Least Squares.
⯁ LEAST SQUARES ESTIMATION
To minimize the error between predicted and observed values, we use the following formulas:
β₁ = /
β₀ = ȳ - β₁x̄
Where:
∑ = sum
x̄ = mean of x
ȳ = mean of y
x_i, y_i = individual values of the variables.
Where:
x_i and y_i are the means of the independent and dependent variables, respectively.
i ranges from 1 to n, the number of observations.
These equations guarantee the best linear unbiased estimator, according to the Gauss-Markov theorem, assuming homoscedasticity and linearity.
⯁ LINEAR REGRESSION IN MACHINE LEARNING
Linear regression is one of the cornerstones of supervised learning. Its simplicity and ability to generate accurate quantitative predictions make it essential in AI systems, predictive algorithms, time series analysis, and automated trading strategies.
By applying this model to the RSI, you are literally putting artificial intelligence at the heart of a classic indicator, bringing a new dimension to technical analysis.
⯁ VISUAL INTERPRETATION
Imagine an RSI time series like this:
Time →
RSI →
The regression line will smooth these values and extend them n periods into the future, creating a predicted trajectory based on the historical moment. This line becomes the predicted RSI, which can be crossed with the actual RSI to generate more intelligent signals.
⯁ SUMMARY OF SCIENTIFIC CONCEPTS USED
Linear Regression Models the relationship between variables using a straight line.
Least Squares Minimizes the sum of squared errors between prediction and reality.
Time Series Forecasting Estimates future values based on historical data.
Supervised Learning Trains models to predict outputs from known inputs.
Statistical Smoothing Reduces noise and reveals underlying trends.
⯁ WHY THIS INDICATOR IS REVOLUTIONARY
Scientifically-based: Based on statistical theory and mathematical inference.
Unprecedented: First public RSI with least squares predictive modeling.
Intelligent: Built with machine learning logic.
Practical: Generates forward-thinking signals.
Customizable: Flexible for any trading strategy.
⯁ CONCLUSION
By combining RSI with linear regression, this indicator allows a trader to predict market momentum, not just follow it.
RSI Full Forecast is not just an indicator — it is a scientific breakthrough in technical analysis technology.
⯁ Example of simple linear regression, which has one independent variable:
⯁ In linear regression, observations ( red ) are considered to be the result of random deviations ( green ) from an underlying relationship ( blue ) between a dependent variable ( y ) and an independent variable ( x ).
⯁ Visualizing heteroscedasticity in a scatterplot against 100 random fitted values using Matlab:
⯁ The data sets in the Anscombe's quartet are designed to have approximately the same linear regression line (as well as nearly identical means, standard deviations, and correlations) but are graphically very different. This illustrates the pitfalls of relying solely on a fitted model to understand the relationship between variables.
⯁ The result of fitting a set of data points with a quadratic function:
_________________________________________________
🔮 Linear Regression: PineScript Technical Parameters 🔮
_________________________________________________
Forecast Types:
• Flat: Assumes prices will remain the same.
• Linreg: Makes a 'Linear Regression' forecast for n periods.
Technical Information:
ta.linreg (built-in function)
Linear regression curve. A line that best fits the specified prices over a user-defined time period. It is calculated using the least squares method. The result of this function is calculated using the formula: linreg = intercept + slope * (length - 1 - offset), where intercept and slope are the values calculated using the least squares method on the source series.
Syntax:
• Function: ta.linreg()
Parameters:
• source: Source price series.
• length: Number of bars (period).
• offset: Offset.
• return: Linear regression curve.
This function has been cleverly applied to the RSI, making it capable of projecting future values based on past statistical trends.
______________________________________________________
______________________________________________________
⯁ WHAT IS THE RSI❓
The Relative Strength Index (RSI) is a technical analysis indicator developed by J. Welles Wilder. It measures the magnitude of recent price movements to evaluate overbought or oversold conditions in a market. The RSI is an oscillator that ranges from 0 to 100 and is commonly used to identify potential reversal points, as well as the strength of a trend.
⯁ HOW TO USE THE RSI❓
The RSI is calculated based on average gains and losses over a specified period (usually 14 periods). It is plotted on a scale from 0 to 100 and includes three main zones:
• Overbought: When the RSI is above 70, indicating that the asset may be overbought.
• Oversold: When the RSI is below 30, indicating that the asset may be oversold.
• Neutral Zone: Between 30 and 70, where there is no clear signal of overbought or oversold conditions.
______________________________________________________
______________________________________________________
⯁ ENTRY CONDITIONS
The conditions below are fully flexible and allow for complete customization of the signal.
______________________________________________________
______________________________________________________
🔹 CONDITIONS TO BUY 📈
______________________________________________________
• Signal Validity: The signal will remain valid for X bars .
• Signal Sequence: Configurable as AND or OR .
📈 RSI Conditions:
🔹 RSI > Upper
🔹 RSI < Upper
🔹 RSI > Lower
🔹 RSI < Lower
🔹 RSI > Middle
🔹 RSI < Middle
🔹 RSI > MA
🔹 RSI < MA
📈 MA Conditions:
🔹 MA > Upper
🔹 MA < Upper
🔹 MA > Lower
🔹 MA < Lower
📈 Crossovers:
🔹 RSI (Crossover) Upper
🔹 RSI (Crossunder) Upper
🔹 RSI (Crossover) Lower
🔹 RSI (Crossunder) Lower
🔹 RSI (Crossover) Middle
🔹 RSI (Crossunder) Middle
🔹 RSI (Crossover) MA
🔹 RSI (Crossunder) MA
🔹 MA (Crossover) Upper
🔹 MA (Crossunder) Upper
🔹 MA (Crossover) Lower
🔹 MA (Crossunder) Lower
📈 RSI Divergences:
🔹 RSI Divergence Bull
🔹 RSI Divergence Bear
📈 RSI Forecast:
🔹 RSI (Crossover) MA Forecast
🔹 RSI (Crossunder) MA Forecast
🔹 RSI Forecast 1 > MA Forecast 1
🔹 RSI Forecast 1 < MA Forecast 1
🔹 RSI Forecast 2 > MA Forecast 2
🔹 RSI Forecast 2 < MA Forecast 2
🔹 RSI Forecast 3 > MA Forecast 3
🔹 RSI Forecast 3 < MA Forecast 3
🔹 RSI Forecast 4 > MA Forecast 4
🔹 RSI Forecast 4 < MA Forecast 4
🔹 RSI Forecast 5 > MA Forecast 5
🔹 RSI Forecast 5 < MA Forecast 5
🔹 RSI Forecast 6 > MA Forecast 6
🔹 RSI Forecast 6 < MA Forecast 6
🔹 RSI Forecast 7 > MA Forecast 7
🔹 RSI Forecast 7 < MA Forecast 7
🔹 RSI Forecast 8 > MA Forecast 8
🔹 RSI Forecast 8 < MA Forecast 8
🔹 RSI Forecast 9 > MA Forecast 9
🔹 RSI Forecast 9 < MA Forecast 9
🔹 RSI Forecast 10 > MA Forecast 10
🔹 RSI Forecast 10 < MA Forecast 10
🔹 RSI Forecast 11 > MA Forecast 11
🔹 RSI Forecast 11 < MA Forecast 11
🔹 RSI Forecast 12 > MA Forecast 12
🔹 RSI Forecast 12 < MA Forecast 12
🔹 RSI Forecast 13 > MA Forecast 13
🔹 RSI Forecast 13 < MA Forecast 13
🔹 RSI Forecast 14 > MA Forecast 14
🔹 RSI Forecast 14 < MA Forecast 14
🔹 RSI Forecast 15 > MA Forecast 15
🔹 RSI Forecast 15 < MA Forecast 15
🔹 RSI Forecast 16 > MA Forecast 16
🔹 RSI Forecast 16 < MA Forecast 16
🔹 RSI Forecast 17 > MA Forecast 17
🔹 RSI Forecast 17 < MA Forecast 17
🔹 RSI Forecast 18 > MA Forecast 18
🔹 RSI Forecast 18 < MA Forecast 18
🔹 RSI Forecast 19 > MA Forecast 19
🔹 RSI Forecast 19 < MA Forecast 19
🔹 RSI Forecast 20 > MA Forecast 20
🔹 RSI Forecast 20 < MA Forecast 20
______________________________________________________
______________________________________________________
🔸 CONDITIONS TO SELL 📉
______________________________________________________
• Signal Validity: The signal will remain valid for X bars .
• Signal Sequence: Configurable as AND or OR .
📉 RSI Conditions:
🔸 RSI > Upper
🔸 RSI < Upper
🔸 RSI > Lower
🔸 RSI < Lower
🔸 RSI > Middle
🔸 RSI < Middle
🔸 RSI > MA
🔸 RSI < MA
📉 MA Conditions:
🔸 MA > Upper
🔸 MA < Upper
🔸 MA > Lower
🔸 MA < Lower
📉 Crossovers:
🔸 RSI (Crossover) Upper
🔸 RSI (Crossunder) Upper
🔸 RSI (Crossover) Lower
🔸 RSI (Crossunder) Lower
🔸 RSI (Crossover) Middle
🔸 RSI (Crossunder) Middle
🔸 RSI (Crossover) MA
🔸 RSI (Crossunder) MA
🔸 MA (Crossover) Upper
🔸 MA (Crossunder) Upper
🔸 MA (Crossover) Lower
🔸 MA (Crossunder) Lower
📉 RSI Divergences:
🔸 RSI Divergence Bull
🔸 RSI Divergence Bear
📉 RSI Forecast:
🔸 RSI (Crossover) MA Forecast
🔸 RSI (Crossunder) MA Forecast
🔸 RSI Forecast 1 > MA Forecast 1
🔸 RSI Forecast 1 < MA Forecast 1
🔸 RSI Forecast 2 > MA Forecast 2
🔸 RSI Forecast 2 < MA Forecast 2
🔸 RSI Forecast 3 > MA Forecast 3
🔸 RSI Forecast 3 < MA Forecast 3
🔸 RSI Forecast 4 > MA Forecast 4
🔸 RSI Forecast 4 < MA Forecast 4
🔸 RSI Forecast 5 > MA Forecast 5
🔸 RSI Forecast 5 < MA Forecast 5
🔸 RSI Forecast 6 > MA Forecast 6
🔸 RSI Forecast 6 < MA Forecast 6
🔸 RSI Forecast 7 > MA Forecast 7
🔸 RSI Forecast 7 < MA Forecast 7
🔸 RSI Forecast 8 > MA Forecast 8
🔸 RSI Forecast 8 < MA Forecast 8
🔸 RSI Forecast 9 > MA Forecast 9
🔸 RSI Forecast 9 < MA Forecast 9
🔸 RSI Forecast 10 > MA Forecast 10
🔸 RSI Forecast 10 < MA Forecast 10
🔸 RSI Forecast 11 > MA Forecast 11
🔸 RSI Forecast 11 < MA Forecast 11
🔸 RSI Forecast 12 > MA Forecast 12
🔸 RSI Forecast 12 < MA Forecast 12
🔸 RSI Forecast 13 > MA Forecast 13
🔸 RSI Forecast 13 < MA Forecast 13
🔸 RSI Forecast 14 > MA Forecast 14
🔸 RSI Forecast 14 < MA Forecast 14
🔸 RSI Forecast 15 > MA Forecast 15
🔸 RSI Forecast 15 < MA Forecast 15
🔸 RSI Forecast 16 > MA Forecast 16
🔸 RSI Forecast 16 < MA Forecast 16
🔸 RSI Forecast 17 > MA Forecast 17
🔸 RSI Forecast 17 < MA Forecast 17
🔸 RSI Forecast 18 > MA Forecast 18
🔸 RSI Forecast 18 < MA Forecast 18
🔸 RSI Forecast 19 > MA Forecast 19
🔸 RSI Forecast 19 < MA Forecast 19
🔸 RSI Forecast 20 > MA Forecast 20
🔸 RSI Forecast 20 < MA Forecast 20
______________________________________________________
______________________________________________________
🤖 AUTOMATION 🤖
• You can automate the BUY and SELL signals of this indicator.
______________________________________________________
______________________________________________________
⯁ UNIQUE FEATURES
______________________________________________________
Linear Regression: (Forecast)
Signal Validity: The signal will remain valid for X bars
Signal Sequence: Configurable as AND/OR
Condition Table: BUY/SELL
Condition Labels: BUY/SELL
Plot Labels in the Graph Above: BUY/SELL
Automate and Monitor Signals/Alerts: BUY/SELL
Linear Regression (Forecast)
Signal Validity: The signal will remain valid for X bars
Signal Sequence: Configurable as AND/OR
Condition Table: BUY/SELL
Condition Labels: BUY/SELL
Plot Labels in the Graph Above: BUY/SELL
Automate and Monitor Signals/Alerts: BUY/SELL
______________________________________________________
📜 SCRIPT : RSI Full Forecast
🎴 Art by : @Titans_Invest & @DiFlip
👨💻 Dev by : @Titans_Invest & @DiFlip
🎑 Titans Invest — The Wizards Without Gloves 🧤
✨ Enjoy!
______________________________________________________
o Mission 🗺
• Inspire Traders to manifest Magic in the Market.
o Vision 𐓏
• To elevate collective Energy 𐓷𐓏

Quarterly Cycle Theory with DST time AdjustedThe Quarterly Theory removes ambiguity, as it gives specific time-based reference points to look for when entering trades. Before being able to apply this theory to trading, one must first understand that time is fractal:
Yearly Quarters = 4 quarters of three months each.
Monthly Quarters = 4 quarters of one week each.
Weekly Quarters = 4 quarters of one day each (Monday - Thursday). Friday has its own specific function.
Daily Quarters = 4 quarters of 6 hours each = 4 trading sessions of a trading day.
Sessions Quarters = 4 quarters of 90 minutes each.
90 Minute Quarters = 4 quarters of 22.5 minutes each.
Yearly Cycle: Analogously to financial quarters, the year is divided in four sections of three months each:
Q1 - January, February, March.
Q2 - April, May, June (True Open, April Open).
Q3 - July, August, September.
Q4 - October, November, December.
S&P 500 E-mini Futures (daily candles) — Monthly Cycle.
Monthly Cycle: Considering that we have four weeks in a month, we start the cycle on the first month’s Monday (regardless of the calendar Day):
Q1 - Week 1: first Monday of the month.
Q2 - Week 2: second Monday of the month (True Open, Daily Candle Open Price).
Q3 - Week 3: third Monday of the month.
Q4 - Week 4: fourth Monday of the month.
S&P 500 E-mini Futures (4 hour candles) — Weekly Cycle.
Weekly Cycle: Daye determined that although the trading week is composed by 5 trading days, we should ignore Friday, and the small portion of Sunday’s price action:
Q1 - Monday.
Q2 - Tuesday (True Open, Daily Candle Open Price).
Q3 - Wednesday.
Q4 - Thursday.
S&P 500 E-mini Futures (1 hour candles) — Daily Cycle.
Daily Cycle: The Day can be broken down into 6 hour quarters. These times roughly define the sessions of the trading day, reinforcing the theory’s validity:
Q1 - 18:00 - 00:00 Asia.
Q2 - 00:00 - 06:00 London (True Open).
Q3 - 06:00 - 12:00 NY AM.
Q4 - 12:00 - 18:00 NY PM.
S&P 500 E-mini Futures (15 minute candles) — 6 Hour Cycle.
6 Hour Quarters or 90 Minute Cycle / Sessions divided into four sections of 90 minutes each (EST/EDT):
Asian Session
Q1 - 18:00 - 19:30
Q2 - 19:30 - 21:00 (True Open)
Q3 - 21:00 - 22:30
Q4 - 22:30 - 00:00
London Session
Q1 - 00:00 - 01:30
Q2 - 01:30 - 03:00 (True Open)
Q3 - 03:00 - 04:30
Q4 - 04:30 - 06:00
NY AM Session
Q1 - 06:00 - 07:30
Q2 - 07:30 - 09:00 (True Open)
Q3 - 09:00 - 10:30
Q4 - 10:30 - 12:00
NY PM Session
Q1 - 12:00 - 13:30
Q2 - 13:30 - 15:00 (True Open)
Q3 - 15:00 - 16:30
Q4 - 16:30 - 18:00
S&P 500 E-mini Futures (5 minute candles) — 90 Minute Cycle.
Micro Cycles: Dividing the 90 Minute Cycle yields 22.5 Minute Quarters, also known as Micro Sessions or Micro Quarters:
Asian Session
Q1/1 18:00:00 - 18:22:30
Q2 18:22:30 - 18:45:00
Q3 18:45:00 - 19:07:30
Q4 19:07:30 - 19:30:00
Q2/1 19:30:00 - 19:52:30 (True Session Open)
Q2/2 19:52:30 - 20:15:00
Q2/3 20:15:00 - 20:37:30
Q2/4 20:37:30 - 21:00:00
Q3/1 21:00:00 - 21:23:30
etc. 21:23:30 - 21:45:00
London Session
00:00:00 - 00:22:30 (True Daily Open)
00:22:30 - 00:45:00
00:45:00 - 01:07:30
01:07:30 - 01:30:00
01:30:00 - 01:52:30 (True Session Open)
01:52:30 - 02:15:00
02:15:00 - 02:37:30
02:37:30 - 03:00:00
03:00:00 - 03:22:30
03:22:30 - 03:45:00
03:45:00 - 04:07:30
04:07:30 - 04:30:00
04:30:00 - 04:52:30
04:52:30 - 05:15:00
05:15:00 - 05:37:30
05:37:30 - 06:00:00
New York AM Session
06:00:00 - 06:22:30
06:22:30 - 06:45:00
06:45:00 - 07:07:30
07:07:30 - 07:30:00
07:30:00 - 07:52:30 (True Session Open)
07:52:30 - 08:15:00
08:15:00 - 08:37:30
08:37:30 - 09:00:00
09:00:00 - 09:22:30
09:22:30 - 09:45:00
09:45:00 - 10:07:30
10:07:30 - 10:30:00
10:30:00 - 10:52:30
10:52:30 - 11:15:00
11:15:00 - 11:37:30
11:37:30 - 12:00:00
New York PM Session
12:00:00 - 12:22:30
12:22:30 - 12:45:00
12:45:00 - 13:07:30
13:07:30 - 13:30:00
13:30:00 - 13:52:30 (True Session Open)
13:52:30 - 14:15:00
14:15:00 - 14:37:30
14:37:30 - 15:00:00
15:00:00 - 15:22:30
15:22:30 - 15:45:00
15:45:00 - 15:37:30
15:37:30 - 16:00:00
16:00:00 - 16:22:30
16:22:30 - 16:45:00
16:45:00 - 17:07:30
17:07:30 - 18:00:00
S&P 500 E-mini Futures (30 second candles) — 22.5 Minute Cycle.

PubLibCandleTrendLibrary "PubLibCandleTrend"
candle trend, multi-part candle trend, multi-part green/red candle trend, double candle trend and multi-part double candle trend conditions for indicator and strategy development
chh()
candle higher high condition
Returns: bool
chl()
candle higher low condition
Returns: bool
clh()
candle lower high condition
Returns: bool
cll()
candle lower low condition
Returns: bool
cdt()
candle double top condition
Returns: bool
cdb()
candle double bottom condition
Returns: bool
gc()
green candle condition
Returns: bool
gchh()
green candle higher high condition
Returns: bool
gchl()
green candle higher low condition
Returns: bool
gclh()
green candle lower high condition
Returns: bool
gcll()
green candle lower low condition
Returns: bool
gcdt()
green candle double top condition
Returns: bool
gcdb()
green candle double bottom condition
Returns: bool
rc()
red candle condition
Returns: bool
rchh()
red candle higher high condition
Returns: bool
rchl()
red candle higher low condition
Returns: bool
rclh()
red candle lower high condition
Returns: bool
rcll()
red candle lower low condition
Returns: bool
rcdt()
red candle double top condition
Returns: bool
rcdb()
red candle double bottom condition
Returns: bool
chh_1p()
1-part candle higher high condition
Returns: bool
chh_2p()
2-part candle higher high condition
Returns: bool
chh_3p()
3-part candle higher high condition
Returns: bool
chh_4p()
4-part candle higher high condition
Returns: bool
chh_5p()
5-part candle higher high condition
Returns: bool
chh_6p()
6-part candle higher high condition
Returns: bool
chh_7p()
7-part candle higher high condition
Returns: bool
chh_8p()
8-part candle higher high condition
Returns: bool
chh_9p()
9-part candle higher high condition
Returns: bool
chh_10p()
10-part candle higher high condition
Returns: bool
chh_11p()
11-part candle higher high condition
Returns: bool
chh_12p()
12-part candle higher high condition
Returns: bool
chh_13p()
13-part candle higher high condition
Returns: bool
chh_14p()
14-part candle higher high condition
Returns: bool
chh_15p()
15-part candle higher high condition
Returns: bool
chh_16p()
16-part candle higher high condition
Returns: bool
chh_17p()
17-part candle higher high condition
Returns: bool
chh_18p()
18-part candle higher high condition
Returns: bool
chh_19p()
19-part candle higher high condition
Returns: bool
chh_20p()
20-part candle higher high condition
Returns: bool
chh_21p()
21-part candle higher high condition
Returns: bool
chh_22p()
22-part candle higher high condition
Returns: bool
chh_23p()
23-part candle higher high condition
Returns: bool
chh_24p()
24-part candle higher high condition
Returns: bool
chh_25p()
25-part candle higher high condition
Returns: bool
chh_26p()
26-part candle higher high condition
Returns: bool
chh_27p()
27-part candle higher high condition
Returns: bool
chh_28p()
28-part candle higher high condition
Returns: bool
chh_29p()
29-part candle higher high condition
Returns: bool
chh_30p()
30-part candle higher high condition
Returns: bool
chl_1p()
1-part candle higher low condition
Returns: bool
chl_2p()
2-part candle higher low condition
Returns: bool
chl_3p()
3-part candle higher low condition
Returns: bool
chl_4p()
4-part candle higher low condition
Returns: bool
chl_5p()
5-part candle higher low condition
Returns: bool
chl_6p()
6-part candle higher low condition
Returns: bool
chl_7p()
7-part candle higher low condition
Returns: bool
chl_8p()
8-part candle higher low condition
Returns: bool
chl_9p()
9-part candle higher low condition
Returns: bool
chl_10p()
10-part candle higher low condition
Returns: bool
chl_11p()
11-part candle higher low condition
Returns: bool
chl_12p()
12-part candle higher low condition
Returns: bool
chl_13p()
13-part candle higher low condition
Returns: bool
chl_14p()
14-part candle higher low condition
Returns: bool
chl_15p()
15-part candle higher low condition
Returns: bool
chl_16p()
16-part candle higher low condition
Returns: bool
chl_17p()
17-part candle higher low condition
Returns: bool
chl_18p()
18-part candle higher low condition
Returns: bool
chl_19p()
19-part candle higher low condition
Returns: bool
chl_20p()
20-part candle higher low condition
Returns: bool
chl_21p()
21-part candle higher low condition
Returns: bool
chl_22p()
22-part candle higher low condition
Returns: bool
chl_23p()
23-part candle higher low condition
Returns: bool
chl_24p()
24-part candle higher low condition
Returns: bool
chl_25p()
25-part candle higher low condition
Returns: bool
chl_26p()
26-part candle higher low condition
Returns: bool
chl_27p()
27-part candle higher low condition
Returns: bool
chl_28p()
28-part candle higher low condition
Returns: bool
chl_29p()
29-part candle higher low condition
Returns: bool
chl_30p()
30-part candle higher low condition
Returns: bool
clh_1p()
1-part candle lower high condition
Returns: bool
clh_2p()
2-part candle lower high condition
Returns: bool
clh_3p()
3-part candle lower high condition
Returns: bool
clh_4p()
4-part candle lower high condition
Returns: bool
clh_5p()
5-part candle lower high condition
Returns: bool
clh_6p()
6-part candle lower high condition
Returns: bool
clh_7p()
7-part candle lower high condition
Returns: bool
clh_8p()
8-part candle lower high condition
Returns: bool
clh_9p()
9-part candle lower high condition
Returns: bool
clh_10p()
10-part candle lower high condition
Returns: bool
clh_11p()
11-part candle lower high condition
Returns: bool
clh_12p()
12-part candle lower high condition
Returns: bool
clh_13p()
13-part candle lower high condition
Returns: bool
clh_14p()
14-part candle lower high condition
Returns: bool
clh_15p()
15-part candle lower high condition
Returns: bool
clh_16p()
16-part candle lower high condition
Returns: bool
clh_17p()
17-part candle lower high condition
Returns: bool
clh_18p()
18-part candle lower high condition
Returns: bool
clh_19p()
19-part candle lower high condition
Returns: bool
clh_20p()
20-part candle lower high condition
Returns: bool
clh_21p()
21-part candle lower high condition
Returns: bool
clh_22p()
22-part candle lower high condition
Returns: bool
clh_23p()
23-part candle lower high condition
Returns: bool
clh_24p()
24-part candle lower high condition
Returns: bool
clh_25p()
25-part candle lower high condition
Returns: bool
clh_26p()
26-part candle lower high condition
Returns: bool
clh_27p()
27-part candle lower high condition
Returns: bool
clh_28p()
28-part candle lower high condition
Returns: bool
clh_29p()
29-part candle lower high condition
Returns: bool
clh_30p()
30-part candle lower high condition
Returns: bool
cll_1p()
1-part candle lower low condition
Returns: bool
cll_2p()
2-part candle lower low condition
Returns: bool
cll_3p()
3-part candle lower low condition
Returns: bool
cll_4p()
4-part candle lower low condition
Returns: bool
cll_5p()
5-part candle lower low condition
Returns: bool
cll_6p()
6-part candle lower low condition
Returns: bool
cll_7p()
7-part candle lower low condition
Returns: bool
cll_8p()
8-part candle lower low condition
Returns: bool
cll_9p()
9-part candle lower low condition
Returns: bool
cll_10p()
10-part candle lower low condition
Returns: bool
cll_11p()
11-part candle lower low condition
Returns: bool
cll_12p()
12-part candle lower low condition
Returns: bool
cll_13p()
13-part candle lower low condition
Returns: bool
cll_14p()
14-part candle lower low condition
Returns: bool
cll_15p()
15-part candle lower low condition
Returns: bool
cll_16p()
16-part candle lower low condition
Returns: bool
cll_17p()
17-part candle lower low condition
Returns: bool
cll_18p()
18-part candle lower low condition
Returns: bool
cll_19p()
19-part candle lower low condition
Returns: bool
cll_20p()
20-part candle lower low condition
Returns: bool
cll_21p()
21-part candle lower low condition
Returns: bool
cll_22p()
22-part candle lower low condition
Returns: bool
cll_23p()
23-part candle lower low condition
Returns: bool
cll_24p()
24-part candle lower low condition
Returns: bool
cll_25p()
25-part candle lower low condition
Returns: bool
cll_26p()
26-part candle lower low condition
Returns: bool
cll_27p()
27-part candle lower low condition
Returns: bool
cll_28p()
28-part candle lower low condition
Returns: bool
cll_29p()
29-part candle lower low condition
Returns: bool
cll_30p()
30-part candle lower low condition
Returns: bool
gc_1p()
1-part green candle condition
Returns: bool
gc_2p()
2-part green candle condition
Returns: bool
gc_3p()
3-part green candle condition
Returns: bool
gc_4p()
4-part green candle condition
Returns: bool
gc_5p()
5-part green candle condition
Returns: bool
gc_6p()
6-part green candle condition
Returns: bool
gc_7p()
7-part green candle condition
Returns: bool
gc_8p()
8-part green candle condition
Returns: bool
gc_9p()
9-part green candle condition
Returns: bool
gc_10p()
10-part green candle condition
Returns: bool
gc_11p()
11-part green candle condition
Returns: bool
gc_12p()
12-part green candle condition
Returns: bool
gc_13p()
13-part green candle condition
Returns: bool
gc_14p()
14-part green candle condition
Returns: bool
gc_15p()
15-part green candle condition
Returns: bool
gc_16p()
16-part green candle condition
Returns: bool
gc_17p()
17-part green candle condition
Returns: bool
gc_18p()
18-part green candle condition
Returns: bool
gc_19p()
19-part green candle condition
Returns: bool
gc_20p()
20-part green candle condition
Returns: bool
gc_21p()
21-part green candle condition
Returns: bool
gc_22p()
22-part green candle condition
Returns: bool
gc_23p()
23-part green candle condition
Returns: bool
gc_24p()
24-part green candle condition
Returns: bool
gc_25p()
25-part green candle condition
Returns: bool
gc_26p()
26-part green candle condition
Returns: bool
gc_27p()
27-part green candle condition
Returns: bool
gc_28p()
28-part green candle condition
Returns: bool
gc_29p()
29-part green candle condition
Returns: bool
gc_30p()
30-part green candle condition
Returns: bool
rc_1p()
1-part red candle condition
Returns: bool
rc_2p()
2-part red candle condition
Returns: bool
rc_3p()
3-part red candle condition
Returns: bool
rc_4p()
4-part red candle condition
Returns: bool
rc_5p()
5-part red candle condition
Returns: bool
rc_6p()
6-part red candle condition
Returns: bool
rc_7p()
7-part red candle condition
Returns: bool
rc_8p()
8-part red candle condition
Returns: bool
rc_9p()
9-part red candle condition
Returns: bool
rc_10p()
10-part red candle condition
Returns: bool
rc_11p()
11-part red candle condition
Returns: bool
rc_12p()
12-part red candle condition
Returns: bool
rc_13p()
13-part red candle condition
Returns: bool
rc_14p()
14-part red candle condition
Returns: bool
rc_15p()
15-part red candle condition
Returns: bool
rc_16p()
16-part red candle condition
Returns: bool
rc_17p()
17-part red candle condition
Returns: bool
rc_18p()
18-part red candle condition
Returns: bool
rc_19p()
19-part red candle condition
Returns: bool
rc_20p()
20-part red candle condition
Returns: bool
rc_21p()
21-part red candle condition
Returns: bool
rc_22p()
22-part red candle condition
Returns: bool
rc_23p()
23-part red candle condition
Returns: bool
rc_24p()
24-part red candle condition
Returns: bool
rc_25p()
25-part red candle condition
Returns: bool
rc_26p()
26-part red candle condition
Returns: bool
rc_27p()
27-part red candle condition
Returns: bool
rc_28p()
28-part red candle condition
Returns: bool
rc_29p()
29-part red candle condition
Returns: bool
rc_30p()
30-part red candle condition
Returns: bool
cdut()
candle double uptrend condition
Returns: bool
cddt()
candle double downtrend condition
Returns: bool
cdut_1p()
1-part candle double uptrend condition
Returns: bool
cdut_2p()
2-part candle double uptrend condition
Returns: bool
cdut_3p()
3-part candle double uptrend condition
Returns: bool
cdut_4p()
4-part candle double uptrend condition
Returns: bool
cdut_5p()
5-part candle double uptrend condition
Returns: bool
cdut_6p()
6-part candle double uptrend condition
Returns: bool
cdut_7p()
7-part candle double uptrend condition
Returns: bool
cdut_8p()
8-part candle double uptrend condition
Returns: bool
cdut_9p()
9-part candle double uptrend condition
Returns: bool
cdut_10p()
10-part candle double uptrend condition
Returns: bool
cdut_11p()
11-part candle double uptrend condition
Returns: bool
cdut_12p()
12-part candle double uptrend condition
Returns: bool
cdut_13p()
13-part candle double uptrend condition
Returns: bool
cdut_14p()
14-part candle double uptrend condition
Returns: bool
cdut_15p()
15-part candle double uptrend condition
Returns: bool
cdut_16p()
16-part candle double uptrend condition
Returns: bool
cdut_17p()
17-part candle double uptrend condition
Returns: bool
cdut_18p()
18-part candle double uptrend condition
Returns: bool
cdut_19p()
19-part candle double uptrend condition
Returns: bool
cdut_20p()
20-part candle double uptrend condition
Returns: bool
cdut_21p()
21-part candle double uptrend condition
Returns: bool
cdut_22p()
22-part candle double uptrend condition
Returns: bool
cdut_23p()
23-part candle double uptrend condition
Returns: bool
cdut_24p()
24-part candle double uptrend condition
Returns: bool
cdut_25p()
25-part candle double uptrend condition
Returns: bool
cdut_26p()
26-part candle double uptrend condition
Returns: bool
cdut_27p()
27-part candle double uptrend condition
Returns: bool
cdut_28p()
28-part candle double uptrend condition
Returns: bool
cdut_29p()
29-part candle double uptrend condition
Returns: bool
cdut_30p()
30-part candle double uptrend condition
Returns: bool
cddt_1p()
1-part candle double downtrend condition
Returns: bool
cddt_2p()
2-part candle double downtrend condition
Returns: bool
cddt_3p()
3-part candle double downtrend condition
Returns: bool
cddt_4p()
4-part candle double downtrend condition
Returns: bool
cddt_5p()
5-part candle double downtrend condition
Returns: bool
cddt_6p()
6-part candle double downtrend condition
Returns: bool
cddt_7p()
7-part candle double downtrend condition
Returns: bool
cddt_8p()
8-part candle double downtrend condition
Returns: bool
cddt_9p()
9-part candle double downtrend condition
Returns: bool
cddt_10p()
10-part candle double downtrend condition
Returns: bool
cddt_11p()
11-part candle double downtrend condition
Returns: bool
cddt_12p()
12-part candle double downtrend condition
Returns: bool
cddt_13p()
13-part candle double downtrend condition
Returns: bool
cddt_14p()
14-part candle double downtrend condition
Returns: bool
cddt_15p()
15-part candle double downtrend condition
Returns: bool
cddt_16p()
16-part candle double downtrend condition
Returns: bool
cddt_17p()
17-part candle double downtrend condition
Returns: bool
cddt_18p()
18-part candle double downtrend condition
Returns: bool
cddt_19p()
19-part candle double downtrend condition
Returns: bool
cddt_20p()
20-part candle double downtrend condition
Returns: bool
cddt_21p()
21-part candle double downtrend condition
Returns: bool
cddt_22p()
22-part candle double downtrend condition
Returns: bool
cddt_23p()
23-part candle double downtrend condition
Returns: bool
cddt_24p()
24-part candle double downtrend condition
Returns: bool
cddt_25p()
25-part candle double downtrend condition
Returns: bool
cddt_26p()
26-part candle double downtrend condition
Returns: bool
cddt_27p()
27-part candle double downtrend condition
Returns: bool
cddt_28p()
28-part candle double downtrend condition
Returns: bool
cddt_29p()
29-part candle double downtrend condition
Returns: bool
cddt_30p()
30-part candle double downtrend condition
Returns: bool

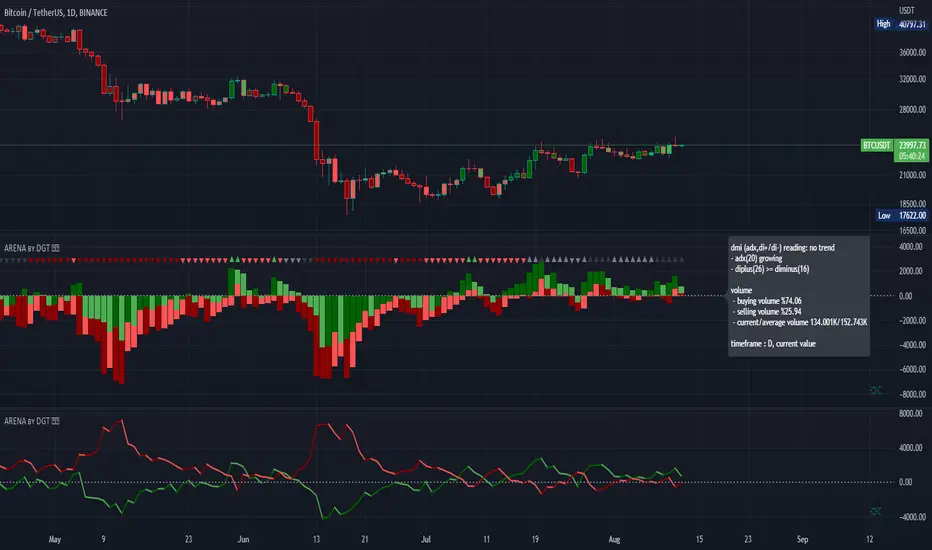
Bull vs Bear Power by DGTElder-Ray Bear and Bull Power
Dr. Alexander Elder cleverly named his first indicator Elder-Ray because of its function, which is designed to see through the market like an X-ray machine. Developed in 1989, the Elder-Ray indicator can be applied to the chart of any security and helps traders determine the strength of competing groups of bulls and bears by gazing under the surface of the markets for data that may not immediately be ascertainable from a superficial glance at prices
The Elder-Ray indicator is comprised by three elements – Bear Power, Bull Power and a 13-period Exponential Moving Average.
As the high price of any candle shows the maximum power of buyers and the low price of any candle shows the maximum power of sellers, Elder uses the 13-period EMA in order to present the average consensus of price value. Bull power shows whether buyers are capable of pushing prices above the average consensus of value. Bear power shows whether sellers are capable of pushing prices below the average consensus of value. Mathematically, Bull power is the result of subtracting the 13-period EMA from the high price of the day, and Bear power is the result of subtracting the 13-period EMA from the low price of the day.
What does this study implements
Attempts to customize interpretation of Alexander Elder's Elder-Ray Indicator (Bull and Bear Power) by
• adding additional insights to support/confirm Elder’s strategy with different indicators related with the Elder’s concept
• providing different options of visualization of the indicator
• providing smoothing capability
Other Indicators to support/confirm Elder-Ray Indicator:
Colored Directional Movement Index (CDMI) , a custom interpretation of J. Welles Wilder’s Directional Movement Index (DMI) , where :
DMI is a collection of three separate indicators ( ADX , +DI , -DI ) combined into one and measures the trend’s strength as well as its direction
CDMI is a custom interpretation of DMI which presents ( ADX , +DI , -DI ) with a color scale - representing the trend’s strength, color density - representing momentum/slope of the trend’s strength, and triangle up/down shapes - representing the trend’s direction. CDMI provides all the information in a single line with colored triangle shapes plotted on the top. DMI can provide quality information and even trading signals but it is not an easy indicator to master, whereus CDMI simplifies its usage.
Alexander Elder considers the slope of the EMA, which gives insight into the recent trend whether is up or down, and CDMI adds additional insight of verifying/confirming the trend as well as its strength
Note : educational content of how to read CDMI can be found in ideas section named as “Colored Directional Movement Index”
different usages of CDMI can be observed with studies “Candlestick Patterns in Context by DGT", “Ichimoku Colored SuperTrend + Colored DMI by DGT”, “Colored Directional Movement and Bollinger Band's Cloud by DGT”, and “Technical Analyst by DGT”
Price Convergence/Divergence , if we pay attention to mathematical formulations of bull power, bear power and price convergence/divergence (also can be expressed as price distance to its ma) we would clearly observe that price convergence/divergence is in fact the result of how the market performed based on the fact that we assume 13-period EMA is consensus of price value. Then, we may assume that the price convergence/divergence crosses of bull power, or bear power, or sum of bull and bear power could be considered as potential trading signals
Additionally, price convergence/divergence visualizes the belief that prices high above the moving average or low below it are likely to be remedied in the future by a reverse price movement
Alternatively, Least Squares Moving Average of Price Convergence/Divergence (also known as Linear Regression Curve) can be plotted instead of Price Convergence/Divergence which can be considered as a smoothed version of Price Convergence/Divergence
Note : different usages of Price Convergence/Divergence can be observed with studies “Trading Psychology - Fear & Greed Index by DGT”, “Price Distance to its MA by DGT”, “P-MACD by DGT”, where “Price Distance to its MA by DGT” can also be considered as educational content which includes an article of a research carried on the topic
Options of Visualization
Bull and Bear Power plotted as two separate
• histograms
• lines
• bands
Sum of Bull and Bear Power plotted as single
• histogram
• line
• band
Others
Price Convergence/Divergence displayed as Line
CDMI is displayed as single colored line of triangle shapes, where triangle shapes displays direction of the trend (triangle up represents bull and triangle down represent bear), colors of CDMI displays the strength of the trend (green – strong bullish, red – strong bearish, gray – no trend, yellow – week trend)
In general with this study, color densities also have a meaning and aims to displays if the value of the indicator is falling or growing, darker colors displays more intense move comparing to light one
Note : band's upper and lower levels are calculated by using standard deviation build-in function with multiply factor of 0.236 Fibonacci’s ratio (just a number for our case, no any meaning)
Smoothing
No smoothing is applied by default but the capability is added in case Price Convergence/Divergence Line is assumed to be used as a signal line it will be worth smoothing the bear, bull or sum of bear and bull power indicators
Interpreting Elder-Ray Indicator, according to Dr. Alexander Elder
Bull Power should remain positive in normal circumstances, while Bear Power should remain negative in normal circumstances. In case the Bull Power indicator enters into negative territory, this implies that sellers have overcome buyers and control the market. In case the Bear Power indicator enters into positive territory, this indicates that buyers have overcome sellers and control the market. A trader should not go long at times when the Bear Power indicator is positive and he/she should not go short at times when the Bull Power indicator is negative.
13-period EMAs slope can be used in order to identify the direction of the major trend. According to Elder, the most reliable buy signals are generated, when there is a bullish divergence between the Bear Power indicator and the price (Bear Power forms higher lows, while the market forms lower lows). The most reliable sell signals are generated, when there is a bearish divergence between the Bull Power indicator and the price (Bull Power forms lower highs, while the market forms higher highs).
There are four basic conditions, required to go long or short, with the use of the Elder-Ray method alone.
In order to go long:
1. The market is in a bull trend, as indicated by the 13-period EMA
2. Bear Power is in negative territory, but increasing
3. The most recent Bull Power top is higher than its prior top
4. Bear Power is going up from a bullish divergence
The last two conditions are optional that fine-tune the buying decision
In order to go short:
1. The market is in a bear trend, as indicated by the 13-period EMA
2. Bull Power is in positive territory, but falling
3. The most recent Bear Power bottom is lower than its prior bottom
4. Bull Power is falling from a bearish divergence
The last two conditions are optional, they provide a stronger signal for shorting but they are not absolutely essential
If a trader is willing to add to his/her position, he/she needs to:
1. add to his/her long position, when the Bear Power falls below zero and then climbs back into positive territory
2. add to his/her short position, when the Bull Power increases above zero and then drops back into negative territory.
note : terminology of the definitions used herein are as per TV dictionary
Trading success is all about following your trading strategy and the indicators should fit within your trading strategy, and not to be traded upon solely
Disclaimer : The script is for informational and educational purposes only. Use of the script does not constitute professional and/or financial advice. You alone have the sole responsibility of evaluating the script output and risks associated with the use of the script. In exchange for using the script, you agree not to hold dgtrd TradingView user liable for any possible claim for damages arising from any decision you make based on use of the script
CCT StochRSI [LazyBear]CCT StochRSI, proposed by Steve Karnish of Cedar Creek Trading, reconfigures classic StochRSI using custom parameters and smoothing.
There are 6 types supported.
Common formula:
(rsi - lowest(rsi, x)) / (highest(rsi, y) - lowest(rsi, z)) * 100
Smoothed formula:
ema(common formula result, len)
Settings (values for x/y/z/len in the above formulae):
Type 1: RSILength=21, x=8, y=13, z=13, len=N/A
Type 2: RSILength=21, x=21, y=21, z=21, len=N/A
Type 3: RSILength=14, x=14, y=14, z=14, len=N/A
Type 4: RSILength=21, x=13, y=8, z=13, len=8
Type 5: RSILength=5, x=5, y=5, z=5, len=3
Type 6: RSILength=13, x=13, y=13, z=13, len=3
Apart from these default types, this also supports user-specified custom type (select "0" for "Type" option).
All 6 types:
CCT StochRSI compared against normal StochRSI:
List of my public indicators: bit.ly
List of my app-store indicators: blog.tradingview.com

ADR% Extension Levels from SMA 50I created this indicator inspired by RealSimpleAriel (a swing trader I recommend following on X) who does not buy stocks extended beyond 4 ADR% from the 50 SMA and uses extensions from the 50 SMA at 7-8-9-10-11-12-13 ADR% to take profits with a 20% position trimming.
RealSimpleAriel's strategy (as I understood it):
-> Focuses on leading stocks from leading groups and industries, i.e., those that have grown the most in the last 1-3-6 months (see on Finviz groups and then select sector-industry).
-> Targets stocks with the best technical setup for a breakout, above the 200 SMA in a bear market and above both the 50 SMA and 200 SMA in a bull market, selecting those with growing Earnings and Sales.
-> Buys stocks on breakout with a stop loss set at the day's low of the breakout and ensures they are not extended beyond 4 ADR% from the 50 SMA.
-> 3-5 day momentum burst: After a breakout, takes profits by selling 1/2 or 1/3 of the position after a 3-5 day upward move.
-> 20% trimming on extension from the 50 SMA: At 7 ADR% (ADR% calculated over 20 days) extension from the 50 SMA, takes profits by selling 20% of the remaining position. Continues to trim 20% of the remaining position based on the stock price extension from the 50 SMA, calculated using the 20-period ADR%, thus trimming 20% at 8-9-10-11 ADR% extension from the 50 SMA. Upon reaching 12-13 ADR% extension from the 50 SMA, considers the stock overextended, closes the remaining position, and evaluates a short.
-> Trailing stop with ascending SMA: Uses a chosen SMA (10, 20, or 50) as the definitive stop loss for the position, depending on the stock's movement speed (preferring larger SMAs for slower-moving stocks or for long-term theses). If the stock's closing price falls below the chosen SMA, the entire position is closed.
In summary:
-->Buy a breakout using the day's low of the breakout as the stop loss (this stop loss is the most critical).
--> Do not buy stocks extended beyond 4 ADR% from the 50 SMA.
--> Sell 1/2 or 1/3 of the position after 3-5 days of upward movement.
--> Trim 20% of the position at each 7-8-9-10-11-12-13 ADR% extension from the 50 SMA.
--> Close the entire position if the breakout fails and the day's low of the breakout is reached.
--> Close the entire position if the price, during the rise, falls below a chosen SMA (10, 20, or 50, depending on your preference).
--> Definitively close the position if it reaches 12-13 ADR% extension from the 50 SMA.
I used Grok from X to create this indicator. I am not a programmer, but based on the ADR% I use, it works.
Below is Grok from X's description of the indicator:
Script Description
The script is a custom indicator for TradingView that displays extension levels based on ADR% relative to the 50-period Simple Moving Average (SMA). Below is a detailed description of its features, structure, and behavior:
1. Purpose of the Indicator
Name: "ADR% Extension Levels from SMA 50".
Objective: Draw horizontal blue lines above and below the 50-period SMA, corresponding to specific ADR% multiples (4, 7, 8, 9, 10, 11, 12, 13). These levels represent potential price extension zones based on the average daily percentage volatility.
Overlay: The indicator is overlaid on the price chart (overlay=true), so the lines and SMA appear directly on the price graph.
2. Configurable Inputs
The indicator allows users to customize parameters through TradingView settings:
SMA Length (smaLength):
Default: 50 periods.
Description: Specifies the number of periods for calculating the Simple Moving Average (SMA). The 50-period SMA serves as the reference point for extension levels.
Constraint: Minimum 1 period.
ADR% Length (adrLength):
Default: 20 periods.
Description: Specifies the number of days to calculate the moving average of the daily high/low ratio, used to determine ADR%.
Constraint: Minimum 1 period.
Scale Factor (scaleFactor):
Default: 1.0.
Description: An optional multiplier to adjust the distance of extension levels from the SMA. Useful if levels are too close or too far due to an overly small or large ADR%.
Constraint: Minimum 0.1, increments of 0.1.
Tooltip: "Adjust if levels are too close or far from SMA".
3. Main Calculations
50-period SMA:
Calculated with ta.sma(close, smaLength) using the closing price (close).
Serves as the central line around which extension levels are drawn.
ADR% (Average Daily Range Percentage):
Formula: 100 * (ta.sma(dhigh / dlow, adrLength) - 1).
Details:
dhigh and dlow are the daily high and low prices, obtained via request.security(syminfo.tickerid, "D", high/low) to ensure data is daily-based, regardless of the chart's timeframe.
The dhigh / dlow ratio represents the daily percentage change.
The simple moving average (ta.sma) of this ratio over 20 days (adrLength) is subtracted by 1 and multiplied by 100 to obtain ADR% as a percentage.
The result is multiplied by scaleFactor for manual adjustments.
Extension Levels:
Defined as ADR% multiples: 4, 7, 8, 9, 10, 11, 12, 13.
Stored in an array (levels) for easy iteration.
For each level, prices above and below the SMA are calculated as:
Above: sma50 * (1 + (level * adrPercent / 100))
Below: sma50 * (1 - (level * adrPercent / 100))
These represent price levels corresponding to a percentage change from the SMA equal to level * ADR%.
4. Visualization
Horizontal Blue Lines:
For each level (4, 7, 8, 9, 10, 11, 12, 13 ADR%), two lines are drawn:
One above the SMA (e.g., +4 ADR%).
One below the SMA (e.g., -4 ADR%).
Color: Blue (color.blue).
Style: Solid (style=line.style_solid).
Management:
Each level has dedicated variables for upper and lower lines (e.g., upperLine1, lowerLine1 for 4 ADR%).
Previous lines are deleted with line.delete before drawing new ones to avoid overlaps.
Lines are updated at each bar with line.new(bar_index , level, bar_index, level), covering the range from the previous bar to the current one.
Labels:
Displayed only on the last bar (barstate.islast) to avoid clutter.
For each level, two labels:
Above: E.g., "4 ADR%", positioned above the upper line (style=label.style_label_down).
Below: E.g., "-4 ADR%", positioned below the lower line (style=label.style_label_up).
Color: Blue background, white text.
50-period SMA:
Drawn as a gray line (color.gray) for visual reference.
Diagnostics:
ADR% Plot: ADR% is plotted in the status line (orange, histogram style) to verify the value.
ADR% Label: A label on the last bar near the SMA shows the exact ADR% value (e.g., "ADR%: 2.34%"), with a gray background and white text.
5. Behavior
Dynamic Updating:
Lines update with each new bar to reflect new SMA 50 and ADR% values.
Since ADR% uses daily data ("D"), it remains constant within the same day but changes day-to-day.
Visibility Across All Bars:
Lines are drawn on every bar, not just the last one, ensuring visibility on historical data as well.
Adaptability:
The scaleFactor allows level adjustments if ADR% is too small (e.g., for low-volatility symbols) or too large (e.g., for cryptocurrencies).
Compatibility:
Works on any timeframe since ADR% is calculated from daily data.
Suitable for symbols with varying volatility (e.g., stocks, forex, cryptocurrencies).
6. Intended Use
Technical Analysis: Extension levels represent significant price zones based on average daily volatility. They can be used to:
Identify potential price targets (e.g., take profit at +7 ADR%).
Assess support/resistance zones (e.g., -4 ADR% as support).
Measure price extension relative to the 50 SMA.
Trading: Useful for strategies based on breakouts or mean reversion, where ADR% levels indicate reversal or continuation points.
Debugging: Labels and ADR% plot help verify that values align with the symbol’s volatility.
7. Limitations
Dependence on Daily Data: ADR% is based on daily dhigh/dlow, so it may not reflect intraday volatility on short timeframes (e.g., 1 minute).
Extreme ADR% Values: For low-volatility symbols (e.g., bonds) or high-volatility symbols (e.g., meme stocks), ADR% may require adjustments via scaleFactor.
Graphical Load: Drawing 16 lines (8 upper, 8 lower) on every bar may slow the chart for very long historical periods, though line management is optimized.
ADR% Formula: The formula 100 * (sma(dhigh/dlow, Length) - 1) may produce different values compared to other ADR% definitions (e.g., (high - low) / close * 100), so users should be aware of the context.
8. Visual Example
On a chart of a stock like TSLA (daily timeframe):
The 50 SMA is a gray line tracking the average trend.
Assuming an ADR% of 3%:
At +4 ADR% (12%), a blue line appears at sma50 * 1.12.
At -4 ADR% (-12%), a blue line appears at sma50 * 0.88.
Other lines appear at ±7, ±8, ±9, ±10, ±11, ±12, ±13 ADR%.
On the last bar, labels show "4 ADR%", "-4 ADR%", etc., and a gray label shows "ADR%: 3.00%".
ADR% is visible in the status line as an orange histogram.
9. Code: Technical Structure
Language: Pine Script @version=5.
Inputs: Three configurable parameters (smaLength, adrLength, scaleFactor).
Calculations:
SMA: ta.sma(close, smaLength).
ADR%: 100 * (ta.sma(dhigh / dlow, adrLength) - 1) * scaleFactor.
Levels: sma50 * (1 ± (level * adrPercent / 100)).
Graphics:
Lines: Created with line.new, deleted with line.delete to avoid overlaps.
Labels: Created with label.new only on the last bar.
Plots: plot(sma50) for the SMA, plot(adrPercent) for debugging.
Optimization: Uses dedicated variables for each line (e.g., upperLine1, lowerLine1) for clear management and to respect TradingView’s graphical object limits.
10. Possible Improvements
Option to show lines only on the last bar: Would reduce visual clutter.
Customizable line styles: Allow users to choose color or style (e.g., dashed).
Alert for anomalous ADR%: A message if ADR% is too small or large.
Dynamic levels: Allow users to specify ADR% multiples via input.
Optimization for short timeframes: Adapt ADR% for intraday timeframes.
Conclusion
The script creates a visual indicator that helps traders identify price extension levels based on daily volatility (ADR%) relative to the 50 SMA. It is robust, configurable, and includes debugging tools (ADR% plot and labels) to verify values. The ADR% formula based on dhigh/dlow

[blackcat] L3 Projected Magic-9 SequenceOVERVIEW
The L3 Projected Magic-9 Sequence indicator is a sophisticated tool designed to help traders identify potential trend reversals through a unique sequence of price movements. By calculating projected highs and lows based on previous bar conditions, this script provides valuable insights into possible future market directions. It plots these key levels on the chart and highlights specific sequential patterns that often precede significant reversals, offering traders a visual advantage in their decision-making process 📈💡.
FEATURES
Projections: Calculates and plots projected highs and lows based on intricate conditions derived from previous bars' open, close, high, and low prices. These projections serve as dynamic support and resistance levels, helping traders anticipate potential turning points in the market 📊.
Sequential Patterns:
Identifies various sequential patterns known as "Magic" sequences, such as Magic-9 and Magic-13.
Labels these sequences directly on the chart for easy identification: 5, 6, 7, 8, 9, 12, 13 for both bullish and bearish trends.
Provides additional labels when these sequences align with projected highs or lows, enhancing the reliability of the signal 🏷️.
Differentiates between trend and sideways phases using the Magic-9 Project Range. Traditional sequences generating buy and sell signals of 9 and 13 during sideways swings are displayed indistinguishably from other numbers. However, the 9 and 13 generated by breakouts are highlighted with red and green labels for better visibility 🚦.
Project Range Adjustment:
The Project Range is automatically adjusted by Multiple Time Frame (MTF).
A higher cycle is selected as the baseline of the Project Range based on the current operating cycle, ensuring adaptability to varying market conditions ⏳.
Customization:
Offers customizable colors for plotted lines and labels, allowing users to tailor the appearance to their preferences 🎨.
Adjustable settings for lookback periods and other parameters to fine-tune the indicator according to individual trading styles.
Automatic Timeframe Selection:
Automatically selects the most suitable timeframe for data fetching, ensuring optimal performance across different chart intervals ⏳.
Ensures compatibility with various trading strategies, whether short-term intraday or long-term positional trading.
HOW TO USE
Adding the Indicator:
Open your TradingView platform and navigate to the chart where you want to apply the indicator.
Click on the "Indicators" button at the top of the screen and search for L3 Projected Magic-9 Sequence.
Select the indicator from the list and add it to your chart.
Understanding Projections:
Once added, observe the plotted projected highs and lows on your chart.
These lines represent anticipated support and resistance levels based on complex calculations involving previous bar data.
Identifying Sequential Patterns:
Look for labels such as 5, 6, 7, 8, 9, 12, and 13 appearing on the chart.
These labels signify specific sequential patterns that often precede market reversals.
Pay special attention to labels that include arrows (e.g., 9▼, 13▲), indicating alignment with projected highs or lows.
Note the differentiation between trend and sideways phases:
During sideways swings, traditional sequences generating buy and sell signals of 9 and 13 are displayed indistinguishably from other numbers.
Breakout-generated 9 and 13 are highlighted with red and green labels for clear identification.
Combining with Other Tools:
While the L3 Projected Magic-9 Sequence offers powerful insights, it is essential to combine its signals with other technical analysis tools.
Use moving averages, volume indicators, or candlestick patterns to confirm the validity of the identified sequences before executing trades.
LIMITATIONS
Market Conditions: The indicator performs best in trending markets but may generate false signals during periods of consolidation or range-bound movement 🌐.
Complexity: Due to its reliance on specific sequential patterns, some traders might find the concept challenging to grasp initially. Thorough testing and understanding are crucial before deploying it in live trading environments.
Data Dependency: Accurate projections depend on having sufficient historical data. Insufficient data may lead to less reliable results.
NOTES
Backtesting: Before implementing the indicator in real-time trading, conduct extensive backtesting to evaluate its effectiveness under various market conditions.
Risk Management: Always adhere to proper risk management principles, even when relying on robust indicators like this one. Set stop-loss orders and position sizes accordingly to protect your capital 🛡️.
Continuous Learning: Stay updated with the latest developments and adjustments made to the indicator by following community discussions and official updates from the author.

MACDh with divergences & impulse system (overlayed on prices)-----------------------------------------------------------------
General Description:
This indicator ( the one on the top panel above ) consists on some lines, arrows and labels drawn over the price bars/candles indicating the detection of regular divergences between price and the classic MACD histogram (shown on the low panel). This script is special because it can be adjusted to fit several criteria when trading divergences filtering them according to the "height" and "width" of the patterns. The script also includes the "extra features" Impulse System and Keltner Channels, which you will hardly find anywhere else in similar classic MACD histogram divergence indicators.
The indicator helps to find trend reversals, and it works on any market, any instrument, any timeframe, and any market condition (except against really strong trends that do not show any other sign of reversion yet).
Please take on consideration that divergences should be taken with caution.
-----------------------------------------------------------------
Definition of classic Bullish and Bearish divergences:
* Bearish divergences occur in uptrends identifying market tops. A classical or regular bearish divergence occurs when prices reach a new high and then pull back, with an oscillator (MACD histogram in this case) dropping below its zero line. Prices stabilize and rally to a higher high, but the oscillator reaches a lower peak than it did on a previous rally.
In the chart above (weekly charts of NKE, Nike, Inc.), in area X (around August 2021), NKE rallied to a new bull market high and MACD-Histogram rallied with it, rising above its previous peak and showing that bulls were extremely strong. In area Y, MACD-H fell below its centerline and at the same time prices punched below the zone between the two moving averages. In area Z, NKE rallied to a new bull market high, but the rally of MACD-H was feeble, reflecting the bulls’ weakness. Its downtick from peak Z completed a bearish divergence, giving a strong sell signal and auguring a nasty bear market.
* Bullish divergences , in the other hand, occur towards the ends of downtrends identifying market bottoms. A classical (also called regular) bullish divergence occurs when prices and an oscillator (MACD histogram in this case) both fall to a new low, rally, with the oscillator rising above its zero line, then both fall again. This time, prices drop to a lower low, but the oscillator traces a higher bottom than during its previous decline.
In the example in the chart above (weekly charts of NKE, Nike, Inc.), you see a bearish divergence that signaled the October 2022 bear market bottom, giving a strong buy signal right near the lows. In area A, NKE (weekly charts) appeared in a free fall. The record low A of MACD-H indicated that bears were extremely strong. In area B, MACD-H rallied above its centerline. Notice the brief rally of prices at that moment. In area C, NKE slid to a new bear market low, but MACD-H traced a much more shallow low. Its uptick completed a bullish divergence, giving a strong buy signal.
-----------------------------------------------------------------
Some cool features included in this indicator:
1. This indicator also includes the “ Impulse System ”. The Impulse System is based on two indicators, a 13-day exponential moving average and the MACD-Histogram, and identifies inflection points where a trend speeds up or slows down. The moving average identifies the trend, while the MACD-Histogram measures momentum. This unique indicator combination is color coded into the price bars for easy reference.
Calculation:
Green Price Bar: (13-period EMA > previous 13-period EMA) and
(MACD-Histogram > previous period's MACD-Histogram)
Red Price Bar: (13-period EMA < previous 13-period EMA) and
(MACD-Histogram < previous period's MACD-Histogram)
Price bars are colored blue when conditions for a Red Price Bar or Green Price Bar are not met. The MACD-Histogram is based on MACD(12,26,9).
The Impulse System works more like a censorship system. Green price bars show that the bulls are in control of both trend and momentum as both the 13-day EMA and MACD-Histogram are rising (you don't have permission to sell). A red price bar indicates that the bears have taken control because the 13-day EMA and MACD Histogram are falling (you don't have permission to buy). A blue price bar indicates mixed technical signals, with neither buying nor selling pressure predominating (either both buying or selling are permitted).
2. Another "extra feature" included here is the " Keltner Channels ". Keltner Channels are volatility-based envelopes set above and below an exponential moving average.
3. It were also included a couple of EMAs.
Everything can be removed from the chart any time.
-----------------------------------------------------------------
Options/adjustments for this indicator:
*Horizontal Distance (width) between two tops/bottoms criteria.
Refers to the horizontal distance between the MACH histogram peaks involved in the divergence
*Height of tops/bottoms criteria (for Histogram).
Refers to the difference/relation/vertical distance between the MACH HISTOGRAM peaks involved in the divergence: 1st Histogram Peak is X times the 2nd.
*Height/Vertical deviation of tops/bottoms criteria (for Price).
Deviation refers to the difference/relation/vertical distance between the PRICE peaks involved in the divergence.
*Plot Regular Bullish Divergences?.
*Plot Regular Bearish Divergences?.
*Delete Previous Cancelled Divergences?.
*Shows a pair of EMAs.
*Shows Keltner Channels (using ATR)
Keltner Channels are volatility-based envelopes set above and below an exponential moving average.
*This indicator also has the option to show the Impulse System over the price bars/candles.

MACDh with divergences & impulse system-----------------------------------------------------------------
General Description:
This indicator ( the one on the low panel ) is a classic MACD that also shows regular divergences between its histogram and the prices. This script is special because it can be adjusted to fit several criteria when trading divergences filtering them according to the "height" and "width" of the patterns. The script also includes the "extra feature" Impulse System, which you will hardly find anywhere else in similar classic MACD histogram divergence indicators.
The indicator helps to find trend reversals, and it works on any market, any instrument, any timeframe, and any market condition (except against really strong trends that do not show any other sign of reversion yet).
Please take on consideration that divergences should be taken with caution.
-----------------------------------------------------------------
Definition of classic Bullish and Bearish divergences:
* Bearish divergences occur in uptrends identifying market tops. A classical or regular bearish divergence occurs when prices reach a new high and then pull back, with an oscillator (MACD histogram in this case) dropping below its zero line. Prices stabilize and rally to a higher high, but the oscillator reaches a lower peak than it did on a previous rally.
In the chart above (weekly charts of NKE, Nike, Inc.), in area X (around August 2021), NKE rallied to a new bull market high and MACD-Histogram rallied with it, rising above its previous peak and showing that bulls were extremely strong. In area Y, MACD-H fell below its centerline and at the same time prices punched below the zone between the two moving averages. In area Z, NKE rallied to a new bull market high, but the rally of MACD-H was feeble, reflecting the bulls’ weakness. Its downtick from peak Z completed a bearish divergence, giving a strong sell signal and auguring a nasty bear market.
* Bullish divergences , in the other hand, occur towards the ends of downtrends identifying market bottoms. A classical (also called regular) bullish divergence occurs when prices and an oscillator (MACD histogram in this case) both fall to a new low, rally, with the oscillator rising above its zero line, then both fall again. This time, prices drop to a lower low, but the oscillator traces a higher bottom than during its previous decline.
In the example in the chart above (weekly charts of NKE, Nike, Inc.), you see a bearish divergence that signaled the October 2022 bear market bottom, giving a strong buy signal right near the lows. In area A, NKE (weekly charts) appeared in a free fall. The record low A of MACD-H indicated that bears were extremely strong. In area B, MACD-H rallied above its centerline. Notice the brief rally of prices at that moment. In area C, NKE slid to a new bear market low, but MACD-H traced a much more shallow low. Its uptick completed a bullish divergence, giving a strong buy signal.
-----------------------------------------------------------------
Extra feature: Impulse System
This indicator also includes the “ Impulse System ”. The Impulse System is based on two indicators, a 13-day exponential moving average and the MACD-Histogram, and identifies inflection points where a trend speeds up or slows down. The moving average identifies the trend, while the MACD-Histogram measures momentum. This unique indicator combination is color coded into the price bars or macd histogram bars for easy reference.
Calculation:
Green Price Bar: (13-period EMA > previous 13-period EMA) and
(MACD-Histogram > previous period's MACD-Histogram)
Red Price Bar: (13-period EMA < previous 13-period EMA) and
(MACD-Histogram < previous period's MACD-Histogram)
Histogram bars are colored blue when conditions for a Red Histogram Bar or Green Histogram Bar are not met. The MACD-Histogram is based on MACD(12,26,9).
The Impulse System works more like a censorship system. Green histogram bars show that the bulls are in control of both trend and momentum as both the 13-day EMA and MACD-Histogram are rising (you don't have permission to sell). A red histogram bar indicates that the bears have taken control because the 13-day EMA and MACD Histogram are falling (you don't have permission to buy). A blue histogram bar indicates mixed technical signals, with neither buying nor selling pressure predominating (either both buying or selling are permitted).
The impulse system can be removed from the chart any time.
-----------------------------------------------------------------
Options/adjustments for this indicator:
*Horizontal Distance (width) between two tops/bottoms criteria.
Refers to the horizontal distance between the MACH histogram peaks involved in the divergence
*Height of tops/bottoms criteria (for Histogram).
Refers to the difference/relation/vertical distance between the MACH HISTOGRAM peaks involved in the divergence: 1st Histogram Peak is X times the 2nd.
*Height/Vertical deviation of tops/bottoms criteria (for Price).
Deviation refers to the difference/relation/vertical distance between the PRICE peaks involved in the divergence.
*Plot Regular Bullish Divergences?.
*Plot Regular Bearish Divergences?.
*Delete Previous Cancelled Divergences?.
*This indicator also has the option to show the Impulse System over the MACD histogram bars

STD/C-Filtered, N-Order Power-of-Cosine FIR Filter [Loxx]STD/C-Filtered, N-Order Power-of-Cosine FIR Filter is a Discrete-Time, FIR Digital Filter that uses Power-of-Cosine Family of FIR filters. This is an N-order algorithm that turns the following indicator from a static max 16 orders to a N orders, but limited to 50 in code. You can change the top end value if you with to higher orders than 50, but the signal is likely too noisy at that level. This indicator also includes a clutter and standard deviation filter.
See the static order version of this indicator here:
STD/C-Filtered, Power-of-Cosine FIR Filter
Amplitudes for STD/C-Filtered, N-Order Power-of-Cosine FIR Filter:
What are FIR Filters?
In discrete-time signal processing, windowing is a preliminary signal shaping technique, usually applied to improve the appearance and usefulness of a subsequent Discrete Fourier Transform. Several window functions can be defined, based on a constant (rectangular window), B-splines, other polynomials, sinusoids, cosine-sums, adjustable, hybrid, and other types. The windowing operation consists of multipying the given sampled signal by the window function. For trading purposes, these FIR filters act as advanced weighted moving averages.
What is Power-of-Sine Digital FIR Filter?
Also called Cos^alpha Window Family. In this family of windows, changing the value of the parameter alpha generates different windows.
f(n) = math.cos(alpha) * (math.pi * n / N) , 0 ≤ |n| ≤ N/2
where alpha takes on integer values and N is a even number
General expanded form:
alpha0 - alpha1 * math.cos(2 * math.pi * n / N)
+ alpha2 * math.cos(4 * math.pi * n / N)
- alpha3 * math.cos(4 * math.pi * n / N)
+ alpha4 * math.cos(6 * math.pi * n / N)
- ...
Special Cases for alpha:
alpha = 0: Rectangular window, this is also just the SMA (not included here)
alpha = 1: MLT sine window (not included here)
alpha = 2: Hann window (raised cosine = cos^2)
alpha = 4: Alternative Blackman (maximized roll-off rate)
This indicator contains a binomial expansion algorithm to handle N orders of a cosine power series. You can read about how this is done here: The Binomial Theorem
What is Pascal's Triangle and how was it used here?
In mathematics, Pascal's triangle is a triangular array of the binomial coefficients that arises in probability theory, combinatorics, and algebra. In much of the Western world, it is named after the French mathematician Blaise Pascal, although other mathematicians studied it centuries before him in India, Persia, China, Germany, and Italy.
The rows of Pascal's triangle are conventionally enumerated starting with row n = 0 at the top (the 0th row). The entries in each row are numbered from the left beginning with k=0 and are usually staggered relative to the numbers in the adjacent rows. The triangle may be constructed in the following manner: In row 0 (the topmost row), there is a unique nonzero entry 1. Each entry of each subsequent row is constructed by adding the number above and to the left with the number above and to the right, treating blank entries as 0. For example, the initial number in the first (or any other) row is 1 (the sum of 0 and 1), whereas the numbers 1 and 3 in the third row are added to produce the number 4 in the fourth row.
Rows of Pascal's Triangle
0 Order: 1
1 Order: 1 1
2 Order: 1 2 1
3 Order: 1 3 3 1
4 Order: 1 4 6 4 1
5 Order: 1 5 10 10 5 1
6 Order: 1 6 15 20 15 6 1
7 Order: 1 7 21 35 35 21 7 1
8 Order: 1 8 28 56 70 56 28 8 1
9 Order: 1 9 36 34 84 126 126 84 36 9 1
10 Order: 1 10 45 120 210 252 210 120 45 10 1
11 Order: 1 11 55 165 330 462 462 330 165 55 11 1
12 Order: 1 12 66 220 495 792 924 792 495 220 66 12 1
13 Order: 1 13 78 286 715 1287 1716 1716 1287 715 286 78 13 1
For a 12th order Power-of-Cosine FIR Filter
1. We take the coefficients from the Left side of the 12th row
1 13 78 286 715 1287 1716 1716 1287 715 286 78 13 1
2. We slice those in half to
1 13 78 286 715 1287 1716
3. We reverse the array
1716 1287 715 286 78 13 1
This is our array of alphas: alpha1, alpha2, ... alphaN
4. We then pull alpha one from the previous order, order 11, the middle value
11 Order: 1 11 55 165 330 462 462 330 165 55 11 1
The middle value is 462, this value becomes our alpha0 in the calculation
5. We apply these alphas to the cosine calculations
example: + alpha4 * math.cos(6 * math.pi * n / N)
6. We then divide by the sum of the alphas to derive our final coefficient weighting kernel
**This is only useful for orders that are EVEN, if you use odd ordering, the following are the coefficient outputs and these aren't useful since they cancel each other out and result in a value of zero. See below for an odd numbered oder and compare with the amplitude of the graphic posted above of the even order amplitude:
What is a Standard Deviation Filter?
If price or output or both don't move more than the (standard deviation) * multiplier then the trend stays the previous bar trend. This will appear on the chart as "stepping" of the moving average line. This works similar to Super Trend or Parabolic SAR but is a more naive technique of filtering.
What is a Clutter Filter?
For our purposes here, this is a filter that compares the slope of the trading filter output to a threshold to determine whether to shift trends. If the slope is up but the slope doesn't exceed the threshold, then the color is gray and this indicates a chop zone. If the slope is down but the slope doesn't exceed the threshold, then the color is gray and this indicates a chop zone. Alternatively if either up or down slope exceeds the threshold then the trend turns green for up and red for down. Fro demonstration purposes, an EMA is used as the moving average. This acts to reduce the noise in the signal.
Included
Bar coloring
Loxx's Expanded Source Types
Signals
Alerts

Customisable Stoch RSI [10 PRESETS INCLUDED]Customisable Stochastic by Nicholas Kormanik
A stochastic oscillator is a momentum indicator comparing a particular closing price of a security to a range of its prices over a certain period of time.
The sensitivity of the oscillator to market movements is reducible by adjusting that time period or by taking a moving average of the result.
It is used to generate overbought and oversold trading signals, utilizing a 0–100 bounded range of values.
In this version we have 4 levels
top levels are
95 - extra overbought
80 - semi-extra overbought
70 - standart overbought
bottom levels are
5 - extra oversold
20 - semi-extra oversold
30 - standart oversold
Message by Nicholas Kormanik :
" The formula I've adopted was put on the Silicon Investor web site thread by
'bdog'. Basically, I just leave the Slowing Periods (mp3) to 1, so it
really plays no part in things. However, if somebody presents a good
argument for using other than 1 ... hey, I'm amenable.
Chande, the original inventor, didn't use a moving average on the whole
thing. Chande's result was therefore sort of choppy. I guess along the way
people decided to add the EMA Periods to smooth things out. "
There are 10 presets, try to find your best!
1. 5 -- 5 -- 3
2. 8 -- 8 -- 5
3. 13 -- 13 -- 13
4. 21 -- 15 -- 13
5. 21 -- 21 -- 13
6. 34 -- 34 -- 13
7. 55 -- 55 -- 21
8. 89 -- 13 -- 34
9. 89 -- 89 -- 21
10. 233 -- 233 -- 34
On the chart im using 9th preset and the timeframe is daily on BTCUSD pair.
*DISCLAIMER*
Use this indicator for educational purpose only, i don't recommend you to use it to trade for real money!
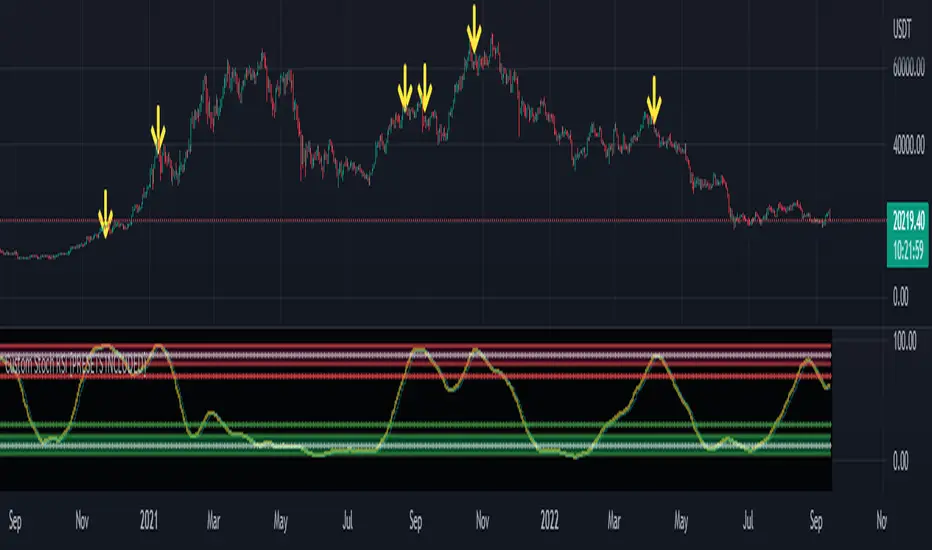
Pullback Trading [Fhenry0331]The indicator is taken from Alexander Elders "Triple Screen System," minus using the Weekly MACD as a filter/trend. I believe waiting for the force index and the weekly MACD histogram to line-up is uber conservative and a trader will miss too many signals (In my opinion).
The indicator is for a pullback trader. A trader that waits for a trend to develop then enters on a pullback.
The indicator defines an uptrend start: as the 13 ema crossing above the 26 ema. It defines a downtrend start: as the 13 ema crossing below the 26 ema.
The pullback in an uptrend: 13 ema is above the 26 ema. Elders-Force-Index is below the zero line. Price low has crossed below the 13 ema (one can also say price closes below the 13 ema if they so wish).
The pullback in a downtrend: 13 ema is below the 26 ema. Elders-Force-Index is above the zero line. Price high has also crossed above the 13 ema.
Please note that the pullback signals do not necessitate an automatic buy or sell (the instrument can be still pulling back deeper and not ready to resume it's trend.) One should place orders above (long) or below (short) bars with the pullback signals. Do so on signals until orders are filled.
Although the indicator is meant for pullbacks one can make an aggressive entry at the onset of a crossover of ema's.
For clarity background colors has been added to the indicator.
works well on daily time frame. Also look at intraday (5) minute time frame on trending stocks (news, earnings, volume, etc.)
Keep It Simple.
Enjoy!

Parabolic Move Indicator for catching moves with Penny Stocks.
Catch the day’s first big moves! Track premarket gap-ups or gap-downs, then spot early momentum shifts using volume, RSI, VWAP, EMAs, and breakout levels—perfect for acting on strong intraday setups right at market open.
**Description:**
The Parabolic Move Scanner + VWAP Bands + EMAs indicator helps traders identify **high-probability intraday moves**, particularly immediately after market open. It is ideal for stocks that **gap up or down premarket, pull back slightly, and then show renewed strength or weakness** once regular trading begins.
The indicator combines multiple components for precise signals:
* **Relative Volume Filter: ** Highlights bars with unusually high activity to ensure signals are backed by real participation.
* **RSI Momentum Change: ** Detects sudden momentum shifts to identify early strength or weakness.
* **Recent Highs/Lows Breakout: ** Confirms price is breaking short-term resistance or support.
* **VWAP & Standard Deviation Bands: ** Provides intraday trend reference points, with optional daily reset.
* **Exponential Moving Averages (EMAs): ** Tracks trend across short, medium, and long-term intraday periods.
* **Visual Signals: ** Background highlights and horizontal breakout lines make it easy to spot key bars.
* **Alerts: ** Configurable alerts notify you of bullish or bearish parabolic moves.
**Optimal Use Case: **
Use in the first 15–30 minutes after market open at 1 minute Time Frame. Best for **stocks showing a premarket gap followed by a pullback**, then resuming strength (bullish) or weakness (bearish). The combination of **volume, RSI, breakouts, VWAP, and EMAs** ensures you identify the **day’s biggest marktet open moves especially with penny stocks moves** with higher confidence.
---
### **Recommended Settings**
**Component** | **Recommended Setting** | **Description / Purpose**
| **Volume Average Length** | 20 bars | Period for calculating average volume to detect relative spikes. |
| **Volume Multiplier** | 2.0 | Current bar volume must exceed 2× average to signal high activity. |
| **RSI Length** | 7 bars | Short-term RSI period to measure momentum changes. |
| **RSI Change Threshold** | 7 | Minimum RSI change required to trigger momentum signal. |
| **Recent Highs Lookback** | 5 bars | Number of bars to check for short-term breakout levels. |
| **Horizontal Line Length** | 10 bars | Length of horizontal breakout line drawn on the chart. |
| **Horizontal Line Color** | Green (bullish) / Red (bearish) | Visual identification of breakout levels. |
| **Horizontal Line Thickness** | 1 | Line width for breakout visualization. |
| **VWAP Source** | hlc3 | Price source for VWAP calculation. |
| **VWAP Bands Multipliers** | 1×, 2×, 3× | Standard deviation multiples for intraday bands.
| **VWAP Daily Reset** | Enabled | Resets VWAP at the start of each trading day.
| **EMA Lengths** | 9, 13, 20, 33, 50 | Short, medium, and long-term EMAs to track intraday trend. |
| **Enable Bearish Signals** | True | Allows detection of bearish parabolic moves. |
|

NY Open Breakout [ATR-5000]# **New York Open Breakout Indicator **
## **📌 Overview**
This **Pine Script** indicator identifies high-probability breakout opportunities at the **New York market open (13:30 UTC)** based on **volatility filters** using **customizable ATR periods and thresholds**.
### **🔹 Key Features**
✅ **Fully Customizable ATR Periods** (2 to **5000** bars)
✅ **Adjustable Thresholds** (0.01% to 5.00%)
✅ **Opening Range (OR) Filter** (0.01% to 5.00%)
✅ **Clean Visuals** – Only highlights the **13:30 UTC candle** when conditions are met
✅ **Real-Time Info Panel** – Displays current ATR & threshold settings
✅ **Automatic Daily Reset** – Fresh signals every trading day
---
## **📊 How It Works**
### **1️⃣ Volatility Check (13:25 UTC)**
- Calculates **two ATR values** (user-defined periods)
- Compares them against **custom % thresholds**
- Only proceeds if **both ATRs exceed** their required volatility levels
### **2️⃣ Opening Range Confirmation (13:30 UTC)**
- Measures the **high-low range** of the 13:30 candle
- Validates if the range meets the **minimum % threshold**
- If all conditions pass → **Highlights the candle** in your chosen color
### **3️⃣ Visual Feedback**
- **🟣 Colored Candle** → Valid breakout signal
- **📊 Info Table** → Shows current ATR settings & thresholds
---
## **⚙️ Customization Options**
| **Setting** | **Default** | **Adjustable Range** |
|---------------------------|------------|----------------------|
| **First ATR Period** | 14 | **2–5000** bars |
| **Second ATR Period** | 161 | **2–5000** bars |
| **First ATR Threshold** | 0.42% | **0.01%–5.00%** |
| **Second ATR Threshold** | 0.40% | **0.01%–5.00%** |
| **OR Range Threshold** | 0.42% | **0.01%–5.00%** |
| **Candle Color** | Purple | **Any color** |
---
## **📈 Best Use Cases**
✔ **Forex (EURUSD, GBPUSD)** – Captures NY session momentum
✔ **Indices (SPX, NASDAQ)** – Works well with opening volatility
✔ **Commodities (Gold, Oil)** – Filters out low-energy days
---
## **🔧 How to Adjust Settings**
1. **Click the gear icon (⚙️)** on your TradingView chart
2. **Modify ATR periods & thresholds** as needed
3. **Change the candle color** for better visibility
---
## **🚀 Why This Indicator?**
- **No repainting** – Signals lock in after candle close
- **No clutter** – Only marks valid 13:30 candles
- **Adaptable** – Works on **any market & timeframe**
- **Fully automated** – No manual adjustments needed
---
### **📥 Apply & Start Trading!**
Simply **load the script** on TradingView and customize it to fit your strategy! 🚀

EMA Crossover (Short Focus with Trailing Stop)This strategy utilizes a combination of Exponential Moving Averages (EMA) and Simple Moving Averages (SMA) to generate entry and exit signals for both long and short positions. The core of the strategy is based on the 13-period EMA (short EMA) crossing the 33-period EMA (long EMA) for entering long trades, while a 13-period EMA crossing the 25-period EMA (mid EMA) generates short trade signals. The 100-period SMA and 200-period SMA serve as additional trend indicators to provide context for the market conditions. The strategy aims to capitalize on trend reversals and momentum shifts in the market.
The strategy is designed to execute trades swiftly with an emphasis on entering positions when conditions align in real time. For long entries, the strategy initiates a buy when the 13 EMA is greater than the 33 EMA, indicating a bullish trend. For short entries, the 13 EMA crossing below the 33 EMA signals a bearish trend, prompting a short position. Importantly, the code includes built-in exit conditions for both long and short positions. Long positions are exited when the 13 EMA falls below the 33 EMA, while short positions are closed when the 13 EMA crosses above the 25 EMA.
A key feature of the strategy is the use of trailing stops for both long and short positions. This dynamic exit method adjusts the stop level as the market moves in favor of the trade, locking in profits while reducing the risk of losses. The trailing stop for long positions is based on the high price of the current bar, while the trailing stop for short positions is set using the low price, providing more flexibility in managing risk. This trailing stop mechanism helps to capture profits from favorable market moves while ensuring that positions are exited if the market moves against them.
This strategy works best on the daily timeframe and is optimized for major cryptocurrency pairs. The daily chart allows for the EMAs to provide more reliable signals, as the strategy is designed to capture broader trends rather than short-term market fluctuations. Using it on major crypto pairs increases its effectiveness as these assets tend to have strong and sustained trends, providing better opportunities for the strategy to perform well.
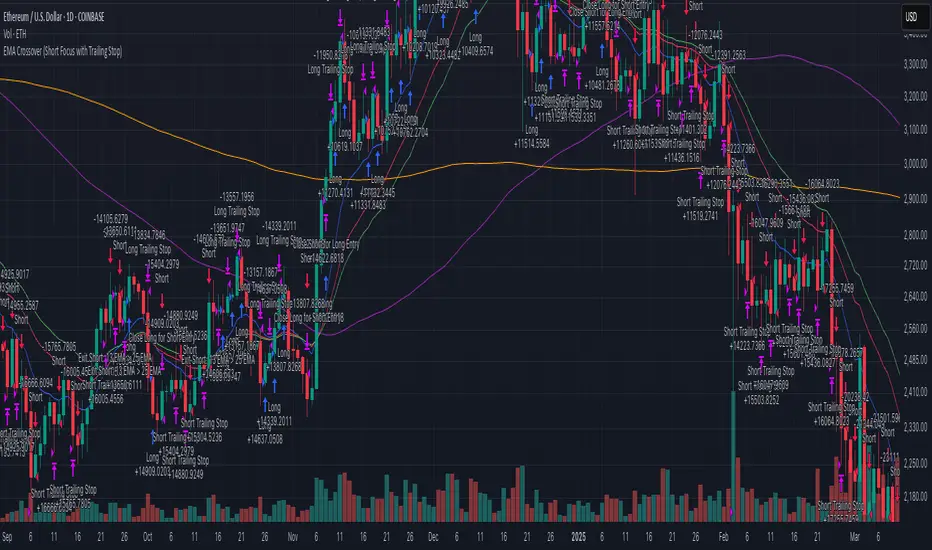
NasyI## NasyI - Multi-Timeframe Technical Analysis Toolkit
### English Description
**NasyI** is a comprehensive technical analysis indicator designed to provide traders with a complete view of market dynamics across multiple timeframes. This indicator combines the power of Exponential Moving Averages (EMAs), Simple Moving Averages (MAs), Volume Weighted Average Price (VWAP), and key support/resistance levels to help traders identify trend direction, potential reversal points, and optimal entry/exit opportunities.
#### Key Features
1. **Multi-Timeframe Analysis System**
- 2-minute EMAs (13, 48) for ultra-short-term trend identification
- 5-minute EMAs (9, 13, 21, 48, 200) for short-term trend confirmation
- Daily EMAs (5, 13, 21, 48, 100, 200) and MAs (20, 50, 100, 200) for longer-term perspective
- Color-coded bands between key EMAs to visually identify trend strength and direction
2. **Advanced VWAP Integration**
- Daily VWAP for intraday support/resistance
- Weekly VWAP for medium-term price reference
- Monthly VWAP for long-term institutional price levels
- All VWAPs properly reset at their respective time period boundaries
3. **Critical Price Level Identification**
- Previous day high/low lines for identifying key breakout and breakdown levels
- Pre-market high/low tracking to identify potential intraday support/resistance zones
- All levels displayed with distinct line styles for easy identification
4. **Dynamic Trend Analysis**
- Color-coded bands between EMAs display trend strength and direction:
- Green bands indicate uptrend conditions (9 EMA > 21 EMA > 48 EMA)
- Red bands indicate downtrend conditions (9 EMA < 21 EMA < 48 EMA)
- Yellow bands indicate neutral/confused market conditions
- Visual representation makes trend changes immediately apparent
5. **Comprehensive Customization Options**
- Fully customizable colors for all indicators and bands
- Adjustable transparency settings for visual clarity
- Optional price labels with customizable placement and appearance
- Ability to show/hide specific components based on trading preferences
#### Trading Applications
This indicator is particularly valuable for:
1. **Day Trading & Scalping**: The 2-minute and 5-minute EMAs with color bands provide clear short-term trend direction and potential reversal signals.
2. **Swing Trading**: Daily EMAs and MAs offer perspective on the larger trend, helping to align short-term trades with the broader market direction.
3. **Gap Trading**: Previous day and pre-market levels help identify potential gap fill scenarios and breakout/breakdown opportunities.
4. **VWAP Trading Strategies**: Multiple timeframe VWAPs allow for identifying institutional participation levels and potential reversal zones.
5. **EMA Cross Systems**: The various EMAs can be used to identify golden crosses and death crosses across multiple timeframes.
#### How the Components Work Together
The power of NasyI comes from the integration of these different technical elements:
1. The short-timeframe EMAs (2m, 5m) provide immediate trend information, while the daily EMAs/MAs provide context about the larger market structure.
2. The color bands between EMAs offer instant visual confirmation of trend alignment or divergence across timeframes.
3. Previous day and pre-market levels add horizontal support/resistance zones to complement the dynamic moving averages.
4. Multiple timeframe VWAPs provide additional confirmation of institutional activity levels and potential reversal points.
By combining these elements, traders can develop a comprehensive market view that integrates price action, trend direction, and key support/resistance levels all in one indicator.
#### Usage Instructions
1. Apply the NasyI indicator to your chart (works best on intraday timeframes from 1-minute to 30-minute).
2. Observe the relationship between price and the various EMAs:
- Price above the 2m/5m EMAs with green bands indicates bullish short-term conditions
- Price below the 2m/5m EMAs with red bands indicates bearish short-term conditions
3. Use the daily EMAs/MAs and VWAPs as targets for potential price movements and reversal zones.
4. Previous day and pre-market high/low lines provide key levels to watch for breakouts or breakdowns.
5. Customize the appearance according to your preferences using the extensive settings options.
This indicator represents a unique approach to technical analysis by combining multiple timeframe perspectives into a single, visually intuitive display that helps traders make more informed decisions based on a comprehensive view of market conditions.
### 中文描述
**NasyI** 是一个全面的技术分析指标,旨在为交易者提供跨多个时间周期的完整市场动态视图。该指标结合了指数移动平均线(EMA)、简单移动平均线(MA)、成交量加权平均价格(VWAP)和关键支撑/阻力水平的力量,帮助交易者识别趋势方向、潜在反转点和最佳进出场机会。
#### 主要特点
1. **多时间周期分析系统**
- 2分钟EMAs(13,48)用于超短期趋势识别
- 5分钟EMAs(9,13,21,48,200)用于短期趋势确认
- 日线EMAs(5,13,21,48,100,200)和MAs(20,50,100,200)用于更长期的视角
- 关键EMAs之间的彩色带状区域直观显示趋势强度和方向
2. **高级VWAP整合**
- 日内VWAP作为日内支撑/阻力
- 周内VWAP作为中期价格参考
- 月内VWAP作为长期机构价格水平
- 所有VWAP在各自的时间周期边界正确重置
3. **关键价格水平识别**
- 前一交易日高点/低点线用于识别关键突破和跌破水平
- 盘前高点/低点跟踪用于识别潜在的日内支撑/阻力区域
- 所有水平以不同的线条样式显示,便于识别
4. **动态趋势分析**
- EMAs之间的彩色带状区域显示趋势强度和方向:
- 绿色带状区域表示上升趋势(9 EMA > 21 EMA > 48 EMA)
- 红色带状区域表示下降趋势(9 EMA < 21 EMA < 48 EMA)
- 黄色带状区域表示中性/混乱市场条件
- 视觉表示使趋势变化立即显现
5. **全面的自定义选项**
- 所有指标和带状区域的颜色完全可定制
- 可调节的透明度设置,提高视觉清晰度
- 可选的价格标签,带有可定制的位置和外观
- 能够根据交易偏好显示/隐藏特定组件
#### 交易应用
此指标对以下方面特别有价值:
1. **日内交易和短线交易**:2分钟和5分钟EMAs与色带提供清晰的短期趋势方向和潜在反转信号。
2. **摇摆交易**:日线EMAs和MAs提供对更大趋势的视角,帮助将短期交易与更广泛的市场方向对齐。
3. **缺口交易**:前一日和盘前水平帮助识别潜在的缺口填充情况和突破/跌破机会。
4. **VWAP交易策略**:多时间周期VWAP允许识别机构参与水平和潜在反转区域。
5. **EMA交叉系统**:各种EMAs可用于识别跨多个时间周期的黄金交叉和死亡交叉。
#### 组件如何协同工作
NasyI的强大之处在于这些不同技术元素的集成:
1. 短时间周期EMAs(2m,5m)提供即时趋势信息,而日线EMAs/MAs提供关于更大市场结构的背景。
2. EMAs之间的色带提供趋势对齐或跨时间周期分歧的即时视觉确认。
3. 前一日和盘前水平添加水平支撑/阻力区域,补充动态移动平均线。
4. 多时间周期VWAP提供机构活动水平和潜在反转点的额外确认。
通过结合这些元素,交易者可以发展出全面的市场视图,整合价格行动、趋势方向和关键支撑/阻力水平于一个指标中。
#### 使用说明
1. 将NasyI指标应用到您的图表上(最适合1分钟至30分钟的日内时间周期)。
2. 观察价格与各种EMAs之间的关系:
- 价格位于2m/5m EMAs之上,带有绿色带状区域,表示看涨的短期条件
- 价格位于2m/5m EMAs之下,带有红色带状区域,表示看跌的短期条件
3. 使用日线EMAs/MAs和VWAPs作为潜在价格移动和反转区域的目标。
4. 前一日和盘前高点/低点线提供需要关注的突破或跌破的关键水平。
5. 使用广泛的设置选项根据您的偏好自定义外观。
这个指标代表了一种独特的技术分析方法,将多个时间周期的视角结合到一个单一的、视觉直观的显示中,帮助交易者基于对市场条件的全面视图做出更明智的决策。

Forex Fire EMA/MA/RSI StrategyEURUSD
The entry method in the Forex Fire EMA/MA/RSI Strategy combines several conditions across two timeframes. Here's a breakdown of how entries are determined:
Long Entry Conditions:
15-Minute Timeframe Conditions:
EMA 13 > EMA 62 (short-term momentum is bullish)
Price > MA 200 (trading above the major trend indicator)
Fast RSI (7) > Slow RSI (28) (momentum is increasing)
Fast RSI > 50 (showing bullish momentum)
Volume is increasing compared to 20-period average
4-Hour Timeframe Confluence:
EMA 13 > EMA 62 (larger timeframe confirms bullish trend)
Price > MA 200 (confirming overall uptrend)
Slow RSI (28) > 40 (showing bullish bias)
Fast RSI > Slow RSI (momentum is supporting the move)
Additional Precision Requirement:
Either EMA 13 has just crossed above EMA 62 (crossover)
OR price has just crossed above MA 200
Short Entry Conditions:
15-Minute Timeframe Conditions:
EMA 13 < EMA 62 (short-term momentum is bearish)
Price < MA 200 (trading below the major trend indicator)
Fast RSI (7) < Slow RSI (28) (momentum is decreasing)
Fast RSI < 50 (showing bearish momentum)
Volume is increasing compared to 20-period average
4-Hour Timeframe Confluence:
EMA 13 < EMA 62 (larger timeframe confirms bearish trend)
Price < MA 200 (confirming overall downtrend)
Slow RSI (28) < 60 (showing bearish bias)
Fast RSI < Slow RSI (momentum is supporting the move)
Additional Precision Requirement:
Either EMA 13 has just crossed under EMA 62 (crossunder)
OR price has just crossed under MA 200
The key aspect of this strategy is that it requires alignment between the shorter timeframe (15m) and the larger timeframe (4h), which helps filter out false signals and focuses on trades that have strong multi-timeframe support. The crossover/crossunder requirement further refines entries by looking for actual changes in direction rather than just conditions that might have been in place for a long time.
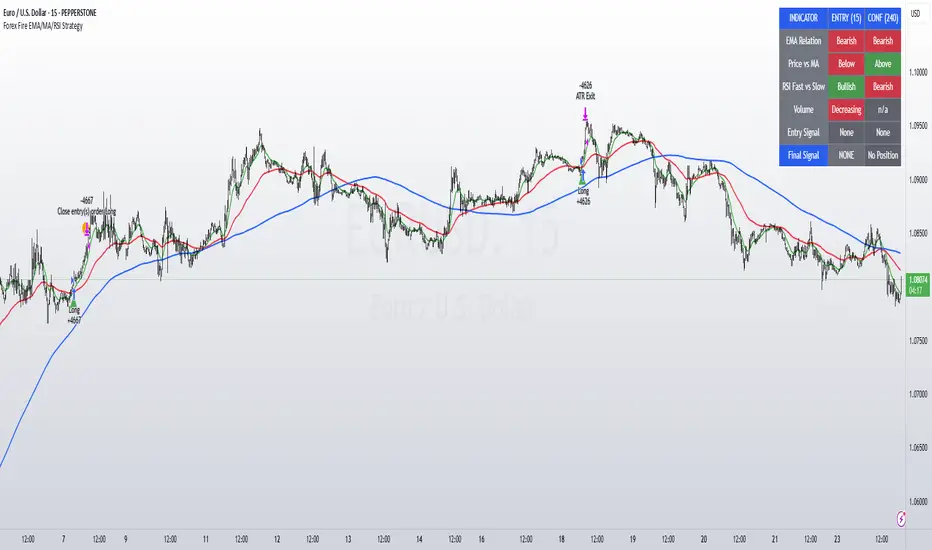
XAMD/AMDX ICT 01 [TradingFinder] SMC Quarterly Theory Cycles🔵 Introduction
The XAMD/AMDX strategy, combined with the Quarterly Theory, forms the foundation of a powerful market structure analysis. This indicator builds upon the principles of the Power of 3 strategy introduced by ICT, enhancing its application by incorporating an additional phase.
By extending the logic of Power of 3, the XAMD/AMDX tool provides a more detailed and comprehensive view of daily market behavior, offering traders greater precision in identifying key movements and opportunities
This approach divides the trading day into four distinct phases : Accumulation (19:00 - 01:00 EST), Manipulation (01:00 - 07:00 EST), Distribution (07:00 - 13:00 EST), and Continuation or Reversal (13:00 - 19:00 EST), collectively known as AMDX.
Each phase reflects a specific market behavior, providing a structured lens to interpret price action. Building on the fractal nature of time in financial markets, the Quarterly Theory introduces the Four Quarters Method, where a currency pair’s price range is divided into quarters.
These divisions, known as quarter points, highlight critical levels for analyzing and predicting market dynamics. Together, these principles allow traders to align their strategies with institutional trading patterns, offering deeper insights into market trends
🔵 How to Use
The AMDX framework provides a structured approach to understanding market behavior throughout the trading day. Each phase has its own characteristics and trading opportunities, allowing traders to align their strategies effectively. To get the most out of this tool, understanding the dynamics of each phase is essential.
🟣 Accumulation
During the Accumulation phase (19:00 - 01:00 EST), the market is typically quiet, with price movements confined to a narrow range. This phase is where institutional players accumulate their positions, setting the stage for future price movements.
Traders should use this time to study price patterns and prepare for the next phases. It’s a great opportunity to mark key support and resistance zones and set alerts for potential breakouts, as the low volatility makes immediate trading less attractive.
🟣 Manipulation
The Manipulation phase (01:00 - 07:00 EST) is often marked by sharp and deceptive price movements. Institutions create false breakouts to trigger stop-losses and trap retail traders into the wrong direction. Traders should remain cautious during this phase, focusing on identifying the areas of liquidity where these traps occur.
Watching for price reversals after these false moves can provide excellent entry opportunities, but patience and confirmation are crucial to avoid getting caught in the manipulation.
🟣 Distribution
The Distribution phase (07:00 - 13:00 EST) is where the day’s dominant trend typically emerges. Institutions execute large trades, resulting in significant price movements. This phase is ideal for trading with the trend, as the market provides clearer directional signals.
Traders should focus on identifying breakouts or strong momentum in the direction of the trend established during this period. This phase is also where traders can capitalize on setups identified earlier, aligning their entries with the market’s broader sentiment.
🟣 Continuation or Reversal
Finally, the Continuation or Reversal phase (13:00 - 19:00 EST) offers a critical juncture to assess the market’s direction. This phase can either reinforce the established trend or signal a reversal as institutions adjust their positions.
Traders should observe price behavior closely during this time, looking for patterns that confirm whether the trend is likely to continue or reverse. This phase is particularly useful for adjusting open positions or initiating new trades based on emerging signals.
🔵 Settings
Show or Hide Phases.
Adjust the session times for each phase :
Accumulation: 19:00-01:00 EST
Manipulation: 01:00-07:00 EST
Distribution: 07:00-13:00 EST
Continuation or Reversal: 13:00-19:00 EST
Modify Visualization : Customize how the indicator looks by changing settings like colors and transparency.
🔵 Conclusion
AMDX provides traders with a practical method to analyze daily market behavior by dividing the trading day into four key phases: Accumulation, Manipulation, Distribution, and Continuation or Reversal. Each phase highlights specific market dynamics, offering insights into how institutional activity shapes price movements.
From the quiet buildup in the Accumulation phase to the decisive trends of the Distribution phase, and the critical transitions in Continuation or Reversal, this approach equips traders with the tools to anticipate movements and make informed decisions.
By recognizing the significance of each phase, traders can avoid common traps during Manipulation, capitalize on clear trends during Distribution, and adapt to changes in the final phase of the day.
The structured visualization of market phases simplifies decision-making for traders of all levels. By incorporating these principles into your trading strategy, you can enhance your ability to align with market trends, optimize entry and exit points, and achieve more consistent results in your trading journey.

PubLibTrendLibrary "PubLibTrend"
trend, multi-part trend, double trend and multi-part double trend conditions for indicator and strategy development
rlut()
return line uptrend condition
Returns: bool
dt()
downtrend condition
Returns: bool
ut()
uptrend condition
Returns: bool
rldt()
return line downtrend condition
Returns: bool
dtop()
double top condition
Returns: bool
dbot()
double bottom condition
Returns: bool
rlut_1p()
1-part return line uptrend condition
Returns: bool
rlut_2p()
2-part return line uptrend condition
Returns: bool
rlut_3p()
3-part return line uptrend condition
Returns: bool
rlut_4p()
4-part return line uptrend condition
Returns: bool
rlut_5p()
5-part return line uptrend condition
Returns: bool
rlut_6p()
6-part return line uptrend condition
Returns: bool
rlut_7p()
7-part return line uptrend condition
Returns: bool
rlut_8p()
8-part return line uptrend condition
Returns: bool
rlut_9p()
9-part return line uptrend condition
Returns: bool
rlut_10p()
10-part return line uptrend condition
Returns: bool
rlut_11p()
11-part return line uptrend condition
Returns: bool
rlut_12p()
12-part return line uptrend condition
Returns: bool
rlut_13p()
13-part return line uptrend condition
Returns: bool
rlut_14p()
14-part return line uptrend condition
Returns: bool
rlut_15p()
15-part return line uptrend condition
Returns: bool
rlut_16p()
16-part return line uptrend condition
Returns: bool
rlut_17p()
17-part return line uptrend condition
Returns: bool
rlut_18p()
18-part return line uptrend condition
Returns: bool
rlut_19p()
19-part return line uptrend condition
Returns: bool
rlut_20p()
20-part return line uptrend condition
Returns: bool
rlut_21p()
21-part return line uptrend condition
Returns: bool
rlut_22p()
22-part return line uptrend condition
Returns: bool
rlut_23p()
23-part return line uptrend condition
Returns: bool
rlut_24p()
24-part return line uptrend condition
Returns: bool
rlut_25p()
25-part return line uptrend condition
Returns: bool
rlut_26p()
26-part return line uptrend condition
Returns: bool
rlut_27p()
27-part return line uptrend condition
Returns: bool
rlut_28p()
28-part return line uptrend condition
Returns: bool
rlut_29p()
29-part return line uptrend condition
Returns: bool
rlut_30p()
30-part return line uptrend condition
Returns: bool
dt_1p()
1-part downtrend condition
Returns: bool
dt_2p()
2-part downtrend condition
Returns: bool
dt_3p()
3-part downtrend condition
Returns: bool
dt_4p()
4-part downtrend condition
Returns: bool
dt_5p()
5-part downtrend condition
Returns: bool
dt_6p()
6-part downtrend condition
Returns: bool
dt_7p()
7-part downtrend condition
Returns: bool
dt_8p()
8-part downtrend condition
Returns: bool
dt_9p()
9-part downtrend condition
Returns: bool
dt_10p()
10-part downtrend condition
Returns: bool
dt_11p()
11-part downtrend condition
Returns: bool
dt_12p()
12-part downtrend condition
Returns: bool
dt_13p()
13-part downtrend condition
Returns: bool
dt_14p()
14-part downtrend condition
Returns: bool
dt_15p()
15-part downtrend condition
Returns: bool
dt_16p()
16-part downtrend condition
Returns: bool
dt_17p()
17-part downtrend condition
Returns: bool
dt_18p()
18-part downtrend condition
Returns: bool
dt_19p()
19-part downtrend condition
Returns: bool
dt_20p()
20-part downtrend condition
Returns: bool
dt_21p()
21-part downtrend condition
Returns: bool
dt_22p()
22-part downtrend condition
Returns: bool
dt_23p()
23-part downtrend condition
Returns: bool
dt_24p()
24-part downtrend condition
Returns: bool
dt_25p()
25-part downtrend condition
Returns: bool
dt_26p()
26-part downtrend condition
Returns: bool
dt_27p()
27-part downtrend condition
Returns: bool
dt_28p()
28-part downtrend condition
Returns: bool
dt_29p()
29-part downtrend condition
Returns: bool
dt_30p()
30-part downtrend condition
Returns: bool
ut_1p()
1-part uptrend condition
Returns: bool
ut_2p()
2-part uptrend condition
Returns: bool
ut_3p()
3-part uptrend condition
Returns: bool
ut_4p()
4-part uptrend condition
Returns: bool
ut_5p()
5-part uptrend condition
Returns: bool
ut_6p()
6-part uptrend condition
Returns: bool
ut_7p()
7-part uptrend condition
Returns: bool
ut_8p()
8-part uptrend condition
Returns: bool
ut_9p()
9-part uptrend condition
Returns: bool
ut_10p()
10-part uptrend condition
Returns: bool
ut_11p()
11-part uptrend condition
Returns: bool
ut_12p()
12-part uptrend condition
Returns: bool
ut_13p()
13-part uptrend condition
Returns: bool
ut_14p()
14-part uptrend condition
Returns: bool
ut_15p()
15-part uptrend condition
Returns: bool
ut_16p()
16-part uptrend condition
Returns: bool
ut_17p()
17-part uptrend condition
Returns: bool
ut_18p()
18-part uptrend condition
Returns: bool
ut_19p()
19-part uptrend condition
Returns: bool
ut_20p()
20-part uptrend condition
Returns: bool
ut_21p()
21-part uptrend condition
Returns: bool
ut_22p()
22-part uptrend condition
Returns: bool
ut_23p()
23-part uptrend condition
Returns: bool
ut_24p()
24-part uptrend condition
Returns: bool
ut_25p()
25-part uptrend condition
Returns: bool
ut_26p()
26-part uptrend condition
Returns: bool
ut_27p()
27-part uptrend condition
Returns: bool
ut_28p()
28-part uptrend condition
Returns: bool
ut_29p()
29-part uptrend condition
Returns: bool
ut_30p()
30-part uptrend condition
Returns: bool
rldt_1p()
1-part return line downtrend condition
Returns: bool
rldt_2p()
2-part return line downtrend condition
Returns: bool
rldt_3p()
3-part return line downtrend condition
Returns: bool
rldt_4p()
4-part return line downtrend condition
Returns: bool
rldt_5p()
5-part return line downtrend condition
Returns: bool
rldt_6p()
6-part return line downtrend condition
Returns: bool
rldt_7p()
7-part return line downtrend condition
Returns: bool
rldt_8p()
8-part return line downtrend condition
Returns: bool
rldt_9p()
9-part return line downtrend condition
Returns: bool
rldt_10p()
10-part return line downtrend condition
Returns: bool
rldt_11p()
11-part return line downtrend condition
Returns: bool
rldt_12p()
12-part return line downtrend condition
Returns: bool
rldt_13p()
13-part return line downtrend condition
Returns: bool
rldt_14p()
14-part return line downtrend condition
Returns: bool
rldt_15p()
15-part return line downtrend condition
Returns: bool
rldt_16p()
16-part return line downtrend condition
Returns: bool
rldt_17p()
17-part return line downtrend condition
Returns: bool
rldt_18p()
18-part return line downtrend condition
Returns: bool
rldt_19p()
19-part return line downtrend condition
Returns: bool
rldt_20p()
20-part return line downtrend condition
Returns: bool
rldt_21p()
21-part return line downtrend condition
Returns: bool
rldt_22p()
22-part return line downtrend condition
Returns: bool
rldt_23p()
23-part return line downtrend condition
Returns: bool
rldt_24p()
24-part return line downtrend condition
Returns: bool
rldt_25p()
25-part return line downtrend condition
Returns: bool
rldt_26p()
26-part return line downtrend condition
Returns: bool
rldt_27p()
27-part return line downtrend condition
Returns: bool
rldt_28p()
28-part return line downtrend condition
Returns: bool
rldt_29p()
29-part return line downtrend condition
Returns: bool
rldt_30p()
30-part return line downtrend condition
Returns: bool
dut()
double uptrend condition
Returns: bool
ddt()
double downtrend condition
Returns: bool
dut_1p()
1-part double uptrend condition
Returns: bool
dut_2p()
2-part double uptrend condition
Returns: bool
dut_3p()
3-part double uptrend condition
Returns: bool
dut_4p()
4-part double uptrend condition
Returns: bool
dut_5p()
5-part double uptrend condition
Returns: bool
dut_6p()
6-part double uptrend condition
Returns: bool
dut_7p()
7-part double uptrend condition
Returns: bool
dut_8p()
8-part double uptrend condition
Returns: bool
dut_9p()
9-part double uptrend condition
Returns: bool
dut_10p()
10-part double uptrend condition
Returns: bool
dut_11p()
11-part double uptrend condition
Returns: bool
dut_12p()
12-part double uptrend condition
Returns: bool
dut_13p()
13-part double uptrend condition
Returns: bool
dut_14p()
14-part double uptrend condition
Returns: bool
dut_15p()
15-part double uptrend condition
Returns: bool
dut_16p()
16-part double uptrend condition
Returns: bool
dut_17p()
17-part double uptrend condition
Returns: bool
dut_18p()
18-part double uptrend condition
Returns: bool
dut_19p()
19-part double uptrend condition
Returns: bool
dut_20p()
20-part double uptrend condition
Returns: bool
dut_21p()
21-part double uptrend condition
Returns: bool
dut_22p()
22-part double uptrend condition
Returns: bool
dut_23p()
23-part double uptrend condition
Returns: bool
dut_24p()
24-part double uptrend condition
Returns: bool
dut_25p()
25-part double uptrend condition
Returns: bool
dut_26p()
26-part double uptrend condition
Returns: bool
dut_27p()
27-part double uptrend condition
Returns: bool
dut_28p()
28-part double uptrend condition
Returns: bool
dut_29p()
29-part double uptrend condition
Returns: bool
dut_30p()
30-part double uptrend condition
Returns: bool
ddt_1p()
1-part double downtrend condition
Returns: bool
ddt_2p()
2-part double downtrend condition
Returns: bool
ddt_3p()
3-part double downtrend condition
Returns: bool
ddt_4p()
4-part double downtrend condition
Returns: bool
ddt_5p()
5-part double downtrend condition
Returns: bool
ddt_6p()
6-part double downtrend condition
Returns: bool
ddt_7p()
7-part double downtrend condition
Returns: bool
ddt_8p()
8-part double downtrend condition
Returns: bool
ddt_9p()
9-part double downtrend condition
Returns: bool
ddt_10p()
10-part double downtrend condition
Returns: bool
ddt_11p()
11-part double downtrend condition
Returns: bool
ddt_12p()
12-part double downtrend condition
Returns: bool
ddt_13p()
13-part double downtrend condition
Returns: bool
ddt_14p()
14-part double downtrend condition
Returns: bool
ddt_15p()
15-part double downtrend condition
Returns: bool
ddt_16p()
16-part double downtrend condition
Returns: bool
ddt_17p()
17-part double downtrend condition
Returns: bool
ddt_18p()
18-part double downtrend condition
Returns: bool
ddt_19p()
19-part double downtrend condition
Returns: bool
ddt_20p()
20-part double downtrend condition
Returns: bool
ddt_21p()
21-part double downtrend condition
Returns: bool
ddt_22p()
22-part double downtrend condition
Returns: bool
ddt_23p()
23-part double downtrend condition
Returns: bool
ddt_24p()
24-part double downtrend condition
Returns: bool
ddt_25p()
25-part double downtrend condition
Returns: bool
ddt_26p()
26-part double downtrend condition
Returns: bool
ddt_27p()
27-part double downtrend condition
Returns: bool
ddt_28p()
28-part double downtrend condition
Returns: bool
ddt_29p()
29-part double downtrend condition
Returns: bool
ddt_30p()
30-part double downtrend condition
Returns: bool
