DateNow█ OVERVIEW
Library "DateNow"
TODO: Provide today's date based on UNIX time
█ INSPIRATIONS
Use pinescript v4 functions such as year(), month() and dayofmonth().
Use pinescript v5 function such as switch.
Export as string variables.
Not using any match function such as math.floor.
█ CREDITS
RicardoSantos
█ KNOWN ISSUES
Date for Day display incorrectly by shortage 1 value especially Year equal to or before 1984
Timezone issue. Example : I using GMT+8 for my timezone, try using other GMT will not work. Al least, GMT+2 to GMT+13 is working. GMT-0 to GMT+1 is not working, although already attempt using UTC-10 to UTC-1.
dateNow()
: DateNow
Parameters:
: : _timezone
Returns: : YYYY, YY, M, MM, MMM, DD
ค้นหาในสคริปต์สำหรับ "细算江西救护车家长倒赚了四万三+-医疗花费13万(家长视频)++医保报"

10yr, 20yr, 30yr Averages: Month/Month % Change; SeasonalityCalculates 10yr, 20yr and 30yr averages for month/month % change
~shows seasonal tendencies in assets (best in commodities). In above chart: August is a seasonally bullish month for Gold: All the averages agree. And January is the most seasonally bullish month.
~averages represent current month/previous month. i.e. Jan22 average % change represents whole of jan22 / whole of dec21
~designed for daily timeframe only: I found calling monthly data too buggy to work with, and I thought weekly basis may be less precise (though it would certainly reduce calculation time!)
~choose input year, and see the previous 10yrs of monthly % change readings, and previous 10yrs Average, 20yr Average, 30yr Average for the respective month. Labels table is always anchored to input year.
~user inputs: colors | label sizes | decimal places | source expression for averages | year | show/hide various sections
~multi-yr averges always print, i.e if only 10yrs history => 10yr Av = 20yr Av = 30yr Av. 'History Available' label helps here.
Based on my previously publised script: "Month/Month Percentage % Change, Historical; Seasonal Tendency"
Publishing this as seperate indicator because:
~significantly slower to load (around 13 seconds)
~non-premium users may not have the historical bars available to use 20yr or 30yr averages =>> prefer the lite/speedier version
~~tips~~
~after loading, touch the new right scale; then can drag the table as you like and seperate it from price chart
##Debugging/tweaking##
Comment-in the block at the end:
~test/verifify specific array elements elements.
~see the script calculation/load time
~~other ideas ~~
~could tweak the array.slice values in lines 313 - 355 to show the last 3 consecutive 10yr averages instead (i.e. change 0, 10 | 0,20 | 0, 30 to 0, 10 | 10, 20 | 20,30)
~add 40yr average by adding another block to each of the array functions, and tweaking the respective labels after line 313 (though this would likely add another 5 seconds to the load time)
~use alternative method for getting obtaining multi-year values from individual month elements. I used array.avg. You could try array.median, array.mode, array.variance, array.max, array.min (lines 313-355)

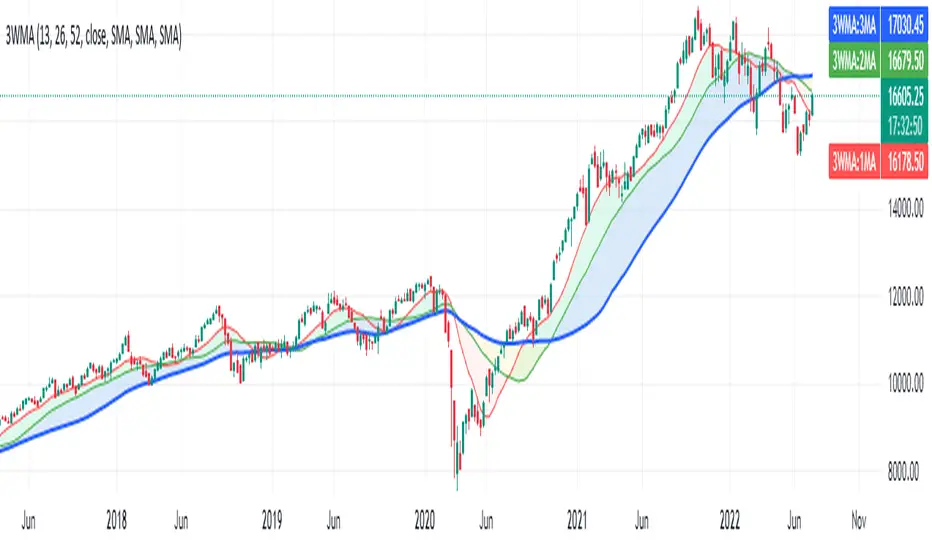
Triple Weekly Moving AverageTriple Weekly Moving Average
The default settings plot 3 weekly moving averages for 13, 26 and 52 weeks, for analyzing Short (Quarterly), Medium (Semester) and long term (Yearly) view.
Idea is when the three moving averages are aligned, the security is in trend and when they crisscross the security may be either turning, slowing down or stalling, however, this must be correlated with other studies.
Started observing half yearly moving average after reading Stan Weinstein's Secrets For Profiting in Bull and Bear Markets .
The settings of the indicator are pretty self explanatory. The indicator gives an option to select lookahead , however, change it only when you are well aware of the consequences, the default setting is Turned Off , please follow TV user guide for a detailed explanation on lookahead. I added it as I was plotting this script on Daily timeframe and wanted to observe the changes.
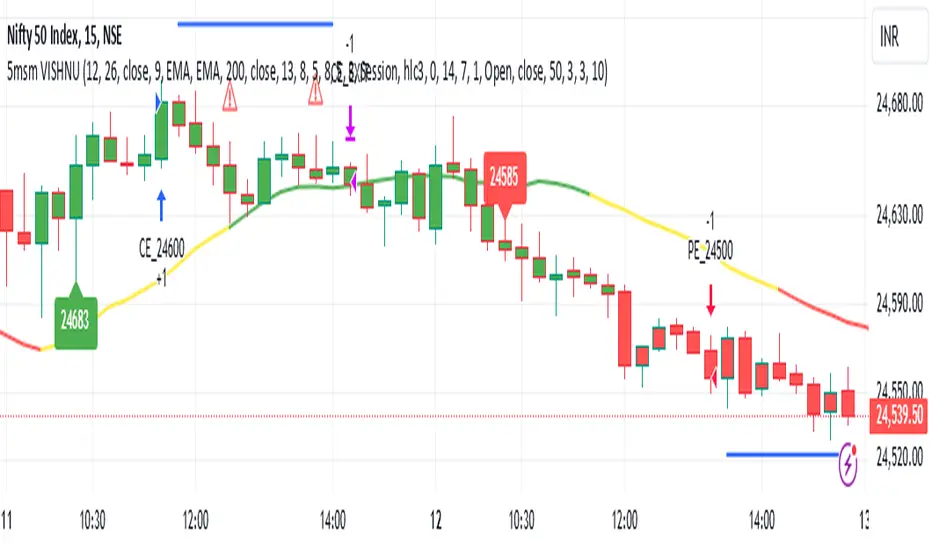
5MSM VISHNU5MSM VISHNU Indicator for Trending Markets originally written by patrick1994.
It was originally based on the MACD 12-26 and the 50 bar EMA .
The macd hist is color coded with green as buy and sell as red.
I added an option to use a couple of lower lag ema's (See line 13 - ema_signal).
5MSM VISHNU with MACD Indicator for Trending Markets
Originally written by Trading Rush
Note that the user may choose lower lags to compute the MACD signals
added lower lag ema functions - see lines 21 to 30
added plot for the MACD signal 'hist' - computed in lines 36 to 41
The extra MACD line was added for clarity for the placement of the buy sell signals.
Fibonacci Moving AverageFibonacci moving averages are a more reactive form of EMA utilizing the Fibonacci sequence (1 2 3 5 8 13 ... etc) to weight values.
This method gives several advantages of EMAs: they respond much sooner to price action while still weighting for past values and longer MAs (200 candle, 800 candle) etc moving averages can be calculated from candle 1 - handy for newly listed cryptocurrencies, equities, ETFs, etc.
The script allows for up to 5 moving averages. They can also be set as WMAs which weight older values more than recent to create slow/fast MAs.
They can be used the same way regular EMAs/WMAs are used: crossovers give trade entry/exit points, can indicate trend by alignment with other MAs and by their angle up/down, and - less useful for FMAs since no one else uses them - they can provide resistance.
Directional BiasA Directional Bias to stop me trading against the trend
Utilising EMA'S - I personally view on the 15M TF but it can be set on any
40/50/60 15Minute STF
and 13/35/50 - 30M 1H and 4H HTF
Mixing them together in direction and location to each other Gives a 6 colour system for keeping away from trading against trend
Dark Red Both Align - Sells Only do not take Buy Trades
Medium Red HTF and Dark Red Mix - Sells Only do not take Buy Trades
Light Red STF - if in a mix with Blanks and greens - Trade Both Directions - if 8 hours of solid Light Red ? Darker Red - do not take Buy Trades - Sells Only
Orange - Trading Both ways - No Directional Bias
Dark Green Both Align - Buys Only do not take Sell Trades
Medium Green HTF and Dark Green Mix - Buys Only do not take Sell Trades
Light Red STF - if in a mix with Blanks and greens - Trade Both Directions - if 8 hours of solid Light Green ? Darker Green - do not take Sell Trades - Buys Only
Alert Setting for Change of Direction included
I find this useful - to at least give me a pause for thought when I am about to trade against the trend - I hope you do to

A_HMS_EMAsthis is an indicator that have many essentials in one indicator and prevent from adding many indicator in chart
Ichimoko clouds and 4 ema from number 19 , 33 , 66 , 199
and an spatial average ema with 2 color that help you to find trend
Histomentu is a great Indicator that combine RSI Composit by RSi line and show momentum of price movement by a histogram
for better use note that:
red line is composite line
green line is rsi line
when composite line run away from histogram momemtum increase rapidly
when composite and rsi line is in same way its time to get position .
some futures is hidden by default:
composite red and green signal line
rmi of price with to color with momentum 4
ema 13, 33 of rmi as signal line
finaly u can change any colors from setting
in background we determine some fills for better use of Indicator
for better use note that:
1_pivots show with tiny triangles bellow and above the candles
red triangles for hi pivots and green triangles for low povots
2_ema19 , 66 , 199 shown on chart by default and you can change its source or length from settings
3- ichimoko cloud help you to determine demand and supply zones that those points are price target to go.

DMI Stochastic Extreme Refurbished█ CONCEPTS
DMI Stochastic Extreme was originally published by Barbara Star, PhD, in TASC magazine of January 2013.
Basically it describes an improved version of the ADX DI+/DI- indicator, created by J. Welles Wilder.
In the setup described by the author, the DMI Oscillator is used together with a stochastic oscillator of DMI.
First, the DMI Oscillator is obtained by subtracting the minus directional movement indicator value (DI-) from the plus directional movement value (DI+).
The final result is the "DMI Stochastic Extreme" indicator, in which the stochastic oscillator is calculated. Only instead of using the price value, the stochastic is obtained through the DMI value.
█ Goals
The final indicator described by Barbara is the Stochastic Oscillator of DMI.
However, to use the DMI oscillator together (as described in the magazine), it is necessary to plot it in a separate indicator, which consumes screen space.
That's why the idea of joining both the DMI oscillator and the DMI Stochastic Oscillator into one thing came up, optimizing the visualization.
Taking advantage of the fact that my hands are already dirty :), I created some fine adjustments.
█ HOW TO USE IT
Here are some examples:
1. With default params:
2. With custom DI Length of 21 (Histogram), DI Length of 13 (for Stoch Oscilator), Stoch Length of 5, and another theme.
3. Another params with less noise:
█ THANKS AND CREDITS
- Barbara Star (original creator)
- ucsgears (arrow logic)

Support and Resistance Multiperiod (Zig Zag Based)Support and Resistance Multiperiod (Zig Zag Based)
What is the indicator?
• The indicator is a multi period (up to 5 lengths) Support and Resistance indicator calculated based on Zig Zag.
Who can use?
Scalpers to Long term investors
What timeframe to use?
• Any timeframe
What are the lines?
• Green lines are Support levels.
• Orange lines are Resistance levels.
How to use?
• Buy Low and Sell High.
• Brighter zones means strong Support or Resistance.
• Weaker zones appear lighter.
• Brighter zones are formed by overlapping of lines from multiple levels of support or resistance.
Indicator Menu
• The indicator can input 5 different Lengths.
• The default settings uses 13, 21, 52, 100 & 200.
• Every option are customizable.

The Phi Club RSI3M3 RSI3M3 is a powerful script that generates useful Buy & Sell signals. Use it with a Stoch. Take the sell signals when Stoch is overbought and use the Buy signals when Stoch is Oversold. Stoch settings; K length=13, K smoothing=3, D smoothing=3.

Bears Bulls Impulse [Loxx]Bears Bulls Impulse, originally known as the the Elder-Ray Index, is a technical indicator developed by Dr. Alexander Elder that measures the amount of buying and selling pressure in a market. This indicator consists of two indicators known as "bull power" and "bear power," which are derived from a 13-period moving average.
Included:
- Various average modes to fine-tune the signal
This is an exact clone of the "Bears Bulls Impulse" MT4 indicator


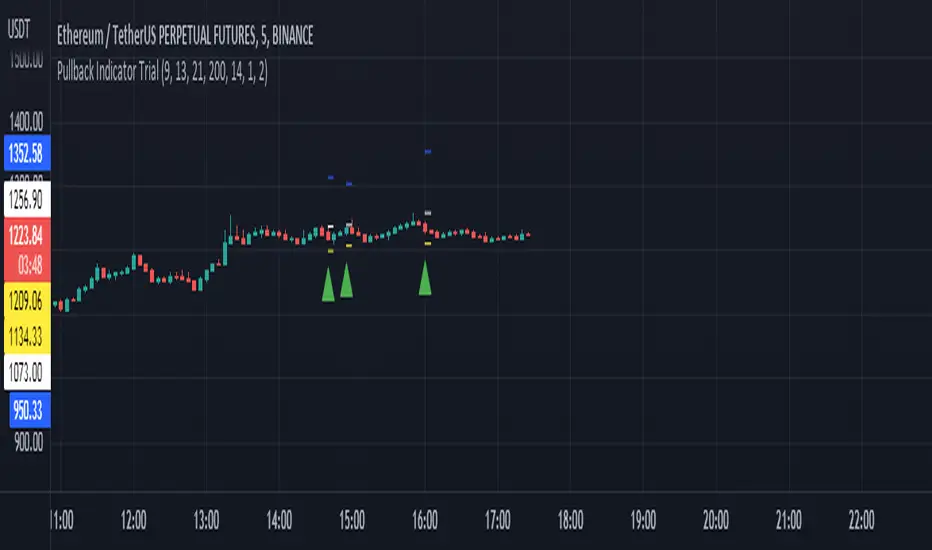
Pullback Indicator Trial- Credits to ZenAndTheArtOfTrading
- Contains 3 EMA's: 8, 13, 21
- Plots Entry Price, Stop Price, and Target Price (Recommend using Stop Market or Stop Limit Orders)
- If Buy Entry Price is not hit and a new Buy signal appears, you can create multiple orders or ignore the new one or cancel the previous and take the new signal. As for Sell signals, do the opposite.
- If Buy Entry Price is not hit and a Sell signal appears, decide to take trade at your own discretion and vice versa(sell side).
Pivot-Point Weighted Moving AverageThe Pivot-Point Weighted MA is very different from other weighted MAs, in the sense that the price weights can achieve negative values. For an example, if a length of 21 is used, the pivot point will be calculated as 13, meaning that the 13th prior candle will have 0 weight, and all prices before it will have a negative weight on the sum, so their impact is reversed rather than just unweighted.
The intent of this is to reduce lag by front-loading the prices. It works better in cyclic markets, and with a longer length, where the inflection point (the one with 0 weight) is aligned with the cyclic turn.
You can configure where the weight starts. If you leave it as 0, it will start with floor(length * 0.66) - 1.
Awesome Oscillator PlusThe Awesome Oscillator is an indicator used to measure market momentum. AO calculates the difference of a 34 Period and 5 Period Simple Moving Averages. The Simple Moving Averages that are used are not calculated using closing price but rather each bar's midpoints. AO is generally used to affirm trends or to anticipate possible reversals.
The Awesome Oscillator's saucer is a trading signal that many analysts use to identify potential rapid changes in momentum. The saucer strategy involves looking for changes in three consecutive bars that are on the same side of the zero line.
AO's saucers can be either bullish or bearish. A bullish saucer can be identified when the awesome oscillator is above the zero line and there are two consecutive red bars – with the second bar being lower than the first – which are followed by a green bar.
On the other hand, a bearish saucer can be identified by two consecutive green bars below the zero line – with the second bar being lower than the first – which are immediately followed by a red bar.
Bullish saucer = Background and green arrow
Bearish saucer = Background and red arrow
Alerts can be triggered when a bullish or bearish saucer occurs.
Blue dots mean that the maximum or minimum of 150 periods has been exceeded (you can change the number of periods). Also added a signal line which can be exchanged for different moving averages.
The MACD line and histogram have a setting of Fast MA = 13, Slow MA = 21 and Signal = 8.
Added light blue dots as bullish signals (MACD line below zero and line crossing) and pink dots as bearish signals (MACD line above zero and line crossing). Alerts can be activated to notify such signals.

Trend MasterThis is a trend aggregator for confirmation and trend signals. It basically aggregates many buy/sell signals and confirmation and by combining them provides a strong buy/sell signal or trend confirmation.
The actual layout idea and trend confirmation is derived from Trend Meter and this indicator uses few other indicator, such as Chandelier Exit, WaveTrend, QQE Signals, Parabolic SAR and AlphaTrend. This indicator aggregates signal from different methods to find out more powerful and confirmed Trend and combines them into one Signal. It also uses Technical Ratings from TradingView team to filter out false signal, it tremendously opts out false signals and improve profitability.
The first seven dots are these
All 3 Trend Meters Now Align
MACD Crossover - Fast - 8, 21, 5
RSI 13: > or < 50
RSI 5: > or < 50
MA Crossover
MA Crossover
Chaikin Money Flow
Alphatrend
Technical Ratings
Then trend
Chandelier Exit
WaveTrend
QQE Signals
Parabolic Sar
All 3 Trend Meters aligns and A signal from trend i
Instructions
Change buy/sell policy based on market trend
Works on all TimeFrame but gives more accuracy on 4H, 1D.
Buy when green big dot appears at the bottom.
Sell when red big dot appears at the bottom.
Red/green dot at the top line appears when three trend meter is aligned and this is a good confirmation.
Any red/green dot below horizontal bars are trend signals.
Big red/green got at the bottom appears whenever there's a good confirmation from trend meter and a buy/sell signal comes from any trend signals.
Also look on the technical ratings bar, green means buy, red means sell and yellow means neutral.
Look for Support or Resistance Levels for price to be attracted to.
Find confluence with other indicators.
The more Trend meters are lit up the better.
Alert
01 Buy Signal = Strong Buy Signal
02 Sell Signal = Strong Sell Signal
03 Buy Signal = Strong Buy Signal
04 Sell Signal = Strong Sell Signal
Thanks to TradingView Technical Ratings authors, evergot, Lij_MC, KivancOzbilgic for their work. This indicator was heavily inspired from their work.

NoBrain BreakoutUse 3min. Time frame.
Buy Stock Selection:-
When Close Price Cross Monthly Standard Pivot R1 & Monthly Standard Pivot R1 is Greater than Previous Day High( PDH ) Or Close.
Price must be Above 44 MA ,48 EMA & Vwap
***Buy When 3min Candle closed Above Camarilla R4 or Monthly Standard Pivot R1 whichever is High.
Sell Stock Selection:-
When Close Price Cross Monthly Standard Pivot S1 & Monthly Standard Pivot S1 is Less than Previous Day Low( PDL ) Or Close.
Price must be Below 44 MA ,48 EMA & Vwap
***Sell When 3min Candle closed Below Camarilla S4 or Monthly Standard Pivot S1 whichever is Low.
Trading time for
1st wave 9.30am to 10.45am.
2nd wave 12.45pm to 2.45pm.
(Based on NSE/ BSE India)
Indicators:-
1) Pivot Points Standard - Time Frame monthly.only select R1
2) Pivot Points Camarilla- Only select R4.
3) SMA 44
4) EMA 48
5) Vwap
6) For Trailing Stop Loss use SuperTrend- Length-13 Factor-2.7 or Length-15 Factor-3 (3min Timeframe)
Moving Averages With Cross AlertsA simple way to add up to 5 moving averages with optional crossover/crossunder alerts.
Available options for Moving Average Type are:
SMA
EMA (default)
HMA
RMA
WMA
VWMA
VWAP
ALMA
By default, 5 moving averages are enabled and set to the following:
MA1 set to 5
MA2 set to 13
MA3 set to 50
MA4 set to 200
MA5 set to 800
Each moving average has the following options:
Enable/Disable
Source (default is close)
Length
Color
Session TPO Market ProfileIntroduction
Wikipedia: A Market Profile is an intra-day charting technique (price vertical, time/activity horizontal) devised by J. Peter Steidlmayer, a trader at the Chicago Board of Trade (CBOT), ca 1959-1985. Steidlmayer was seeking a way to determine and to evaluate market value as it developed in the day time frame. The concept was to display price on a vertical axis against time on the horizontal, and the ensuing graphic generally is a bell shape--fatter at the middle prices, with activity trailing off and volume diminished at the extreme higher and lower prices. In this structure he recognized the 'normal', Gaussian distribution he had been introduced to in college statistics.
Important : The market profile tool is designed to be used on the 30min timeframe, however, you can modify its parameters and use it on lower timeframes (15/10/5min)
This indicators displays the following information
Session open
TPO
Value area calculation zone
POC
Highlight of Single prints
Session High/Low
The current price (TPO Profile is often used isolated without any candlesticks on it)
Parameters
Session beginning configuration (not coded with a session input yet)
Number of candles to use for calculation (default 13 for a single session)
Extend yesterday's levels (VAH/VAL/POC)
Show/Hide Market profile calculation area (background color)
Bars number (number of rows that will be used to draw the profile)
Show/Hide TPO's
TPO Colors customization (For in/out of VA, VAL/VAH/POC/High/Low levels and single prints)
Show/Hide High/Low levels
Show/Hide VAL/VAH/POC Levels as lines
Enable/Disable Single prints highlighting
Value area size (as percent)
Show/Hide current price (corresponding to a line scaled on the "close" price)
Additional Notes
Each session is drawn when the day is over
To use as much space as possible, TPO's are not directly drawn on the area of their calculation (which can be confusing if you use candlesticks directly over it)
This script will probably be updated in the future (especially concerning its implementation which is a bit spaghetti coded for now) .
If you have interesting suggestions about new features that are usual within market profile tools and missing from this script , don't hesitate to suggest it.

Combo 2/20 EMA & Bill Williams Averages. 3Lines This is combo strategies for get a cumulative signal.
First strategy
This indicator plots 2/20 exponential moving average. For the Mov
Avg X 2/20 Indicator, the EMA bar will be painted when the Alert criteria is met.
Second strategy
This indicator calculates 3 Moving Averages for default values of
13, 8 and 5 days, with displacement 8, 5 and 3 days: Median Price (High+Low/2).
The most popular method of interpreting a moving average is to compare
the relationship between a moving average of the security's price with
the security's price itself (or between several moving averages).
WARNING:
- For purpose educate only
- This script to change bars colors.

ka66: Asher Magical MidpointThis Support and Resistance and Trend Channel indicator is based on:
Stocks & Commodities V. 40:13 (20–22): Magical Midpoint Of 52-Week High & Low by Ketan Asher
This indicator seems to work better over higher timeframes, as the article suggested. It also seems to work better with stocks, not so much with currencies. This may be due to the crowd psychology which considers 52-week marks as significant in stocks. The indicator allows configurable lookback periods, and band percentage widths.
Since it's very much price-driven, a useful context for this is some weekly breakout above the midpoint and indication of a rising trend. The bands at the point of breakout can be used as a profit taking point, partial or full, depending on your system.
The article suggests a stop loss at the last week's low, or below the midpoint line depending on the trader's risk appetite.
