Inertia Indicator The inertia indicator measures the market, stock or currency pair momentum and
trend by measuring the security smoothed RVI (Relative Volatility Index).
The RVI is a technical indicator that estimates the general direction of the
volatility of an asset.
The inertia indicator returns a value that is comprised between 0 and 100.
Positive inertia occurs when the indicator value is higher than 50. As long as
the inertia value is above 50, the long-term trend of the security is up. The inertia
is negative when its value is lower than 50, in this case the long-term trend is
down and should stay down if the inertia stays below 50
ค้นหาในสคริปต์สำหรับ "日元美元汇率50年曲线图"

GC RSI Columns V2016This is a basic RSI indicator but in column format.I had been using this for a while and it gives a nice visual representation of trend change by changing color of the column.
Base line is 50 level. Anything above 50 is buy opportunity and below 50 is sell opportunity . Try it on higher time frames and see the results.
Example on chart above.
Note: i published it on demand. many folks were asking me for this ,since it(column rsi) was not available in public indicators

Golden Cross, SMA 200 Moving Average Strategy (by ChartArt)This famous moving average strategy is very easy to follow to decide when to buy (go long) and when to take profit.
The strategy goes long when the faster SMA 50 (the simple moving average of the last 50 bars) crosses above the slower SMA 200. Orders are closed when the SMA 50 crosses below the SMA 200. This simple strategy does not have any other stop loss or take profit money management logic. The strategy does not short and goes long only!
Here is an article explaining the "golden cross" strategy in more detail:
www.stockopedia.com
On the S&P 500 index (symbol "SPX") this strategy worked on the daily chart 81% since price data is available since 1982. And on the DOW Jones Industrial Average (symbol "DOWI") this strategy worked on the daily chart 55% since price data is available since 1916. The low number of trades is in both cases not statistically significant though.
All trading involves high risk; past performance is not necessarily indicative of future results. Hypothetical or simulated performance results have certain inherent limitations. Unlike an actual performance record, simulated results do not represent actual trading. Also, since the trades have not actually been executed, the results may have under- or over-compensated for the impact, if any, of certain market factors, such as lack of liquidity. Simulated trading programs in general are also subject to the fact that they are designed with the benefit of hindsight. No representation is being made that any account will or is likely to achieve profits or losses similar to those shown.

Forex Master v4.0 (EUR/USD Mean-Reversion Algorithm)DESCRIPTION
Forex Master v4.0 is a mean-reversion algorithm currently optimized for trading the EUR/USD pair on the 5M chart interval. All indicator inputs use the period's closing price and all trades are executed at the open of the period following the period where the trade signal was generated.
There are 3 main components that make up Forex Master v4.0:
I. Trend Filter
The algorithm uses a version of the ADX indicator as a trend filter to trade only in certain time periods where price is more likely to be range-bound (i.e., mean-reverting). This indicator is composed of a Fast ADX and a Slow ADX, both using the same look-back period of 50. However, the Fast ADX is smoothed with a 6-period EMA and the Slow ADX is smoothed with a 12-period EMA. When the Fast ADX is above the Slow ADX, the algorithm does not trade because this indicates that price is likelier to trend, which is bad for a mean-reversion system. Conversely, when the Fast ADX is below the Slow ADX, price is likelier to be ranging so this is the only time when the algorithm is allowed to trade.
II. Bollinger Bands
When allowed to trade by the Trend Filter, the algorithm uses the Bollinger Bands indicator to enter long and short positions. The Bolliger Bands indicator has a look-back period of 20 and a standard deviation of 1.5 for both upper and lower bands. When price crosses over the lower band, a Long Signal is generated and a long position is entered. When price crosses under the upper band, a Short Signal is generated and a short position is entered.
III. Money Management
Rule 1 - Each trade will use a limit order for a fixed quantity of 50,000 contracts (0.50 lot). The only exception is Rule
Rule 2 - Order pyramiding is enabled and up to 10 consecutive orders of the same signal can be executed (for example: 14 consecutive Long Signals are generated over 8 hours and the algorithm sends in 10 different buy orders at various prices for a total of 350,000 contracts).
Rule 3 - Every order will include a bracket with both TP and SL set at 50 pips (note: the algorithm only closes the current open position and does not enter the opposite trade once a TP or SL has been hit).
Rule 4 - When a new opposite trade signal is generated, the algorithm sends in a larger order to close the current open position as well as open a new one (for example: 14 consecutive Long Signals are generated over 8 hours and the algorithm sends in 10 different buy orders at various prices for a total of 350,000 contracts. A Short Signal is generated shortly after the 14th Long Signal. The algorithm then sends in a sell order for 400,000 contracts to close the 350,000 contracts long position and open a new short position of 50,000 contracts).

RSI-EMA IndicatorThis indicator calculates and plots 2 separate EMAs of the RSI. The default settings below work great on SPX/SPY daily chart. General rule is if an EMA is above 50, the stock's near term outlook is bullish. If an EMA is below 50, the near term outlook is bearish. Personally, I like to use a fast EMA as a buy signal and a slow EMA as a sell signal.
Default settings:
RSI = 50
EMA1 = 100
EMA2 = 200

High-Low Index [LazyBear]-- Fixed ---
Source: pastebin.com
Fixes an issue with "Combined" mode, using wrong symbols.
--- Original ---
The High-Low Index is a breadth indicator based on Record High Percent, which is based on new 52-week highs and new 52-week lows.
Readings below 50 indicate that there were more new lows than new highs. Readings above 50 indicate that there were more new highs than new lows. 0 indicates there were zero new highs (0% new highs). 100 indicates there was at least 1 new high and no new lows (100% new highs). 50 indicates that new highs and new lows were equal (50% new highs).
Readings consistently above 70 usually coincide with a strong uptrend. Readings consistently below 30 usually coincide with a strong downtrend.
More info:
stockcharts.com
List of my public indicators: bit.ly
List of my app-store indicators: blog.tradingview.com
Just noticed @Greeny has already published this -> Linking it here.

TimWest Long Short FiltersTimWest Long Short Filters
Indicator Has 3 Separate Filters that Create Green(Bullish) or Red(Bearish) BackGround Highlights
If Price is Above or Below a certain LookBack Period - Tim Defaults to 63 on Daily Chart to Quickly View if Price is Above or Below it’s Price 1 Quarter Ago.
A Simple Moving Average Filter - Tim Defaults to 50 SMA and 200 SMA also known as the “Golden Cross”.
A Exponential Moving Average Filter - For Those Who Want To View Shorter Term Market Swings. Defaults to 50 EMA and 100 EMA used By Chuck Hughes, 7 Time World Trading Champion. Chuck Claims the 50/100 EMA's Show the Earliest Change in Market Direction the Equal - Sustainable Moves
Inputs Tab has Checkboxes to Turn On/Off any of the 3 Filters Above.
Reference Chart Post www.tradingview.com

3 projection Indicators - PBands, PO & PBAll these indicators are by Mel Widner.
Projection Bands :
-------------------------------------------------------
These project market data along the trend with the maxima and minima of the projections defining the band. The method provides a way to signal potential direction changes relative to the trend. Usage is like any other trading band.
Projection Oscillator :
-------------------------------------------------------
This indicates the relative position of price with in the bands. It fluctuates between the values 0 to 100. You can configure the "basis" to make it oscillate around a specific value (for ex., basis=50 will make it oscillate between +50 and -50). EMA of PO (length configurable, default is 5) is plotted as a signal line. There is also an option to plot the difference (oscillator - signal), just like MACD histogram. When you see a divergence in this oscillator, remember that it just indicates a potential movement with in the band (for ex., a bullish divergence shown may cause the price to cross the median and move up to the top band).
Projection Bandwidth :
-------------------------------------------------------
This shows the % width of the projection bands. A trend reversal is signaled by a high value. Low value may indicate the start of a new trend. This is also a trend strength indicator.
More info: drive.google.com
Borrowed the color theme for this chart from @liw0. Thanks :)

Multi Indicator Screener# 📊 Multi-Indicator Screener | BB + KC Squeeze + RSI + MACD + ADX
### 🔹 Institutional-Grade Multi-Symbol Scanner with Breakout Alerts
---
## 📌 Overview
The **Multi-Indicator Screener** is an advanced dashboard that monitors **10 symbols simultaneously** with **multi-indicator confluence**:
- 🔹 **Bollinger Bands + Keltner Channel (Squeeze Logic)**
- 🔹 **RSI + MACD Confirmation**
- 🔹 **ADX Trend Strength**
- 🔹 **ATR-based Trailing Stops**
- 🔹 **Volume-Confirmed Breakouts**
Designed for **professional traders**, this screener highlights **high-probability setups** across multiple assets in real time.
---
## ✨ Key Features
### 🔹 Bollinger Band Suite
- ✅ Detects **directional bias** (Bullish / Bearish / Neutral).
- ✅ Marks **Breakouts (Up/Down)** with optional **volume confirmation**.
- ✅ LazyBear-style **Squeeze Detection**:
- 🔒 Squeeze ON → Low volatility, contraction phase.
- 🚀 Squeeze OFF → Breakout potential.
- Neutral → No clear squeeze.
### 🔹 RSI + MACD Confluence
- ✅ RSI confirmation above user-defined threshold (default 55).
- ✅ MACD crossover confirmation.
- ✅ RSI value color-coded in table:
- 🔴 Oversold (<30)
- 🟢 Strong bullish (>60)
- 🟢 Lime (>75 = very strong)
- 🟠 Neutral zone
### 🔹 ADX Trend Strength
- ✅ Displays **ADX value**, plus **+DI / -DI**.
- ✅ ADX > 25 → Highlighted as strong trend.
### 🔹 ATR Trailing Stop Loss
- ✅ Auto-calculated **buy-side trailing stop** & **sell-side trailing stop**.
- ✅ Adjustable via multiplier input.
### 🔹 Multi-Symbol Screener Table
- ✅ Preloaded with **Top 10 Nifty 50 symbols** (customizable).
- ✅ Dashboard columns include:
- Symbol
- BB Direction
- Breakout
- Squeeze Status
- Higher-TF BB Confirmation
- RSI + MACD Signals
- RSI Value
- ADX, +DI, -DI
- Trailing SL (Buy/Sell)
- Volume Confirmation
---
## 🔔 Alerts
Each symbol has **independent breakout alerts**:
- 📢 `Volume-Confirmed BB Breakout Detected`
Alerts fire when a **breakout above/below Bollinger Bands** is confirmed with **above-average volume**.
---
## 📖 How to Use
1. **Select Symbols**
- By default, loads top Nifty 50 stocks.
- Replace with your preferred tickers (`NSE:RELIANCE`, `NASDAQ:AAPL`, `BINANCE:BTCUSDT`, etc.).
2. **Enable Presets**
- **Scalping Mode** → BB Length = 10, Multiplier = 1.5 (more sensitive).
- **Swing Mode** → BB Length = 30, Multiplier = 2.5 (smoother).
3. **Monitor Table**
- Look for **✔️ confirmations** across BB, RSI, MACD, ADX, and Volume.
- Strong setups = multiple confirmations aligning.
4. **Set Alerts**
- Add alerts for your desired symbols to never miss a breakout.
---
## 🎯 Best For
- ✅ Scalpers & Swing Traders
- ✅ Multi-asset monitoring (stocks, forex, crypto)
- ✅ Traders using **volatility breakout + momentum confirmation**
- ✅ Institutional-style dashboard users
---
## ⚠️ Disclaimer
This script is for **educational purposes only**.
It is **not financial advice**. Please backtest before trading.
---

❄️ Lin Kuei Ice Storm Oscillator ❄️❄️ Lin Kuei Ice Storm Oscillator (LKISO) ❄️
What It Does
The Lin Kuei Ice Storm Oscillator combines RSI and Stochastic indicators to create a powerful momentum oscillator that shows market "temperature" - helping you identify optimal entry and exit points with crystal clarity.
🌡️ Thermal Zones
🔥 Melting Point (80-100) - SELL ZONE
Market is overheated and overbought
Look for short opportunities or exit long positions
⚖️ Balance Zone (40-60) - NEUTRAL
Market is in equilibrium
Wait for clear directional signals
🧊 Freezing Point (0-20) - BUY ZONE
Market is overcooled and oversold
Look for long opportunities or exit short positions
📈 Trading Positions
🗡️ Long Position (BUY)
You buy an asset expecting price to rise
Profit when price goes up, lose when price goes down
Example: Buy Bitcoin at $45,000, sell at $50,000 = $5,000 profit
🛡️ Short Position (SELL)
You sell an asset expecting price to fall
Profit when price goes down, lose when price goes up
Example: Short Bitcoin at $50,000, buy back at $45,000 = $5,000 profit
🥷 Trading Modes
Ninja Mode (Conservative)
Fewer signals, higher accuracy
Best for beginners
Warrior Mode (Balanced)
Moderate signals with momentum confirmation
Best for experienced traders
Grandmaster Mode (Aggressive)
Maximum signals, fastest entries
Best for professionals
🎯 Key Signals
BUY Signals
Ice Storm line crosses above 50 (center line)
Bounce from Freezing Point (20 level)
Ice Storm crosses above Frost Signal line
SELL Signals
Ice Storm line crosses below 50 (center line)
Reversal from Melting Point (80 level)
Ice Storm crosses below Frost Signal line
🎨 Visual Features
Dynamic Colors: Lines change color based on momentum intensity
Thermal Zones: Background colors show market temperature
Signal Ribbon: Green = bullish, Red = bearish
Real-time Dashboard: Shows current market condition and position
⚡ Best Practices
Use multiple confirmations - Don't trade on single signals
Respect thermal zones - Extreme readings often reverse
Choose your battle style based on experience level
Combine with proper risk management - Set stop losses
Works best on 1H-1D timeframes for swing trading
🚨 Quick Setup
Add indicator to chart
Choose your battle style (Ninja/Warrior/Grandmaster)
Enable thermal zones and signals
Wait for clear buy/sell signals
Trade with proper position sizing
The LKISO transforms market chaos into crystal-clear trading opportunities through the power of thermal analysis and momentum fusion.

RSI: alternative derivationMost traders accept the Relative Strength Index (RSI) as a standard tool for measuring momentum. But what if RSI is actually a position indicator?
This script introduces an alternative derivation of RSI, offering a fresh perspective on its true nature. Instead of relying on the traditional calculation of average gains and losses, this approach directly considers the price's position relative to its equilibrium (moving average), adjusted for volatility.
While the final value remains identical to the standard RSI, this alternative derivation offers a completely new understanding of the indicator.
Key components:
Price (Close)
Utilizes the closing price, consistent with the original RSI formula.
normalization factor
Transforms raw calculations into a fixed range between -1 and +1.
normalization_factor = 1 / (Length - 1)
EMA of Price
Applies Wilder’s Exponential Moving Average (EMA) to the price, serving as the anchor point for measuring price position, similar to the traditional RSI formula.
myEMA = ta.rma(close,Length)
EMA of close-to-close absolute changes (unit of volatility)
Adjusts for market differences by applying a Wilder’s EMA to absolute price changes (volatility), ensuring consistency across various assets.
CC_vol = ta.rma(math.abs(close - close ),Length)
Calculation Breakdown
DISTANCE:
Calculate the difference between the closing price and its Wilder's EMA. A positive value indicates the price is above the EMA; a negative value indicates it is below.
distance = close - myEMA
STANDARDIZED DISTANCE
Divide the distance by the unit of volatility to standardize the measurement across different markets.
S_distance = distance / CC_vol
NORMALIZED DISTANCE
Normalize the standardized distance using the normalization factor (n-1) to adjust for the lookback period.
N_distance = S_distance * normalization_factor
RSI
Finally, scale the normalized distance to fit within the standard RSI range of 0 to 100.
myRSI = 50 * (1 + N_distance)
The final equation:
RSI = 50 ×
What This Means for RSI
Same RSI Values, Different Interpretation
The standard RSI formula may obscure its true measurement, whereas this approach offers clarity.
RSI primarily indicates the price's position relative to its equilibrium, rather than directly measuring momentum.
RSI can still be used to analyze momentum, but in a more intuitive and well-informed way.

Adaptive Heikin Ashi [CHE]Adaptive Heikin Ashi — volatility-aware HA with fewer fake flips
Summary
Adaptive Heikin Ashi is a volatility-aware reinterpretation of classic Heikin Ashi that continuously adjusts its internal smoothing based on the current ATR regime, which means that in quiet markets the indicator reacts more quickly to genuine directional changes, while in turbulent phases it deliberately increases its smoothing to suppress jitter and color whipsaws, thereby reducing “noise” and cutting down on fake flips without resorting to heavy fixed smoothing that would lag everywhere.
Motivation: why adapt at all?
Classic Heikin Ashi replaces raw OHLC candles with a smoothed construction that averages price and blends each new candle with the previous HA state, which typically cleans up trends and improves visual coherence, yet its fixed smoothing amount treats calm and violent markets the same, leading to the usual dilemma where a setting that looks crisp in a narrow range becomes too nervous in a spike, and a setting that tames high volatility feels unnecessarily sluggish as soon as conditions normalize; by allowing the smoothing weight to expand and contract with volatility, Adaptive HA aims to keep candles readable across shifting regimes without constant manual retuning.
What is different from normal Heikin Ashi?
Fixed vs. adaptive blend:
Classic HA implicitly uses a fixed 50/50 blend for the open update (`HA_open_t = 0.5 HA_open_{t-1} + 0.5 HA_close_{t-1}`), while this script replaces the constant 0.5 with a dynamic weight `w_t` that oscillates around 0.5 as a function of observed volatility, which turns the open update into an EMA-like filter whose “alpha” automatically changes with market conditions.
Volatility as the steering signal:
The script measures volatility via ATR and compares it to a rolling baseline (SMA of ATR over the same length), producing a normalized deviation that is scaled by sensitivity, clamped to ±1 for stability, and then mapped to a bounded weight interval ` `, so the adaptation is strong enough to matter but never runs away.
Outcome that matters to traders:
In high volatility, the weight shifts upward toward the prior HA open, which strengthens smoothing exactly where classic HA tends to “chatter,” while in low volatility the weight shifts downward toward the most recent HA close, which speeds up reaction so quiet trends do not feel artificially delayed; this is the practical mechanism by which noise and fake signals are reduced without accepting blanket lag.
How it works
1. HA close matches classic HA:
`HA_close_t = (Open_t + High_t + Low_t + Close_t) / 4`
2. Volatility normalization:
`ATR_t` is computed over `atr_length`, its baseline is `ATR_SMA_t = SMA(ATR, atr_length)`, and the raw deviation is `(ATR_t / ATR_SMA_t − 1)`, which is then scaled by `adapt_sensitivity` and clamped to ` ` to obtain `v_t`, ensuring that pathological spikes cannot destabilize the weighting.
3. Adaptive weight around 0.5:
`w_t = 0.5 + oscillation_range v_t`, giving `w_t ∈ `, so with a default `range = 0.20` the weight stays between 0.30 and 0.70, which is wide enough to matter but narrow enough to preserve HA identity.
4. EMA-like open update:
On the very first bar the open is seeded from a stable combination of the raw open and close, and thereafter the update is
`HA_open_t = w_t HA_open_{t−1} + (1 − w_t) HA_close_{t−1}`,
which is equivalent to an EMA where higher `w_t` means heavier inertia (more smoothing) and lower `w_t` means stronger pull to the latest price information (more responsiveness).
5. High and low follow classic HA composition:
`HA_high_t = max(High_t, max(HA_open_t, HA_close_t))`,
`HA_low_t = min(Low_t, min(HA_open_t, HA_close_t))`,
thereby keeping visual semantics consistent with standard HA so that your existing reading of bodies, wicks, and transitions still applies.
Why this reduces noise and fake signals in practice
Fake flips in HA typically occur when a fixed blending rule is forced to process candles during a volatility surge, producing rapid alternations around pivots or within wide intrabar ranges; by increasing smoothing exactly when ATR jumps relative to its baseline, the adaptive open stabilizes the candle body progression and suppresses transient color changes, while in the opposite scenario of compressed ranges, the reduced smoothing allows small but persistent directional pressure to reflect in candle color earlier, which reduces the tendency to enter late after multiple slow transitions.
Parameter guide (what each input really does)
ATR Length (default 14): controls both the ATR and its baseline window, where longer values dampen the adaptation by making the baseline slower and the deviation smaller, which is helpful for noisy lower timeframes, while shorter values make the regime detector more reactive.
Oscillation Range (default 0.20): sets the maximum distance from 0.5 that the weight may travel, so increasing it towards 0.25–0.30 yields stronger smoothing in turbulence and faster response in calm periods, whereas decreasing it to 0.10–0.15 keeps the behavior closer to classical HA and is useful if your strategy already includes heavy downstream smoothing.
Adapt Sensitivity (default 6.0): multiplies the normalized ATR deviation before clamping, such that higher sensitivity accelerates adaptation to regime shifts, while lower sensitivity produces gradual transitions; negative values intentionally invert the mapping (higher vol → less smoothing) and are generally not recommended unless you are testing a counter-intuitive hypothesis.
Reading the candles and the optional diagnostic
You interpret colors and bodies just like with normal HA, but you can additionally enable the Adaptive Weight diagnostic plot to see the regime in real time, where values drifting up toward the upper bound indicate a turbulent context that is being deliberately smoothed, and values gliding down toward the lower bound indicate a calm environment in which the indicator chooses to move faster, which can be valuable for discretionary confirmation when deciding whether a fresh color shift is likely to stick.
Practical workflows and combinations
Trend-following entries: use color continuity and body expansion as usual, but expect fewer spurious alternations around news spikes or into liquidity gaps; pairing with structure (swing highs/lows, breaks of internal ranges) keeps entries disciplined.
Exit management: when the diagnostic weight remains elevated for an extended period, you can be stricter with exit triggers because flips are less likely to be accidental noise; conversely, when the weight is depressed, consider earlier partials since the indicator is intentionally more nimble.
Multi-asset, multi-TF: the adaptation is especially helpful if you rotate instruments with very different vol profiles or hop across timeframes, since you will not need to retune a fixed smoothing parameter every time conditions change.
Behavior, constraints, and performance
The script does not repaint historical bars and uses only past information on closed candles, yet just like any candle-based visualization the current live bar will update until it closes, so you should avoid acting on mid-bar flips without a rule that accounts for bar close; there are no `security()` calls or higher-timeframe lookups, which keeps performance light and execution deterministic, and the clamping of the volatility signal ensures numerical stability even during extreme ATR spikes.
Sensible defaults and quick tuning
Start with the defaults (`ATR 14`, `Range 0.20`, `Sensitivity 6.0`) and observe the weight plot across a few volatile events; if you still see too many flips in turbulence, either raise `Range` to 0.25 or trim `Sensitivity` to 4–5 so that the weight can move high but does not overreact, and if the indicator feels too slow in quiet markets, lower `Range` toward 0.15 or raise `Sensitivity` to 7–8 to bias the weight a bit more aggressively downward when conditions compress.
What this indicator is—and is not
Adaptive Heikin Ashi is a context-aware visualization layer that improves the signal-to-noise ratio and reduces fake flips by modulating smoothing with volatility, but it is not a complete trading system, it does not predict the future, and it should be combined with structure, risk controls, and position management that fit your market and timeframe; always forward-test on your instruments, and remember that even adaptive smoothing can delay recognition at sharp turning points when volatility remains elevated.
Disclaimer
The content provided, including all code and materials, is strictly for educational and informational purposes only. It is not intended as, and should not be interpreted as, financial advice, a recommendation to buy or sell any financial instrument, or an offer of any financial product or service. All strategies, tools, and examples discussed are provided for illustrative purposes to demonstrate coding techniques and the functionality of Pine Script within a trading context.
Any results from strategies or tools provided are hypothetical, and past performance is not indicative of future results. Trading and investing involve high risk, including the potential loss of principal, and may not be suitable for all individuals. Before making any trading decisions, please consult with a qualified financial professional to understand the risks involved.
By using this script, you acknowledge and agree that any trading decisions are made solely at your discretion and risk.
Best regards and happy trading
Chervolino

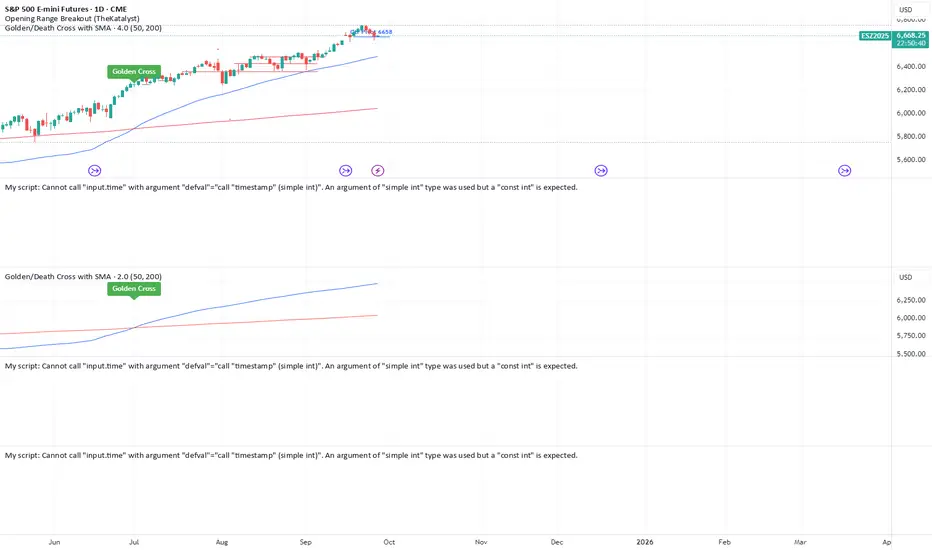
Golden/Death Cross with SMAGolden Cross: Triggered when the 50 SMA crosses above the 200 SMA.
Death Cross: Triggered when the 50 SMA crosses below the 200 SMA.
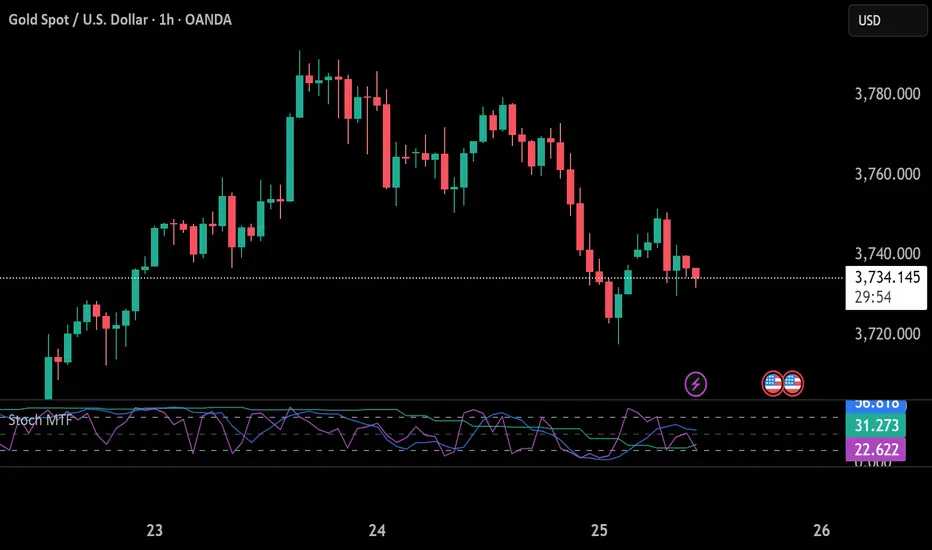
Stochastic 6TF by jjuiiStochastic 6TF by J is a Multi-Timeframe (MTF) Stochastic indicator
that displays %K values from up to 6 different timeframes
in a single window. This helps traders analyze momentum
across short, medium, and long-term perspectives simultaneously.
Features:
- Supports 6 customizable timeframes (e.g., 5m, 15m, 1h, 4h, 1D, 1W)
- Option to show/hide each timeframe line
- Standard reference levels (20 / 50 / 80) with background shading
- Smoothed %K for clearer visualization
Best for:
- Cross-timeframe momentum analysis
- Spotting aligned Overbought / Oversold signals
- Confirming market trends and timing entries/exits
-------------------------------------------------------------
Stochastic 6TF by J คืออินดิเคเตอร์ Stochastic Multi Timeframe (MTF)
ที่สามารถแสดงค่า %K จากหลายกรอบเวลา (สูงสุด 6 TF)
ไว้ในหน้าต่างเดียว ช่วยให้นักเทรดมองเห็นโมเมนตัมของราคา
ทั้งระยะสั้น กลาง และยาว พร้อมกัน
คุณสมบัติ:
- เลือกกรอบเวลาได้ 6 ชุด (เช่น 5m, 15m, 1h, 4h, 1D, 1W)
- สามารถเปิด/ปิดการแสดงผลแต่ละ TF ได้
- มีเส้นแนวรับ/แนวต้านมาตรฐาน (20 / 50 / 80)
- ใช้เส้น %K ที่ถูกปรับค่าเฉลี่ยให้เรียบขึ้นเพื่ออ่านง่าย
เหมาะสำหรับ:
- การดูโมเมนตัมข้ามกรอบเวลา
- หาจังหวะ Overbought / Oversold ที่สอดคล้องกันหลาย TF
- ใช้ยืนยันแนวโน้มและหาจังหวะเข้า-ออกอย่างแม่นยำมากขึ้น
INFLECTION NEXUS - SPAINFLECTION NEXUS - SPA (Shadow Portfolio Adaptive)
Foreword: The Living Algorithm
For decades, technical analysis has been a conversation between a trader and a static chart. We apply our indicators with their fixed-length inputs, and we hope that our rigid tools can somehow capture the essence of a market that is fluid, chaotic, and perpetually evolving. When our tools fail, we are told to "adapt." But what if the tools themselves could learn that lesson? What if our indicators could adapt not just for us, but with us?
This script, INFLECTION NEXUS - SPA, is the realization of that vision. It is an advanced analytical framework built around a revolutionary core: the Shadow Portfolio Adaptive (SPA) Engine . The buy and sell signals you see on the chart are an evolution of the logic from my previous work, "Turning Point." However, this is not a simple combination of two scripts. The SPA engine so fundamentally transforms the nature of the analysis that it creates an entirely new class of indicator. This publication is a showcase of that groundbreaking, self-learning engine.
This system is undeniably complex. When you first load it, the sheer volume of information may feel overwhelming. That is a testament to the depth of its analysis. This guide is designed to be your comprehensive manual, to break down every single component, every color, every number, into simple, understandable concepts. By the end of this document, you will not only master its functions but will also possess a deeper understanding of the market dynamics it is designed to reveal.
Chapter 1: The Paradigm Shift - Why the SPA Engine is a Leap Forward
To grasp the innovation here, we must first deconstruct the severe limitations of traditional "adaptive" indicators.
Part A: The Traditional Model - Driving by the Rear-View Mirror
Conventional "adaptive" systems are fundamentally reactive. They operate on a slow, inefficient loop: they wait for their own specific, biased signal to fire, wait for that trade to close, and only after a long and statistically significant "warm-up" period of 50-100 trades do they finally make a small, retrospective adjustment. They are always adapting to a market that no longer exists.
Part B: The SPA Model - The Proactive Co-Pilot
The Shadow Portfolio Adaptive (SPA) engine is a complete re-imagining of this process. It is not reactive; it is proactive, data-saturated, and instantly aware.
Continuous, Unbiased Learning: The SPA engine does not wait for a signal to learn. Its Shadow Portfolio is constantly running 5-bar long and short trades in the background. It learns from every single 5-bar slice of market action , giving it a continuous, unbiased stream of performance data. It is the difference between reading a textbook chapter and having a live sparring partner in the ring 24/7.
Instantaneous Market Awareness - The End of the "Warm-Up": This is the critical innovation. The SPA engine does not require a 100-trade warm-up period. The learning does not start after 50 trades; it begins on the 6th bar of the chart when the first shadow trade closes. From that moment on, the system is market-aware, analyzing data, and capable of making intelligent adjustments. The SPA engine is not adapting to old wins and losses. It is adapting, in near real-time, to the market's ever-shifting character, volatility, and personality.
Chapter 2: The Anatomy of the SPA Engine - A Granular Deep Dive
The engine is composed of three primary systems that work in a sophisticated, interconnected symphony.
Section 1: The Shadow Portfolio (The Information Harvester)
What it is, Simply: Think of this as the script's eyes and ears. It's a team of 10 virtual traders (5 long, 5 short) who are constantly taking small, quick trades to feel out the market.
How it Works, Simply: On every new bar, a new "long" trader and a new "short" trader enter the market. Exactly 5 bars later, they close their positions. This cycle is perpetual and relentless.
The Critical 'Why': Because these virtual traders enter and exit based on a fixed time (5 bars), not on a "good" or "bad" signal, their results are completely unbiased . They are simply measuring: "What happened to price over the last 5 bars?" This provides the raw, untainted truth about the market's behavior that the rest of the system needs to learn effectively.
The Golden Metric (ATR Normalization): The engine doesn't just look at dollar P&L. It's smarter than that. It asks a more intelligent question: "How much did this trade make relative to the current volatility?"
Analogy: Imagine a flea and an elephant. If they both jump 1 inch, who is more impressive? The flea. The SPA engine understands this. A $10 profit when the market is dead quiet is far more significant than a $10 profit during a wild, volatile swing.
The Formula: realized_atr = (close - trade.entry) / trade.atr_entry. It takes the raw profit and divides it by the Average True Range (a measure of volatility) at the moment of entry. This gives a pure, "apples-to-apples" score for every single trade, which is the foundational data point for all learning.
Section 2: The Cognitive Map (The Long-Term Brain)
What it is, Simply: This is the engine's deep memory, its library of experiences. Imagine a giant, 64-square chessboard (8x8 grid). Each square on the board represents a very specific type of market environment.
The Two Dimensions of Thought (The 'How'): How does it know which square we are on? It looks at two things:
The Market's Personality (X-Axis): Is the market behaving like a disciplined soldier, marching in a clear trend? Or is it like a chaotic, unpredictable child, running all over the place? The engine calculates a "Regime" score to figure this out.
The Market's Energy Level (Y-Axis): Is the market sleepy and quiet, or is it wide-awake and hyperactive? The engine measures "Normalized Volatility" to determine this.
The Power of Generalization (The 'Why'): When a Shadow Portfolio trade closes, its result is recorded in the corresponding square on the chessboard. But here's the clever part: it also shares a little bit of that lesson with the squares immediately next to it (using a Gaussian Kernel).
Analogy: If you touch a hot stove and learn "don't touch," your brain is smart enough to know you probably shouldn't touch the hot oven door next to it either, even if you haven't touched it directly. The Cognitive Map does the same thing, allowing it to make intelligent inferences even in market conditions it has seen less frequently. Each square remembers what indicator settings worked best in that specific environment.
Section 3: The Adaptive Engine (The Central Nervous System)
What it is, Simply: This is the conductor of the orchestra. It takes information from all other parts of the system and decides exactly what to do.
The Symphony of Inputs: It listens to three distinct sources of information before making a decision:
The Short-Term Memory (Rolling Stats): It looks at the performance of the last rollN shadow trades. This is its immediate, recent experience.
The Long-Term Wisdom (Cognitive Map): It consults the grand library of the Cognitive Map to see what has worked best in the current market type over the long haul.
The Gut Instinct (Bin Learning): It keeps a small "mini-batch" of the most recent trades. If this batch shows a very strong, sudden pattern, it can trigger a rapid, reflexive adjustment, like pulling your hand away from a flame.
The Fusion Process: It then blends these three opinions together in a sophisticated way. It gives more weight to the opinions it's more confident in (e.g., a Cognitive Map square with hundreds of trades of experience) and uses your Adaptation Intensity (dialK) input to decide how much to listen to its "gut instinct." The final decision is then smoothed to ensure the indicator's parameters change in a stable, intelligent way.
Chapter 3: The Control Panel - A Novice's Guide to Every Input
This is the most important chapter. Let's break down what these confusing settings actually do in the simplest terms possible.
--- SECTION 1: THE DRIVER'S SEAT (SIGNAL ENGINE & BASE SETTINGS) ---
🧾 Signal Engine (Turning Point):
What it is: These are the rules for the final BUY and SELL signs.
Think of it like this: The SPA engine is the smart robot that tunes your race car. These settings are you, the driver, telling the robot what kind of race you're in.
Enable Reversal Mode: You tell the robot, "I want to race on a curvy track with lots of turns." The robot will tune the car to be agile for catching tops and bottoms.
Enable Breakout Mode: You tell the robot, "I want to race on a long, straight track." The robot will tune the car for pure speed to follow the trend.
Require New Extreme: This is a quality filter. It tells the driver, "Don't look for a turn unless we've just hit a new top speed on the straightaway." It makes sure the reversal is from a real extreme.
Min Bars Between Signals: This is the "pit stop" rule. You're telling the robot, "After you show me a sign, wait at least 10 bars before showing another one, so I don't get confused."
⚡ ATR Bands (Base Inputs):
What they are: These are the starting settings for your car before the robot starts tuning it. These are your factory defaults.
Sensitivity: This is the "Bump Detector." A low number means the car feels every tiny pebble on the road. A high number means it only notices the big speed bumps. You want to set it so it notices the important bumps (real market structure) but ignores the pebbles (noise).
ATR Period & Multiplier: These set the starting size of the "safety lane" (the green and blue bands) around your car. The robot's main job is to constantly adjust the size of this safety lane to perfectly fit the current road conditions.
📊 & 📈 Filter Settings (RSI & Volume):
What they are: These are your co-pilot's confirmation checks.
Enable RSI Filter: Your co-pilot will check the "Engine Temperature" (RSI). He won't let you hit the gas (BUY) if the engine is already overheating (overbought).
RSI Length & Lookbacks: These tune how your co-pilot's temperature gauge works. The defaults are standard.
Require Volume Spike: Your co-pilot will check the "Crowd Noise" (Volume). He won't give you a signal unless he hears the crowd roar, confirming that a lot of people are interested in this move.
🎯 Signal Quality Control:
Enable Major Levels Only: This tells your co-pilot to be extra picky. He will only confirm signals that happen after a huge, powerful move, ignoring all the small stuff.
--- SECTION 2: THE ROBOT'S BRAIN (ENGINE & LEARNING CONTROLS) ---
🎛️ Master Control:
Adaptation Intensity (dialK): THIS IS THE ROBOT'S PERSONALITY DIAL.
Turn it DOWN (1-5): The robot becomes a "Wise Old Professor." It thinks very slowly and carefully, gathers lots of data, and only makes a change when it is 100% sure. Its advice is very reliable but might come a little late.
Turn it UP (15-20): The robot becomes a "Hyper-Reactive Teenager." It has a short attention span, reacts instantly to everything it sees, and changes its mind constantly. It's super-fast to new information but might get faked out a lot.
The Default (10): A "Skilled Professional." The perfect balance of thoughtful and responsive. Start here.
🧠 Adaptive Engine:
Enable Adaptive System: This is the main power button for your robot. Turn it off, and you're driving a normal, non-smart car. Turn it on, and the robot takes over the tuning.
Use Shadow Cycle: This turns on the robot's "practice laps." The robot can't learn without practicing. This must be on for the robot to work.
Lock ATR Bands: This is a visual choice. "Locked" means the safety lanes on your screen stay where your factory defaults put them (the robot still makes changes to the signals in the background). "Unlocked" means you see the safety lanes moving and changing shape in real-time as the robot tunes them.
🎯 Learning (Global + Risk):
What they are: These are the deep-level settings for how your robot's brain processes information.
Rolling Window Size: This is the robot's "Short-Term Memory." How many of the last few practice laps should it remember? A small number means it only cares about what just happened. A big number means it remembers the last hour of practice.
Learn Rate & Smooth Alpha: This is "How big of a change should the robot make?" and "How smoothly should it make the change?" Think of it as turning the steering wheel. A high learn rate is like yanking the wheel; a low one is like a gentle turn. The smoothing makes sure the turn is graceful.
WinRate Thresholds & PnL Cap: These are rules for the robot's learning. They tell it what a "good" or "bad" outcome looks like and tell it to ignore crazy, once-in-a-lifetime events so its memory doesn't get corrupted.
--- SECTION 3: THE GARAGE (RISK, MEMORY & VISUALS) ---
⚠️ Risk Management:
What they are: These are safety rules you can give to your co-pilot for your own awareness. They appear on the dashboard.
The settings: You can set a max number of trades, a max loss for the day, and a "time out" period after a few losses.
Apply Risk to Shadow: This is an important switch. If you turn this ON, your safety rules also apply to the robot's practice laps. If you hit your max loss, the robot stops practicing and learning. It's recommended to leave this OFF so the robot can learn 24/7, even if you have stopped trading.
🗺️ Cognitive Map, STM & Checkpoints:
What it is: The robot's "Long-Term Memory" or its entire library of racing experience.
Use Cognitive Map & STM: These switches turn on the long-term and short-term memory banks. You want these on for the smartest robot.
Map Settings (Grid, Sigma, Half-Life): These are very advanced settings for neuroscientists. They control how the robot's brain is structured and how it forgets old information. The defaults are expertly tuned.
The Checkpoint System: This is the "Save Your Game" button for the robot.
To Save: Check Emit Checkpoint Now. Go to your alert log, and you will see a very long password. Copy this password.
To Load: Paste that password into the Memory Checkpoint box. Then, check Apply Checkpoint On Next Bar. The robot will instantly download all of its saved memories and experience.
🎨 Visuals & 🧩 Display Params:
What they are: These are all about how your screen looks.
You can control everything: The size and shape of the little diamonds (Entry Orbs), whether you see the purple Adapt Pulse, and where the Dashboards appear on your screen. You can change the Theme to Dark, Light, or Neon. These settings don't change how the robot thinks, only how it presents its information to you.
Chapter 4: The Command Center - Decoding the Dashboard
PANEL A (INFLECTION NEXUS): Your high-level mission control, showing the engine's classification of the current Market Context and the performance summary of the Shadow Portfolio.
PANEL B (SHADOW PORTFOLIO ADAPTIVE): Your deep diagnostic screen.
Performance Metrics: View advanced risk-adjusted stats like the Sharpe Ratio to understand the quality of the market movements the engine is learning from.
Adaptive Parameters (Live vs Base): THIS IS THE MOST CRITICAL SECTION. It shows the engine's Live parameters right next to your (Base) inputs. When the Live values deviate, the engine is communicating its learned wisdom to you. For example, a Live ATR Multiplier of 2.5 versus your Base of 1.4 is the engine telling you: "Caution. The market is currently experiencing high fake-outs and requires giving positions more room to breathe." This section is a direct translation of the engine's learning into actionable insight.
Chapter 5: Reading the Canvas - On-Chart Visuals
The Bands (Green/Blue Lines): These are not static Supertrend lines. They are the physical manifestation of the engine's current thinking. As the engine learns and adapts its ATR Period and Multiplier, you will see these bands widen, tighten, and adjust their distance from price. They are alive.
The Labels (BUY/SELL): These are the final output of the "Turning Point" logic, now supercharged and informed by the fully adaptive SPA engine.
The Purple Pulse (Dot and Background Glow): This is your visual cue that the engine is "thinking." Every time you see this pulse, it means the SPA has just completed a learning cycle and updated its parameters. It is actively recalibrating itself to the market.
Chapter 6: A Manifesto on Innovation and Community
I want to conclude with a personal note on why I dedicate countless hours to building systems like this and sharing them openly.
My purpose is to drive innovation, period. I am not in this space to follow the crowd or to re-package old ideas. The world does not need a 100th version of a slightly modified MACD. Real progress, real breakthroughs, come from venturing into the wilderness, from asking "what if?" and from pursuing concepts that lie at the very edge of possibility.
I am not afraid of being wrong. I am not afraid of being bested by my peers. In fact, I welcome it. If another developer takes an idea from this engine, improves it, and builds something even more magnificent, that is a profound win for our entire community. The only failure I recognize is the failure to try. The only trap I fear is the creative complacency of producing sterile, recycled work just to appease the status quo.
I love this community, and I believe with every fiber of my being that we have barely scratched the surface of what can be discovered and created. This script is my contribution to that shared journey. It is a tool, an idea, and a challenge to all of us: let's keep pushing.
DISCLAIMER: This script is an advanced analytical tool provided for educational and research purposes ONLY. It does not constitute financial advice. All trading involves substantial risk of loss. Past performance is not indicative of future results. Please use this tool responsibly and as part of a comprehensive trading plan.
As the great computer scientist Herbert A. Simon, a pioneer of artificial intelligence, famously said:
"Learning is any process by which a system improves performance from experience."
*Tooltips were updated with a comprehensive guide
May this engine enhance your experience.
— Dskyz, for DAFE Trading Systems

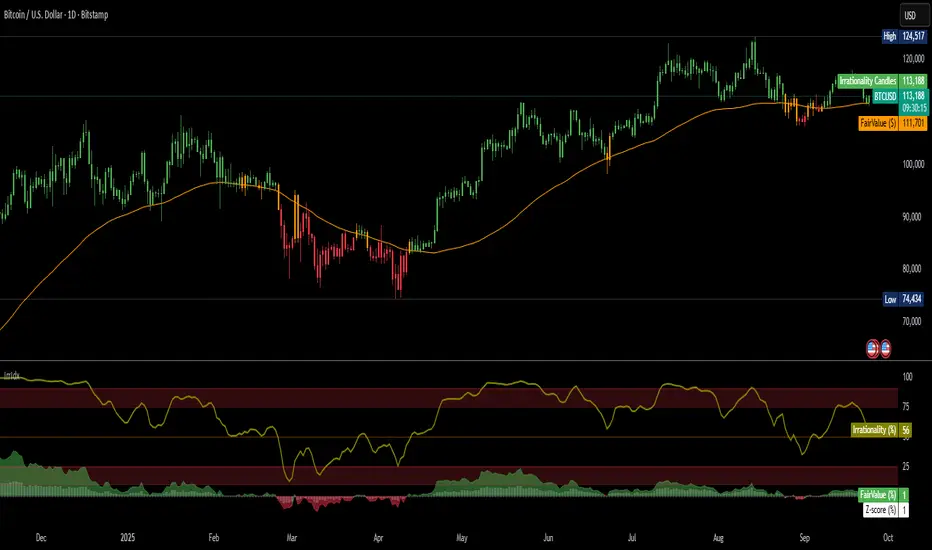
Irrationality Index by CRYPTO_ADA_BTC"The market can be irrational longer than you can stay solvent" ~ John Maynard Keynes
This indicator, the Irrationality Index, measures how far the current market price has deviated from a smoothed estimate of its "fair value," normalized for recent volatility. It provides traders with a visual sense of when the market may be behaving irrationally, without giving direct buy or sell signals.
How it works:
1. Fair Value Calculation
The indicator estimates a "fair value" for the asset using a combination of a long-term EMA (exponential moving average) and a linear regression trend over a configurable period. This fair value serves as a smoothed baseline for price, balancing trend-following and mean-reversion.
2. Volatility-Adjusted Z-Score
The deviation between price and fair value is measured in standard deviations of recent log returns:
Z = (log(price) - log(fairValue)) / volatility
This standardization accounts for different volatility environments, allowing comparison across assets.
3. Irrationality Score (0–100)
The Z-score is transformed using a logistic mapping into a 0–100 scale:
- 50 → price near fair value (rational zone)
- >75 → high irrationality, price stretched above fair value
- >90 → extreme irrationality, unsustainable extremes
- <25 → high irrationality, price stretched below fair value
- <10 → extreme bearish irrationality
4. Price vs Fair Value (% deviation)
The indicator plots the percentage difference between price and fair value:
pctDiff = (price - fairValue) / fairValue * 100
- Positive values → Percentage above fair value (optimistic / overvalued)
- Negative values → Percentage below fair value (pessimistic / undervalued)
Visuals:
- Irrationality (%) Line (0–100) shows irrationality level.
- Background Colors: Yellow= high bullish irrationality, Green= extreme bullish irrationality, Orange= high bearish irrationality, Red= extreme bearish irrationality.
- Price - FairValue (%) plot: price deviation vs fair value (%), Colored green above 0 and red below 0.
- Label: display actual price, estimated fair value, and Z-score for the latest bar.
- Alerts: configurable thresholds for high and extreme irrationality.
How to read it:
- 50 → Market trading near fair value.
- >75 / >90 → Price may be irrationally high; risk of pullback increases.
- <25 / <10 → Price may be irrationally low; potential rebound zones, but trends can continue.
- Price - FairValue (%) plot → visual guide for % price stretch relative to fair value.
Notes / Warnings:
- Measures relative deviation, not fundamental value!
- High irrationality scores do not automatically indicate trades; markets can remain can be irrational longer than you can stay solvent .
- Best used with other tools: momentum, volume, divergence, and multi-timeframe analysis.