Multiple Ema 20/50/100Multiple Ema 20/50/100 and you can add more EMA Plot easily by changing the codes.
ค้นหาในสคริปต์สำหรับ "摩根纳斯达克100基金风险大吗"

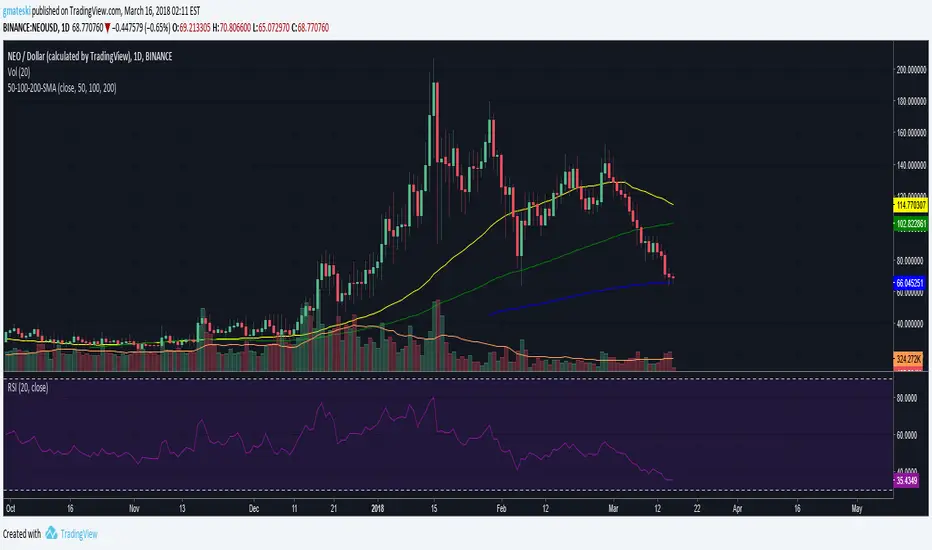

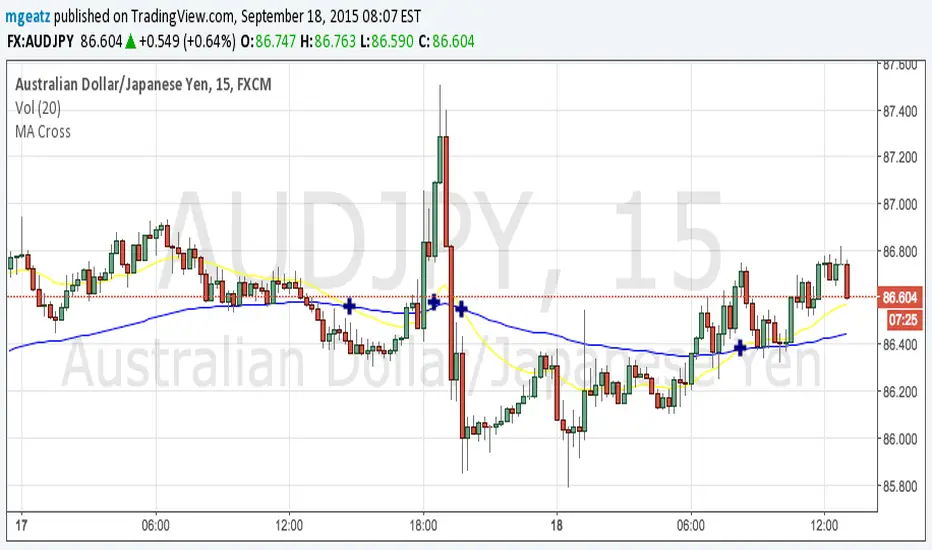
50, 100, 200 EMAsA simple script that displays the 50, 100, and 200-period exponential moving averages. Reduce clutter by combining them into one indicator!

50, 100, 200 SMAsA simple script that displays the 50, 100, and 200-period simple moving averages. Reduce clutter by combining them into one indicator!

50,100,200 MA by CryptoLife71(FIXED)Updated the code by CryptoLife71 so that the 200ma shows correctly.


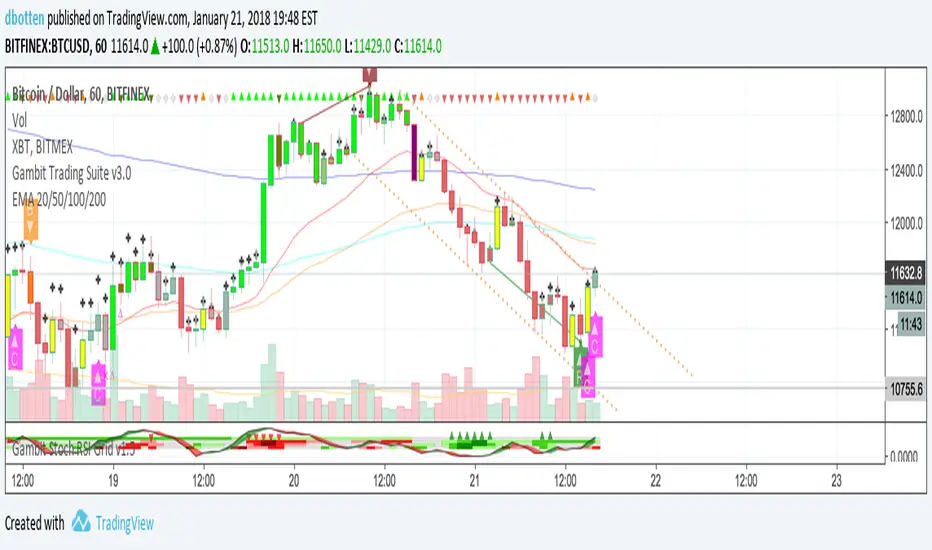
EMA 20/50/100/200Plots exponential moving average on four timeframes at once for rapid indication of momentum shift as well as slower-moving confirmations.
Displays EMA 20, 50, 100, and 200... default colors are hotter for faster timeframes, cooler for slower ones
DECL: 3 X Moving Average (50, 100 and 200 day)Basic Moving Average with 3 different intervals. Default: 50 day (blue), 100 day (red) and 200 day (purple)


BB 100 with Barcolors6/19/15 I added confirmation highlight bars to the code. In other words, if a candle bounced off the lower Bollinger band, it needed one more close above the previous candle to confirm a higher probability that a change in investor sentiment has reversed. Same is true for upper Bollinger band bounces. I also added confirmation highlight bars to the 100 sma (the basis). The idea is that lower and upper bands are potential points of support and resistance. The same is true of the basis if a trend is to continue. 6/28/15 I added a plotshape to identify closes above/below TLine. One thing this system points out is it operates best in a trend reversal. Consolidations will whipsaw the indicator too much. I have found that when this happens, if using daily candles, switch to hourly, 30 min, etc., to catch a better signal. Nothing moves in a straight line. As with any indicator, it is a tool to be used in conjunction with the art AND science of trading. As always, try the indicator for a time so that you are comfortable enough to use real money. This is designed to be used with "BB 25 with Barcolors".

BB 100 with Barcolors6/19/15 I added confirmation highlight bars to the code. In other words, if a candle bounced off the lower Bollinger band, it needed one more close above the previous candle to confirm a higher probability that a change in investor sentiment has reversed. Same is true for upper Bollinger band bounces. I also added confirmation highlight bars to the 100 sma (the basis). The idea is that lower and upper bands are potential points of support and resistance. The same is true of the basis if a trend is to continue. Nothing moves in a straight line. As with any indicator, it is a tool to be used in conjunction with the art AND science of trading. As always, try the indicator for a time so that you are comfortable enough to use real money. This is designed to be used with "BB 25 with Barcolors".
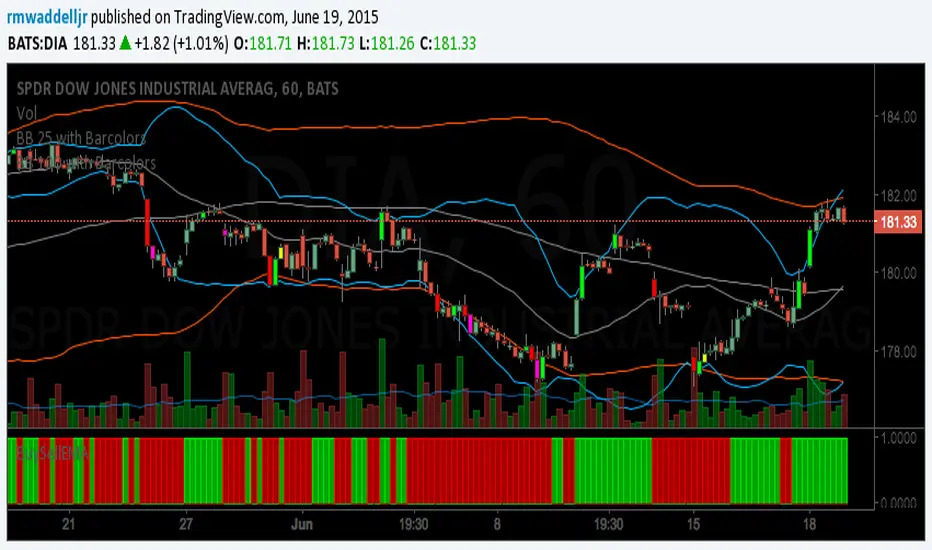
BB 100 with BarcolorsI cleaned up the highlight barcolor to reflect red or lime depending if it closed > or < the open.
The description is in the code. you want to catch bounces off the 25 (upper or lower) and 100 (upper or lower).
Works well on the hourly and 30 min charts. Haven't tested it beyond that. Haven't tested Forex, just equities.

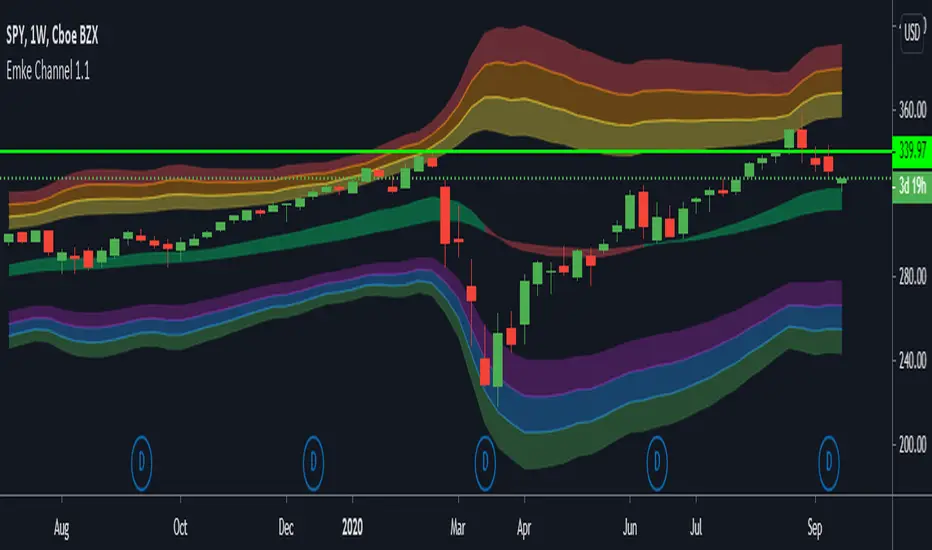
EMA Keltner Channel 1D100/200 EMAs, along with Keltner Bands based off them. Colors correspond to actions you should be ready to take in the area. Use to set macro mindset.
Uses the security function to display only the 1D values.
Red= Bad
Orange = Not as Bad, but still Bad.
Yellow = Warning, might also be Bad.
Purple = Dip a toe in.
Blue = Give it a shot but have a little caution.
Green = It's second mortgage time.
Volume Delta Volume Signals by Claudio [hapharmonic]// This Pine Script™ code is subject to the terms of the Mozilla Public License 2.0 at mozilla.org
// © hapharmonic
//@version=6
FV = format.volume
FP = format.percent
indicator('Volume Delta Volume Signals by Claudio ', format = FV, max_bars_back = 4999, max_labels_count = 500)
//------------------------------------------
// Settings |
//------------------------------------------
bool usecandle = input.bool(true, title = 'Volume on Candles',display=display.none)
color C_Up = input.color(#12cef8, title = 'Volume Buy', inline = ' ', group = 'Style')
color C_Down = input.color(#fe3f00, title = 'Volume Sell', inline = ' ', group = 'Style')
// ✅ Nueva entrada para colores de señales
color buySignalColor = input.color(color.new(color.green, 0), "Buy Signal Color", group = "Signals")
color sellSignalColor = input.color(color.new(color.red, 0), "Sell Signal Color", group = "Signals")
string P_ = input.string(position.top_right,"Position",options = ,
group = "Style",display=display.none)
string sL = input.string(size.small , 'Size Label', options = , group = 'Style',display=display.none)
string sT = input.string(size.normal, 'Size Table', options = , group = 'Style',display=display.none)
bool Label = input.bool(false, inline = 'l')
History = input.bool(true, inline = 'l')
// Inputs for EMA lengths and volume confirmation
bool MAV = input.bool(true, title = 'EMA', group = 'EMA')
string volumeOption = input.string('Use Volume Confirmation', title = 'Volume Option', options = , group = 'EMA',display=display.none)
bool useVolumeConfirmation = volumeOption == 'none' ? false : true
int emaFastLength = input(12, title = 'Fast EMA Length', group = 'EMA',display=display.none)
int emaSlowLength = input(26, title = 'Slow EMA Length', group = 'EMA',display=display.none)
int volumeConfirmationLength = input(6, title = 'Volume Confirmation Length', group = 'EMA',display=display.none)
string alert_freq = input.string(alert.freq_once_per_bar_close, title="Alert Frequency",
options= ,group = "EMA",
tooltip="If you choose once_per_bar, you will receive immediate notifications (but this may cause interference or indicator repainting).
\n However, if you choose once_per_bar_close, it will wait for the candle to confirm the signal before notifying.",display=display.none)
//------------------------------------------
// UDT_identifier |
//------------------------------------------
type OHLCV
float O = open
float H = high
float L = low
float C = close
float V = volume
type VolumeData
float buyVol
float sellVol
float pcBuy
float pcSell
bool isBuyGreater
float higherVol
float lowerVol
color higherCol
color lowerCol
//------------------------------------------
// Calculate volumes and percentages |
//------------------------------------------
calcVolumes(OHLCV ohlcv) =>
var VolumeData data = VolumeData.new()
data.buyVol := ohlcv.V * (ohlcv.C - ohlcv.L) / (ohlcv.H - ohlcv.L)
data.sellVol := ohlcv.V - data.buyVol
data.pcBuy := data.buyVol / ohlcv.V * 100
data.pcSell := 100 - data.pcBuy
data.isBuyGreater := data.buyVol > data.sellVol
data.higherVol := data.isBuyGreater ? data.buyVol : data.sellVol
data.lowerVol := data.isBuyGreater ? data.sellVol : data.buyVol
data.higherCol := data.isBuyGreater ? C_Up : C_Down
data.lowerCol := data.isBuyGreater ? C_Down : C_Up
data
//------------------------------------------
// Get volume data |
//------------------------------------------
ohlcv = OHLCV.new()
volData = calcVolumes(ohlcv)
// Plot volumes and create labels
plot(ohlcv.V, color=color.new(volData.higherCol, 90), style=plot.style_columns, title='Total',display = display.all - display.status_line)
plot(ohlcv.V, color=volData.higherCol, style=plot.style_stepline_diamond, title='Total2', linewidth = 2,display = display.pane)
plot(volData.higherVol, color=volData.higherCol, style=plot.style_columns, title='Higher Volume', display = display.all - display.status_line)
plot(volData.lowerVol , color=volData.lowerCol , style=plot.style_columns, title='Lower Volume',display = display.all - display.status_line)
S(D,F)=>str.tostring(D,F)
volStr = S(math.sign(ta.change(ohlcv.C)) * ohlcv.V, FV)
buyVolStr = S(volData.buyVol , FV )
sellVolStr = S(volData.sellVol , FV )
// ✅ MODIFICACIÓN: Porcentaje sin decimales
buyPercentStr = str.tostring(math.round(volData.pcBuy)) + " %"
sellPercentStr = str.tostring(math.round(volData.pcSell)) + " %"
totalbuyPercentC_ = volData.buyVol / (volData.buyVol + volData.sellVol) * 100
sup = not na(ohlcv.V)
if sup
TC = text.align_center
CW = color.white
var table tb = table.new(P_, 6, 6, bgcolor = na, frame_width = 2, frame_color = chart.fg_color, border_width = 1, border_color = CW)
tb.cell(0, 0, text = 'Volume Candles', text_color = #FFBF00, bgcolor = #0E2841, text_halign = TC, text_valign = TC, text_size = sT)
tb.merge_cells(0, 0, 5, 0)
tb.cell(0, 1, text = 'Current Volume', text_color = CW, bgcolor = #0B3040, text_halign = TC, text_valign = TC, text_size = sT)
tb.merge_cells(0, 1, 1, 1)
tb.cell(0, 2, text = 'Buy', text_color = #000000, bgcolor = #92D050, text_halign = TC, text_valign = TC, text_size = sT)
tb.cell(1, 2, text = 'Sell', text_color = #000000, bgcolor = #FF0000, text_halign = TC, text_valign = TC, text_size = sT)
tb.cell(0, 3, text = buyVolStr, text_color = CW, bgcolor = #074F69, text_halign = TC, text_valign = TC, text_size = sT)
tb.cell(1, 3, text = sellVolStr, text_color = CW, bgcolor = #074F69, text_halign = TC, text_valign = TC, text_size = sT)
tb.cell(0, 5, text = 'Net: ' + volStr, text_color = CW, bgcolor = #074F69, text_halign = TC, text_valign = TC, text_size = sT)
tb.merge_cells(0, 5, 1, 5)
tb.cell(0, 4, text = buyPercentStr, text_color = CW, bgcolor = #074F69, text_halign = TC, text_valign = TC, text_size = sT)
tb.cell(1, 4, text = sellPercentStr, text_color = CW, bgcolor = #074F69, text_halign = TC, text_valign = TC, text_size = sT)
cellCount = 20
filledCells = 0
for r = 5 to 1 by 1
for c = 2 to 5 by 1
if filledCells < cellCount * (totalbuyPercentC_ / 100)
tb.cell(c, r, text = '', bgcolor = C_Up)
else
tb.cell(c, r, text = '', bgcolor = C_Down)
filledCells := filledCells + 1
filledCells
if Label
sp = ' '
l = label.new(bar_index, ohlcv.V,
text=str.format('Net: {0}\nBuy: {1} ({2})\nSell: {3} ({4})\n{5}/\\\n {5}l\n {5}l',
volStr, buyVolStr, buyPercentStr, sellVolStr, sellPercentStr, sp),
style=label.style_none, textcolor=volData.higherCol, size=sL, textalign=text.align_left)
if not History
(l ).delete()
//------------------------------------------
// Draw volume levels on the candlesticks |
//------------------------------------------
float base = na,float value = na
bool uc = usecandle and sup
if volData.isBuyGreater
base := math.min(ohlcv.O, ohlcv.C)
value := base + math.abs(ohlcv.O - ohlcv.C) * (volData.pcBuy / 100)
else
base := math.max(ohlcv.O, ohlcv.C)
value := base - math.abs(ohlcv.O - ohlcv.C) * (volData.pcSell / 100)
barcolor(sup ? color.new(na, na) : ohlcv.C < ohlcv.O ? color.red : color.green,display = usecandle? display.all:display.none)
UseC = uc ? volData.higherCol:color.new(na, na)
plotcandle(uc?base:na, uc?base:na, uc?value:na, uc?value:na,
title='Body', color=UseC, bordercolor=na, wickcolor=UseC,
display = usecandle ? display.all - display.status_line : display.none, force_overlay=true,editable=false)
plotcandle(uc?ohlcv.O:na, uc?ohlcv.H:na, uc?ohlcv.L:na, uc?ohlcv.C:na,
title='Fill', color=color.new(UseC,80), bordercolor=UseC, wickcolor=UseC,
display = usecandle ? display.all - display.status_line : display.none, force_overlay=true,editable=false)
//------------------------------------------------------------
// Plot the EMA and filter out the noise with volume control. |
//------------------------------------------------------------
float emaFast = ta.ema(ohlcv.C, emaFastLength)
float emaSlow = ta.ema(ohlcv.C, emaSlowLength)
bool signal = emaFast > emaSlow
color c_signal = signal ? C_Up : C_Down
float volumeMA = ta.sma(ohlcv.V, volumeConfirmationLength)
bool crossover = ta.crossover(emaFast, emaSlow)
bool crossunder = ta.crossunder(emaFast, emaSlow)
isVolumeConfirmed(source, length, ma) =>
math.sum(source > ma ? source : 0, length) >= math.sum(source < ma ? source : 0, length)
bool ISV = isVolumeConfirmed(ohlcv.V, volumeConfirmationLength, volumeMA)
bool crossoverConfirmed = crossover and (not useVolumeConfirmation or ISV)
bool crossunderConfirmed = crossunder and (not useVolumeConfirmation or ISV)
PF = MAV ? emaFast : na
PS = MAV ? emaSlow : na
p1 = plot(PF, color = c_signal, editable = false, force_overlay = true, display = display.pane)
plot(PF, color = color.new(c_signal, 80), linewidth = 10, editable = false, force_overlay = true, display = display.pane)
plot(PF, color = color.new(c_signal, 90), linewidth = 20, editable = false, force_overlay = true, display = display.pane)
plot(PF, color = color.new(c_signal, 95), linewidth = 30, editable = false, force_overlay = true, display = display.pane)
plot(PF, color = color.new(c_signal, 98), linewidth = 45, editable = false, force_overlay = true, display = display.pane)
p2 = plot(PS, color = c_signal, editable = false, force_overlay = true, display = display.pane)
plot(PS, color = color.new(c_signal, 80), linewidth = 10, editable = false, force_overlay = true, display = display.pane)
plot(PS, color = color.new(c_signal, 90), linewidth = 20, editable = false, force_overlay = true, display = display.pane)
plot(PS, color = color.new(c_signal, 95), linewidth = 30, editable = false, force_overlay = true, display = display.pane)
plot(PS, color = color.new(c_signal, 98), linewidth = 45, editable = false, force_overlay = true, display = display.pane)
fill(p1, p2, top_value=crossover ? emaFast : emaSlow,
bottom_value =crossover ? emaSlow : emaFast,
top_color =color.new(c_signal, 80),
bottom_color =color.new(c_signal, 95)
)
// ✅ Usar colores configurables para señales
plotshape(crossoverConfirmed and MAV, style=shape.triangleup , location=location.belowbar, color=buySignalColor , size=size.small, force_overlay=true,display =display.pane)
plotshape(crossunderConfirmed and MAV, style=shape.triangledown, location=location.abovebar, color=sellSignalColor, size=size.small, force_overlay=true,display =display.pane)
string msg = '---------\n'+"Buy volume ="+buyVolStr+"\nBuy Percent = "+buyPercentStr+"\nSell volume = "+sellVolStr+"\nSell Percent = "+sellPercentStr+"\nNet = "+volStr+'\n---------'
if crossoverConfirmed
alert("Price (" + str.tostring(close) + ") Crossed over MA\n" + msg, alert_freq)
if crossunderConfirmed
alert("Price (" + str.tostring(close) + ") Crossed under MA\n" + msg, alert_freq)

BOCS Channel Scalper Strategy - Automated Mean Reversion System# BOCS Channel Scalper Strategy - Automated Mean Reversion System
## WHAT THIS STRATEGY DOES:
This is an automated mean reversion trading strategy that identifies consolidation channels through volatility analysis and executes scalp trades when price enters entry zones near channel boundaries. Unlike breakout strategies, this system assumes price will revert to the channel mean, taking profits as price bounces back from extremes. Position sizing is fully customizable with three methods: fixed contracts, percentage of equity, or fixed dollar amount. Stop losses are placed just outside channel boundaries with take profits calculated either as fixed points or as a percentage of channel range.
## KEY DIFFERENCE FROM ORIGINAL BOCS:
**This strategy is designed for traders seeking higher trade frequency.** The original BOCS indicator trades breakouts OUTSIDE channels, waiting for price to escape consolidation before entering. This scalper version trades mean reversion INSIDE channels, entering when price reaches channel extremes and betting on a bounce back to center. The result is significantly more trading opportunities:
- **Original BOCS**: 1-3 signals per channel (only on breakout)
- **Scalper Version**: 5-15+ signals per channel (every touch of entry zones)
- **Trade Style**: Mean reversion vs trend following
- **Hold Time**: Seconds to minutes vs minutes to hours
- **Best Markets**: Ranging/choppy conditions vs trending breakouts
This makes the scalper ideal for active day traders who want continuous opportunities within consolidation zones rather than waiting for breakout confirmation. However, increased trade frequency also means higher commission costs and requires tighter risk management.
## TECHNICAL METHODOLOGY:
### Price Normalization Process:
The strategy normalizes price data to create consistent volatility measurements across different instruments and price levels. It calculates the highest high and lowest low over a user-defined lookback period (default 100 bars). Current close price is normalized using: (close - lowest_low) / (highest_high - lowest_low), producing values between 0 and 1 for standardized volatility analysis.
### Volatility Detection:
A 14-period standard deviation is applied to the normalized price series to measure price deviation from the mean. Higher standard deviation values indicate volatility expansion; lower values indicate consolidation. The strategy uses ta.highestbars() and ta.lowestbars() to identify when volatility peaks and troughs occur over the detection period (default 14 bars).
### Channel Formation Logic:
When volatility crosses from a high level to a low level (ta.crossover(upper, lower)), a consolidation phase begins. The strategy tracks the highest and lowest prices during this period, which become the channel boundaries. Minimum duration of 10+ bars is required to filter out brief volatility spikes. Channels are rendered as box objects with defined upper and lower boundaries, with colored zones indicating entry areas.
### Entry Signal Generation:
The strategy uses immediate touch-based entry logic. Entry zones are defined as a percentage from channel edges (default 20%):
- **Long Entry Zone**: Bottom 20% of channel (bottomBound + channelRange × 0.2)
- **Short Entry Zone**: Top 20% of channel (topBound - channelRange × 0.2)
Long signals trigger when candle low touches or enters the long entry zone. Short signals trigger when candle high touches or enters the short entry zone. This captures mean reversion opportunities as price reaches channel extremes.
### Cooldown Filter:
An optional cooldown period (measured in bars) prevents signal spam by enforcing minimum spacing between consecutive signals. If cooldown is set to 3 bars, no new long signal will fire until 3 bars after the previous long signal. Long and short cooldowns are tracked independently, allowing both directions to signal within the same period.
### ATR Volatility Filter:
The strategy includes a multi-timeframe ATR filter to avoid trading during low-volatility conditions. Using request.security(), it fetches ATR values from a specified timeframe (e.g., 1-minute ATR while trading on 5-minute charts). The filter compares current ATR to a user-defined minimum threshold:
- If ATR ≥ threshold: Trading enabled
- If ATR < threshold: No signals fire
This prevents entries during dead zones where mean reversion is unreliable due to insufficient price movement.
### Take Profit Calculation:
Two TP methods are available:
**Fixed Points Mode**:
- Long TP = Entry + (TP_Ticks × syminfo.mintick)
- Short TP = Entry - (TP_Ticks × syminfo.mintick)
**Channel Percentage Mode**:
- Long TP = Entry + (ChannelRange × TP_Percent)
- Short TP = Entry - (ChannelRange × TP_Percent)
Default 50% targets the channel midline, a natural mean reversion target. Larger percentages aim for opposite channel edge.
### Stop Loss Placement:
Stop losses are placed just outside the channel boundary by a user-defined tick offset:
- Long SL = ChannelBottom - (SL_Offset_Ticks × syminfo.mintick)
- Short SL = ChannelTop + (SL_Offset_Ticks × syminfo.mintick)
This logic assumes channel breaks invalidate the mean reversion thesis. If price breaks through, the range is no longer valid and position exits.
### Trade Execution Logic:
When entry conditions are met (price in zone, cooldown satisfied, ATR filter passed, no existing position):
1. Calculate entry price at zone boundary
2. Calculate TP and SL based on selected method
3. Execute strategy.entry() with calculated position size
4. Place strategy.exit() with TP limit and SL stop orders
5. Update info table with active trade details
The strategy enforces one position at a time by checking strategy.position_size == 0 before entry.
### Channel Breakout Management:
Channels are removed when price closes more than 10 ticks outside boundaries. This tolerance prevents premature channel deletion from minor breaks or wicks, allowing the mean reversion setup to persist through small boundary violations.
### Position Sizing System:
Three methods calculate position size:
**Fixed Contracts**:
- Uses exact contract quantity specified in settings
- Best for futures traders (e.g., "trade 2 NQ contracts")
**Percentage of Equity**:
- position_size = (strategy.equity × equity_pct / 100) / close
- Dynamically scales with account growth
**Cash Amount**:
- position_size = cash_amount / close
- Maintains consistent dollar exposure regardless of price
## INPUT PARAMETERS:
### Position Sizing:
- **Position Size Type**: Choose Fixed Contracts, % of Equity, or Cash Amount
- **Number of Contracts**: Fixed quantity per trade (1-1000)
- **% of Equity**: Percentage of account to allocate (1-100%)
- **Cash Amount**: Dollar value per position ($100+)
### Channel Settings:
- **Nested Channels**: Allow multiple overlapping channels vs single channel
- **Normalization Length**: Lookback for high/low calculation (1-500, default 100)
- **Box Detection Length**: Period for volatility detection (1-100, default 14)
### Scalping Settings:
- **Enable Long Scalps**: Toggle long entries on/off
- **Enable Short Scalps**: Toggle short entries on/off
- **Entry Zone % from Edge**: Size of entry zone (5-50%, default 20%)
- **SL Offset (Ticks)**: Distance beyond channel for stop (1+, default 5)
- **Cooldown Period (Bars)**: Minimum spacing between signals (0 = no cooldown)
### ATR Filter:
- **Enable ATR Filter**: Toggle volatility filter on/off
- **ATR Timeframe**: Source timeframe for ATR (1, 5, 15, 60 min, etc.)
- **ATR Length**: Smoothing period (1-100, default 14)
- **Min ATR Value**: Threshold for trade enablement (0.1+, default 10.0)
### Take Profit Settings:
- **TP Method**: Choose Fixed Points or % of Channel
- **TP Fixed (Ticks)**: Static distance in ticks (1+, default 30)
- **TP % of Channel**: Dynamic target as channel percentage (10-100%, default 50%)
### Appearance:
- **Show Entry Zones**: Toggle zone labels on channels
- **Show Info Table**: Display real-time strategy status
- **Table Position**: Corner placement (Top Left/Right, Bottom Left/Right)
- **Color Settings**: Customize long/short/TP/SL colors
## VISUAL INDICATORS:
- **Channel boxes** with semi-transparent fill showing consolidation zones
- **Colored entry zones** labeled "LONG ZONE ▲" and "SHORT ZONE ▼"
- **Entry signal arrows** below/above bars marking long/short entries
- **Active TP/SL lines** with emoji labels (⊕ Entry, 🎯 TP, 🛑 SL)
- **Info table** showing position status, channel state, last signal, entry/TP/SL prices, and ATR status
## HOW TO USE:
### For 1-3 Minute Scalping (NQ/ES):
- ATR Timeframe: "1" (1-minute)
- ATR Min Value: 10.0 (for NQ), adjust per instrument
- Entry Zone %: 20-25%
- TP Method: Fixed Points, 20-40 ticks
- SL Offset: 5-10 ticks
- Cooldown: 2-3 bars
- Position Size: 1-2 contracts
### For 5-15 Minute Day Trading:
- ATR Timeframe: "5" or match chart
- ATR Min Value: Adjust to instrument (test 8-15 for NQ)
- Entry Zone %: 20-30%
- TP Method: % of Channel, 40-60%
- SL Offset: 5-10 ticks
- Cooldown: 3-5 bars
- Position Size: Fixed contracts or 5-10% equity
### For 30-60 Minute Swing Scalping:
- ATR Timeframe: "15" or "30"
- ATR Min Value: Lower threshold for broader market
- Entry Zone %: 25-35%
- TP Method: % of Channel, 50-70%
- SL Offset: 10-15 ticks
- Cooldown: 5+ bars or disable
- Position Size: % of equity recommended
## BACKTEST CONSIDERATIONS:
- Strategy performs best in ranging, mean-reverting markets
- Strong trending markets produce more stop losses as price breaks channels
- ATR filter significantly reduces trade count but improves quality during low volatility
- Cooldown period trades signal quantity for signal quality
- Commission and slippage materially impact sub-5-minute timeframe performance
- Shorter timeframes require tighter entry zones (15-20%) to catch quick reversions
- % of Channel TP adapts better to varying channel sizes than fixed points
- Fixed contract sizing recommended for consistent risk per trade in futures
**Backtesting Parameters Used**: This strategy was developed and tested using realistic commission and slippage values to provide accurate performance expectations. Recommended settings: Commission of $1.40 per side (typical for NQ futures through discount brokers), slippage of 2 ticks to account for execution delays on fast-moving scalp entries. These values reflect real-world trading costs that active scalpers will encounter. Backtest results without proper cost simulation will significantly overstate profitability.
## COMPATIBLE MARKETS:
Works on any instrument with price data including stock indices (NQ, ES, YM, RTY), individual stocks, forex pairs (EUR/USD, GBP/USD), cryptocurrency (BTC, ETH), and commodities. Volume-based features require data feed with volume information but are optional for core functionality.
## KNOWN LIMITATIONS:
- Immediate touch entry can fire multiple times in choppy zones without adequate cooldown
- Channel deletion at 10-tick breaks may be too aggressive or lenient depending on instrument tick size
- ATR filter from lower timeframes requires higher-tier TradingView subscription (request.security limitation)
- Mean reversion logic fails in strong breakout scenarios leading to stop loss hits
- Position sizing via % of equity or cash amount calculates based on close price, may differ from actual fill price
- No partial closing capability - full position exits at TP or SL only
- Strategy does not account for gap openings or overnight holds
## RISK DISCLOSURE:
Trading involves substantial risk of loss. Past performance does not guarantee future results. This strategy is for educational purposes and backtesting only. Mean reversion strategies can experience extended drawdowns during trending markets. Stop losses may not fill at intended levels during extreme volatility or gaps. Thoroughly test on historical data and paper trade before risking real capital. Use appropriate position sizing and never risk more than you can afford to lose. Consider consulting a licensed financial advisor before making trading decisions. Automated trading systems can malfunction - monitor all live positions actively.
## ACKNOWLEDGMENT & CREDITS:
This strategy is built upon the channel detection methodology created by **AlgoAlpha** in the "Smart Money Breakout Channels" indicator. Full credit and appreciation to AlgoAlpha for pioneering the normalized volatility approach to identifying consolidation patterns. The core channel formation logic using normalized price standard deviation is AlgoAlpha's original contribution to the TradingView community.
Enhancements to the original concept include: mean reversion entry logic (vs breakout), immediate touch-based signals, multi-timeframe ATR volatility filtering, flexible position sizing (fixed/percentage/cash), cooldown period filtering, dual TP methods (fixed points vs channel percentage), automated strategy execution with exit management, and real-time position monitoring table.
