[blackcat] L1 Extreme Shadows█ OVERVIEW
The Pine Script provided is an indicator designed to detect market volatility and extreme shadow conditions. It calculates various conditions based on simple moving averages (SMAs) and plots the results to help traders identify potential market extremes. The primary function of the script is to provide visual cues for extreme market conditions without generating explicit trading signals.
█ LOGICAL FRAMEWORK
Structure:
1 — Input Parameters:
• No user-defined input parameters are present in this script.
2 — Calculations:
• Calculate Extreme Shadow: Checks if the differences between certain SMAs and prices exceed predefined thresholds.
• Calculate Buy Extreme Shadow: Extends the logic by incorporating additional SMAs to identify stronger buy signals.
• Calculate Massive Bullish Sell: Detects massive bullish sell conditions using longer-term SMAs.
3 — Plotting:
• The script plots the calculated conditions using distinct colors to differentiate between various types of extreme shadows.
Data Flow:
• The close price is passed through each custom function.
• Each function computes its respective conditions based on specified SMAs and thresholds.
• The computed values are then summed and returned.
• Finally, the aggregated values are plotted on the chart using the plot function.
█ CUSTOM FUNCTIONS
1 — calculate_extreme_shadow(close)
• Purpose: Identify extreme shadow conditions based on 8-period and 14-period SMAs.
• Functionality: Computes the difference between the 8-period SMA and the close price, and the difference between the 14-period SMA and the 4-period SMA, relative to the 6-period SMA. Returns 2 if both conditions exceed 0.04; otherwise, returns 0.
• Parameters: close (price series)
• Return Value: Integer (0 or 2)
2 — calculate_buy_extreme_shadow(close)
• Purpose: Identify more robust buy signals by evaluating multiple SMAs.
• Functionality: Considers the 8-period SMA along with additional SMAs (21, 42, 63, 84, 105) and combines multiple conditions to provide a comprehensive buy signal.
• Parameters: close (price series)
• Return Value: Integer (sum of conditions, ranging from 0 to 14)
3 — calculate_massive_bullish_sell(close)
• Purpose: Detect massive bullish sell conditions using longer-term SMAs.
• Functionality: Evaluates conditions based on the 8-period SMA and longer-term SMAs (88, 44, 22, 11, 5), returning a sum of conditions meeting specified thresholds.
• Parameters: close (price series)
• Return Value: Integer (sum of conditions, ranging from 0 to 10)
█ KEY POINTS AND TECHNIQUES
• Advanced Pine Script Features:
• Multiple Nested Conditions: Uses nested conditions to assess complex market scenarios.
• Combination of Conditions: Combines multiple conditions to provide a more reliable signal.
• Optimization Techniques:
• Thresholds: Employs specific thresholds (0.04 and 0.03) to filter out noise and highlight significant market movements.
• SMA Comparisons: Compares multiple SMAs to identify trends and extreme conditions.
• Unique Approaches:
• Combining Multiple Time Frames: Incorporates multiple time frames to offer a holistic view of the market.
• Visual Distinction: Utilizes different colors and line widths to clearly differentiate between various extreme shadow conditions.
█ EXTENDED KNOWLEDGE AND APPLICATIONS
• Potential Modifications:
• User-Defined Thresholds: Allow users to customize thresholds to align with personal trading strategies.
• Additional Indicators: Integrate other technical indicators like RSI or MACD to improve the detection of extreme market conditions.
• Entry and Exit Signals: Enhance the script to generate clear buy and sell signals based on identified extreme shadow conditions.
• Application Scenarios:
• Volatility Analysis: Analyze market volatility and pinpoint times of extreme price action.
• Trend Following: Pair with trend-following strategies to capitalize on significant market moves.
• Risk Management: Adjust position sizes or stop-loss levels based on detected extreme conditions.
• Related Pine Script Concepts:
• Custom Functions: Demonstrates how to create reusable functions for simplified and organized code.
• Plotting Techniques: Shows effective ways to visualize data using color and styling options.
• Multiple Time Frame Analysis: Highlights the benefits of analyzing multiple time frames for a broader market understanding.
ค้นหาในสคริปต์สำหรับ "哪吒之魔童闹海票房破42亿,“我命由我不由天”"

EMAs CrossThis script generates a line that changes color when evaluating the values and intersections of the 7-, 14-, and 42-day exponential averages, indicating possible entry and exit points.
In general, yellow indicates the beginning of an uptrend, green confirms an uptrend, and brown indicates a downtrend.
Using this script together with the RSI can help you make decisions about the best times to enter and exit positions.
The script was created to generate an indicator in a separate window from the main chart, but adding this indicator to the main window can help you visualize and interpret market movements.

Ichimoku Theories [LuxAlgo]The Ichimoku Theories indicator is the most complete Ichimoku tool you will ever need. Four tools combined into one to harness all the power of Ichimoku Kinkō Hyō.
This tool features the following concepts based on the work of Goichi Hosoda:
Ichimoku Kinkō Hyō: Original Ichimoku indicator with its five main lines and kumo.
Time Theory: automatic time cycle identification and forecasting to understand market timing.
Wave Theory: automatic wave identification to understand market structure.
Price Theory: automatic identification of developing N waves and possible price targets to understand future price behavior.
🔶 ICHIMOKU KINKŌ HYŌ
Ichimoku with lines only, Kumo only and both together
Let us start with the basics: the Ichimoku original indicator is a tool to understand the market, not to predict it, it is a trend-following tool, so it is best used in trending markets.
Ichimoku tells us what is happening in the market and what may happen next, the aim of the tool is to provide market understanding, not trading signals.
The tool is based on calculating the mid-point between the high and low of three pre-defined ranges as the equilibrium price for short (9 periods), medium (26 periods), and long (52 periods) time horizons:
Tenkan sen: middle point of the range of the last 9 candles
Kinjun sen: middle point of the range of the last 26 candles
Senkou span A: middle point between Tankan Sen and Kijun Sen, plotted 26 candles into the future
Senkou span B: midpoint of the range of the last 52 candles, plotted 26 candles into the future
Chikou span: closing price plotted 26 candles into the past
Kumo: area between Senkou pans A and B (kumo means cloud in Japanese)
The most basic use of the tool is to use the Kumo as an area of possible support or resistance.
🔶 TIME THEORY
Current cycles and forecast
Time theory is a critical concept used to identify historical and current market cycles, and use these to forecast the next ones. This concept is based on the Kihon Suchi (translating to "Basic Numbers" in Japanese), these are 9 and 26, and from their combinations we obtain the following sequence:
9, 17, 26, 33, 42, 51, 65, 76, 129, 172, 200, 257
The main idea is that the market moves in cycles with periods set by the Kihon Suchi sequence.
When the cycle has the same exact periods, we obtain the Taito Suchi (translating to "Same Number" in Japanese).
This tool allows traders to identify historical and current market cycles and forecast the next one.
🔹 Time Cycle Identification
Presentation of 4 different modes: SWINGS, HIGHS, KINJUN, and WAVES .
The tool draws a horizontal line at the bottom of the chart showing the cycles detected and their size.
The following settings are used:
Time Cycle Mode: up to 7 different modes
Wave Cycle: Which wave to use when WAVE mode is selected, only active waves in the Wave Theory settings will be used.
Show Time Cycles: keep a cleaner chart by disabling cycles visualisation
Show last X time cycles: how many cycles to display
🔹 Time Cycle Forecast
Showcasing the two forecasting patterns: Kihon Suchi and Taito Suchi
The tool plots horizontal lines, a solid anchor line, and several dotted forecast lines.
The following settings are used:
Show time cycle forecast: to keep things clean
Forecast Pattern: comes in two flavors
Kihon Suchi plots a line from the anchor at each number in the Kihon Suchi sequence.
Taito Suchi plot lines from the anchor with the same size detected in the anchored cycle
Anchor forecast on last X time cycle: traders can place the anchor in any detected cycle
🔶 WAVE THEORY
All waves activated with overlapping
The main idea behind this theory is that markets move like waves in the sea, back and forth (making swing lows and highs). Understanding the current market structure is key to having realistic expectations of what the market may do next. The waves are divided into Simple and Complex.
The following settings are used:
Basic Waves: allows traders to activate waves I, V and N
Complex Waves: allows traders to activate waves P, Y and W
Overlapping waves: to avoid missing out on any of the waves activated
Show last X waves: how many waves will be displayed
🔹 Basic Waves
The three basic waves
The basic waves from which all waves are made are I, V, and N
I wave: one leg moves
V wave: two legs move, one against the other
N wave: Three legs move, push, pull back, and another push
🔹 Complex Waves
Three complex waves
There are other waves like
P wave: contracting market
Y wave: expanding market
W wave: double top or double bottom
🔶 PRICE THEORY
All targets for the current N wave with their calculations
This theory is based on identifying developing N waves and predicting potential price targets based on that developing wave.
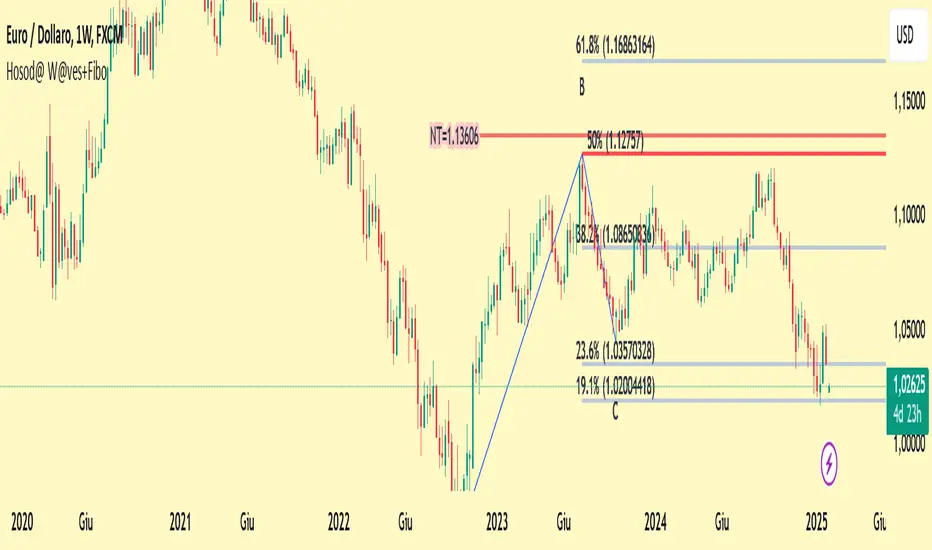
The tool displays 4 basic targets (V, E, N, and NT) and 3 extended targets (2E and 3E) according to the calculations shown in the chart above. Traders can enable or disable each target in the settings panel.
🔶 USING EVERYTHING TOGETHER
Please DON'T do this. This is not how you use it
Now the real example:
Daily chart of Nasdaq 100 futures (NQ1!) with our Ichimoku analysis
Time, waves, and price theories go together as one:
First, we identify the current time cycles and wave structure.
Then we forecast the next cycle and possible key price levels.
We identify a Taito Suchi with both legs of exactly 41 candles on each I wave, both together forming a V wave, the last two I waves are part of a developing N wave, and the time cycle of the first one is 191 candles. We forecast this cycle into the future and get 22nd April as a key date, so in 6 trading days (as of this writing) the market would have completed another Taito Suchi pattern if a new wave and time cycle starts. As we have a developing N wave we can see the potential price targets, the price is actually between the NT and V targets. We have a bullish Kumo and the price is touching it, if this Kumo provides enough support for the price to go further, the market could reach N or E targets.
So we have identified the cycle and wave, our expectations are that the current cycle is another Taito Suchi and the current wave is an N wave, the first I wave went for 191 candles, and we expect the second and third I waves together to amount to 191 candles, so in theory the N wave would complete in the next 6 trading days making a swing high. If this is indeed the case, the price could reach the V target (it is almost there) or even the N target if the bulls have the necessary strength.
We do not predict the future, we can only aim to understand the current market conditions and have future expectations of when (time), how (wave), and where (price) the market will make the next turning point where one side of the market overcomes the other (bulls vs bears).
To generate this chart, we change the following settings from the default ones:
Swing length: 64
Show lines: disabled
Forecast pattern: TAITO SUCHI
Anchor forecast: 2
Show last time cycles: 5
I WAVE: enabled
N WAVE: disabled
Show last waves: 5
🔶 SETTINGS
Show Swing Highs & Lows: Enable/Disable points on swing highs and swing lows.
Swing Length: Number of candles to confirm a swing high or swing low. A higher number detects larger swings.
🔹 Ichimoku Kinkō Hyō
Show Lines: Enable/Disable the 5 Ichimoku lines: Kijun sen, Tenkan sen, Senkou span A & B and Chikou Span.
Show Kumo: Enable/Disable the Kumo (cloud). The Kumo is formed by 2 lines: Senkou Span A and Senkou Span B.
Tenkan Sen Length: Number of candles for Tenkan Sen calculation.
Kinjun Sen Length: Number of candles for the Kijun Sen calculation.
Senkou Span B Length: Number of candles for Senkou Span B calculation.
Chikou & Senkou Offset: Number of candles for Chikou and Senkou Span calculation. Chikou Span is plotted in the past, and Senkou Span A & B in the future.
🔹 Time Theory
Show Time Cycle Forecast: Enable/Disable time cycle forecast vertical lines. Disable for better performance.
Forecast Pattern: Choose between two patterns: Kihon Suchi (basic numbers) or Taito Suchi (equal numbers).
Anchor forecast on last X time cycle: Number of time cycles in the past to anchor the time cycle forecast. The larger the number, the deeper in the past the anchor will be.
Time Cycle Mode: Choose from 7 time cycle detection modes: Tenkan Sen cross, Kijun Sen cross, Kumo change between bullish & bearish, swing highs only, swing lows only, both swing highs & lows and wave detection.
Wave Cycle: Choose which type of wave to detect from 6 different wave types when the time cycle mode is set to WAVES.
Show Time Cycles: Enable/Disable time cycle horizontal lines. Disable for better performance.
how last X time cycles: Maximum number of time cycles to display.
🔹 Wave Theory
Basic Waves: Enable/Disable the display of basic waves, all at once or one at a time. Disable for better performance.
Complex Waves: Enable/Disable complex wave display, all at once or one by one. Disable for better performance.
Overlapping Waves: Enable/Disable the display of waves ending on the same swing point.
Show last X waves: 'Maximum number of waves to display.
🔹 Price Theory
Basic Targets: Enable/Disable horizontal price target lines. Disable for better performance.
Extended Targets: Enable/Disable extended price target horizontal lines. Disable for better performance.

Movement based on Buying/Selling VolumeDescription:
The "Buying Selling Volume" indicator calculates buying and selling volumes based on price movements within a specified lookback period. It then computes exponential moving averages (EMAs) of these volumes to determine trend direction. The indicator visually represents trend direction on the chart.
Volume Calculation and Normalization (Lines #1 - #12):
The indicator first computes the buying volume (BV) and selling volume (SV) based on price movements within the specified lookback period. These volumes are calculated proportionally to the distance between the closing price and the high and low of each candle.
To ensure consistent behavior and prevent division by zero, the volumes are normalized using a conditional statement to handle cases where the high and low are equal, which implies a lack of price movement.
Additionally, the volume (vol) is normalized to ensure non-zero division in subsequent calculations.
Total Volume and Proportional Volume Calculation (Lines #13 - #20):
The total volume (TP) is computed by summing the buying and selling volumes.
The proportional buying volume (BPV) and selling volume (SPV) are then calculated based on their respective contributions to the total volume.
These proportional volumes are scaled by the total volume to ensure accurate representation relative to market activity.
Evaluating Buying and Selling Pressure (Lines #21 - #24):
The code segment assigns positive or negative values to represent buying and selling pressure, respectively, based on the comparison between BPV and SPV. This step involves determining whether the buying pressure exceeds the selling pressure or vice versa.
The calculated values, denoted as BPc1 and SPc1, encapsulate the relative strength of buying and selling forces within the market.
EMA Calculation and Trend Identification (Lines #25 - #32):
The BPc1 and SPc1 values are subjected to exponential moving average (EMA) calculations using the specified lookback period (LookbackL). This process involves smoothing out the buying and selling pressure data to reveal underlying trends.
The resulting EMAs, represented by ema1B and ema1S, serve as crucial indicators of trend direction. A bullish trend is indicated when ema1B exceeds ema1S, while a bearish trend is signaled when ema1B falls below ema1S.
Secondary Volume Analysis and Trend Confirmation (Lines #33 - #42):
A similar volume analysis and EMA calculation process is repeated in this segment, using a different lookback period (LookbackL2). This allows for a secondary assessment of market dynamics and trend direction.
The resulting EMAs, denoted as ema1B2 and ema1S2, are compared to validate the trend direction identified in the primary analysis.
Visual Representation and Trend Display (Lines #43 - #46):
Finally, the indicator visualizes the identified trends on the chart by plotting colored shapes based on the comparison between the primary and secondary trend directions.
A green color indicates alignment in bullish trends, a red color signifies alignment in bearish trends, while a neutral color (gray) represents no clear consensus between the primary and secondary analyses.
Ideal Usage:
1. **Trend Confirmation:** Traders can use this indicator to confirm trend direction before entering trades.
2. **Reversal Signals:** Changes in trend direction, indicated by shifts in plotted shape colors, can signal potential market reversals.
Warnings:
1. **False Signals:** Like any technical indicator, false signals may occur, especially during low-volume or choppy market conditions. Additional analysis and risk management techniques are essential to mitigate potential losses.
2. **Parameter Sensitivity:** Adjusting lookback periods can impact the indicator's sensitivity to price movements. Traders should test different parameter settings and consider market conditions when using the indicator.

PresentTrend RMI Synergy - Strategy [presentTrading] █ Introduction and How it is Different
The "PresentTrend RMI Synergy Strategy" is the combined power of the Relative Momentum Index (RMI) and a custom presentTrend indicator. This strategy introduces a multifaceted approach, integrating momentum analysis with trend direction to offer traders a more nuanced and responsive trading mechanism.
BTCUSD 6h L/S Performance
Local
█ Strategy, How It Works: Detailed Explanation
The "PresentTrend RMI Synergy Strategy" intricately combines the Relative Momentum Index (RMI) and a custom SuperTrend indicator to create a powerful tool for traders.
🔶 Relative Momentum Index (RMI)
The RMI is a variation of the Relative Strength Index (RSI), but instead of using price closes against itself, it measures the momentum of up and down movements in price relative to previous prices over a given period. The RMI for a period length `N` is calculated as follows:
RMI = 100 - 100/ (1 + U/D)
where:
- `U` is the average upward price change over `N` periods,
- `D` is the average downward price change over `N` periods.
The RMI oscillates between 0 and 100, with higher values indicating stronger upward momentum and lower values suggesting stronger downward momentum.
RMI = 21
RMI = 42
For more information - RMI Trend Sync - Strategy :
🔶 presentTrend Indicator
The presentTrend indicator combines the Average True Range (ATR) with a moving average to determine trend direction and dynamic support or resistance levels. The presentTrend for a period length `M` and a multiplier `F` is defined as:
- Upper Band: MA + (ATR x F)
- Lower Band: MA - (ATR x F)
where:
- `MA` is the moving average of the close price over `M` periods,
- `ATR` is the Average True Range over the same period,
- `F` is the multiplier to adjust the sensitivity.
The trend direction switches when the price crosses the presentTrend bands, signaling potential entry or exit points.
presentTrend length = 3
presentTrend length = 10
For more information - PresentTrend - Strategy :
🔶 Strategy Logic
Entry Conditions:
- Long Entry: Triggered when the RMI exceeds a threshold, say 60, indicating a strong bullish momentum, and when the price is above the presentTrend, confirming an uptrend.
- Short Entry: Occurs when the RMI drops below a threshold, say 40, showing strong bearish momentum, and the price is below the present trend, indicating a downtrend.
Exit Conditions with Dynamic Trailing Stop:
- Long Exit: Initiated when the price crosses below the lower presentTrend band or when the RMI falls back towards a neutral level, suggesting a weakening of the bullish momentum.
- Short Exit: Executed when the price crosses above the upper presentTrend band or when the RMI rises towards a neutral level, indicating a reduction in bearish momentum.
Equations for Dynamic Trailing Stop:
- For Long Positions: The exit price is set at the lower SuperTrend band once the entry condition is met.
- For Short Positions: The exit price is determined by the upper SuperTrend band post-entry.
These dynamic trailing stops adjust as the market moves, providing a method to lock in profits while allowing room for the position to grow.
This strategy's strength lies in its dual analysis approach, leveraging RMI for momentum insights and presentTrend for trend direction and dynamic stops. This combination offers traders a robust framework to navigate various market conditions, aiming to capture trends early and exit positions strategically to maximize gains and minimize losses.
█ Trade Direction
The strategy provides flexibility in trade direction selection, offering "Long," "Short," or "Both" options to cater to different market conditions and trader preferences. This adaptability ensures that traders can align the strategy with their market outlook, risk tolerance, and trading goals.
█ Usage
To utilize the "PresentTrend RMI Synergy Strategy," traders should input their preferred settings in the Pine Script™ and apply the strategy to their charts. Monitoring RMI for momentum shifts and adjusting positions based on SuperTrend signals can optimize entry and exit points, enhancing potential returns while managing risk.
█ Default Settings
1. RMI Length: 21
The 21-period RMI length strikes a balance between capturing momentum and filtering out market noise, offering a medium-term outlook on market trends.
2. Super Trend Length: 7
A SuperTrend length of 7 periods is chosen for its responsiveness to price movements, providing a dynamic framework for trend identification without excessive sensitivity.
3. Super Trend Multiplier: 4.0
The multiplier of 4.0 for the SuperTrend indicator widens the trend bands, focusing on significant market moves and reducing the impact of minor fluctuations.
---
The "PresentTrend RMI Synergy Strategy" represents a significant step forward in trading strategy development, blending momentum and trend analysis in a unique way. By providing a detailed framework for understanding market dynamics, this strategy empowers traders to make more informed decisions.

Hosoda Waves ABCThe Hosoda Waves indicator was devised by Goichi Hosoda, the creator of the Ichimoku system, with the idea that previous highs and lows could determine future price ranges to which the market would react. Hosoda's projections include the NT, N, V, and E waves, derived from calculations based on both upward and downward ABC swings. The calculations for Hosoda's waves are as follows:
NT Wave = C + (C - A)
N Wave = B + (B - A)
V Wave = B + (B - C)
E Wave = C + (B - A)
This indicator visually represents the calculations by Hosoda. Additionally, Hosoda indicated time cycles: 9, 17, 26, 33, 42, 51, 65, 76, etc., which are not integrated into this indicator as they are not considered effective in contemporary times.
Once applied to the chart, the interactive Pine Script tool version 5 will prompt you to identify 3 points of "low-high-low" or "high-low-high," both for upward and downward movements. Once clicked, these price points can be moved. If you change the time frame or market instrument, the indicator must be removed because it remains tied to the prices where it was initially drawn.
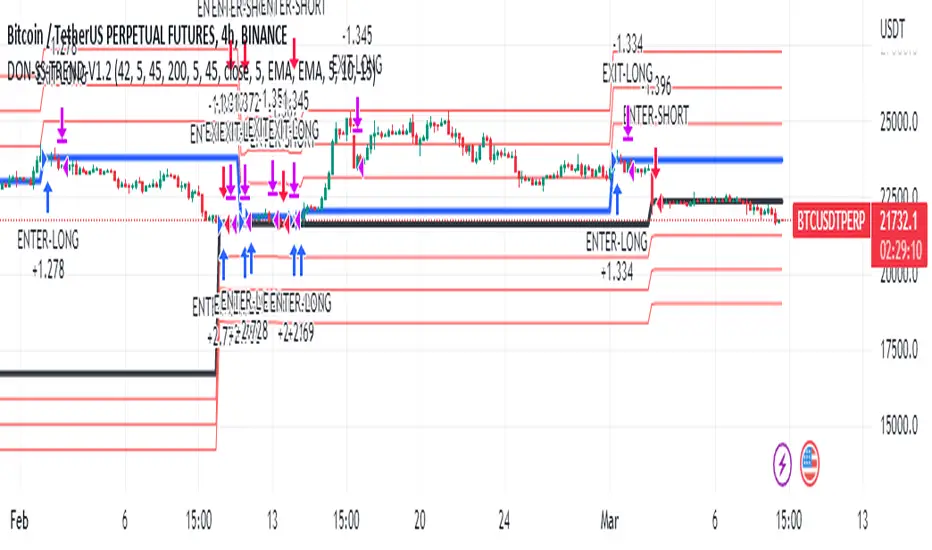
Donchian Trend V1The Donchian Trend strategy is a trend-following approach that uses the Donchian Channels indicator to identify potential entry and exit points in a security. The Donchian Channels are formed by taking the highest high and the lowest low prices over a specified period and plotting them as upper and lower channels around the current price. The width of the channels indicates the level of volatility in the market.
In this strategy, the Donchian Channels are used as a trend filter to determine the direction of the market. When the price is above the upper channel, it suggests an uptrend, and when the price is below the lower channel, it indicates a downtrend. The length of the Donchian Channels is a key parameter in the strategy, as it determines the look-back period for identifying the high and low prices.
Additional Logic: To further refine the entry and exit signals, The script uses two moving averages, a fast one (MA5) and a slow one (MA45), to identify trends and generate trading signals. When the fast moving average crosses above the slow moving average, a buy signal is generated, indicating that the market is trending upwards. Conversely, when the fast moving average crosses below the slow moving average, a sell signal is generated, indicating that the market is trending downwards.
Evaluation: The script was backtested on historical price data for the pair. The backtest results showed that the script was able to generate a net profit of , with a profit factor of and a Sharpe ratio of . The script also includes metrics such as the number of winning and losing trades, the average trade, and the largest winning and losing trades.
The strategy is evaluated based on its net profit, gross profit, gross loss, max run-up, max drawdown, buy & hold return, Sharpe ratio, Sortino ratio, and profit factor. The parameters used in the backtest include a Donchian Channel length of 42, which corresponds to a weekly time with divide of 4h time frame, and a short-term MA of 5 and a long-term MA of 45 for more accurate entry and exit signals.
Disclaimer: This script is for educational and research purposes only and should not be used for trading with real money without further testing and validation. Past performance is not indicative of future results.
BE - Golden Cross Crude KeyTraders, i have been observing crude oil for about 3 months now and somehow I can see that crude is respecting 42 days Moving average and crosses have created massive spikes most of the time.
However you need to be mindful of the time to trade and timeframe since not all crosses creates spikes.
Note: I have been testing on a 15min timeframe.
Keeping this in mind, this indicator is a automated solution which takes trade entries on crosses plus buffer and exits based on the specified Sl type.
Enjoy!
DISCLAIMER: No sharing, copying, reselling, modifying, or any other forms of use are authorized for our documents, script / strategy, and the information published with them. This informational planning script / strategy is strictly for individual use and educational purposes only. This is not financial or investment advice. Investments are always made at your own risk and are based on your personal judgement. I am not responsible for any losses you may incur. Please invest wisely.
Happy to receive suggestions and feedback in order to improve the performance of the indicator better.

True Average Period Traded RangeTrue Average Period Trading Range (TAPTR)
The J. Welles Wilder Average True Range calculation includes the ability to calculate in gaps into the equation.
It is in my opinion that gaps are untraded range values until the prices on their own come back and close the gaps.
The TAPTR calculation is simple, it is the average for a set period of time of the HIGH - LOW.
The ATR average calculation is automatically set based on the timeframe period you are looking at.
12 Months (1 year) = 10 (1 decade)
Months = 12 (1 year)
Weeks = 12 (1 business quarter)
Days = 21 (1 trading month)
4 Hour = 9 (5 trading days)
1 Hour = 33 (5 trading days)
45 minutes = 9 (1 trading day)
30 minutes = 14 (1 trading day)
15 minutes = 28 (1 trading day)
10 minutes = 42 (1 trading day)
5 minutes = 85 (1 trading day)
1 minute = 420 (1 trading day)
default value = 21 (if using a timeframe not described above)
The "master trend" as being a 21 SMA.
The colored columns represent the actual range value for that time period.
Description of values from left to right.
1) Actual Trade Range Value for the time period you are viewing
2) % of price (in decimal, you need multiply by 100 to get the true percent)
3) Average Traded Range
4) % of price
5) .618 of Average Traded Range
6) % of price
7) Mean of #3 and #5
8) % of price
The % of price is displayed in its calculated form. You need to multiple the value by 100 if you want the actual percent.
Example: Displayed Value: 0.0246 = 2.46%
Why calculated form only? If the ranges are .72 and the % of price is 2.32 the indicator looks all jacked up like a redneck's pick-up.
However, if it is .0232, everything is to scale.
Why is % of price helpful?
If you are trading and are aware that average period traded range is 5%, you now have an idea of an average return if you could catch from low to high (or short high to low).
Bar Colors
RED is greater than 4.2x TAPTR
ORANGE is greater than 2.618x TAPTR but less than RED
YELLOW is greater than 1.618x TAPTR but less than ORANGE
GREEN is greater than .618x TAPTR but less than YELLOW
BLUE is less than GREEN
The colors of the bars represent how far from the Master Trend (21 SMA) the close is.
This is determined by taking the difference between the close and the 21 SMA and dividing by the current TAPTR.
EXAMPLE:
IF you have a RED bar, the close is greater than 4.2 TAPTRs away from the 21 SMA. This means that either prices will stall and remain flat until
the SMA comes to the prices or turn and return to the SMA.
If prices are greater than 4.2 TAPTR, that also represents that it is greater than 4 or more time periods from the mean if the return traded within the averages.

Multi Day vWAP (Customizable) with AverageIntroducing the Multi-Day vWAP indicator that is fully customizable with average indicator option.
High level overview (default settings):
Default is 10 plots with each setting 1 day apart (1-10 day look back)
Labels for each plot are turned on by default (labels will default to your value, more below)
Use Style tab in options to change colors, plot style, and turn on/off individual plots
Average is turned off by default (style panel will show it's on-- go to Inputs panel and select "Show vWAP Average" to turn on)
Best use case is go to Visibility Panel in options and turn off for Days, Weeks, and Months
To turn off all labels at once go to Style tab and unselect "Labels" checkbox
If you want plots to be as small as possible in Inputs panel set the Plot Width to 0 (zero)
Detail Overview
This indicator will plot your custom daily vWAP values.
You can change the lookback period. If you change the lookback period the label will match your custom value.
For instance, if you change vWAP 1 value to "5", the label for this plot will be 5.
Average Notes:
The average will average all the vWAP values by the divisor. The default is to average all values by 10.
The average will always start to plot from the shortest lookback period. It is not possible to have the average plot before that point.
Trading Tips (default settings)
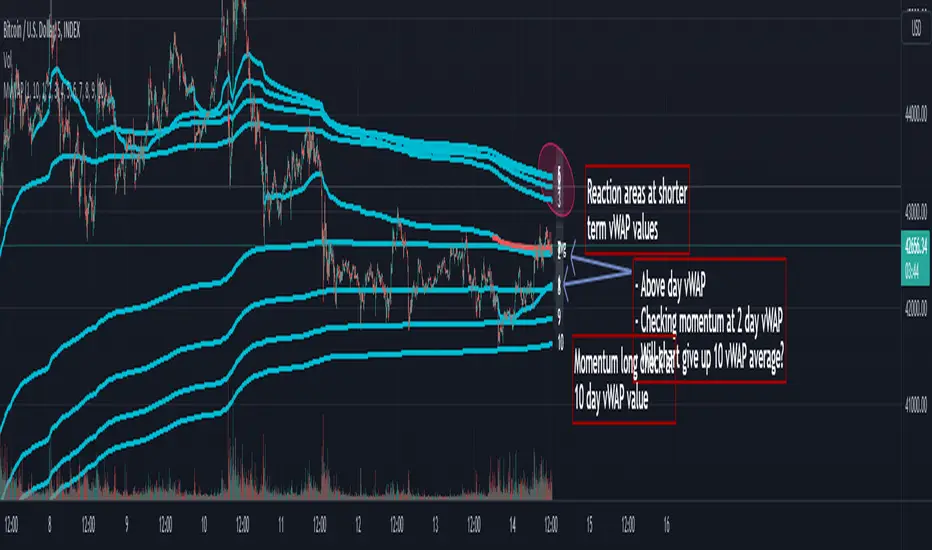
The simple way to use the vWAP is to treat them as magnets.
For intance,
Generally if price is trading below all the vWAP plots the chart is in a momentum short enviroment. All vWAP areas can be used for upside resistance/reaction areas.
If price is trading above the chart is in a momentum long enviroment and pullbacks can to vWAP levels can be looked as areas of support/reaction.
For instance:
Price is above the current day vWAP and looking to test the previous day vWAP value.
As it approaches the 2 value you are expecting this area to be a reaction area (good trade entry area) for a continuation short trade. Possibly to check back into the current day vWAP value.
I should share that this is a simple way to trade with the vWAP (true success with vWAP is understanding that price trades in vWAP channels).
Stacking and Strong Momentum
The other pattern you should look for is stacking.
For instance on this CL chart:
This chart is strong momentum long.
All 10 day vWAP plots are stacked on top of each other.
Previous action tested below all vWAPs. Price traded thru and came back and retested. Finally closing above all and above the vWAP avearge (red).
When the day vWAP was broke the next target you look for is the 2 vWAP. This reaction area held up and momentum long continued and continuing to trade above current day vWAP.
7 Day Rolling Example (Larger Timeframe)
Another great way to use this indicator is to customize the values for rolling 7 days (5 days for cash markets).
To do this set values to: 7, 14, 21, 28, 35, 42, 49, 56, 63, 70
For instance, this BTC chart:
This chart provides a good example of what you'll find when a chart is at a pivot point.
Price is checking in at the average to remain momentum long.
Upside longer term vWAP plots have been tested and had expected reaction.
Price is trading above the shorter term values.
Simple TA here will note if chart continues to trade above and takes out upper vWAPs long momentum is gaining ground.
On the downside if price trades thru the lower vWAP plots you would expect further downside. In this scenario you would be mindful to expect upside tests before (which could be good entry/reaction areas).
NQ example with 7 day values:
Overall chart is momentum short.
7 is above 14, 21
Maybe early sign of bottom.
If price takes out these values and holds above the buyers have quite a few challenges above.
Modified QQE-ZigZag [Non Repaint During Candle Building]V V V V V V V Please Read V V V V V V V
I ask Peter and he is fine, that im published this script
Tell me if you have some ideas or criticism about that sricpt
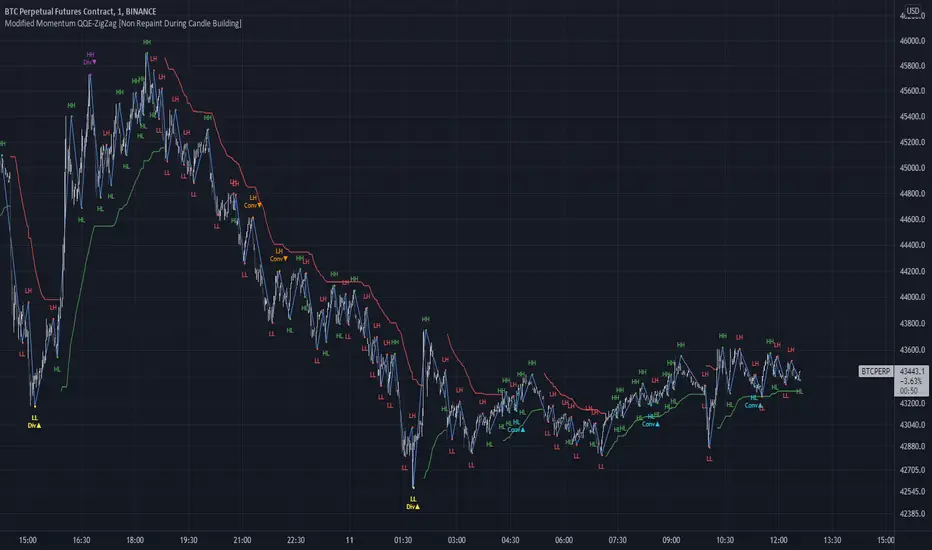
>>>>>>>>>> This is a modified Version of Peter_O's Momentum Based ZigZag <<<<<<<<<<<
This is only a test, and i want to share it with the community
It works like other ZigZags
Because Peters_O's original Version is only non repaint on closed historical Data ,
during a Candle building process it can still repaint (signal appears / 21 seconds later signal disapears / 42 seconds later signal appears again in the same candle / etc.),
but that isnt important for backtesting, its only important for realtime PivotPoints during a candle.
My goal for this zigzag was to make it absolute non repaint neither during a candle building process (current candle),
so once the signal is shown there is no chance that it disapers and shown a few seconds later again on that same candle, it can only show up one time per candle an thats it,
and that makes it absolute non repaint in all time frames.
Credits to:
==> Thanks to @glaz , for bringing the QQE to Tradingview <3
==> Thanks to @Peter_O , for sharing his idea to use the QQE as base for a Zigzag
and for sharing his MTF RSI with the Community <3
Changes:
- I changed the MTF RSI a little bit, you can choose between two version
- I changed the QQE a little bit, its now using the MTF RSI , and its using High and Low values as Source to make it absolute non repaint during a candle is building
- I added a little Divergence Calculation beween price and the MTF RSI that is used for the ZigZag
Colors :
- Green for HH / HL Continuation
- Red for LL / LH Continuation
- Yellow for Positive Divergence
- Purple for Negative Divergence
Important:
It is not possible to backtest this script correctly with historical Data, its only possible in Realtime,
because the QQE is using crossunders with RSILowSource and the QQE Line to find the Tops and,
because the QQE is using crossovers with RSIHighSource and the QQE Line to find the Bottoms,
and that means it is not possible to find the correct Time/Moment when that crossovers / crossunders happens in historical Data
=============> So please be sure you understand the Calculation and Backtest it in Realtime when you want to use it,
because i didn't published this script for real trading
=============> Im not a financial advisor and youre using this script at your own risk
=============> Please do your own research
ATR Table (SMA)ATR table for select time frames.
Using Simple Moving Average (SMA) to get ATR.
MA periods is based on numbers suggested by Saeed Khakestar (Trigger Price Action)
You can change them in code
5m => 12
15m => 16
1H => 24
4H => 42
1D => 30
1W => 52
RSI is calculated the same way
Realtime 5D Profile [LucF]█ OVERVIEW
This indicator displays a realtime profile that can be configured to visualize five dimensions: volume, price, time, activity and age. For each price level in a bar or timeframe, you can display total or delta volume or ticks. The tick count measures activity on a level. The thickness of each level's line indicates its age, which helps you identify the most recent levels.
█ WARNING
The indicator only works in real time. Contrary to TradingView's line of volume profile indicators , it does not show anything on historical bars or closed markets, and it cannot display volume information if none exists for the data feed the chart is using. A realtime indicator such as this one only displays information accumulated while it is running on a chart. The information it calculates cannot be saved on charts, nor can it be recalculated from historical bars. If you refresh the chart, or the script must re-execute for some reason, as when you change inputs, the accumulated information will be lost.
Because "Realtime 5D Profile" requires time to accumulate information on the chart, it will be most useful to traders working on small timeframes who trade only one instrument and do not frequently change their chart's symbol or timeframe. Traders working on higher timeframes or constantly changing charts will be better served by TradingView's volume profiles. Before using this indicator, please see the "Limitations" section further down for other important information.
█ HOW TO USE IT
Load the indicator on an active chart (see here if you don't know how).
The default configuration displays:
• A double-sided volume profile showing at what price levels activity has occurred.
• The left side shows "down" volume, the right side shows "up" volume.
• The value corresponding to each level is displayed.
• The width of lines reflects their relative value.
• The thickness of lines reflects their age. Four thicknesses are used, with the thicker lines being the most recent.
• The total value of down/up values for the profile appears at the top.
To understand how to use profiles in your trading, please research the subject. Searches on "volume profile" or "market profile" will yield many useful results. I provide you with tools — I do not teach trading. To understand more about this indicator, read on. If you choose not to do so, please don't ask me to answer questions that are already answered here, nor to make videos; I don't.
█ CONCEPTS
Delta calculations
Volume is slotted in up or down slots depending on whether the price of each new chart update is higher or lower than the previous update's price. When price does not move between chart updates, the last known direction is used. In a perfect world, Pine scripts would have access to bid and ask levels, as this would allow us to know for sure if market orders are being filled on upticks (at the ask) or downticks (at the bid). Comparing the price of successive chart updates provides the most precise way to calculate volume delta on TradingView, but it is still a compromise. Order books are in constant movement; in some cases, order cancellations can cause sudden movements of both the bid and ask levels such that the next chart update can occur on an uptick at a lower price than the previous one (or vice versa). While this update's volume should be slotted in the up slot because a buy market order was filled, it will erroneously be slotted in the down slot because the price of the chart's update is lower than that of the previous one. Luckily, these conditions are relatively rare, so they should not adversely affect calculations.
Levels
A profile is a tool that displays information organized by price levels. You can select the maximum quantity of levels this indicator displays by using the script's "Levels" input. If the profile's height is small enough for level increments to be less than the symbol's tick size, a smaller quantity of levels is used until the profile's height grows sufficiently to allow your specified quantity of levels to be displayed. The exact position of levels is not tethered to the symbol's tick increments. Activity for one level is that which happens on either side of the level, halfway between its higher or lower levels. The lowest/highest levels in the profile thus appear higher/lower than the profile's low/high limits, which are determined by the lowest/highest points reached by price during the profile's life.
Level Values and Length
The profile's vertical structure is dynamic. As the profile's height changes with the price range, it is rebalanced and the price points of its levels may be recalculated. When this happens, past updates will be redistributed among the new profile's levels, and the level values may thus change. The new levels where updates are slotted will of course always be near past ones, but keep this fluidity in mind when watching level values evolve.
The profile's horizontal structure is also dynamic. The maximum length of level lines is controlled by the "Maximum line length" input value. This maximum length is always used for the largest level value in the profile, and the length of other levels is determined by their value relative to that maximum.
Updates vs Ticks
Strictly speaking, a tick is the record of a transaction between two parties. On TradingView, these are detected on seconds charts. On other charts, ticks are aggregated to form a chart update . I use the broader "update" term when it names both events. Note that, confusingly, tick is also used to name an instrument's minimal price increment.
Volume Quality
If you use volume, it's important to understand its nature and quality, as it varies with sectors and instruments. My Volume X-ray indicator is one way you can appraise the quality of an instrument's intraday volume.
█ FEATURES
Double-Sided Profiles
When you choose one of the first two configuration selections in the "Configuration" field's dropdown menu, you are asking the indicator to display a double-sided profile, i.e., where the down values appear on the left and the up ones on the right. In this mode, the formatting options in the top section of inputs apply to both sides of the profile.
Single-Sided Profiles
The six other selections down the "Configuration" field's dropdown menu select single-sided profiles, where one side aggregates the up/down values for either volume or ticks. In this mode, the formatting options in the top section of inputs apply to the left profile. The ones in the following "Right format" section apply to the right profile.
Calculation Mode
The "Calculation" input field allows the selection of one of two modes which applies to single-sided profiles only. Values can represent the simple total of volume or ticks at each level, or their delta. The mode has no effect when a double-sided profile is used because then, the total is represented by the sum of the left and right sides. Note that when totals are selected, all levels appear in the up color.
Age
The age of each level is always displayed as one of four line thicknesses. Thicker lines are used for the youngest levels. The age of levels is determined by averaging the times of the updates composing that level. When viewing double-sided profiles, the age of each side is calculated independently, which entails you can have a down level on the left side of the profile appear thinner than its corresponding up side level line on the right side because the updates composing the up side are more recent. When calculating the age of single-sided profiles, the age of the up/down values aggregated to calculate the side are averaged. Since they may be different, the averaged level ages will not be as responsive as when using a double-sided profile configuration, where the age of levels on each side is calculated independently and follows price action more closely. Moreover, when displaying two single-sided profiles (volume on one side and ticks on the other), the age of both sides will match because they are calculated from the same realtime updates.
Profile Resets
The profile can reset on timeframes or trend changes. The usual timeframe selections are available, including the chart's, in which case the profile will reset on each new chart bar. One of two trend detection logics can be used: Supertrend or the one used by LazyBear in his Weis Wave indicator . Settings for the trend logics are in the bottommost section of the inputs, where you can also control the display of trend changes and states. Note that the "Timeframe" field's setting also applies to the trend detection mechanism. Whatever the timeframe used for trend detection, its logic will not repaint.
Format
Formatting a profile for charts is often a challenge for traders, and this one is no exception. Varying zoom factors on your chart and the frequency of profile resets will require different profile formats. You can achieve a reasonable variety of effects by playing with the following input fields:
• "Resets on" controls how frequently new profiles are drawn. Spacing out profiles between bars can help make them more usable.
• "Levels" determines the maximum quantity of levels displayed.
• "Offset" allows you to shift the profile horizontally.
• "Profile size" affects the global size of the profile.
• Another "Size" field provides control over the size of the totals displayed above the profile.
• "Maximum line length" controls how far away from the center of the bar the lines will stretch left and right.
Colors
The color and brightness of levels and totals always allows you to determine the winning side between up and down values. On double-sided profiles, each side is always of one color, since the left side is down values and the right side, up values. However, the losing side is colored with half its brightness, so the emphasis is put on the winning side. When there is no winner, the toned-down version of each color is used for both sides. Single-sided profiles use the up and down colors in full brightness on the same side. Which one is used reflects the winning side.
Candles
The indicator can color candle bodies and borders independently. If you choose to do so, you may want to disable the chart's bars by using the eye icon near the symbol's name.
Tooltips
A tooltip showing the value of each level is available. If they do not appear when hovering over levels, select the indicator by clicking on its chart name. This should get the tooltips working.
Data Window
As usual, I provide key values in the Data Window, so you can track them. If you compare total realtime volumes for the profile and the built-in "Volume" indicator, you may see variations at some points. They are due to the different mechanisms running each program. In my experience, the values from the built-in don't always update as often as those of the profile, but they eventually catch up.
█ LIMITATIONS
• The levels do not appear exactly at the position they are calculated. They are positioned slightly lower than their actual price levels.
• Drawing a 20-level double-sided profile with totals requires 42 labels. The script will only display the last 500 labels,
so the number of levels you choose affects how many past profiles will remain visible.
• The script is quite taxing, which will sometimes make the chart's tab less responsive.
• When you first load the indicator on a chart, it will begin calculating from that moment; it will not take into account prior chart activity.
• If you let the script run long enough when using profile reset criteria that make profiles last for a long time, the script will eventually run out of memory,
as it will be tracking unmanageable amounts of chart updates. I don't know the exact quantity of updates that will cause this,
but the script can handle upwards of 60K updates per profile, which should last 1D except on the most active markets. You can follow the number of updates in the Data Window.
• The indicator's nature makes it more useful at very small timeframes, typically in the sub 15min realm.
• The Weis Wave trend detection used here has nothing to do with how David Weis detects trend changes.
LazyBear's version was a port of a port, so we are a few generations removed from the Weis technique, which uses reversals by a price unit.
I believe the version used here is useful nonetheless because it complements Supertrend rather well.
█ NOTES
The aggregated view that volume and tick profiles calculate for traders is a good example of one of the most useful things software can do for traders: look at things from a methodical, mathematical perspective, and present results in a meaningful way. Profiles are powerful because, if the volume data they use is of good enough quality, they tell us what levels are important for traders, regardless of the nature or rationality of the methods traders have used to determine those levels. Profiles don't care whether traders use the news, fundamentals, Fib numbers, pivots, or the phases of the moon to find "their" levels. They don't attempt to forecast or explain markets. They show us real stuff containing zero uncertainty, i.e., what HAS happened. I like this.
The indicator's "VPAA" chart name represents four of the five dimensions the indicator displays: volume, price, activity and age. The time dimension is implied by the fact it's a profile — and I couldn't find a proper place for a "T" in there )
I have not included alerts in the script. I may do so in the future.
For the moment, I have no plans to write a profile indicator that works on historical bars. TradingView's volume profiles already do that, and they run much faster than Pine versions could, so I don't see the point in spending efforts on a poor ersatz.
For Pine Coders
• The script uses labels that draw varying quantities of characters to break the limitation constraining other Pine plots/lines to bar boundaries.
• The code's structure was optimized for performance. When it was feasible, global arrays, "input" and other variables were used from functions,
sacrificing function readability and portability for speed. Code was also repeated in some places, to avoid the overhead of frequent function calls in high-traffic areas.
• I wrote my script using the revised recommendations in the Style Guide from the Pine v5 User Manual.
█ THANKS
• To Duyck for his function that sorts an array while keeping it in synch with another array.
The `sortTwoArrays()` function in my script is derived from the Pine Wizard 's code.
• To the one and only Maestro, RicardoSantos , the creative volcano who worked hard to write a function to produce fixed-width, figure space-padded numeric values.
A change in design made the function unnecessary in this script, but I am grateful to you nonetheless.
• To midtownskr8guy , another Pine Wizard who is also a wizard with colors. I use the colors from his Pine Color Magic and Chart Theme Simulator constantly.
• Finally, thanks to users of my earlier "Delta Volume" scripts. Comments and discussions with them encouraged me to persist in figuring out how to achieve what this indicator does.

Ehlers Squelch Indicator [CC]The Squelch Indicator was created by John Ehlers (Stocks & Commodities V. 18:9 (42-46)) and this indicator is a variation of his Market Mode Indicator and its purpose is the same as in it determines if the market is trending or in a choppy market. If this indicator is at the 1 level then this means the market is trending and if it is at 0 then the market is choppy. I would recommend to adjust the squelch variable to find a setting that works well for you. If you want to avoid more choppy markets then adjust the squelch variable to a lower amount and vice versa. I have included basic buy and sell signals so buy when the line turns green and sell when it turns red.
Let me know if there are any other indicators you would like to see me publish!

Harmonic Trading System Educational (Source Code)This indicator was intended as educational purpose only for Harmonic Patterns using XABCD Pattern Tool.
This indicator was build upon Harmonic Trading : Volume One and Harmonic Trading : Volume Three, written by Scott M Carney.
Harmonic Trading System consist of 3 important elements such as Trade Identification, Trade Execution and Trade Management, each of these element description can be hover at each label.
Harmonic Trading System
1. Trade Identification
This technique use historically proven and repetitive price patterns that focus on overbought and oversold signals generated by price action.
Understanding parameters is critical to define specific opportunities based on individual harmonic pattern including ratio is important.
2. Trade Execution
During harmonic pattern is complete, must focus actual trade within specific time period.
3. Trade Management
Specific Initial Price Objective (IPO) based on risk and opportunity.
Indikator ini bertujuan sebagai pendidikan sahaja untuk Harmonic Pattern menggunakan XABCD Pattern Tool.
Indikator ini dibina berdasarkan buku Harmonic Trading : Volume One dan Harmonic Trading : Volume Three, ditulis oleh Scott M Carney.
Harmonic Trading System mengandungi 3 element penting seperti Trade Identification, Trade Execution dan Trade Management, penerangan setiap elemen boleh didapati dengan meletak mouse pada label.
Harmonic Trading System
1. Trade Identification
Teknik ini menggunakan price patterns yang berulang dan sejarahnya terbukti yang fokus pada signal overbought dan oversold terhasil daripada price action.
Memahami parameter adalah penting untuk mengenalpasti peluang secara spesifik berdasarkan harmonic patern yang tertentu termasuk ratio adalah penting.
2. Trade Execution
Semasa harmonic pattern adalah lengkap, mestilah focus pada trade yang sebenar dalam jangka masa yang spesifik.
3. Trade Management
Initial Price Objective (IPO) secara spesifik berdasarkan risiko dan peluang.
Indicator features :
1. List XAB=CD patterns including ratio and reference page.
2. For desktop display only, not for mobile.
3. Hover to label to display tooltip (example Trade identification).
Kemampuan indikator :
1. Senarai XAB=CD pattern termasuk ratio and rujukan muka surat.
2. Untuk paparan desktop sahaja, bukan untuk mobile.
3. Letak mouse pada labell untuk memaparkan tooltip (example Trade identification).
FAQ
1. Credits / Kredit
Scott M Carney, Harmonic Trading : Volume One
Scott M Carney, Harmonic Trading : Volume Three
2. Pattern and Chapter involved / Pattern dan Bab terlibat
Bullish Harmonic Trade Management Model - Harmonic Trading: Volume One - Page 209
Bearish Harmonic Trade Management Model - Harmonic Trading: Volume One - Page 220
The Harmonic Trading Process - Harmonic Trading: Volume Three - Page 42 to 44
Bullish Phases of Trading - Harmonic Trading: Volume Three - Page 48
Bearish Phases of Trading - Harmonic Trading: Volume Three - Page 50
3. Code Usage / Penggunaan Kod
Free to use for personal usage but credits are most welcomed especially for credits to Scott M Carney.
Bebas untuk kegunaan peribadi tetapi kredit adalah amat dialu-alukan terutamanya kredit kepada Scott M Carney.
Bullish Harmonic Trading System
Bearish Harmonic Trading System

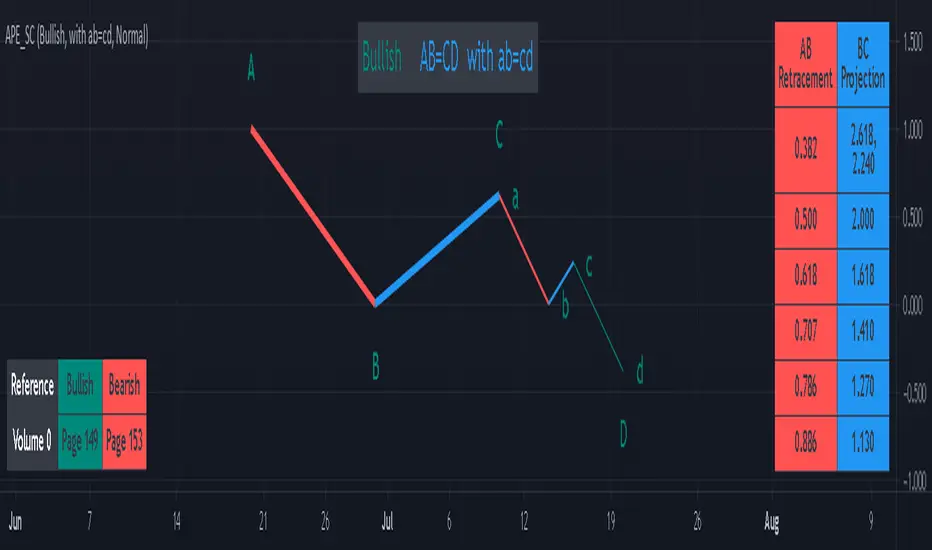
AB=CD Pattern Educational (Source Code)This indicator was intended as educational purpose only for AB=CD Patterns.
AB=CD Patterns were explained and modernized starting from The Harmonic Trader and Harmonic Trading: Volume One until Volume Three written by Scott M Carney.
Indikator ini bertujuan sebagai pendidikan sahaja untuk AB=CD Pattern.
AB=CD Patterns telah diterangkan dan dimodenkan bermula dari The Harmonic Trader dan Harmonic Trading: Volume One hingga Volume Three ditulis oleh Scott M Carney.
Indicator features :
1. List AB=CD patterns including ratio and reference page.
2. For desktop display only, not for mobile.
Kemampuan indikator :
1. Senarai AB=CD pattern termasuk ratio and rujukan muka surat.
2. Untuk paparan desktop sahaja, bukan untuk mobile.
FAQ
1. Credits / Kredit
Scott M Carney
Scott M Carney, Harmonic Trading: Volume One until Volume Three
2. Pattern and Chapter involved / Pattern dan Bab terlibat
Ideal AB=CD - The Harmonic Trader - Page 118 & 129
Standard AB=CD - The Harmonic Trader - Page 116, 117, 127 & 128, Harmonic Trading: Volume One - Page 42, 51, Harmonic Trading: Volume Three - Page 76 & 78
Alternate AB=CD - The Harmonic Trader - Page 142 & 145, Harmonic Trading: Volume One - Page 62, 63
Perfect AB=CD - Harmonic Trading: Volume One - Page 64 & 66
Reciprocal AB=CD - Harmonic Trading: Volume Two - Page 74 & 76
AB=CD with ab=cd - The Harmonic Trader - Page 149 & 153
AB=CD with BC Layering Technique - Harmonic Trading: Volume Three - Page 81 & 84
3. Code Usage / Penggunaan Kod
Free to use for personal usage but credits are most welcomed especially for credits to Scott M Carney.
Bebas untuk kegunaan peribadi tetapi kredit adalah amat dialu-alukan terutamanya kredit kepada Scott M Carney.
Bullish / Bearish Ideal AB=CD
Bullish / Bearish Standard AB=CD
Bullish / Bearish Alternate AB=CD
Bullish / Bearish Perfect AB=CD
Bullish / Bearish Reciprocal AB=CD (Additional value for reciprocal retracement 3.140 and 3.618)
Bullish / Bearish AB=CD with ab=cd
Bullish / Bearish AB=CD with BC Layering Technique
SuperTrend - Custom Screener and Dynamic AlertsTrading View today published a desktop Bad Internet connection indicator ?! which set me thinking…
Despite recently introduced Dynamic Alerts many scripts do not leverage the information available for active traders and traders on the GO!
So decided to share this script totally ALERT focused on one of the most popular DAY trading indicators.
Of course no more BAD internet problem as long your TV APP is configured , you will have enough data for a mental picture of the chart..
The Alerts give you the BAR Close , %percent gain or loss over previous day CLOSE ++ Previous Day High and Low to effectively plan your trade without a chart!(just in case)
2 additions in the way Alerts are delivered over the last script :
1. You get SUMMARY alerts or concatenated alerts by default , however if you uncomment or activate code lines 48 and 55 you will get individual Stock alerts Too!
2. Summary Alerts will come only if there is some Buy or Sell signal NO more empty Alerts!
Few useful EXTRAS in the code :
1. Flexible code can convert any indicator to screener or Alert function.
2. You will NOT get Mutable Variable error while converting any indicator to screener as long as the function is in "GLOBAL" scope..
3. Many Custom Screeners are available but few give OHLC data in output so easily…and very difficult for traders to MODIFY hundreds of lines of code..
4. For UP or DOWN on SCREEN Stock monitoring copy /paste functions in line 41 and 42 in lieu of CROSS functions in 44 and 51 respectively..
5. You can also uncomment/activate lines 66 and 67 for labels in monitoring.
6. The default mode of the scripts is set to Alerts!
Max Stocks only 20!
Finally idea is to help traders to use the great features that TV works so hard to create and constantly improvise.
Enjoy Profitable Trading on the Fly !!

Williams %R two linesCompare relative strength between two lines of Williams %R
Default daily length1=21, length2=42
Long When 2 lines Crossed above -80 or -50 together
Short When 2 lines Crossed below -20 or -50 together
Notes:
I am not good at short yet. Only Show long samples here.

Bull Call Spread Entry StrategyThis strategy script uses the "Spread Entry Strength" overlay indicator script I designed to show entry timing optimized for an Option Bull
Call Spread.
As for this strategy...
The defaults for the strategy itself are as follows:
Period for strategy: 1/1/18 to 12/1/2021. This can be changed to a different period using the settings.
Condition for entry:
Bull Spread Entry Strength >= "Overlay Signal Strength Level"
Limit entry is used, price must be <= close when signaled
Entry occurs by next day or the order is cancelled
Condition for exit (uses a timed exit):
Bars passed since order entry >= 30 (6 weeks..~42 calendar days)
Thursday (day before "option" expiration date... assuming weekly options exist)
All of the user settings from the overlay are pulled into this for customization purposes. Details of the actual Spread Entry Strength overlay are as follows (copied from my shared indicator):
2 background shadings will occur:
The background will shade blue if the ticker is prime for a Bullish Call spread.
The background will shade purple if the the ticker is prime for a Bearish Put spread.
In theory, if the SE Strength is at one of the extremes of the Bear or Bull side, then a spread is prime for entry.
To calculate this, 8 conditions receive a 1 or zero dependent on whether the condition is true (1) or false (0), and then all of those are summed. The primary gist of the strength comes from Nishant's book, or my interpretation thereof, with some additives that limits what I need to review (such as condition 8 below.)
The 8 Bull Conditions are:
1) Bollinger Bands are outside of the Keltner Channels
2) ADX is trending up
3) RSI is trending up
4) -DI is trending down
5) RSI is under 30
6) Price is below the lower Keltner Channel
7) Price is between the lower Bollinger Band and the Bollinger basis.
8) Price at one point within the last 5 bars was below the lower Bollinger Band
The 8 Bear Conditions are the inverse conditions (except the first):
1) Bollinger Bands are outside of the Keltner Channels
2) ADX is trending down
3) RSI is trending down
4) +DI is trending up
5) RSI is over 70
6) Price is above the upper Keltner Channel
7) Price is between the upper Bollinger Band and the Bollinger basis.
8) Price at one point within the last 5 bars was above the upper Bollinger Band
There is a "market noise" filter that will filter out shading when another market move is considered, i.e. if you don't want to see the potential trade when QQQ moves more than 1% then do the following in the settings:
Check "Market Filter"
Enter QQQ in the "Market Ticker To Use"
Enter 1 in the "Market Too Hot Level"
Press Ok
Obviously, the same holds true for the "Market Too Cool Filter."
Second release notes:
Overlay Signal Strength Level - You can set your own "level" for the overlay in the settings, instead of having to change the script code itself. I have the default set to 6. A lower number shows more overlays, a higher number shows fewer (i.e. more conditions have been met.).
Provide Narrative (Troubleshooting) - Narrative label created with several outputs that will show after the last bar. This narrative needs to be turned on in the settings, as the default is "off" ... unchecked.
Remove Strength Indicator When Squeezed - when checked no overlays will be produced regardless of "scoring." Default is off.
Show Squeezes (Will Override Indicator When Concurrent) - overlays an orange background when the ticker is in a squeeze. I am still working on the accuracy here, but it's usable. This will override the strength indicator as well. This needs to be turned on, if you want it.
Short SMA Period - period used to calculate the short SMA, used in the narrative only, at this point in time.
Medium SMA Period - period used to calculate the medium SMA, used in the narrative only, at this point in time.
Long SMA Period - period used to calculate the medium SMA, used in the narrative only, at this point in time.
Outside of the settings... a few calculation adjustments here and there have occurred and some color shading adjustments to allow for the adjustable level setting.

[blackcat] L3 Ehlers Spectrogram IndicatorLevel: 3
Background
John F. Ehlers introuced Dominant Cycle and Spectrogram Indicator in Mar, 2008.
Function
In "Measuring Cycle Periods" in Mar, 2008, John Ehlers presented a very interesting technique of measuring dominant market cycle periods by means of multiple bandpass filtering. By utilizing an approach similar to audio equalizers, the signal (here, the price series) is fed into a set of simple second-order infinite impulse response bandpass filters. Filters are tuned to 8,9,10,...,50 periods. The filter with the highest output represents the dominant cycle. This script implements a high-pass filter and a six-tap low-pass Fir filter on input, then 42 parallel Iir band-pass filters. Finally, it plots the Ehlers spectrogram as a heat map.
Ehlers Spectrogram indicates market power status:
With high market power, the spectrogram become fuzzy;
With low market power, the spectrogram become distinct.
It also discloses market dominant cycles and subcycles, which indicates the major rhythm. Regarding the rhythm of the market, Chinese and Western cultures have reached a consensus: Dr. Ehlers can find the main harmonic components of the market through DSP analysis via spectrum; Master Zen compares the market rhythm to Bach’s fugue from a philosophical perspective, where there is a rhythm of life.
Finally, please allow me to quote Master Zen’s statement on market rhythm:
"The market is cruel. For those who try to violate the market rhythm, the market is their death place; the market is beautiful, and the market is Bach’s fugue. There is a rhythm of life. Rhythm is always the rhythm of the market. A market participant without a sense of rhythm is always torturing. Put aside your greed and fear and listen to the rhythm of the market. In the weekend, let go of everything, but listen to the rhythm of nature, the rhythm of life, the rhythm of music, and then come back to listen to the rhythm of the market. Dancing with the market, your greed and fear are peeled off one by one, you will become very bright."
Key Signal
DomCyc--> Ehlers Dominant Cycle
Plot2~Plot60--> Ehlers Spectrum Heat Map
Pros and Cons
100% John F. Ehlers definition translation, even variable names are the same. This help readers who would like to use pine to read his book.
Remarks
The 73th script for Blackcat1402 John F. Ehlers Week publication.
Readme
In real life, I am a prolific inventor. I have successfully applied for more than 60 international and regional patents in the past 12 years. But in the past two years or so, I have tried to transfer my creativity to the development of trading strategies. Tradingview is the ideal platform for me. I am selecting and contributing some of the hundreds of scripts to publish in Tradingview community. Welcome everyone to interact with me to discuss these interesting pine scripts.
The scripts posted are categorized into 5 levels according to my efforts or manhours put into these works.
Level 1 : interesting script snippets or distinctive improvement from classic indicators or strategy. Level 1 scripts can usually appear in more complex indicators as a function module or element.
Level 2 : composite indicator/strategy. By selecting or combining several independent or dependent functions or sub indicators in proper way, the composite script exhibits a resonance phenomenon which can filter out noise or fake trading signal to enhance trading confidence level.
Level 3 : comprehensive indicator/strategy. They are simple trading systems based on my strategies. They are commonly containing several or all of entry signal, close signal, stop loss, take profit, re-entry, risk management, and position sizing techniques. Even some interesting fundamental and mass psychological aspects are incorporated.
Level 4 : script snippets or functions that do not disclose source code. Interesting element that can reveal market laws and work as raw material for indicators and strategies. If you find Level 1~2 scripts are helpful, Level 4 is a private version that took me far more efforts to develop.
Level 5 : indicator/strategy that do not disclose source code. private version of Level 3 script with my accumulated script processing skills or a large number of custom functions. I had a private function library built in past two years. Level 5 scripts use many of them to achieve private trading strategy.
[blackcat] L2 Ehlers Dominant Cycle Tuned Bandpass FilterLevel: 2
Background
John F. Ehlers introuced his Dominant Cycle Tuned Bandpass Filter Strategy in Mar, 2008.
Function
In "Measuring Cycle Periods", author John Ehlers presents a very interesting technique of measuring dominant market cycle periods by means of multiple bandpass filtering. By utilizing an approach similar to audio equalizers, the signal (here, the price series) is fed into a set of simple second-order infinite impulse response bandpass filters. Filters are tuned to 8,9,10,...,50 periods. The filter with the highest output represents the dominant cycle. A full-featured formula that implements a high-pass filter and a six-tap low-pass Fir filter on input, then 42 parallel Iir band-pass filters.
I've coded John Ehlers' filter bank to measure the dominant cycle (DC) and the sine and cosine filter components in pine v4 for TradingView, based on John Ehlers' article in this issue, "Measuring Cycle Periods." The CycleFilterDC function plots and returns the DC series and its components, so it's a trivial matter to make use of them in a trading strategy.
Based on John Ehlers' article, "Measuring Cycle Periods," he chose to implement the dominant cycle-tuned bandpass filter response to test Ehlers' suggestion to use the sine and cosine crossovers as buy and sell signals. If the sine closely follows the price pattern as suggested, and the cosine is an effective leading function of the sine, then it seems to make sense that a crossover implementation would work well (Personally, what I observed this is not so accurated as his claims).
What he discovered in his tests was that crossovers happened at frequent intervals, even when price has not moved significantly. This leads to a higher percentage of losing trades, particularly when spread, slippage, and commissions are accounted for. Nevertheless, the cosine crossover was quite effective at identifying reversals very early in many cases, so this indicator could prove quite effective when used alongside other indicators. In particular, the use of an indicator to confirm a certain level of recent volatility, as well as an indicator to confirm significant rate of change, could prove quite helpful.
Key Signal
CosineLine--> Ehlers Dominant Cycle Tuned Bandpass Filter Strategy fast line
SineLine--> Ehlers Dominant Cycle Tuned Bandpass Filter Strategy slow line
Pros and Cons
100% John F. Ehlers definition translation, even variable names are the same. This help readers who would like to use pine to read his book.
Remarks
The 72th script for Blackcat1402 John F. Ehlers Week publication.
NOTE: Although Dr. Ehlers think high of Cosine and Sine wave indicator and trading strategy, my study and trading experience indicated it did not work that well as many other oscillator indicators. However, I would like to keep the original code of Dr. Ehlers for anyone who want to make a deep dive into this kind of indicator or strategy with Cosine and Sine wave.
Readme
In real life, I am a prolific inventor. I have successfully applied for more than 60 international and regional patents in the past 12 years. But in the past two years or so, I have tried to transfer my creativity to the development of trading strategies. Tradingview is the ideal platform for me. I am selecting and contributing some of the hundreds of scripts to publish in Tradingview community. Welcome everyone to interact with me to discuss these interesting pine scripts.
The scripts posted are categorized into 5 levels according to my efforts or manhours put into these works.
Level 1 : interesting script snippets or distinctive improvement from classic indicators or strategy. Level 1 scripts can usually appear in more complex indicators as a function module or element.
Level 2 : composite indicator/strategy. By selecting or combining several independent or dependent functions or sub indicators in proper way, the composite script exhibits a resonance phenomenon which can filter out noise or fake trading signal to enhance trading confidence level.
Level 3 : comprehensive indicator/strategy. They are simple trading systems based on my strategies. They are commonly containing several or all of entry signal, close signal, stop loss, take profit, re-entry, risk management, and position sizing techniques. Even some interesting fundamental and mass psychological aspects are incorporated.
Level 4 : script snippets or functions that do not disclose source code. Interesting element that can reveal market laws and work as raw material for indicators and strategies. If you find Level 1~2 scripts are helpful, Level 4 is a private version that took me far more efforts to develop.
Level 5 : indicator/strategy that do not disclose source code. private version of Level 3 script with my accumulated script processing skills or a large number of custom functions. I had a private function library built in past two years. Level 5 scripts use many of them to achieve private trading strategy.
Session High and Session LowI have heard many people ask for a script that will identify the high and low of a specific session. So, I made one.
Important Note: This indicator has to be set up properly or you will get an error. Important things to note are the length of the range and the session definition. The idea is that you would set it up for what's relevant to your trading. Going too far back in the chart history will cause errors. Setting the session for a time that is not on the chart can cause errors. If you set it to look farther back than there are bars to display, you may get an error. What I've found is that if you get an error, you just need to change the settings to reflect available data and it will be able to compile the script. At the time of its publishing, the default range start is set to 10/01/2020. If you're looking at this years later, you'll probably have to set the range to something more recent.
Features:
Plot or Lines:
Using Plot (displayed), the indicator will track the high/low from the end of the session into the next session. Then at the start of the next session, it will start tracking the high/low of that session until its end, then track that high/low until the start of the next session then reset.
Using lines, it will extend horizontal lines to the right indefinitely. The number of sessions back that the lines apply to is a user-defined number of sessions. There are limits to the number of lines that can be cast on a chart (roughly 40-50). So, the maximum number of sessions you can apply the lines to is the last 21 sessions (42 lines total). That gets really noisy though so I can't imagine that is a limiting factor.
Colors:
You can change the background color and its transparency, as well as turn the background color on or off.
You can change the highs and lows colors
You can adjust the line width to your preference
Session Length:
You can use a continuous session covering any user-defined period (provided its not tooooo many candles back)
You can define the session length for intraday
You can exclude weekends
Display Options:
You can adjust the colors, transparency, and linewidth
You can display the plotline or horizontal lines
You can show/hide the background color.
You can change how many sessions back the horizontal lines will track
Let me know if there's anything this script is missing or if you run into any issues that I might be able to help resolve.
Here's what it looks like with Lines for the last 5 sessions and different background color.

McGinley Dynamic Indicator This is a strategy based on the Mcginley Dynamic Moving Average indicator, a type of moving average that was designed to track the market better than existing moving average indicators. It is a technical indicator that improves upon moving average lines by adjusting for shifts in market speed.
Moving averages used:
EMA: 21
EMA: 42
The chart used for the backtest was the Bovespa Futures Index ( WIN1! Continuous: current contract in front )
