Williams %R StrategyThe Williams %R Strategy implemented in Pine Script™ is a trading system based on the Williams %R momentum oscillator. The Williams %R indicator, developed by Larry Williams in 1973, is designed to identify overbought and oversold conditions in a market, helping traders time their entries and exits effectively (Williams, 1979). This particular strategy aims to capitalize on short-term price reversals in the S&P 500 (SPY) by identifying extreme values in the Williams %R indicator and using them as trading signals.
Strategy Rules:
Entry Signal:
A long position is entered when the Williams %R value falls below -90, indicating an oversold condition. This threshold suggests that the market may be near a short-term bottom, and prices are likely to reverse or rebound in the short term (Murphy, 1999).
Exit Signal:
The long position is exited when:
The current close price is higher than the previous day’s high, or
The Williams %R indicator rises above -30, indicating that the market is no longer oversold and may be approaching an overbought condition (Wilder, 1978).
Technical Analysis and Rationale:
The Williams %R is a momentum oscillator that measures the level of the close relative to the high-low range over a specific period, providing insight into whether an asset is trading near its highs or lows. The indicator values range from -100 (most oversold) to 0 (most overbought). When the value falls below -90, it indicates an oversold condition where a reversal is likely (Achelis, 2000). This strategy uses this oversold threshold as a signal to initiate long positions, betting on mean reversion—an established principle in financial markets where prices tend to revert to their historical averages (Jegadeesh & Titman, 1993).
Optimization and Performance:
The strategy allows for an adjustable lookback period (between 2 and 25 days) to determine the range used in the Williams %R calculation. Empirical tests show that shorter lookback periods (e.g., 2 days) yield the most favorable outcomes, with profit factors exceeding 2. This finding aligns with studies suggesting that shorter timeframes can effectively capture short-term momentum reversals (Fama, 1970; Jegadeesh & Titman, 1993).
Scientific Context:
Mean Reversion Theory: The strategy’s core relies on mean reversion, which suggests that prices fluctuate around a mean or average value. Research shows that such strategies, particularly those using oscillators like Williams %R, can exploit these temporary deviations (Poterba & Summers, 1988).
Behavioral Finance: The overbought and oversold conditions identified by Williams %R align with psychological factors influencing trading behavior, such as herding and panic selling, which often create opportunities for price reversals (Shiller, 2003).
Conclusion:
This Williams %R-based strategy utilizes a well-established momentum oscillator to time entries and exits in the S&P 500. By targeting extreme oversold conditions and exiting when these conditions revert or exceed historical ranges, the strategy aims to capture short-term gains. Scientific evidence supports the effectiveness of short-term mean reversion strategies, particularly when using indicators sensitive to momentum shifts.
References:
Achelis, S. B. (2000). Technical Analysis from A to Z. McGraw Hill.
Fama, E. F. (1970). Efficient Capital Markets: A Review of Theory and Empirical Work. The Journal of Finance, 25(2), 383-417.
Jegadeesh, N., & Titman, S. (1993). Returns to Buying Winners and Selling Losers: Implications for Stock Market Efficiency. The Journal of Finance, 48(1), 65-91.
Murphy, J. J. (1999). Technical Analysis of the Financial Markets: A Comprehensive Guide to Trading Methods and Applications. New York Institute of Finance.
Poterba, J. M., & Summers, L. H. (1988). Mean Reversion in Stock Prices: Evidence and Implications. Journal of Financial Economics, 22(1), 27-59.
Shiller, R. J. (2003). From Efficient Markets Theory to Behavioral Finance. Journal of Economic Perspectives, 17(1), 83-104.
Williams, L. (1979). How I Made One Million Dollars… Last Year… Trading Commodities. Windsor Books.
Wilder, J. W. (1978). New Concepts in Technical Trading Systems. Trend Research.
This explanation provides a scientific and evidence-based perspective on the Williams %R trading strategy, aligning it with fundamental principles in technical analysis and behavioral finance.
ค้นหาในสคริปต์สำหรับ "wind+芯片行业+市盈率+财经数据"

HTFBands█ OVERVIEW
Contains type and methods for drawing higher-timeframe bands of several types:
Bollinger bands
Parabolic SAR
Supertrend
VWAP
By copy pasting ready made code sections to your script you can add as many multi-timeframe bands as necessary.
█ HOW TO USE
Please see instructions in the code. (Important: first fold all sections of the script: press Cmd + K then Cmd + - (for Windows Ctrl + K then Ctrl + -)
█ FULL LIST OF FUNCTIONS AND PARAMETERS
atr2(length)
An alternate ATR function to the `ta.atr()` built-in, which allows a "series float"
`length` argument.
Parameters:
length (float) : (series int/float) Length for the smoothing parameter calculation.
Returns: (float) The ATR value.
pine_supertrend2(factor, atrLength, wicks)
An alternate SuperTrend function to `supertrend()`, which allows a "series float"
`atrLength` argument.
Parameters:
factor (float) : (series int/float) Multiplier for the ATR value.
atrLength (float) : (series int/float) Length for the ATR smoothing parameter calculation.
wicks (simple bool) : (simple bool) Condition to determine whether to take candle wicks into account when
reversing trend, or to use the close price. Optional. Default is false.
Returns: ( ) A tuple of the superTrend value and trend direction.
method getDefaultBandQ1(bandType)
For a given BandType returns its default Q1
Namespace types: series BandTypes
Parameters:
bandType (series BandTypes)
method getDefaultBandQ2(bandType)
For a given BandType returns its default Q2
Namespace types: series BandTypes
Parameters:
bandType (series BandTypes)
method getDefaultBandQ3(bandType)
For a given BandType returns its default Q3
Namespace types: series BandTypes
Parameters:
bandType (series BandTypes)
method init(this, bandsType, q1, q2, q3, vwapAnchor)
Initiates RsParamsBands for each band (used in htfUpdate() withi req.sec())
Namespace types: RsParamsBands
Parameters:
this (RsParamsBands)
bandsType (series BandTypes)
q1 (float) : (float) Depending on type: BB - length, SAR - AF start, ST - ATR's prd
q2 (float) : (float) Depending on type: BB - StdDev mult, SAR - AF step, ST - mult
q3 (float) : (float) Depending on type: BB - not used, SAR - AF max, ST - not used
vwapAnchor (series VwapAnchors) : (VwapAnchors) VWAP ahcnor
method init(this, bandsType, tf, showRecentBars, lblsShow, lblsMaxLabels, lblSize, lnMidClr, lnUpClr, lnLoClr, fill, fillClr, lnWidth, lnSmoothen)
Initialises object with params (incl. input). Creates arrays if any.
Namespace types: HtfBands
Parameters:
this (HtfBands)
bandsType (series BandTypes) : (BandTypes) Just used to enable/disable - if BandTypes.none then disable )
tf (string) : (string) Timeframe
showRecentBars (int) : (int) Only show over this number of recent bars
lblsShow (bool) : (bool) Show labels
lblsMaxLabels (int) : (int) Max labels to show
lblSize (string) : (string) Size of the labels
lnMidClr (color) : (color) Middle band color
lnUpClr (color) : (color) Upper band color
lnLoClr (color) : (color) Lower band color
fill (bool)
fillClr (color) : (color) Fill color
lnWidth (int) : (int) Line width
lnSmoothen (bool) : (bool) Smoothen the bands
method htfUpdateTuple(rsPrms, repaint)
(HTF) Calculates Bands within request.security(). Returns tuple . If any or all of the bands are not available returns na as their value.
Namespace types: RsParamsBands
Parameters:
rsPrms (RsParamsBands) : (RsParamsBands) Parameters of the band.
repaint (bool) : (bool) If true does not update on realtime bars.
Returns: A tuple (corresponds to fields in RsReturnBands)
method importRsRetTuple(this, htfBi, mid, up, lo, dir)
Imports a tuple returned from req.sec() into an HtfBands object
Namespace types: HtfBands
Parameters:
this (HtfBands) : (HtfBands) Object to import to
htfBi (int) : (float) Higher timeframe's bar index (Default = na)
mid (float)
up (float) : (float) Value of upper band (Default = na)
lo (float) : (float) Value of lower band (Default = na)
dir (int) : (int) Direction (for bands like Parabolic SAR) (Default = na)
method addUpdDrawings(this, rsPrms)
Draws band's labels
Namespace types: HtfBands
Parameters:
this (HtfBands)
rsPrms (RsParamsBands)
method update(this)
Sets band's values to na on intrabars if `smoothen` is set.
Namespace types: HtfBands
Parameters:
this (HtfBands)
method newRsParamsBands(this)
A wraper for RsParamsBands.new()
Namespace types: LO_A
Parameters:
this (LO_A)
method newHtfBands(this)
A wraper for HtfBands.new()
Namespace types: LO_B
Parameters:
this (LO_B)
RsParamsBands
Used to pass bands' params to req.sec()
Fields:
bandsType (series BandTypes) : (enum BandTypes) Type of the band (BB, SAR etc.)
q1 (series float) : (float) Depending on type: BB - length, SAR - AF start, ST - ATR's prd
q2 (series float) : (float) Depending on type: BB - StdDev mult, SAR - AF step, ST - mult
q3 (series float) : (float) Depending on type: BB - not used, SAR - AF max, ST - not used
vwapAnchor (series VwapAnchors)
RsReturnBands
Used to return bands' data from req.sec(). Params of the bands are in RsParamsBands
Fields:
htfBi (series float) : (float) Higher timeframe's bar index (Default = na)
upBand (series float) : (float) Value of upper band (Default = na)
loBand (series float) : (float) Value of lower band (Default = na)
midBand (series float) : (float) Value of middle band (Default = na)
dir (series int) : (float) Direction (for bands like Parabolic SAR) (Default = na)
BandsDrawing
Contains plot visualization parameters and stores and keeps track of lines, labels and other visual objects (not plots)
Fields:
lnMidClr (series color) : (color) Middle band color
lnLoClr (series color) : (color) Lower band color
lnUpClr (series color) : (color) Upper band color
fillUpClr (series color)
fillLoClr (series color)
lnWidth (series int) : (int) Line width
lnSmoothen (series bool) : (bool) Smoothen the bands
showHistory (series bool) : (bool) If true show bands lines, otherwise only current level
showRecentBars (series int) : (int) Only show over this number of recent bars
arLbl (array) : (label Labels
lblsMaxLabels (series int) : (int) Max labels to show
lblsShow (series bool) : (bool) Show labels
lblSize (series string) : (string) Size of the labels
HtfBands
Calcs and draws HTF bands
Fields:
rsRet (RsReturnBands) : (RsReturnBands) Bands' values
rsRetNaObj (RsReturnBands) : (RsReturnBands) Dummy na obj for returning from request.security()
rsPrms (RsParamsBands) : (RsParamsBands) Band parameters (for htfUpdate() called in req.sec() )
drw (BandsDrawing) : (BandsDrawing) Contains plot visualization parameters and stores and keeps track of lines, labels and other visual objects (not plots)
enabled (series bool) : (bool) Toggles bands on/off
tf (series string) : (string) Timeframe
LO_A
LO Library object, whose only purpose is to serve as a shorthand for library name in script code.
Fields:
dummy (series string)
LO_B
LO Library object, whose only purpose is to serve as a shorthand for library name in script code.
Fields:
dummy (series string)

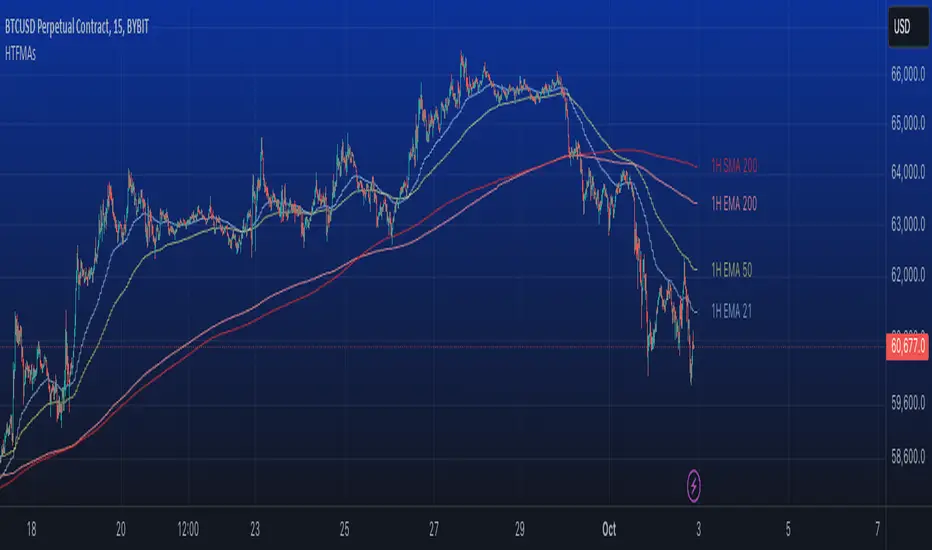
HTFMAs█ OVERVIEW
Contains a type HTFMA used to return data on six moving averages from a higher timeframe.
Several types of MA's are supported.
█ HOW TO USE
Please see instructions in the code (in library description). (Important: first fold all sections of the script: press Cmd + K then Cmd + - (for Windows Ctrl + K then Ctrl + -)
█ FULL LIST OF FUNCTIONS AND PARAMETERS
method getMaType(this)
Enumerator function, given a key returns `enum MaTypes` value
Namespace types: series string, simple string, input string, const string
Parameters:
this (string)
method init(this, enableAll, ma1Enabled, ma1MaType, ma1Src, ma1Prd, ma2Enabled, ma2MaType, ma2Src, ma2Prd, ma3Enabled, ma3MaType, ma3Src, ma3Prd, ma4Enabled, ma4MaType, ma4Src, ma4Prd, ma5Enabled, ma5MaType, ma5Src, ma5Prd, ma6Enabled, ma6MaType, ma6Src, ma6Prd)
Namespace types: RsParamsMAs
Parameters:
this (RsParamsMAs)
enableAll (simple MaEnable)
ma1Enabled (bool)
ma1MaType (series MaTypes)
ma1Src (string)
ma1Prd (int)
ma2Enabled (bool)
ma2MaType (series MaTypes)
ma2Src (string)
ma2Prd (int)
ma3Enabled (bool)
ma3MaType (series MaTypes)
ma3Src (string)
ma3Prd (int)
ma4Enabled (bool)
ma4MaType (series MaTypes)
ma4Src (string)
ma4Prd (int)
ma5Enabled (bool)
ma5MaType (series MaTypes)
ma5Src (string)
ma5Prd (int)
ma6Enabled (bool)
ma6MaType (series MaTypes)
ma6Src (string)
ma6Prd (int)
method init(this, enableAll, tf, rngAtrQ, showRecentBars, lblsOffset, lblsShow, lnOffset, lblSize, lblStyle, smoothen, ma1lnClr, ma1lnWidth, ma1lnStyle, ma2lnClr, ma2lnWidth, ma2lnStyle, ma3lnClr, ma3lnWidth, ma3lnStyle, ma4lnClr, ma4lnWidth, ma4lnStyle, ma5lnClr, ma5lnWidth, ma5lnStyle, ma6lnClr, ma6lnWidth, ma6lnStyle, ma1ShowHistory, ma2ShowHistory, ma3ShowHistory, ma4ShowHistory, ma5ShowHistory, ma6ShowHistory, ma1ShowLabel, ma2ShowLabel, ma3ShowLabel, ma4ShowLabel, ma5ShowLabel, ma6ShowLabel)
Namespace types: HTFMAs
Parameters:
this (HTFMAs)
enableAll (series MaEnable)
tf (string)
rngAtrQ (int)
showRecentBars (int)
lblsOffset (int)
lblsShow (bool)
lnOffset (int)
lblSize (string)
lblStyle (string)
smoothen (bool)
ma1lnClr (color)
ma1lnWidth (int)
ma1lnStyle (string)
ma2lnClr (color)
ma2lnWidth (int)
ma2lnStyle (string)
ma3lnClr (color)
ma3lnWidth (int)
ma3lnStyle (string)
ma4lnClr (color)
ma4lnWidth (int)
ma4lnStyle (string)
ma5lnClr (color)
ma5lnWidth (int)
ma5lnStyle (string)
ma6lnClr (color)
ma6lnWidth (int)
ma6lnStyle (string)
ma1ShowHistory (bool)
ma2ShowHistory (bool)
ma3ShowHistory (bool)
ma4ShowHistory (bool)
ma5ShowHistory (bool)
ma6ShowHistory (bool)
ma1ShowLabel (bool)
ma2ShowLabel (bool)
ma3ShowLabel (bool)
ma4ShowLabel (bool)
ma5ShowLabel (bool)
ma6ShowLabel (bool)
method get(this, id)
Namespace types: RsParamsMAs
Parameters:
this (RsParamsMAs)
id (int)
method set(this, id, prop, val)
Namespace types: RsParamsMAs
Parameters:
this (RsParamsMAs)
id (int)
prop (string)
val (string)
method set(this, id, prop, val)
Namespace types: HTFMAs
Parameters:
this (HTFMAs)
id (int)
prop (string)
val (string)
method htfUpdateTuple(rsParams, repaint)
Namespace types: RsParamsMAs
Parameters:
rsParams (RsParamsMAs)
repaint (bool)
method clear(this)
Namespace types: MaDrawing
Parameters:
this (MaDrawing)
method importRsRetTuple(this, htfBi, ma1, ma2, ma3, ma4, ma5, ma6)
Namespace types: HTFMAs
Parameters:
this (HTFMAs)
htfBi (int)
ma1 (float)
ma2 (float)
ma3 (float)
ma4 (float)
ma5 (float)
ma6 (float)
method getDrw(this, id)
Namespace types: HTFMAs
Parameters:
this (HTFMAs)
id (int)
method setDrwProp(this, id, prop, val)
Namespace types: HTFMAs
Parameters:
this (HTFMAs)
id (int)
prop (string)
val (string)
method initDrawings(this, rsPrms, dispBandWidth)
Namespace types: HTFMAs
Parameters:
this (HTFMAs)
rsPrms (RsParamsMAs)
dispBandWidth (float)
method updateDrawings(this, rsPrms, dispBandWidth)
Namespace types: HTFMAs
Parameters:
this (HTFMAs)
rsPrms (RsParamsMAs)
dispBandWidth (float)
method update(this)
Namespace types: HTFMAs
Parameters:
this (HTFMAs)
method importConfig(this, oCfg, maCount)
Imports HTF MAs settings from objProps (of any level) into `RsParamsMAs` child `RsMaCalcParams` objects (into the first first `maCount` of them)
Namespace types: RsParamsMAs
Parameters:
this (RsParamsMAs) : (RsParamsMAs) Target object to import prop values to.
oCfg (objProps type from moebius1977/CSVParser/1) : (CSVP.objProps) (one of objProps types) an objProps, ... opjProps8 containing properties' values in a child objProps objects
maCount (int) : (int) Number of tgtObj's RsMaCalcParams childs of tgtObj to set (1 to 6, starting from 1)
Returns: this
method importConfig(this, oCfg, maCount)
Imports HTF MAs settings from objProps (of any level) into `RsParamsMAs` child `RsMaCalcParams` objects (into the first first `maCount` of them)
Namespace types: RsParamsMAs
Parameters:
this (RsParamsMAs) : (RsParamsMAs) Target object to import prop values to.
oCfg (objProps0 type from moebius1977/CSVParser/1) : (CSVP.objProps) (one of objProps types) an objProps, ... opjProps8 containing properties' values in a child objProps objects
maCount (int) : (int) Number of tgtObj's RsMaCalcParams childs of tgtObj to set (1 to 6, starting from 1)
Returns: this
method importConfig(this, oCfg, maCount)
Imports HTF MAs settings from objProps (of any level) into `RsParamsMAs` child `RsMaCalcParams` objects (into the first first `maCount` of them)
Namespace types: RsParamsMAs
Parameters:
this (RsParamsMAs) : (RsParamsMAs) Target object to import prop values to.
oCfg (objProps1 type from moebius1977/CSVParser/1) : (CSVP.objProps) (one of objProps types) an objProps, ... opjProps8 containing properties' values in a child objProps objects
maCount (int) : (int) Number of tgtObj's RsMaCalcParams childs of tgtObj to set (1 to 6, starting from 1)
Returns: this
method importConfig(this, oCfg, maCount)
Imports HTF MAs settings from objProps (of any level) into `RsParamsMAs` child `RsMaCalcParams` objects (into the first first `maCount` of them)
Namespace types: RsParamsMAs
Parameters:
this (RsParamsMAs) : (RsParamsMAs) Target object to import prop values to.
oCfg (objProps2 type from moebius1977/CSVParser/1) : (CSVP.objProps) (one of objProps types) an objProps, ... opjProps8 containing properties' values in a child objProps objects
maCount (int) : (int) Number of tgtObj's RsMaCalcParams childs of tgtObj to set (1 to 6, starting from 1)
Returns: this
method importConfig(this, oCfg, maCount)
Imports HTF MAs settings from objProps (of any level) into `RsParamsMAs` child `RsMaCalcParams` objects (into the first first `maCount` of them)
Namespace types: RsParamsMAs
Parameters:
this (RsParamsMAs) : (RsParamsMAs) Target object to import prop values to.
oCfg (objProps3 type from moebius1977/CSVParser/1) : (CSVP.objProps) (one of objProps types) an objProps, ... opjProps8 containing properties' values in a child objProps objects
maCount (int) : (int) Number of tgtObj's RsMaCalcParams childs of tgtObj to set (1 to 6, starting from 1)
Returns: this
method importConfig(this, oCfg, maCount)
Imports HTF MAs settings from objProps (of any level) into `RsParamsMAs` child `RsMaCalcParams` objects (into the first first `maCount` of them)
Namespace types: RsParamsMAs
Parameters:
this (RsParamsMAs) : (RsParamsMAs) Target object to import prop values to.
oCfg (objProps4 type from moebius1977/CSVParser/1) : (CSVP.objProps) (one of objProps types) an objProps, ... opjProps8 containing properties' values in a child objProps objects
maCount (int) : (int) Number of tgtObj's RsMaCalcParams childs of tgtObj to set (1 to 6, starting from 1)
Returns: this
method importConfig(this, oCfg, maCount)
Imports HTF MAs settings from objProps (of any level) into `RsParamsMAs` child `RsMaCalcParams` objects (into the first first `maCount` of them)
Namespace types: RsParamsMAs
Parameters:
this (RsParamsMAs) : (RsParamsMAs) Target object to import prop values to.
oCfg (objProps5 type from moebius1977/CSVParser/1) : (CSVP.objProps) (one of objProps types) an objProps, ... opjProps8 containing properties' values in a child objProps objects
maCount (int) : (int) Number of tgtObj's RsMaCalcParams childs of tgtObj to set (1 to 6, starting from 1)
Returns: this
method importConfig(this, oCfg, maCount)
Imports HTF MAs settings from objProps (of any level) into `RsParamsMAs` child `RsMaCalcParams` objects (into the first first `maCount` of them)
Namespace types: RsParamsMAs
Parameters:
this (RsParamsMAs) : (RsParamsMAs) Target object to import prop values to.
oCfg (objProps6 type from moebius1977/CSVParser/1) : (CSVP.objProps) (one of objProps types) an objProps, ... opjProps8 containing properties' values in a child objProps objects
maCount (int) : (int) Number of tgtObj's RsMaCalcParams childs of tgtObj to set (1 to 6, starting from 1)
Returns: this
method importConfig(this, oCfg, maCount)
Namespace types: RsParamsMAs
Parameters:
this (RsParamsMAs)
oCfg (objProps7 type from moebius1977/CSVParser/1)
maCount (int)
method importConfig(this, oCfg, maCount)
Imports HTF MAs settings from objProps (of any level) into `HTFMAs` child `MaDrawing` objects (into the first first `maCount` of them)
Namespace types: RsParamsMAs
Parameters:
this (RsParamsMAs) : (HTFMAs) Target object to import prop values to.
oCfg (objProps8 type from moebius1977/CSVParser/1) : (CSVP.objProps) (one of objProps types) an objProps, ... opjProps8 containing properties' values in a child objProps objects
maCount (int) : (int) Number of tgtObj's RsMaCalcParams childs of tgtObj to set (1 to 6, starting from 1)
Returns: this
method importConfig(this, oCfg, maCount)
Imports HTF MAs settings from objProps (of any level) into `HTFMAs` child `MaDrawing` objects (into the first first `maCount` of them)
Namespace types: HTFMAs
Parameters:
this (HTFMAs) : (HTFMAs) Target object to import prop values to.
oCfg (objProps type from moebius1977/CSVParser/1) : (CSVP.objProps) (one of objProps types) an objProps, ... opjProps8 containing properties' values in a child objProps objects
maCount (int) : (int) Number of tgtObj's RsMaCalcParams childs of tgtObj to set (1 to 6, starting from 1)
Returns: this
method importConfig(this, oCfg, maCount)
Imports HTF MAs settings from objProps (of any level) into `HTFMAs` child `MaDrawing` objects (into the first first `maCount` of them)
Namespace types: HTFMAs
Parameters:
this (HTFMAs) : (HTFMAs) Target object to import prop values to.
oCfg (objProps0 type from moebius1977/CSVParser/1) : (CSVP.objProps) (one of objProps types) an objProps, ... opjProps8 containing properties' values in a child objProps objects
maCount (int) : (int) Number of tgtObj's RsMaCalcParams childs of tgtObj to set (1 to 6, starting from 1)
Returns: this
method importConfig(this, oCfg, maCount)
Imports HTF MAs settings from objProps (of any level) into `HTFMAs` child `MaDrawing` objects (into the first first `maCount` of them)
Namespace types: HTFMAs
Parameters:
this (HTFMAs) : (HTFMAs) Target object to import prop values to.
oCfg (objProps1 type from moebius1977/CSVParser/1) : (CSVP.objProps) (one of objProps types) an objProps, ... opjProps8 containing properties' values in a child objProps objects
maCount (int) : (int) Number of tgtObj's RsMaCalcParams childs of tgtObj to set (1 to 6, starting from 1)
Returns: this
method importConfig(this, oCfg, maCount)
Imports HTF MAs settings from objProps (of any level) into `HTFMAs` child `MaDrawing` objects (into the first first `maCount` of them)
Namespace types: HTFMAs
Parameters:
this (HTFMAs) : (HTFMAs) Target object to import prop values to.
oCfg (objProps2 type from moebius1977/CSVParser/1) : (CSVP.objProps) (one of objProps types) an objProps, ... opjProps8 containing properties' values in a child objProps objects
maCount (int) : (int) Number of tgtObj's RsMaCalcParams childs of tgtObj to set (1 to 6, starting from 1)
Returns: this
method importConfig(this, oCfg, maCount)
Imports HTF MAs settings from objProps (of any level) into `HTFMAs` child `MaDrawing` objects (into the first first `maCount` of them)
Namespace types: HTFMAs
Parameters:
this (HTFMAs) : (HTFMAs) Target object to import prop values to.
oCfg (objProps3 type from moebius1977/CSVParser/1) : (CSVP.objProps) (one of objProps types) an objProps, ... opjProps8 containing properties' values in a child objProps objects
maCount (int) : (int) Number of tgtObj's RsMaCalcParams childs of tgtObj to set (1 to 6, starting from 1)
Returns: this
method importConfig(this, oCfg, maCount)
Imports HTF MAs settings from objProps (of any level) into `HTFMAs` child `MaDrawing` objects (into the first first `maCount` of them)
Namespace types: HTFMAs
Parameters:
this (HTFMAs) : (HTFMAs) Target object to import prop values to.
oCfg (objProps4 type from moebius1977/CSVParser/1) : (CSVP.objProps) (one of objProps types) an objProps, ... opjProps8 containing properties' values in a child objProps objects
maCount (int) : (int) Number of tgtObj's RsMaCalcParams childs of tgtObj to set (1 to 6, starting from 1)
Returns: this
method importConfig(this, oCfg, maCount)
Imports HTF MAs settings from objProps (of any level) into `HTFMAs` child `MaDrawing` objects (into the first first `maCount` of them)
Namespace types: HTFMAs
Parameters:
this (HTFMAs) : (HTFMAs) Target object to import prop values to.
oCfg (objProps5 type from moebius1977/CSVParser/1) : (CSVP.objProps) (one of objProps types) an objProps, ... opjProps8 containing properties' values in a child objProps objects
maCount (int) : (int) Number of tgtObj's RsMaCalcParams childs of tgtObj to set (1 to 6, starting from 1)
Returns: this
method importConfig(this, oCfg, maCount)
Imports HTF MAs settings from objProps (of any level) into `HTFMAs` child `MaDrawing` objects (into the first first `maCount` of them)
Namespace types: HTFMAs
Parameters:
this (HTFMAs) : (HTFMAs) Target object to import prop values to.
oCfg (objProps6 type from moebius1977/CSVParser/1) : (CSVP.objProps) (one of objProps types) an objProps, ... opjProps8 containing properties' values in a child objProps objects
maCount (int) : (int) Number of tgtObj's RsMaCalcParams childs of tgtObj to set (1 to 6, starting from 1)
Returns: this
method importConfig(this, oCfg, maCount)
Namespace types: HTFMAs
Parameters:
this (HTFMAs)
oCfg (objProps7 type from moebius1977/CSVParser/1)
maCount (int)
method importConfig(this, oCfg, maCount)
Namespace types: HTFMAs
Parameters:
this (HTFMAs)
oCfg (objProps8 type from moebius1977/CSVParser/1)
maCount (int)
method newRsParamsMAs(this)
Namespace types: LO
Parameters:
this (LO)
method newHTFMAs(this)
Namespace types: LO
Parameters:
this (LO)
RsMaCalcParams
Parameters of one MA (only calculation params needed within req.sec(), visual parameters are within htfMAs type)
Fields:
enabled (series bool)
maType (series MaTypes) : MA type options: SMA / EMA / WMA / ...
src (series string)
prd (series int) : MA period
RsParamsMAs
Collection of parameters of 6 MAs. Used to pass params to req.sec()
Fields:
ma1CalcParams (RsMaCalcParams)
ma2CalcParams (RsMaCalcParams)
ma3CalcParams (RsMaCalcParams)
ma4CalcParams (RsMaCalcParams)
ma5CalcParams (RsMaCalcParams)
ma6CalcParams (RsMaCalcParams)
RsReturnMAs
Used to return data from req.sec().
Fields:
htfBi (series int)
ma1 (series float)
ma2 (series float)
ma3 (series float)
ma4 (series float)
ma5 (series float)
ma6 (series float)
MaDrawing
MA's plot parameters plus drawing objects for MA's current level (line and label).
Fields:
lnClr (series color) : (color) MA plot line color (like in plot())
lnWidth (series int) : (int) MA plot line width (like in plot())
lnStyle (series string) : (string) MA plot line style (like in plot())
showHistory (series bool) : (bool) Whether to plot the MA on historical bars or only show current level to the right of the latest bar.
showLabel (series bool) : (bool) Whether to show the name of the MA to the right of the MA's level
ln (series line) : (line) line to show MA"s current level
lbl (series label) : (label) label showing MA's name
HTFMAs
Contains data and drawing parameters for MA's of one timeframe (MA calculation parameters for MA's of one timeframe are in a separate object RsParamsMAs)
Fields:
rsRet (RsReturnMAs) : (RsReturnMAs) Contains data returned from req.sec(). Is set to na in between HTF bar changes if smoothing is enabled.
rsRetLast (RsReturnMAs) : (RsReturnMAs) Contains a copy of data returned from req.sec() in case rsRet is set to na for smoothing.
rsRetNaObj (RsReturnMAs) : (RsReturnMAs) An empty object as `na` placeholder
ma1Drawing (MaDrawing) : (MaDrawing) MA drawing properties
ma2Drawing (MaDrawing) : (MaDrawing) MA drawing properties
ma3Drawing (MaDrawing) : (MaDrawing) MA drawing properties
ma4Drawing (MaDrawing) : (MaDrawing) MA drawing properties
ma5Drawing (MaDrawing) : (MaDrawing) MA drawing properties
ma6Drawing (MaDrawing) : (MaDrawing) MA drawing properties
enabled (series bool) : (bool ) Enables/disables all of the MAs of one timeframe.
tf (series string) : (string) Timeframe
showHistory (series bool) : (bool ) Plot MA line on historical bars
rngAtrQ (series int) : (int ) A multiplier for atr(14). Determines a range within which the MA's will be plotted. MA's too far away will not be plotted.
showRecentBars (series int) : (int ) Only plot MA on these recent bars
smoothen (series bool) : (bool ) Smoothen MA plot. If false the same HTF value is returned on all chart bars within a HTF bar (intrabars), so the plot looks like steps.
lblsOffset (series int) : (int ) Show MA name this number of bars to the right off last bar.
lblsShow (series bool) : (bool ) Show MA name
lnOffset (series int) : (int ) Start line showing current level of the MA this number of bars to the right off the last bar.
lblSize (series string) : (string) Label size
lblStyle (series string) : (string) Label style
lblTxtAlign (series string) : (string) Label text align
bPopupLabel (series bool) : (bool ) Show current MA value as a tooltip to MA's name.
LO
LO Library object, whose only purpose is to serve as a shorthand for library name in script code.
Fields:
dummy (series string)
Custom Buy BID StrategyThis Pine Script strategy is designed to identify and capitalize on upward trends in the market using the Average True Range (ATR) as a core component of the analysis. The script provides the following features:
Customizable ATR Calculation: Users can switch between different methods of ATR calculation (traditional or simple moving average).
Adjustable Parameters: The strategy allows for adjustable ATR periods, ATR multipliers, and custom time windows for executing trades.
Buy Signal Alerts: The strategy generates buy signals when the market shifts from a downtrend to an uptrend, based on ATR and price action.
Profit and Stop-Loss Management: Built-in take profit and stop-loss conditions are calculated as a percentage of the entry price, allowing for automatic position management.
Visual Enhancements: The script highlights the uptrend with green lines and optionally colors bars to help visualize market direction.
Flexible Timeframe: Users can configure a specific date range to activate the strategy, offering more control over when trades are executed.
This strategy is ideal for traders looking to automate their buy entries and manage risk with a straightforward trend-following approach. By utilizing customizable settings, it adapts to various market conditions and timeframes.

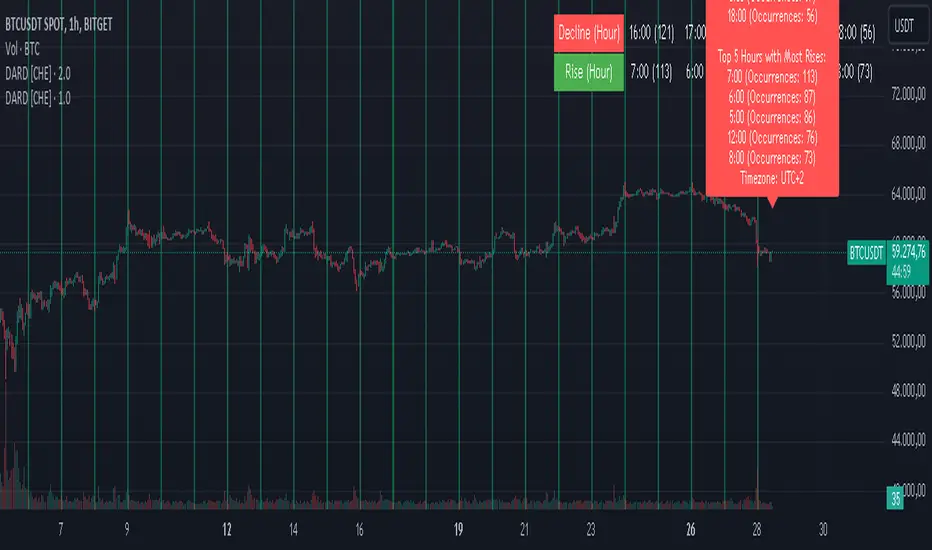
Decline and Rise Detective [CHE]Decline and Rise Detective
TradingView Indicator (Best Timeframe: 1H or Higher)
1. Introduction
The "Decline and Rise Detective " is a TradingView indicator designed to identify the hours within a trading day that experience the largest price declines and rises. This indicator provides a visual representation of this data, offering traders valuable insights into the most frequent hours for significant price movements. It is most effective when used with a timeframe of 1 hour or greater.
2. Key Features of the Indicator
2.1. Display Options
Display Option: Users can choose between two display options:
Label: Displays the information as a text label directly on the chart.
Table: Displays the information in a table format in the top right corner of the chart.
2.2. Time Zone Settings
Time Zone: The indicator allows the user to manually set the time zone or use the exchange's time zone.
Time Zone Offset: Adjust the time zone via a UTC offset.
2.3. Day Change Detection
The indicator automatically detects the change between trading days to ensure data is correctly assigned.
3. Analysis of Price Declines and Rises
3.1. Calculation of Largest Declines and Rises
The indicator compares the high and low of each hour to determine the largest decline and rise within a trading day.
3.2. Frequency Counting
For each hour of the day, the number of times the largest declines and rises occur is counted to identify the hours with the most significant price movements.
3.3. Data Sorting
The hours are sorted by the number of occurrences of declines and rises to highlight the most frequent hours. This sorting was implemented using the MA Sorter function, inspired by Duyck's Array Sorter. Special thanks to Duyck for providing the Array Sorter on TradingView, which greatly influenced this feature
4. Interpretation and Trading Applications
4.1. Identifying High Volatility Periods
The hours identified by the indicator as having the most frequent and significant price movements are typically periods of high volatility. These periods are crucial for traders who seek to capitalize on market fluctuations.
4.2. Determining Optimal Trade Entries
Long Trades: The hours with the most significant price rises can be used to identify optimal times to enter long positions.
Short Trades: Conversely, the hours with the most significant price declines can indicate good opportunities for short trades.
4.3. Display of Top 5 Hours
The indicator shows the five hours with the most declines and rises.
Depending on the selected display option, this information is shown either as a text label or as a table in the chart.
4.4. Background Color
The background color of the chart changes at day change to clearly mark it.
5. Application of the Indicator
5.1. Trading Use
Traders can use the indicator to identify time windows with high volatility and adjust their trading strategies accordingly. This allows for more informed decisions on when to go long or short, depending on the market conditions during those hours.
5.2. Customization Options
Various input options allow the user to customize the indicator to fit personal needs and trading hours.
6. Summary
The "Decline and Rise Detective " indicator is a powerful tool for analyzing hourly price movements in the markets. By providing detailed information on the most frequent hours for significant price declines and rises, this indicator offers valuable insights into periods of high volatility. Traders can use this data to make more informed decisions on entering long or short trades. It is particularly effective when used with timeframes of 1 hour or greater.
Best regards and happy trading
Chervolino
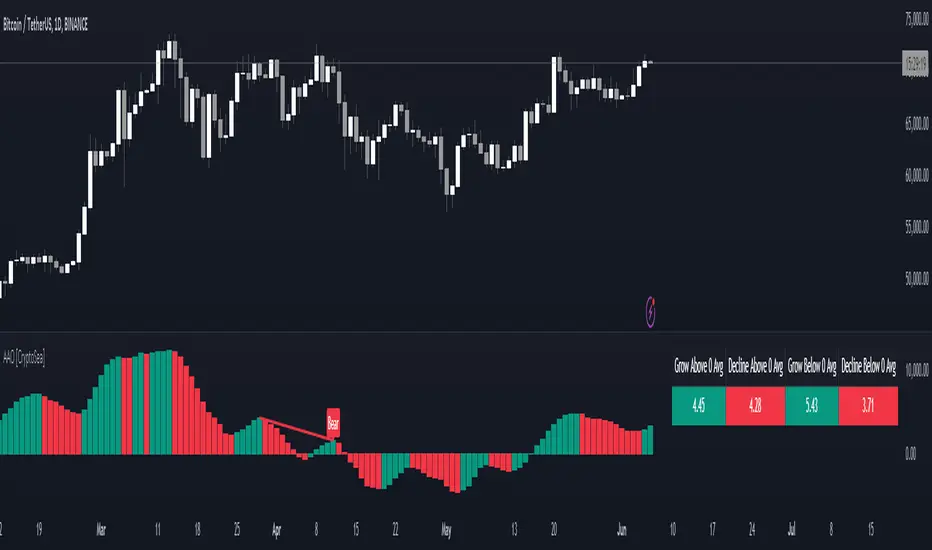
Advanced Awesome Oscillator [CryptoSea]Advanced AO Analysis Indicator
The Advanced AO Analysis indicator is a sophisticated tool designed to evaluate the Awesome Oscillator (AO) in search of regular and hidden divergences that signal potential price reversals. By tracking the intensity and duration of the AO's movements, this indicator aids traders in pinpointing critical points in price action.
Key Features
Divergence Detection: Identifies both regular and hidden bullish and bearish divergences, providing early signs of potential market reversals.
Customizable Lookback Periods: Allows users to set specific lookback windows to define the strength and relevance of detected divergences.
Adaptive Oscillator Display: Features customizable display options for the AO, enabling users to view data in different modes suited to their analysis needs.
Alert System: Includes configurable alerts to notify users of potential divergence formations, helping traders respond promptly.
How it Works
AO Calculation: Computes the AO as the difference between short-term and long-term moving averages of the midpoints of bars, highlighting momentum shifts.
Pivot Point Analysis: Utilizes advanced algorithms to find low and high pivot points based on the oscillator values, crucial for spotting trend reversals.
Range Validation: Verifies that divergences occur within a predefined range from pivot points, ensuring their validity and strength.
Visualisation: Plots AO values and potential divergences directly on the chart, aiding in quick visual analysis.
Application
Strategic Decision-Making: Assists traders in making informed decisions by providing detailed analysis of AO movements and divergence.
Trend Confirmation: Reinforces trading strategies by confirming potential reversals with pivot point detection and divergence analysis.
Behavioural Insight: Offers insights into market dynamics and sentiment by analyzing the depth and duration of AO cycles above and below zero.
The Advanced AO Analysis indicator equips traders with a powerful analytical tool for studying the Awesome Oscillator in-depth, enhancing their ability to spot and act on divergence-based trading opportunities in the cryptocurrency markets.
Sector Rotation Hedging With Volatility Index [TradeDots]The "Sector Rotation Hedging Strategy With Volatility Index" is a comprehensive trading indicator developed to optimally leverage the S&P500 volatility index. It is designed to switch between distinct ETF sectors, strategically hedging to moderate risk exposure during harsh market volatility.
HOW DOES IT WORK
The core of this indicator is grounded on the S&P500 volatility index (VIX) close price and its 60-day moving average. This serves to determine whether the prevailing market volatility is above or below the quarterly average.
In periods of elevated market volatility, risk exposure escalates significantly. Traders retaining stocks in sectors with disproportionately high volatility face increased vulnerability to negative returns. To tackle this, our indicator employs a two-pronged approach utilizing two sequential candlestick close prices to confirm if volatility surpasses the average value.
Upon confirming above-average volatility, a hedging table is deployed to spotlight ETFs with low volatility, such as the Utilities Select Sector SPDR Fund (XLU), to derisk the overall portfolio.
Conversely, in low-volatility conditions, sectors yielding higher returns like the Technology Select Sector SPDR Fund (XLK) are preferred. The hedging table is utilized to earmark high-return sector ETFs.
Thus, during highly volatile market periods, the strategy recommends enhancing portfolio allocation to low-volatility ETFs. During low-volatility windows, the portfolio is calibrated towards high-volatility ETFs for heightened returns.
IMPORTANT CONSIDERATION
In real trading, additional considerations encompassing trading commissions, management fees, and ancillary rotation costs should be factored in. False signals may arise, potentially leading to losses from these fees.
RISK DISCLAIMER
Trading entails substantial risk, and most day traders incur losses. All content, tools, scripts, articles, and education provided by TradeDots serve purely informational and educational purposes. Past performances are not definitive predictors of future results.

itradesize /\ Silver Bullet x Macro x KillzoneThis indicator shows the best way to annotate ICT Killzones, Silver Bullet and Macro times on the chart. With the help of a new pane, it will not distract your chart and will not cause any distractions to your eye, or brain but you can see when will they happen.
The indicator also draws everything beforehand when a proper new day starts.
You can customize them how you want to show up.
Collapsed or full view?
You can hide any of them and keep only the ones you would like to.
All the colors can be customized, texts & sizes or just use shortened texts and you are also able to hide those drawings which are older than the actual day.
You should minimize the pane where the script has been automatically drawn to therefore you will have the best experience and not show any distractions.
The script automatically shows the time-based boxes, based on the New York timezone.
Killzone Time windows ( for indices ):
London KZ 02:00 - 05:00
New York AM KZ 07:00 - 10:00
New York PM KZ 13:30 - 16:00
Silver Bullet times:
03:00 - 04:00
10:00 - 11:00
14:00 - 15:00
Macro times:
02:33 - 03:00
04:03 - 04:30
08:50 - 0910
09:50 - 10:10
10:50 - 11:10
11:50 - 12:50

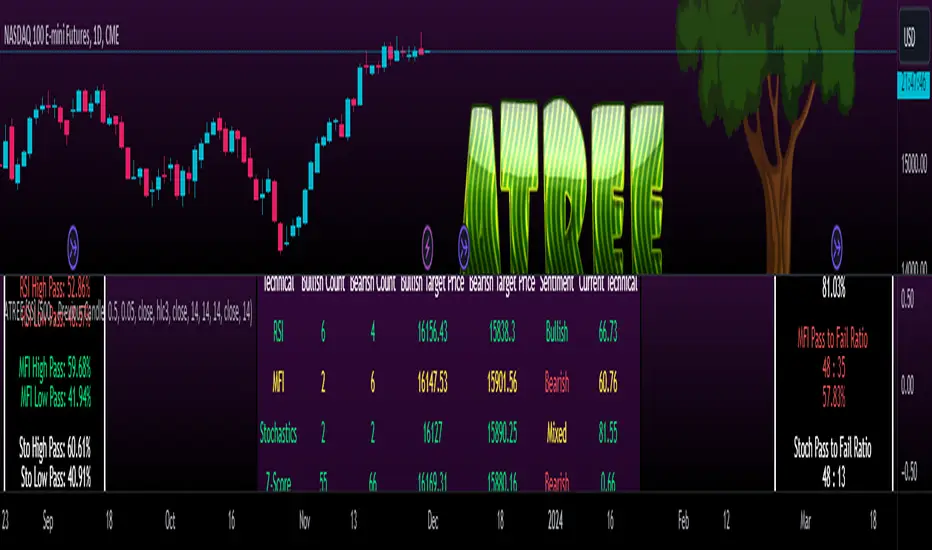
Advanced Technical Range and Expectancy Estimator [SS]Hello everyone,
This indicator is a from of momentum based probability modelling. It is derived from my own approaches to probability modelling but just simplified a bit.
How it works:
The indicator looks at various technical, including stochastics, RSI, MFI and Z-Score, to determine the likely sentiment. All of these, with the exception of Z-Score, are momentum based indicators and can alert us to likely sentiment. However, instead of us making the subjective determination ourselves as to whether the RSI or MFI or Stochastics are bullish, the indicator will look at previous instances of these occurrences, and tally the bullish and bearish follow throughs that happened. It will also calculate the average target price that was hit, under similar conditions, on the same timeframe.
The Z-Score is your "tie breaker". It is not a momentum based indicator and measures something a little different (the standard deviation and over-extension of the stock). For this reason, it provides an alternative assessment and tends to be a bit more reliable in times of low momentum.
Back-test Results:
The indicator back-tests itself over the previous 100 candles. I have limited it to 100 candles for pragmatic considerations (it has to back-test each technical individually and increasing the BT length will slow and potentially error out the indicator) as well as accuracy considerations.
One thing I have noticed in my years of trying to crack the code and develop probability models for tickers, is historical accuracy doesn't always matter because sentiment is always changing. You need to see what it has done over the most recent 100 to 200 candles.
There are two back-test windows, one for the price targets and the other for the sentiment accuracy. The most effective/most accurate will highlight green, the least effective/least accurate will highlight red:
In the image above, you can see that the most accurate predictor of sentiment is Z-Score, with a 90.32% accuracy rate over the past 100 candles.
The most accurate predictor of price is MFI, with a 60% (for bull targets) and 42% (for bear targets)accuracy rate.
Anchoring Points:
The indicator permits you to anchor by two points. The default setting is anchoring by previous candle. If you plan to use this as an oscillator, to see the current prediction for the current candle you are viewing, then you will need to leave this default setting. It will pull the data from the previous candle and give you the data for the current candle you are on.
If you are assess the likely sentiment for the next day after the day has closed off, you will want to anchor by current candle. This will take the current technicals that the day has closed off with and run the assessment for you.
Customizability
You can customize the technicals by source and length of assessment.
They are all defaulted to the traditional settings of these indicators, but if you want to customize your model to try and improve or enhance accuracy in one way or another, you are free and able to do so!
I do suggest leaving the defaults as they seem to work particular well :-).
Thresholds
Thresholds are the tolerance levels that we permit for our technical search range. If you want them to be exactly identical, then you can set it to 0. If you want it to be extremely similar, you can set it to 0.01. This will hone in on the ranges you are interest in and you can see how it affects your accuracy by reviewing the results in the back-test tables.
Keep Static Colour Option
I want to make a quick note on the "Keep Static Colour" option that is in your settings menu.
The primary table that shows you the probability and price targets change colours based on the accuracy of the assessment. This is so, if you are using a mobile device or smaller screen and can't have the back-test results open at the same time, you can see still which are the most reliable results. However, if you have the back-test tables open and you find these colour changes too distracted, you can toggle on the "Keep Static Colour" and it will resort the colour of the table to a solid white:
Show Technicals
The indicator can show you the current technical values if you are using it in place of an oscillator. Its less pivotal as its making the assessment for you, but just for your reference if you want to see what the current MFI, Z-Score or Stochastics etc. are, you have that option as well.
All Timeframes Permitted
You can view Weekly, Monthly, Hourly, 5 minute, 1 minute, its all supported!
That's the indicator in a nutshell.
Hope you enjoy and leave your questions below.
Safe trades everyone!
ICT Times [joshu]This TradingView indicator provides a comprehensive view of ICT killzones, Silver Bullet times, and ICT Macros, enhancing your trading experience.
In those time windows price either seeks liquidity or imbalances and you often find the most energetic price moves and turning points.
Features:
Automatic Adaptation: The ICT killzones intelligently adapt to the specific chart you are using. For Forex charts, it follows the ICT Forex times:
Asia: 2000-0000
London: 0200-0500
New York: 0700-1000
London Close: 1000-1200
For other charts, it uses the following session times:
Asia: 2000-0000
London: 0200-0500
New York AM: 0830-1100
New York PM: 1330-1600
Silver Bullet Times:
0300-0400
1000-1100
1400-1500
How to Use:
Simply apply the indicator to your chart, and the session boxes and Silver Bullet times will be plotted automatically.

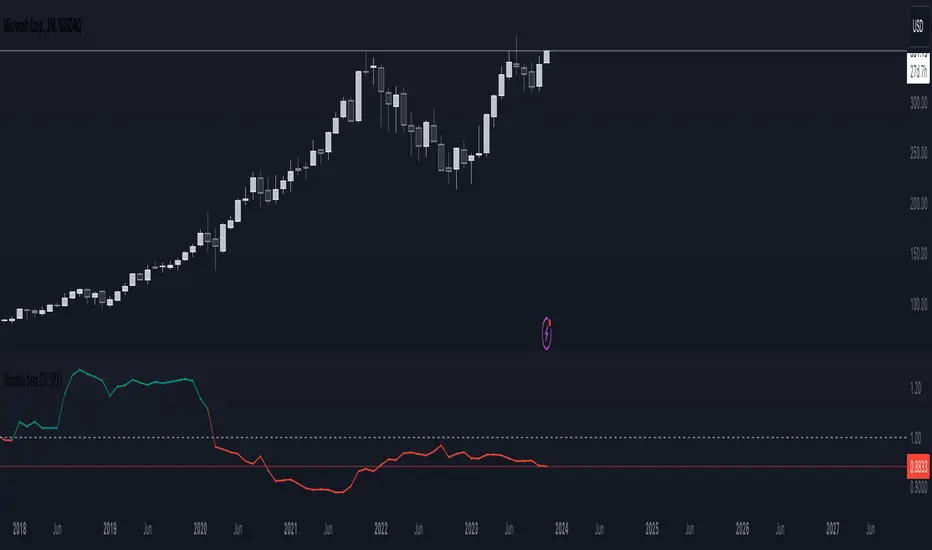
Monthly beta (5Y monthly) with multi-timeframe supportThe PROPER way to calculate beta for a stock using monthly price returns . None of this nonsense using daily returns and sliding windows as done by other scripts...
Works on any timeframe.
This script has been checked against 100s of stocks on Yahoo finance and Zacks research data and matches 100% (some rounding error as this script is kept updated live on unconfirmed monthly bars).
You can check for yourself:
Zacks fundamentals - beta
The script calculates beta using the Variance-Covariance Method as described on Investopedia
How to calculate Beta
InteliTrend StableFXThis appealing little tool is a derivation of the CCI indicator and was developed in 2023 by Mario Jemic for MT4. It has additional settings that the conventional CCI indicator does not have. Furthermore, it is combined with moving averages to create signals. This is lines crossing confirmation type indicator. Look for the orange line to cross the moving average (red line).
Differences from the original:
1. Though it was coded in 2023, the original is for people who are still running Windows 95 and would like to do technical analysis on MT4.
2. The original had an additional stochastic moving average that was not particularly useful and made the indicator busy.
3. All of the moving average options have been ported over with 2 additional choices. (Hull and Arnaud Legoux added).
4. The default options are set as the tweaks that were discovered by StoneHill Forex (stonehillforex.com). You can also download the original from them.
I will probably add a few more features and options in the near future such as visuals for crossovers etc.
Enjoy!
d1g1talshad0w

ICT Killzones + Pivots [TFO]Designed with the help of TTrades and with inspiration from the ICT Everything indicator by coldbrewrosh, the purpose of this script is to identify ICT Killzones while also storing their highs and lows for future reference, until traded through.
There are 5 Killzones / sessions whose times and labels can all be changed to one's liking. Some prefer slight alterations to traditional ICT Killzones, or use different time windows altogether. Either way, the sessions are fully customizable. The sessions will auto fit to keep track of the highs and lows made during their respective times, and these pivots will be extended until they are invalidated.
There are also 4 optional Open Price lines and 4 vertical Timestamps, where the user can change the time and style of each one as well.
To help maintain a clean chart, we can implement a Cutoff Time where all drawings will stop extending past a certain point. The indicator will apply this logic by default, as it can get messy with multiple drawings starting and stopping throughout the day at different times.
Given the amount of interest I've received about this indicator, I intend to leave it open to suggestions for further improvements. Let me know what you think & what you want to see added!

David Varadi Intermediate OscillatorThe David Varadi Intermediate Oscillator (DVI) is a composite momentum oscillator designed to generate trading signals based on two key factors: the magnitude of returns over different time windows and the stretch, which measures the relative number of up versus down days. By combining these factors, the DVI aims to provide a reliable and objective assessment of market trends and momentum.
Methodology:
To calculate the DVI, a specific formula is applied. The magnitude component involves averaging smoothed returns over various lengths, weighted according to user-defined parameters. This calculation helps determine the magnitude of price changes. The stretch component follows a similar process, averaging smoothed returns over different lengths to gauge market momentum. Users have the flexibility to adjust the weights and lengths to suit their trading preferences and styles.
Utility:
The DVI offers versatility in its applications. It can be used for both momentum trading and trend analysis due to its smooth and consistent signals. Unlike some other oscillators, the DVI provides longer and uncorrelated signals, allowing traders to effectively combine trend-following and mean-reversion strategies. For example, the DVI is adept at identifying overbought levels above the 200-day moving average, serving as a useful tool for determining exit points during price strength and even potential shorting opportunities. Traders can develop simple trading systems based on the DVI, buying above the 200-day moving average and selling when the DVI exceeds a specified threshold. Conversely, they can consider short positions below the 200-day moving average and cover when the DVI falls below a specific threshold. The DVI's objective approach to analyzing market momentum makes it a valuable resource for traders seeking to identify trading opportunities.
Key Features:
Bar coloring: based on Trend, Extremeties or Reversions
Reversions: Potential reversal points marked with triangles above\below oscillator
Extremity Hues: Highlighting oxcillator reaching traditional OB\OS levels
Example Charts:

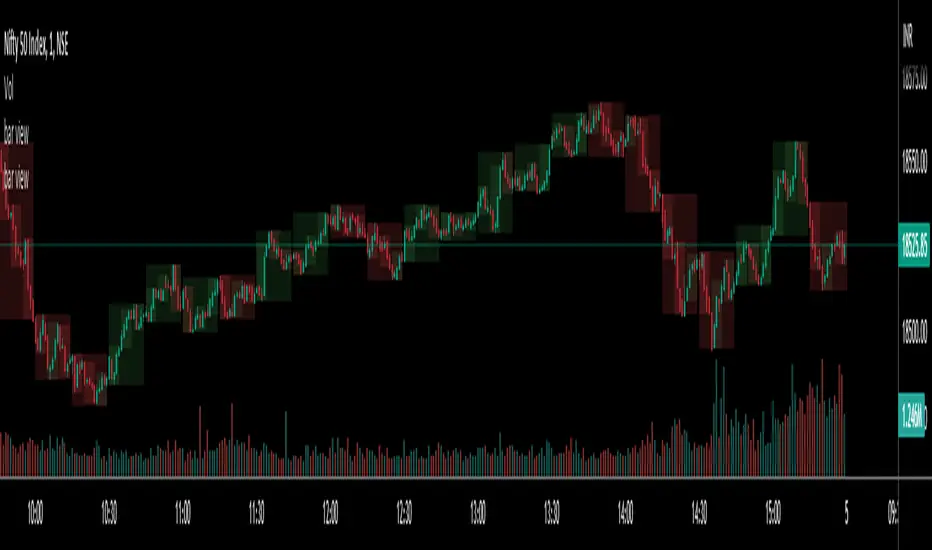
bar viewBar view is a simple script to show other higher time frame windows while you are focusing on lower time for precise decision making.
For example you are currently operating at 1 minute time frame and you want to see other bars on higher time frames e.g. 5 minute, 15 minutes etc.
Feel free to add multiple bar view to see different time frames.
ICT Algorithmic Macro Tracker° (Open-Source) by toodegreesDescription:
The ICT Algorithmic Macro Tracker° Indicator is a powerful tool designed to enhance your trading experience by clearly and efficiently plotting the known ICT Macro Times on your chart.
Based on the teachings of the Inner Circle Trader , these Time windows correspond to periods when the Interbank Price Delivery Algorithm undergoes a series of checks ( Macros ) and is probable to move towards Liquidity.
The indicator allows traders to visualize and analyze these crucial moments in NY Time:
- 2:33-3:00
- 4:03-4:30
- 8:50-9:10
- 9:50-10:10
- 10:50-11:10
- 11:50-12:10
- 13:10-13:50
- 15:15-15:45
By providing a clean and clutter-free representation of ICT Macros, this indicator empowers traders to make more informed decisions, optimize and build their strategies based on Time.
Massive shoutout to @reastruth for his ICT Macros Indicator , and for allowing to create one of my own, go check him out!
Indicator Features:
– Track ongoing ICT Macros to aid your Live analysis.
- Gain valuable insights by hovering over the plotted ICT Macros to reveal tooltips with interval information.
– Plot the ICT Macros in one of two ways:
"On Chart": visualize ICT Macro timeframes directly on your chart, with automatic adjustments as Price moves.
Pro Tip: toggle Projections to see exactly where Macros begin and end without difficulty.
"New Pane": move the indicator two a New Pane to see both Live and Upcoming Macro events with ease in a dedicated section
Pro Tip: this section can be collapsed by double-clicking on the main chart, allowing for seamless trading preparation.
This indicator is available only on the TradingView platform.
⚠️ Open Source ⚠️
Coders and TV users are authorized to copy this code base, but a paid distribution is prohibited. A mention to the original author is expected, and appreciated.
⚠️ Terms and Conditions ⚠️
This financial tool is for educational purposes only and not financial advice. Users assume responsibility for decisions made based on the tool's information. Past performance doesn't guarantee future results. By using this tool, users agree to these terms.

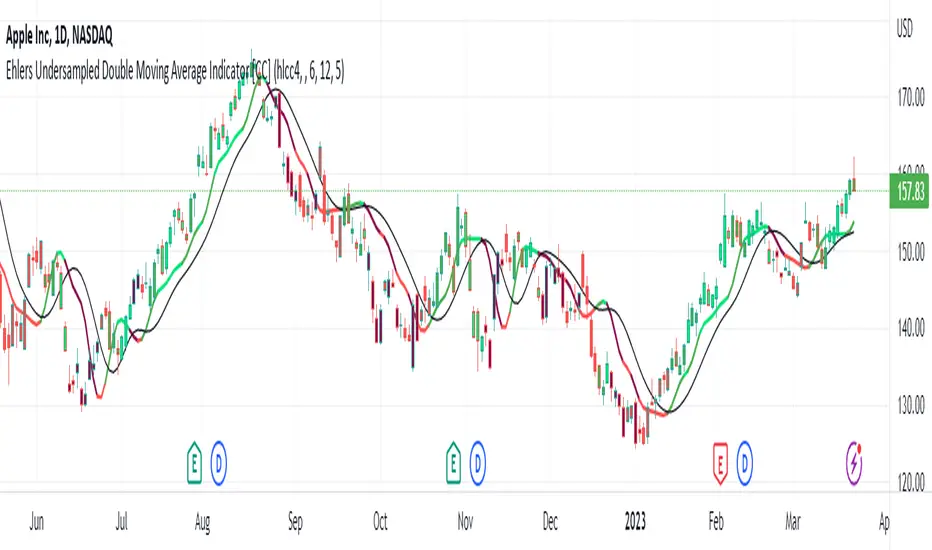
Ehlers Undersampled Double Moving Average Indicator [CC]The Undersampled Double Moving Average was created by John Ehlers (Stocks and Commodities April 2023), and this is a double moving average system which is pretty rare for John Ehlers. For those of you who would like my other take on an Ehlers double moving average, be sure to check out my previous Ehlers double moving average script . He came up with a unique idea for this indicator to create a moving average using a sample of the price data. For example, we use his suggested length of 5 only to use the price data every 5 bars. Feel free to change this, and please let me know if you find a length that works better. He then smooths the indicator using the Hann Windowed Moving Average . I color-coded the lines to show stronger signals in darker colors or standard signals in lighter colors. Buy when the line turns green and sell when it turns red.
Let me know if there is an indicator or script you would like to see me publish!
Vector2ArrayLibrary "Vector2Array"
functions to handle vector2 Array operations.
.
references:
docs.unity3d.com
gist.github.com
github.com
gist.github.com
gist.github.com
gist.github.com
.
from(source, prop_sep, vect_sep)
Generate array of vector2 from string.
Parameters:
source : string Source string of the vectors.
prop_sep : string Separator character of the vector properties (x`,`y).
vect_sep : string Separator character of the vectors ((x,y)`;`(x,y)).
Returns: array.
max(vectors)
Combination of the highest elements in column of a array of vectors.
Parameters:
vectors : array, Array of Vector2 objects.
Returns: Vector2.Vector2, Vector2 object.
-> usage:
`a = Vector2.from(1.0) , b = Vector2.from(2.0), c = Vector2.from(3.0), d = max(array.from(a, b, c)) , plot(d.x)`
min(vectors)
Combination of the lowest elements in column of a array of vectors.
Parameters:
vectors : array, Array of Vector2 objects.
Returns: Vector2.Vector2, Vector2 object.
-> usage:
`a = Vector2.from(1.0) , b = Vector2.from(2.0), c = Vector2.from(3.0), d = min(array.from(a, b, c)) , plot(d.x)`
sum(vectors)
Total sum of all vectors.
Parameters:
vectors : array, ID of the vector2 array.
Returns: Vector2.Vector2, vector2 object.
-> usage:
`a = Vector2.from(1.0) , b = Vector2.from(2.0), c = Vector2.from(3.0), d = sum(array.from(a, b, c)) , plot(d.x)`
center(vectors)
Finds the vector center of the array.
Parameters:
vectors : array, ID of the vector2 array.
Returns: Vector2.Vector2, vector2 object.
-> usage:
`a = Vector2.from(1.0) , b = Vector2.from(2.0), c = Vector2.from(3.0), d = center(array.from(a, b, c)) , plot(d.x)`
rotate(vectors, center, degree)
Rotate Array vectors around origin vector by a angle.
Parameters:
vectors : array, ID of the vector2 array.
center : Vector2.Vector2 , Vector2 object. Center of the rotation.
degree : float , Angle value.
Returns: rotated points array.
-> usage:
`a = Vector2.from(1.0) , b = Vector2.from(2.0), c = Vector2.from(3.0), d = rotate(array.from(a, b, c), b, 45.0)`
scale(vectors, center, rate)
Scale Array vectors based on a origin vector perspective.
Parameters:
vectors : array, ID of the vector2 array.
center : Vector2.Vector2 , Vector2 object. Origin center of the transformation.
rate : float , Rate to apply transformation.
Returns: rotated points array.
-> usage:
`a = Vector2.from(1.0) , b = Vector2.from(2.0), c = Vector2.from(3.0), d = scale(array.from(a, b, c), b, 1.25)`
move(vectors, center, rate)
Move Array vectors by a rate of the distance to center position (LERP).
Parameters:
vectors : array, ID of the vector2 array.
center
rate
Returns: Moved points array.
-> usage:
`a = Vector2.from(1.0) , b = Vector2.from(2.0), c = Vector2.from(3.0), d = move(array.from(a, b, c), b, 1.25)`
to_string(id, separator)
Reads a array of vectors into a string, of the form ` `.
Parameters:
id : array, ID of the vector2 array.
separator : string separator for cell splitting.
Returns: string Translated complex array into string.
-> usage:
`a = Vector2.from(1.0) , b = Vector2.from(2.0), c = Vector2.from(3.0), d = to_string(array.from(a, b, c))`
to_string(id, format, separator)
Reads a array of vectors into a string, of the form ` `.
Parameters:
id : array, ID of the vector2 array.
format : string , Format to apply transformation.
separator : string , Separator for cell splitting.
Returns: string Translated complex array into string.
-> usage:
`a = Vector2.from(1.234) , b = Vector2.from(2.23), c = Vector2.from(3.1234), d = to_string(array.from(a, b, c), "#.##")`

Vector2Library "Vector2"
Representation of two dimensional vectors or points.
This structure is used to represent positions in two dimensional space or vectors,
for example in spacial coordinates in 2D space.
~~~
references:
docs.unity3d.com
gist.github.com
github.com
gist.github.com
gist.github.com
gist.github.com
~~~
new(x, y)
Create a new Vector2 object.
Parameters:
x : float . The x value of the vector, default=0.
y : float . The y value of the vector, default=0.
Returns: Vector2. Vector2 object.
-> usage:
`unitx = Vector2.new(1.0) , plot(unitx.x)`
from(value)
Assigns value to a new vector `x,y` elements.
Parameters:
value : float, x and y value of the vector.
Returns: Vector2. Vector2 object.
-> usage:
`one = Vector2.from(1.0), plot(one.x)`
from(value, element_sep, open_par, close_par)
Assigns value to a new vector `x,y` elements.
Parameters:
value : string . The `x` and `y` value of the vector in a `x,y` or `(x,y)` format, spaces and parentesis will be removed automatically.
element_sep : string . Element separator character, default=`,`.
open_par : string . Open parentesis character, default=`(`.
close_par : string . Close parentesis character, default=`)`.
Returns: Vector2. Vector2 object.
-> usage:
`one = Vector2.from("1.0,2"), plot(one.x)`
copy(this)
Creates a deep copy of a vector.
Parameters:
this : Vector2 . Vector2 object.
Returns: Vector2. Vector2 object.
-> usage:
`a = Vector2.new(1.0) , b = a.copy() , plot(b.x)`
down()
Vector in the form `(0, -1)`.
Returns: Vector2. Vector2 object.
left()
Vector in the form `(-1, 0)`.
Returns: Vector2. Vector2 object.
right()
Vector in the form `(1, 0)`.
Returns: Vector2. Vector2 object.
up()
Vector in the form `(0, 1)`.
Returns: Vector2. Vector2 object.
one()
Vector in the form `(1, 1)`.
Returns: Vector2. Vector2 object.
zero()
Vector in the form `(0, 0)`.
Returns: Vector2. Vector2 object.
minus_one()
Vector in the form `(-1, -1)`.
Returns: Vector2. Vector2 object.
unit_x()
Vector in the form `(1, 0)`.
Returns: Vector2. Vector2 object.
unit_y()
Vector in the form `(0, 1)`.
Returns: Vector2. Vector2 object.
nan()
Vector in the form `(float(na), float(na))`.
Returns: Vector2. Vector2 object.
xy(this)
Return the values of `x` and `y` as a tuple.
Parameters:
this : Vector2 . Vector2 object.
Returns: .
-> usage:
`a = Vector2.new(1.0, 1.0) , = a.xy() , plot(ax)`
length_squared(this)
Length of vector `a` in the form. `a.x^2 + a.y^2`, for comparing vectors this is computationaly lighter.
Parameters:
this : Vector2 . Vector2 object.
Returns: float. Squared length of vector.
-> usage:
`a = Vector2.new(1.0, 1.0) , plot(a.length_squared())`
length(this)
Magnitude of vector `a` in the form. `sqrt(a.x^2 + a.y^2)`
Parameters:
this : Vector2 . Vector2 object.
Returns: float. Length of vector.
-> usage:
`a = Vector2.new(1.0, 1.0) , plot(a.length())`
normalize(a)
Vector normalized with a magnitude of 1, in the form. `a / length(a)`.
Parameters:
a : Vector2 . Vector2 object.
Returns: Vector2. Vector2 object.
-> usage:
`a = normalize(Vector2.new(3.0, 2.0)) , plot(a.y)`
isNA(this)
Checks if any of the components is `na`.
Parameters:
this : Vector2 . Vector2 object.
Returns: bool.
usage:
p = Vector2.new(1.0, na) , plot(isNA(p)?1:0)
add(a, b)
Adds vector `b` to `a`, in the form `(a.x + b.x, a.y + b.y)`.
Parameters:
a : Vector2 . Vector2 object.
b : Vector2 . Vector2 object.
Returns: Vector2. Vector2 object.
-> usage:
`a = one() , b = one() , c = add(a, b) , plot(c.x)`
add(a, b)
Adds vector `b` to `a`, in the form `(a.x + b, a.y + b)`.
Parameters:
a : Vector2 . Vector2 object.
b : float . Value.
Returns: Vector2. Vector2 object.
-> usage:
`a = one() , b = 1.0 , c = add(a, b) , plot(c.x)`
add(a, b)
Adds vector `b` to `a`, in the form `(a + b.x, a + b.y)`.
Parameters:
a : float . Value.
b : Vector2 . Vector2 object.
Returns: Vector2. Vector2 object.
-> usage:
`a = 1.0 , b = one() , c = add(a, b) , plot(c.x)`
subtract(a, b)
Subtract vector `b` from `a`, in the form `(a.x - b.x, a.y - b.y)`.
Parameters:
a : Vector2 . Vector2 object.
b : Vector2 . Vector2 object.
Returns: Vector2. Vector2 object.
-> usage:
`a = one() , b = one() , c = subtract(a, b) , plot(c.x)`
subtract(a, b)
Subtract vector `b` from `a`, in the form `(a.x - b, a.y - b)`.
Parameters:
a : Vector2 . vector2 object.
b : float . Value.
Returns: Vector2. Vector2 object.
-> usage:
`a = one() , b = 1.0 , c = subtract(a, b) , plot(c.x)`
subtract(a, b)
Subtract vector `b` from `a`, in the form `(a - b.x, a - b.y)`.
Parameters:
a : float . value.
b : Vector2 . Vector2 object.
Returns: Vector2. Vector2 object.
-> usage:
`a = 1.0 , b = one() , c = subtract(a, b) , plot(c.x)`
multiply(a, b)
Multiply vector `a` with `b`, in the form `(a.x * b.x, a.y * b.y)`.
Parameters:
a : Vector2 . Vector2 object.
b : Vector2 . Vector2 object.
Returns: Vector2. Vector2 object.
-> usage:
`a = one() , b = one() , c = multiply(a, b) , plot(c.x)`
multiply(a, b)
Multiply vector `a` with `b`, in the form `(a.x * b, a.y * b)`.
Parameters:
a : Vector2 . Vector2 object.
b : float . Value.
Returns: Vector2. Vector2 object.
-> usage:
`a = one() , b = 1.0 , c = multiply(a, b) , plot(c.x)`
multiply(a, b)
Multiply vector `a` with `b`, in the form `(a * b.x, a * b.y)`.
Parameters:
a : float . Value.
b : Vector2 . Vector2 object.
Returns: Vector2. Vector2 object.
-> usage:
`a = 1.0 , b = one() , c = multiply(a, b) , plot(c.x)`
divide(a, b)
Divide vector `a` with `b`, in the form `(a.x / b.x, a.y / b.y)`.
Parameters:
a : Vector2 . Vector2 object.
b : Vector2 . Vector2 object.
Returns: Vector2. Vector2 object.
-> usage:
`a = from(3.0) , b = from(2.0) , c = divide(a, b) , plot(c.x)`
divide(a, b)
Divide vector `a` with value `b`, in the form `(a.x / b, a.y / b)`.
Parameters:
a : Vector2 . Vector2 object.
b : float . Value.
Returns: Vector2. Vector2 object.
-> usage:
`a = from(3.0) , b = 2.0 , c = divide(a, b) , plot(c.x)`
divide(a, b)
Divide value `a` with vector `b`, in the form `(a / b.x, a / b.y)`.
Parameters:
a : float . Value.
b : Vector2 . Vector2 object.
Returns: Vector2. Vector2 object.
-> usage:
`a = 3.0 , b = from(2.0) , c = divide(a, b) , plot(c.x)`
negate(a)
Negative of vector `a`, in the form `(-a.x, -a.y)`.
Parameters:
a : Vector2 . Vector2 object.
Returns: Vector2. Vector2 object.
-> usage:
`a = from(3.0) , b = a.negate , plot(b.x)`
pow(a, b)
Raise vector `a` with exponent vector `b`, in the form `(a.x ^ b.x, a.y ^ b.y)`.
Parameters:
a : Vector2 . Vector2 object.
b : Vector2 . Vector2 object.
Returns: Vector2. Vector2 object.
-> usage:
`a = from(3.0) , b = from(2.0) , c = pow(a, b) , plot(c.x)`
pow(a, b)
Raise vector `a` with value `b`, in the form `(a.x ^ b, a.y ^ b)`.
Parameters:
a : Vector2 . Vector2 object.
b : float . Value.
Returns: Vector2. Vector2 object.
-> usage:
`a = from(3.0) , b = 2.0 , c = pow(a, b) , plot(c.x)`
pow(a, b)
Raise value `a` with vector `b`, in the form `(a ^ b.x, a ^ b.y)`.
Parameters:
a : float . Value.
b : Vector2 . Vector2 object.
Returns: Vector2. Vector2 object.
-> usage:
`a = 3.0 , b = from(2.0) , c = pow(a, b) , plot(c.x)`
sqrt(a)
Square root of the elements in a vector.
Parameters:
a : Vector2 . Vector2 object.
Returns: Vector2. Vector2 object.
-> usage:
`a = from(3.0) , b = sqrt(a) , plot(b.x)`
abs(a)
Absolute properties of the vector.
Parameters:
a : Vector2 . Vector2 object.
Returns: Vector2. Vector2 object.
-> usage:
`a = from(-3.0) , b = abs(a) , plot(b.x)`
min(a)
Lowest element of a vector.
Parameters:
a : Vector2 . Vector2 object.
Returns: float.
-> usage:
`a = new(3.0, 1.5) , b = min(a) , plot(b)`
max(a)
Highest element of a vector.
Parameters:
a : Vector2 . Vector2 object.
Returns: float.
-> usage:
`a = new(3.0, 1.5) , b = max(a) , plot(b)`
vmax(a, b)
Highest elements of two vectors.
Parameters:
a : Vector2 . Vector2 object.
b : Vector2 . Vector2 object.
Returns: Vector2. Vector2 object.
-> usage:
`a = new(3.0, 2.0) , b = new(2.0, 3.0) , c = vmax(a, b) , plot(c.x)`
vmax(a, b, c)
Highest elements of three vectors.
Parameters:
a : Vector2 . Vector2 object.
b : Vector2 . Vector2 object.
c : Vector2 . Vector2 object.
Returns: Vector2. Vector2 object.
-> usage:
`a = new(3.0, 2.0) , b = new(2.0, 3.0) , c = new(1.5, 4.5) , d = vmax(a, b, c) , plot(d.x)`
vmin(a, b)
Lowest elements of two vectors.
Parameters:
a : Vector2 . Vector2 object.
b : Vector2 . Vector2 object.
Returns: Vector2. Vector2 object.
-> usage:
`a = new(3.0, 2.0) , b = new(2.0, 3.0) , c = vmin(a, b) , plot(c.x)`
vmin(a, b, c)
Lowest elements of three vectors.
Parameters:
a : Vector2 . Vector2 object.
b : Vector2 . Vector2 object.
c : Vector2 . Vector2 object.
Returns: Vector2. Vector2 object.
-> usage:
`a = new(3.0, 2.0) , b = new(2.0, 3.0) , c = new(1.5, 4.5) , d = vmin(a, b, c) , plot(d.x)`
perp(a)
Perpendicular Vector of `a`, in the form `(a.y, -a.x)`.
Parameters:
a : Vector2 . Vector2 object.
Returns: Vector2. Vector2 object.
-> usage:
`a = new(3.0, 1.5) , b = perp(a) , plot(b.x)`
floor(a)
Compute the floor of vector `a`.
Parameters:
a : Vector2 . Vector2 object.
Returns: Vector2. Vector2 object.
-> usage:
`a = new(3.0, 1.5) , b = floor(a) , plot(b.x)`
ceil(a)
Ceils vector `a`.
Parameters:
a : Vector2 . Vector2 object.
Returns: Vector2. Vector2 object.
-> usage:
`a = new(3.0, 1.5) , b = ceil(a) , plot(b.x)`
ceil(a, digits)
Ceils vector `a`.
Parameters:
a : Vector2 . Vector2 object.
digits : int . Digits to use as ceiling.
Returns: Vector2. Vector2 object.
round(a)
Round of vector elements.
Parameters:
a : Vector2 . Vector2 object.
Returns: Vector2. Vector2 object.
-> usage:
`a = new(3.0, 1.5) , b = round(a) , plot(b.x)`
round(a, precision)
Round of vector elements.
Parameters:
a : Vector2 . Vector2 object.
precision : int . Number of digits to round vector "a" elements.
Returns: Vector2. Vector2 object.
-> usage:
`a = new(0.123456, 1.234567) , b = round(a, 2) , plot(b.x)`
fractional(a)
Compute the fractional part of the elements from vector `a`.
Parameters:
a : Vector2 . Vector2 object.
Returns: Vector2. Vector2 object.
-> usage:
`a = new(3.123456, 1.23456) , b = fractional(a) , plot(b.x)`
dot_product(a, b)
dot_product product of 2 vectors, in the form `a.x * b.x + a.y * b.y.
Parameters:
a : Vector2 . Vector2 object.
b : Vector2 . Vector2 object.
Returns: float.
-> usage:
`a = new(3.0, 1.5) , b = from(2.0) , c = dot_product(a, b) , plot(c)`
cross_product(a, b)
cross product of 2 vectors, in the form `a.x * b.y - a.y * b.x`.
Parameters:
a : Vector2 . Vector2 object.
b : Vector2 . Vector2 object.
Returns: float.
-> usage:
`a = new(3.0, 1.5) , b = from(2.0) , c = cross_product(a, b) , plot(c)`
equals(a, b)
Compares two vectors
Parameters:
a : Vector2 . Vector2 object.
b : Vector2 . Vector2 object.
Returns: bool. Representing the equality.
-> usage:
`a = new(3.0, 1.5) , b = from(2.0) , c = equals(a, b) ? 1 : 0 , plot(c)`
sin(a)
Compute the sine of argument vector `a`.
Parameters:
a : Vector2 . Vector2 object.
Returns: Vector2. Vector2 object.
-> usage:
`a = new(3.0, 1.5) , b = sin(a) , plot(b.x)`
cos(a)
Compute the cosine of argument vector `a`.
Parameters:
a : Vector2 . Vector2 object.
Returns: Vector2. Vector2 object.
-> usage:
`a = new(3.0, 1.5) , b = cos(a) , plot(b.x)`
tan(a)
Compute the tangent of argument vector `a`.
Parameters:
a : Vector2 . Vector2 object.
Returns: Vector2. Vector2 object.
-> usage:
`a = new(3.0, 1.5) , b = tan(a) , plot(b.x)`
atan2(x, y)
Approximation to atan2 calculation, arc tangent of `y/x` in the range (-pi,pi) radians.
Parameters:
x : float . The x value of the vector.
y : float . The y value of the vector.
Returns: float. Value with angle in radians. (negative if quadrante 3 or 4)
-> usage:
`a = new(3.0, 1.5) , b = atan2(a.x, a.y) , plot(b)`
atan2(a)
Approximation to atan2 calculation, arc tangent of `y/x` in the range (-pi,pi) radians.
Parameters:
a : Vector2 . Vector2 object.
Returns: float, value with angle in radians. (negative if quadrante 3 or 4)
-> usage:
`a = new(3.0, 1.5) , b = atan2(a) , plot(b)`
distance(a, b)
Distance between vector `a` and `b`.
Parameters:
a : Vector2 . Vector2 object.
b : Vector2 . Vector2 object.
Returns: float.
-> usage:
`a = new(3.0, 1.5) , b = from(2.0) , c = distance(a, b) , plot(c)`
rescale(a, length)
Rescale a vector to a new magnitude.
Parameters:
a : Vector2 . Vector2 object.
length : float . Magnitude.
Returns: Vector2. Vector2 object.
-> usage:
`a = new(3.0, 1.5) , b = 2.0 , c = rescale(a, b) , plot(c.x)`
rotate(a, radians)
Rotates vector by a angle.
Parameters:
a : Vector2 . Vector2 object.
radians : float . Angle value in radians.
Returns: Vector2. Vector2 object.
-> usage:
`a = new(3.0, 1.5) , b = 2.0 , c = rotate(a, b) , plot(c.x)`
rotate_degree(a, degree)
Rotates vector by a angle.
Parameters:
a : Vector2 . Vector2 object.
degree : float . Angle value in degrees.
Returns: Vector2. Vector2 object.
-> usage:
`a = new(3.0, 1.5) , b = 45.0 , c = rotate_degree(a, b) , plot(c.x)`
rotate_around(this, center, angle)
Rotates vector `target` around `origin` by angle value.
Parameters:
this
center : Vector2 . Vector2 object.
angle : float . Angle value in degrees.
Returns: Vector2. Vector2 object.
-> usage:
`a = new(3.0, 1.5) , b = from(2.0) , c = rotate_around(a, b, 45.0) , plot(c.x)`
perpendicular_distance(a, b, c)
Distance from point `a` to line between `b` and `c`.
Parameters:
a : Vector2 . Vector2 object.
b : Vector2 . Vector2 object.
c : Vector2 . Vector2 object.
Returns: float.
-> usage:
`a = new(1.5, 2.6) , b = from(1.0) , c = from(3.0) , d = perpendicular_distance(a, b, c) , plot(d.x)`
project(a, axis)
Project a vector onto another.
Parameters:
a : Vector2 . Vector2 object.
axis : Vector2 . Vector2 object.
Returns: Vector2. Vector2 object.
-> usage:
`a = new(3.0, 1.5) , b = from(2.0) , c = project(a, b) , plot(c.x)`
projectN(a, axis)
Project a vector onto a vector of unit length.
Parameters:
a : Vector2 . Vector2 object.
axis : Vector2 . Vector2 object.
Returns: Vector2. Vector2 object.
-> usage:
`a = new(3.0, 1.5) , b = from(2.0) , c = projectN(a, b) , plot(c.x)`
reflect(a, axis)
Reflect a vector on another.
Parameters:
a : Vector2 . Vector2 object.
axis
Returns: Vector2. Vector2 object.
-> usage:
`a = new(3.0, 1.5) , b = from(2.0) , c = reflect(a, b) , plot(c.x)`
reflectN(a, axis)
Reflect a vector to a arbitrary axis.
Parameters:
a : Vector2 . Vector2 object.
axis
Returns: Vector2. Vector2 object.
-> usage:
`a = new(3.0, 1.5) , b = from(2.0) , c = reflectN(a, b) , plot(c.x)`
angle(a)
Angle in radians of a vector.
Parameters:
a : Vector2 . Vector2 object.
Returns: float.
-> usage:
`a = new(3.0, 1.5) , b = angle(a) , plot(b)`
angle_unsigned(a, b)
unsigned degree angle between 0 and +180 by given two vectors.
Parameters:
a : Vector2 . Vector2 object.
b : Vector2 . Vector2 object.
Returns: float.
-> usage:
`a = new(3.0, 1.5) , b = from(2.0) , c = angle_unsigned(a, b) , plot(c)`
angle_signed(a, b)
Signed degree angle between -180 and +180 by given two vectors.
Parameters:
a : Vector2 . Vector2 object.
b : Vector2 . Vector2 object.
Returns: float.
-> usage:
`a = new(3.0, 1.5) , b = from(2.0) , c = angle_signed(a, b) , plot(c)`
angle_360(a, b)
Degree angle between 0 and 360 by given two vectors
Parameters:
a : Vector2 . Vector2 object.
b : Vector2 . Vector2 object.
Returns: float.
-> usage:
`a = new(3.0, 1.5) , b = from(2.0) , c = angle_360(a, b) , plot(c)`
clamp(a, min, max)
Restricts a vector between a min and max value.
Parameters:
a : Vector2 . Vector2 object.
min
max
Returns: Vector2. Vector2 object.
-> usage:
`a = new(3.0, 1.5) , b = from(2.0) , c = from(2.5) , d = clamp(a, b, c) , plot(d.x)`
clamp(a, min, max)
Restricts a vector between a min and max value.
Parameters:
a : Vector2 . Vector2 object.
min : float . Lower boundary value.
max : float . Higher boundary value.
Returns: Vector2. Vector2 object.
-> usage:
`a = new(3.0, 1.5) , b = clamp(a, 2.0, 2.5) , plot(b.x)`
lerp(a, b, rate)
Linearly interpolates between vectors a and b by rate.
Parameters:
a : Vector2 . Vector2 object.
b : Vector2 . Vector2 object.
rate : float . Value between (a:-infinity -> b:1.0), negative values will move away from b.
Returns: Vector2. Vector2 object.
-> usage:
`a = new(3.0, 1.5) , b = from(2.0) , c = lerp(a, b, 0.5) , plot(c.x)`
herp(a, b, rate)
Hermite curve interpolation between vectors a and b by rate.
Parameters:
a : Vector2 . Vector2 object.
b : Vector2 . Vector2 object.
rate : Vector2 . Vector2 object. Value between (a:0 > 1:b).
Returns: Vector2. Vector2 object.
-> usage:
`a = new(3.0, 1.5) , b = from(2.0) , c = from(2.5) , d = herp(a, b, c) , plot(d.x)`
transform(position, mat)
Transform a vector by the given matrix.
Parameters:
position : Vector2 . Source vector.
mat : M32 . Transformation matrix
Returns: Vector2. Transformed vector.
transform(position, mat)
Transform a vector by the given matrix.
Parameters:
position : Vector2 . Source vector.
mat : M44 . Transformation matrix
Returns: Vector2. Transformed vector.
transform(position, mat)
Transform a vector by the given matrix.
Parameters:
position : Vector2 . Source vector.
mat : matrix . Transformation matrix, requires a 3x2 or a 4x4 matrix.
Returns: Vector2. Transformed vector.
transform(this, rotation)
Transform a vector by the given quaternion rotation value.
Parameters:
this : Vector2 . Source vector.
rotation : Quaternion . Rotation to apply.
Returns: Vector2. Transformed vector.
area_triangle(a, b, c)
Find the area in a triangle of vectors.
Parameters:
a : Vector2 . Vector2 object.
b : Vector2 . Vector2 object.
c : Vector2 . Vector2 object.
Returns: float.
-> usage:
`a = new(1.0, 2.0) , b = from(2.0) , c = from(1.0) , d = area_triangle(a, b, c) , plot(d.x)`
random(max)
2D random value.
Parameters:
max : Vector2 . Vector2 object. Vector upper boundary.
Returns: Vector2. Vector2 object.
-> usage:
`a = from(2.0) , b = random(a) , plot(b.x)`
random(max)
2D random value.
Parameters:
max : float, Vector upper boundary.
Returns: Vector2. Vector2 object.
-> usage:
`a = random(2.0) , plot(a.x)`
random(min, max)
2D random value.
Parameters:
min : Vector2 . Vector2 object. Vector lower boundary.
max : Vector2 . Vector2 object. Vector upper boundary.
Returns: Vector2. Vector2 object.
-> usage:
`a = from(1.0) , b = from(2.0) , c = random(a, b) , plot(c.x)`
random(min, max)
2D random value.
Parameters:
min : Vector2 . Vector2 object. Vector lower boundary.
max : Vector2 . Vector2 object. Vector upper boundary.
Returns: Vector2. Vector2 object.
-> usage:
`a = random(1.0, 2.0) , plot(a.x)`
noise(a)
2D Noise based on Morgan McGuire @morgan3d.
Parameters:
a : Vector2 . Vector2 object.
Returns: Vector2. Vector2 object.
-> usage:
`a = from(2.0) , b = noise(a) , plot(b.x)`
to_string(a)
Converts vector `a` to a string format, in the form `"(x, y)"`.
Parameters:
a : Vector2 . Vector2 object.
Returns: string. In `"(x, y)"` format.
-> usage:
`a = from(2.0) , l = barstate.islast ? label.new(bar_index, 0.0, to_string(a)) : label(na)`
to_string(a, format)
Converts vector `a` to a string format, in the form `"(x, y)"`.
Parameters:
a : Vector2 . Vector2 object.
format : string . Format to apply transformation.
Returns: string. In `"(x, y)"` format.
-> usage:
`a = from(2.123456) , l = barstate.islast ? label.new(bar_index, 0.0, to_string(a, "#.##")) : label(na)`
to_array(a)
Converts vector to a array format.
Parameters:
a : Vector2 . Vector2 object.
Returns: array.
-> usage:
`a = from(2.0) , b = to_array(a) , plot(array.get(b, 0))`
to_barycentric(this, a, b, c)
Captures the barycentric coordinate of a cartesian position in the triangle plane.
Parameters:
this : Vector2 . Source cartesian coordinate position.
a : Vector2 . Triangle corner `a` vertice.
b : Vector2 . Triangle corner `b` vertice.
c : Vector2 . Triangle corner `c` vertice.
Returns: bool.
from_barycentric(this, a, b, c)
Captures the cartesian coordinate of a barycentric position in the triangle plane.
Parameters:
this : Vector2 . Source barycentric coordinate position.
a : Vector2 . Triangle corner `a` vertice.
b : Vector2 . Triangle corner `b` vertice.
c : Vector2 . Triangle corner `c` vertice.
Returns: bool.
to_complex(this)
Translate a Vector2 structure to complex.
Parameters:
this : Vector2 . Source vector.
Returns: Complex.
to_polar(this)
Translate a Vector2 cartesian coordinate into polar coordinates.
Parameters:
this : Vector2 . Source vector.
Returns: Pole. The returned angle is in radians.
Minervini QualifierThe Minervini Qualifier indicator calculates the qualifying conditions from Mark Minervini’s book “Trade like a Stock Market Wizard”.
The condition matching is been shown as fill color inside an SMA 20day envelope curve.
If the envelope color is red, current close price is below the SMA20 and when blue, current close price is above the SMA20. The fill color can be transparent (not matching qualifying conditions), yellow (matching all conditions except close is still below SMA50), green (all conditions match, SMA200 trending for at least one month up) or blue (all conditions match, SMA200 trending up for at least 5 months)
As I wanted also to see which of the qualifying conditions match over time, I’ve added add. lines, each representing one conditions. If it matches, line color is blue, or red if not. Use the data windows (right side), so you know what line represents which condition. Can be turned on/off (default:on)
In addition, a relative strength is been calculated, to compare the stock to a reference index. It is just one possible way to calculate it, might be different to what Mark Minervini is using. If the shown value (top right) is above 100, stock performs better compared to reference index (can be set in settings), when below 100, stock performs worse compared to reference index. Can be turned on/off (default:on)
How to use it:
For more details, read Mark’s book and watch his videos.
Limitations:
It gives only useful information on daily timeframe
(No financial advise, for testing purposes only)
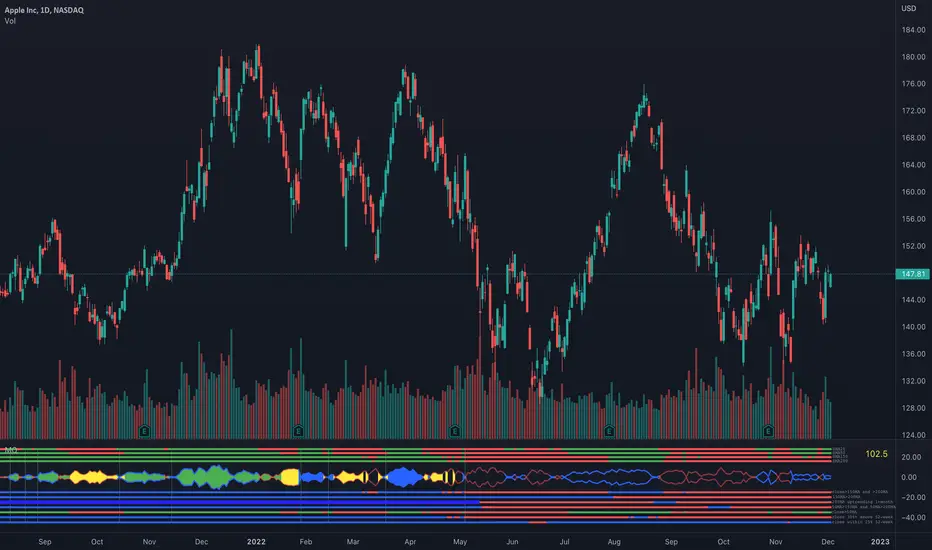
Ehlers Linear Extrapolation Predictor [Loxx]Ehlers Linear Extrapolation Predictor is a new indicator by John Ehlers. The translation of this indicator into PineScript™ is a collaborative effort between @cheatcountry and I.
The following is an excerpt from "PREDICTION" , by John Ehlers
Niels Bohr said “Prediction is very difficult, especially if it’s about the future.”. Actually, prediction is pretty easy in the context of technical analysis. All you have to do is to assume the market will behave in the immediate future just as it has behaved in the immediate past. In this article we will explore several different techniques that put the philosophy into practice.
LINEAR EXTRAPOLATION
Linear extrapolation takes the philosophical approach quite literally. Linear extrapolation simply takes the difference of the last two bars and adds that difference to the value of the last bar to form the prediction for the next bar. The prediction is extended further into the future by taking the last predicted value as real data and repeating the process of adding the most recent difference to it. The process can be repeated over and over to extend the prediction even further.
Linear extrapolation is an FIR filter, meaning it depends only on the data input rather than on a previously computed value. Since the output of an FIR filter depends only on delayed input data, the resulting lag is somewhat like the delay of water coming out the end of a hose after it supplied at the input. Linear extrapolation has a negative group delay at the longer cycle periods of the spectrum, which means water comes out the end of the hose before it is applied at the input. Of course the analogy breaks down, but it is fun to think of it that way. As shown in Figure 1, the actual group delay varies across the spectrum. For frequency components less than .167 (i.e. a period of 6 bars) the group delay is negative, meaning the filter is predictive. However, the filter has a positive group delay for cycle components whose periods are shorter than 6 bars.
Figure 1
Here’s the practical ramification of the group delay: Suppose we are projecting the prediction 5 bars into the future. This is fine as long as the market is continued to trend up in the same direction. But, when we get a reversal, the prediction continues upward for 5 bars after the reversal. That is, the prediction fails just when you need it the most. An interesting phenomenon is that, regardless of how far the extrapolation extends into the future, the prediction will always cross the signal at the same spot along the time axis. The result is that the prediction will have an overshoot. The amplitude of the overshoot is a function of how far the extrapolation has been carried into the future.
But the overshoot gives us an opportunity to make a useful prediction at the cyclic turning point of band limited signals (i.e. oscillators having a zero mean). If we reduce the overshoot by reducing the gain of the prediction, we then also move the crossing of the prediction and the original signal into the future. Since the group delay varies across the spectrum, the effect will be less effective for the shorter cycles in the data. Nonetheless, the technique is effective for both discretionary trading and automated trading in the majority of cases.
EXPLORING THE CODE
Before we predict, we need to create a band limited indicator from which to make the prediction. I have selected a “roofing filter” consisting of a High Pass Filter followed by a Low Pass Filter. The tunable parameter of the High Pass Filter is HPPeriod. Think of it as a “stone wall filter” where cycle period components longer than HPPeriod are completely rejected and cycle period components shorter than HPPeriod are passed without attenuation. If HPPeriod is set to be a large number (e.g. 250) the indicator will tend to look more like a trending indicator. If HPPeriod is set to be a smaller number (e.g. 20) the indicator will look more like a cycling indicator. The Low Pass Filter is a Hann Windowed FIR filter whose tunable parameter is LPPeriod. Think of it as a “stone wall filter” where cycle period components shorter than LPPeriod are completely rejected and cycle period components longer than LPPeriod are passed without attenuation. The purpose of the Low Pass filter is to smooth the signal. Thus, the combination of these two filters forms a “roofing filter”, named Filt, that passes spectrum components between LPPeriod and HPPeriod.
Since working into the future is not allowed in EasyLanguage variables, we need to convert the Filt variable to the data array XX . The data array is first filled with real data out to “Length”. I selected Length = 10 simply to have a convenient starting point for the prediction. The next block of code is the prediction into the future. It is easiest to understand if we consider the case where count = 0. Then, in English, the next value of the data array is equal to the current value of the data array plus the difference between the current value and the previous value. That makes the prediction one bar into the future. The process is repeated for each value of count until predictions up to 10 bars in the future are contained in the data array. Next, the selected prediction is converted from the data array to the variable “Prediction”. Filt is plotted in Red and Prediction is plotted in yellow.
The Predict Extrapolation indicator is shown above for the Emini S&P Futures contract using the default input parameters. Filt is plotted in red and Predict is plotted in yellow. The crossings of the Predict and Filt lines provide reliable buy and sell timing signals. There is some overshoot for the shorter cycle periods, for example in February and March 2021, but the only effect is a late timing signal. Further reducing the gain and/or reducing the BarsFwd inputs would provide better timing signals during this period.
ADDITIONS
Loxx's Expanded source types:
Library for expanded source types:
Explanation for expanded source types:
Three different signal types: 1) Prediction/Filter crosses; 2) Prediction middle crosses; and, 3) Filter middle crosses.
Bar coloring to color trend.
Signals, both Long and Short.
Alerts, both Long and Short.
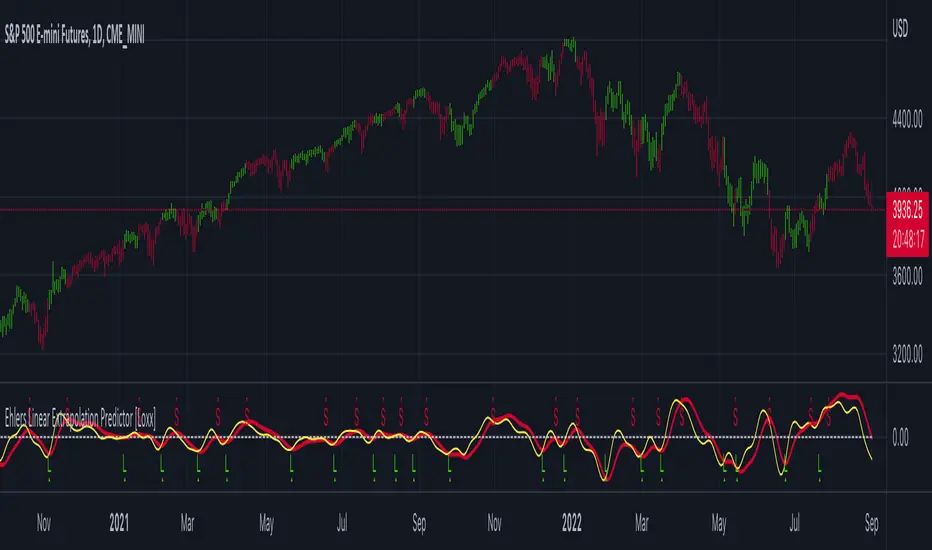
SubCandleI created this script as POC to handle specific cases where not having tick data on historical bars create repainting. Happy to share if this serves purpose for other coders.
What is the function of this script?
Script plots a sub-candle which is remainder of candle after forming the latest peak.
Higher body of Sub-candle refers to strong retracement of price from its latest peak. Color of the sub-candle defines the direction of retracement.
Higher wick of Sub-candle refers to higher push in the direction of original candle. Meaning, after price reaching its peak, price retraced but could not hold.
Here is a screenshot with explanation to visualise the concept:
Settings
There is only one setting which is number of backtest bars. Lower timeframe resolution which is used for calculating the Sub-candle uses this number to automatically calculate maximum possible lower timeframe so that all the required backtest windows are covered without having any issue.
We need to keep in mind that max available lower timeframe bars is 100,000. Hence, with 5000 backtest bars, lower timeframe resolution can be about 20 (100000/5000) times lesser than that of regular chart timeframe. We need to also keep in mind that minimum resolution available as part of security_lower_tf is 1 minute. Hence, it is not advisable to use this script for chart timeframes less than 15 mins.
Application
I have been facing this issue in pattern recognition scripts where patterns are formed using high/low prices but entry and targets are calculated based on the opposite side (low/high). It becomes tricky during extreme bars to identify entry conditions based on just the opposite peak because, the candle might have originated from it before identifying the pattern and might have never reached same peak after forming the pattern. Due to lack of tick data on historical bars, we cannot use close price to measure such conditions. This leads to repaint and few unexpected results. I am intending to use this method to overcome the issue up-to some extent.
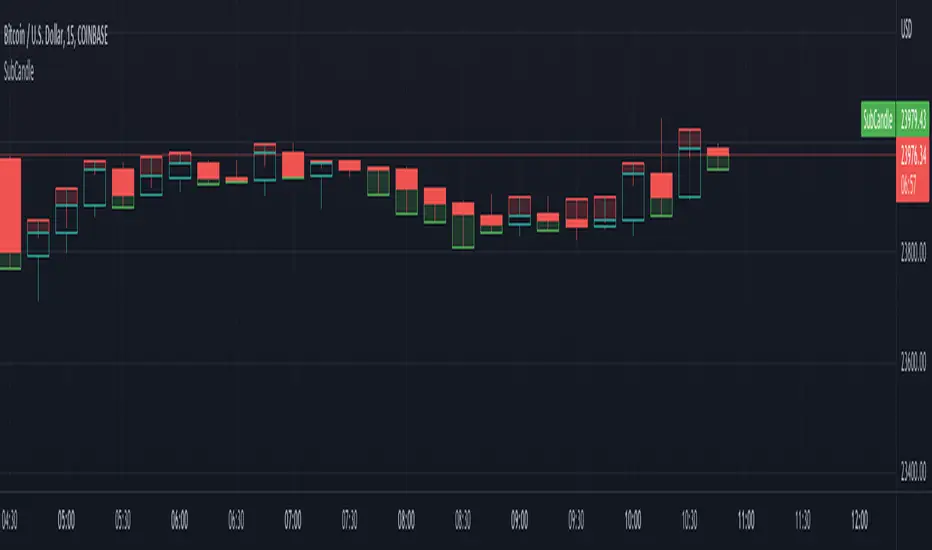
Growth Stock Arbitrage Indicator [@PierceARK]This indicator takes advantage of the fact that when the 10 and 5 year Treasury Constant Maturity Minus Federal Funds rates (T10YFF/T5YFF) go down sharply, investors tend to rotate into stocks. This arbitrage works great for growth stocks, since growth stocks are higher beta by virtue of their lower market cap and more speculative nature in general. This script identifies the moving-average convergence/divergence of the average of the 10y and 5y treasury rates and then finds the variance of that macd line. By averaging that variance with the macdline's inverse, an analog output of treasury -> stock rotation can be identified. The upper and lower thresholds bring buy and sell windows into focus.
