ATR_Normalized & WPR ATR_Normalized & WPR by SkyNet33
Based in ATR_Normalized public scrypt created by @Devil1986 mixed with Classical WPR Indicator.
ATR_Normalized good to use with Williams %R indicator, to find out when price has bottomed out.
ATR has to be over 95 and Williams %R ( lenght 52 ) has to be over 95 to find out level around which one is good to buy.
ค้นหาในสคริปต์สำหรับ "williams"

VIX FixSistema de trading hecho por Larry Williams, basado en VIX, optimizado para cualquier activo.
Formula:
(Highest (Close, 20) - Low) / (Highest (Close, 20)) * 100
Donde “Highest (Close, 20)” representa el cierre mas alto de los ultimos 20 periodos
Larry Williams Mechanical Trading System based on VIX.
The VIX Fix applies the same general formula that is used to calculate the stochastic indicator, so can be used for any asset:
(Highest (Close, 20) - Low) / (Highest (Close, 20)) * 100
Where “Highest (Close, 20)” means the highest closing value in the past 20 periods and the low refers
to the current period’s low. The formula can be applied to any timeframe.
WVF - OscillatorAnother attempt on making use of CM-Williams-Vix-Fix-Finds-Market-Bottoms from Chris Moody - which is arguably one of the best indicator available on pine and tradingview platform. Every time I revisit this, I get new ideas on applying this method.
I have slightly altered formula to
highest(source)-source/highest(source)
from the original formula
highest(close)-low/highest(close)
Process is simple:
Calculate WVF for OHLC values separately
Calculate momentum on each of the WVF values based on distance from moving average
Plot the candles based on OHLC momentum.
Candle color depends on whether close, open and previous close. If close is higher than open and previous close, we get green coloured candles. If close is lower than previous close and open then we get red coloured candles. In all other cases, we will have silver candles.
High/Low bands are calculated based on median of highest and lowest values of VixFix. We also plot median of close which can be used in some cases.
How to use this to find market bottom. Look for one of the below conditions:
First red candle above high band - which signals momentum of vix fix is about to fall.
First red candle above median line - can be used only if upward momentum of wvf candles are trending well.
Crossunder of wvf candles under high band.
Possible exit scenarios
Green WVF candle formed above WVF high line
Entry is taken on first red candle above median line - but, candles turned green before WVF crossing under median line - may signal our thesis is wrong and price may drop further.
Some examples.

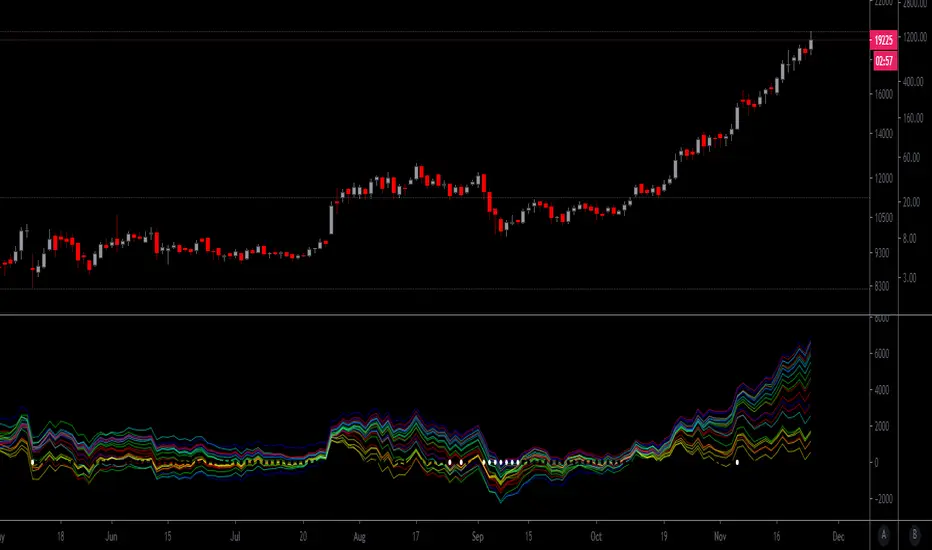
Crypto Volume/Strength ComparatorHello Traders,
Here is an attempt to perform comparative analysis between top cryptos based on strength (oscillator) and volume. Methodology used here is similar to Magic Number formula described in the post : Enhanced Magic Formula for fundamental analysis . But, instead of using fundamentals, we are making use of few technicals to derive similar outcome. Usage of the available stats will not be same as Magic number since we are using technicals.
⬜ Process
▶ Get crypto exchange based on prefix of instrument being used.
▶ For the given exchange, get data for all the tickers available in input fields.
▶ Calculate Oscillator, Momentum based on price for each tickers.
▶ Calculate Oscillator, Momentum based on volume for each tickers.
▶ Calculate Volatility for each tickers.
▶ Rank Price-Oscillator, Price-Momentum, Volume-Oscillator, Volume-Momentum, Volatility for each tickers.
▶ Calculate combined rank by adding up individual ranks.
▶ Calculate movement of rankings from bar to bar
▶ Sort tickers based on rank and populate them on table. Display direction of rankings.
⬜ Components
Display components are as follows:
⬜ Settings
Settings are pretty simple and straightforward
⬜ Calculations
▶ Oscillators : High values of oscillators are considered as ideal as the process is intended towards finding trend.
▶ Momentum : Momentum is calculated on the basis of Squeeze Momentum Indicator by @LazyBear.
▶ Volatility : Volatility is calculated on the basis of Williams Vix Fix by @ChrisMoody. Here too since we are in trend following mode, lower vix fix is considered ideal.
⬜ Few Notes
Tickers will show data only if selected exchange has them. Some tickers are not available in all exchanges. In that case, it will show NAN. This is kind of unavoidable as we need to have fixed size arrays for any calculations.
Indicator works only on crypto tickers which has valid exchange.
Tickers move through the rankings in real time. Background of all stats are based on gradient from green to red.
Tickers on top may not always have better long opportunity or tickers at bottom may not always be optimal for shorting. We need to consider how long the instrument may stay in the position or how fast it is moving in opposite direction. Hence, directions of the ranking movement are also shown on the table.

AO-ZoneThe Zone is mention in New Trading Dimensions by Bill Williams,PhD.
The Zone is used for Entry Signal
Green Zone are painting Green when Awesome Oscillator (AO) and Accelerater/Decelerator (AC) are both increasing.
Red Zone are painting Red when Awesome Oscillator (AO) and Accelerater/Decelerator (AC) are both decreasing.
Gray Zone are painting Gray when AO and AC in difference changing
Gray Zone are indicate the indecision between bulls and bears.
Bill Williams, PhD. mention that Green Zone or Red Zone usually happen 6-8 bars Continuously.
(in my opinion, it happen lower than in intraday time frame)
The First Bar that change to be Green or Red color is the Signal Bar.
Entry Signal is the second bar in the same color as the Signal bar happen with Volume
Price go higher the high of previous Green Bar is Buy Signal. Entry Buy (Long) and place Stop at 1 tick lower the Low of previous bar.
Price go lower the Low of previous Red Bars is Sell Signal. Entry Sell (Short) and place Stop at 1 tick higher the High of previous bar.
Can Entry from 2nd bar to 5th bar.
Do not Entry if Green Bars or Red Bars completed 5 bars continuously.
This indicator have AO , AC and Zone in 1 tools and there are counter to show the number of Green bar or Red bar.
Green counter will happen when AO >0 and Green zone because AO > 0 show uptrend condition.
Red Counter will happen when AO < 0 and Red Zone because AO <0 show downtrend condition.
When we entry , we should follow the trend. So I design to non-show the counter if zone is against the trend.
#WaveRiders
iTradeAIMS | The Purple MagicThe Magic Purple Line
To put it very simply, the Magic Purple Line is the Trend Line that I use for my trading.
It is a Trend line based on Trading Chaos.
Yes, it is the Red Line of the Bill Williams Alligator but...
It is the Red Line of the 5 times higher time frame
This means you will ALWAYS be in tune with the trend of the higher time frame.
that's very simple.
I arrived at this indicator by using some fractal geometric math logic.
The Redline of Bill Williams Alligator Indicator is calculated by using 8-period smooth moving average with a shift of 5 periods to the right.
Multiply 8 by 5 = 40
Multiple 5 by 5 = 25
But to get it Fractal Geometrically correct, I converted it into the Nearest Fib Numbers.
et voila, you have the Magic Purple Line
How to calculate The Magic Purple Line:
Plot a 34 Smooth Moving Average with 21 Shift
I used it like this.
I take entries using AIMS The Box indicator. I want the box to be always above the purple line for my buy orders and vice versa for shorts
E.g. Tesla Entries Marked on this chart.
Note that all entries are marked as Buy Orders because the price is above the purple line.
Hope this helps improve your trading.
If you like it, please hit the LIIKE button and Follow iTradeAIMS 🎈🎉

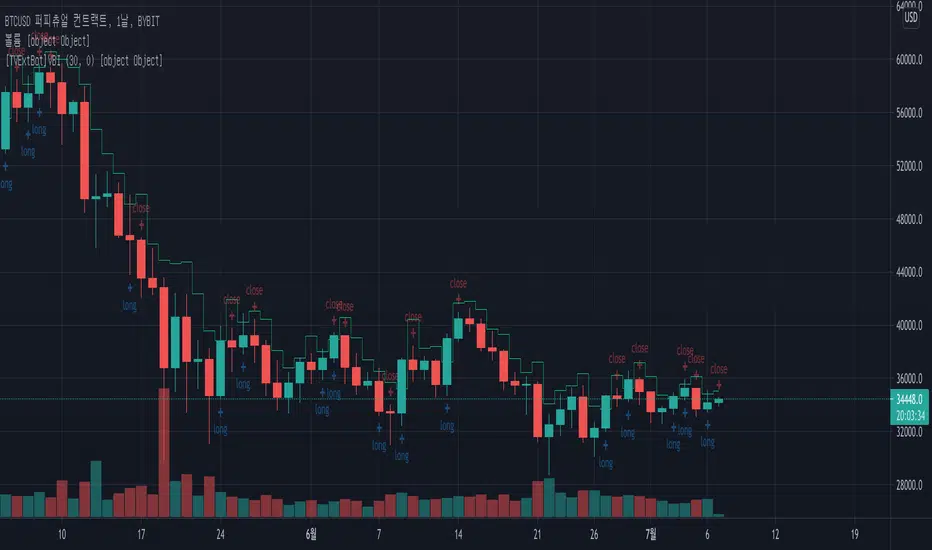
[TVExtBot]Volatility Breakout Plus Indicator(With Alerts)It is based on the legendary trader Larry R. Williams' volatility breakout strategy.
The volatility breakout strategy is a short-term trading strategy that realizes rapid profits on a daily basis, following the upward trend of a strong upward trend that exceeds a certain level on a daily basis.
The Volatility Breakout Plus strategy is a strategy modified to a long-term trend by supplementing the existing Volatility Breakout strategy.
변동성 돌파 전략이란 전설적인 트레이더 래리 윌리엄스(Larry R. Williams)의 변동성 돌파 전략을 기본으로 개발한 전략입니다.
변동성 돌파 전략은 일일 단위로 일정 수준 이상의 범위를 뛰어넘는 강한 상승세를 돌파 신호로 상승하는 추세를 따라가며 일 단위로 빠르게 수익을 실현하는 단기매매 전략입니다.
이번 출시하는 변동성 돌파 플러스 전략은 기존 변동성 돌파 전략을 보완하여 장기 추세로 수정한 전략입니다.
※특징으로는 선물보다는 현물차트에 더 효과적입니다.
기본적인 설정은 기존 변동성 돌파 전략과 동일하고 장기 추세에서의 리스크를 줄이기 위해 익절과 손절 기능을 추가하였습니다.
Default Options(기본설정)
BeforeDay Open-Close Volatility (%) (전날 시가종가 변동률) : 6%
StopLoss (%) (손절) : 6%
TakeProfit (%) (익절) : 30%

[BMAX] Fractals(ENGLISH)
This is a variation of the original Fractals indicator by Bill Williams - in this version we use the concept of three candles being in a swing low when the second candle has the highest high and on a swing high when the second candle has the lowest low.
(PORTUGUÊS)
Esta é uma variação do indicador original Fractals criado por Bill Williams - nesta versão usamos o conceito de três candles sendo considerado um pivô de baixa quando o segundo candle tem a máxima mais alta e um pivô de alta quando o segundo candle tem a mínima mais baixa.

Distance From-22-Moving Averages over CMOODYwilliamsVIXFIXThis script is a mean reversion script where each of the moving averages represent the price and Chris Moody's Williams Vix Fix ZERO line represents the moving averages. There are 4 moving average types included: EMA , SMA , WMA , HMA .
You can set up to your liking by having all of the averages as any or all of the 4 options.
This script is a great way to spot bearish/bullish divergences in price action.
This script is also excellent at indicating periods of price action when volatility is extremely low - all the plots get very tight instead of spread out.
I have copy/pasted a public script by Chris Moody which is the Williams Vix Fix. This indicator shows a white circle as a "top" or "bottom" based on the current price distance off the mean (in simple terms).
Thank you Chris Moody!
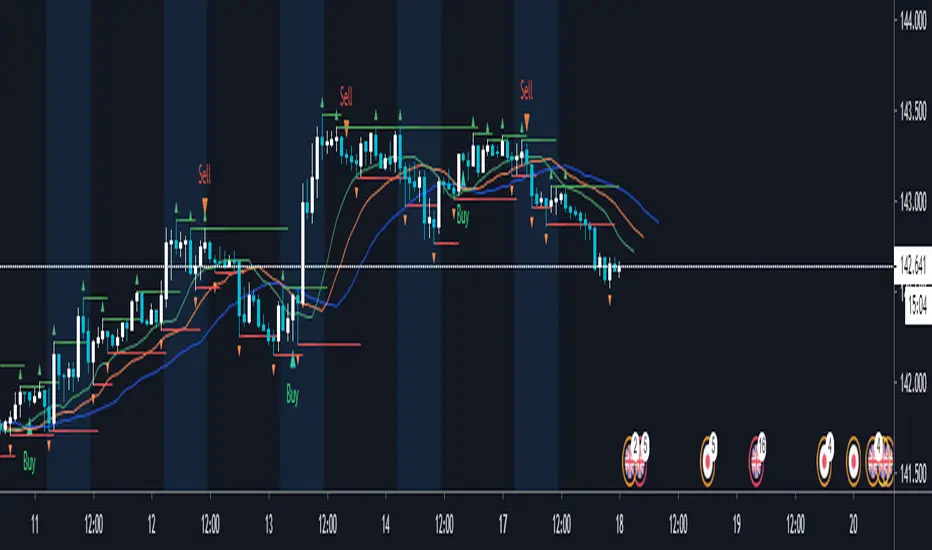
DigitalTrendTradeAlerts | 0.3Digital Trend Trade Alerts is a compilation version of the Digital Trend Trade strategy that allows you to send out Trading View notifications:
The Digital Trend Trade trading strategy is designed for trading both local and global trends, as well as for displaying floating and fixed support levels and identifying price extremes.
The strategy consists of several main elements:
Global Average - On the chart, GA is displayed as the average price line, showing the current local trend direction with its color, as well as edging the bars to the trend color. Generates a signal when the local trend changes.
Global Trend - The second element of the strategy indicator is Global Trend, which forms the key support and resistance levels, when breaking through which the global trend changes and the corresponding signal is formed.
Bill Williams Fractal Levels - And the third element is the Bill Williams Fractal Levels block, which primarily fixes local extremes that can be used for scalping, as well as for setting a take profit and stop loss for a trade.
Support and resistance levels are also formed from local extremes.
To get access to the indicator, contact us via private messages.

[TVExtBot]Volatility Breakout Indicator(With Alerts)Volatility Breakout Indicator(With Alerts)
It is based on the legendary trader Larry R. Williams' volatility breakout strategy.
The volatility breakout strategy is a short-term trading strategy that realizes rapid profits on a daily basis, following the upward trend of a strong upward trend that exceeds a certain level on a daily basis.
변동성 돌파 지표란 전설적인 트레이더 래리 윌리엄스(Larry R. Williams)의 변동성 돌파 전략을 기본으로 개발한 지표입니다.
변동성 돌파 전략은 일일 단위로 일정 수준 이상의 범위를 뛰어넘는 강한 상승세를 돌파 신호로 상승하는 추세를 따라가며 일 단위로 빠르게 수익을 실현하는 단기매매 전략입니다.
Fractals | Swing Points | Highs & Lows | Custom PeriodsSimple script which marks out key swing highs & lows.
One of the only indicators I have on the chart most days
- perfect for naked charting
- quickly helps you to visually identify key areas of interest
An extension of Bill Williams fractals
- aka short term swing points
Allows you to filter for only the most prominent swing points
- you can even overlay multiple swingpoint filters in different colours (as per example chart)
The number ( Fractal Periods) is simply:
- the number of less prominent points either side of your swing high/low
- example shown on the chart
Otherwise make a fist
- look at your 5 knuckles
- swing high is your middle knuckle
- 2 lower points either side
Bill Williams Original Fractal:
Fractal Periods = 2
Your Fractal Period for Filtering:
3, 4, 5, 30, 365, etc
Allows you to find swing points down to:
Fractal Periods = 1
Simple, easy, shared to enjoy =)

AIMS Gator TVThe Alligator is a very good indicator; it reveals the fractal geometric nature of the market.
To understand AIMS Gator we must first understand Bill Williams Alligator.
There is scientific research behind it and Bill Williams used supercomputers to arrive at this trend-confirming indicator.
The Alligator is our “compass” - it shows us the direction of the trend and is very much in tune with the structure of the market.
Anatomy of the Alligator
The Alligator is made of three smooth moving averages, shifted into the future.
The picture below shows an open gator with its three-line not touching each other.
BLUE LINE:
Interpretation and Use of Information Provided by the Blue Line
Alligator's Jaw (the Blue Line) – is a 13 period smooth moving average, at the mid price (High+Low)/2, offset 8 bars into the future.
The Blue line is the Balance Line for price on the current time frame. Price will come to the Blue Line when there is no new incoming information. This means when the volatility goes down, the momentum will fall and price will stop travelling up and down; it starts going sideways and the Alligator catches up with price. When price is close to the Blue Line, it is said to be at its Balance Line. When price goes sideways, with all three lines intertwined we say, the Alligator is sleeping and that the market has reached its Balance Line. When there is new incoming information, price starts going away from the Balance Line and the Alligator opens its mouth. The rise and fall of momentum is also represented in the form of a histogram by AIMS AO (explained below). The Blue Line mimics AIMS AO as well. You must pay attention to relationship of the Blue Line and AIMS AO.
The Blue Line is the trend and the Balance Line of the current time frame.
RED LINE:
Interpretation and Use of Information Provided by the Red Line
Alligator's Teeth (the Red Line) – is an 8-period smooth moving average, at the mid-price (High+Low)/2, offset 5 bars into the future.
The Red Line is the Balance Line of the significant lower time frame. When price is above the Red Line on M5 we start looking for a buy Setup on M1. When price is below the Red Line on M5 we start looking for a sell Setup on M1. We have a mechanism to display the Red Line of M5 on M1 – it’s called the Purple Line.
Red Line is the trend and the Balance Line of a certain lower time frame.
Alligator's Lips (The Green Line) – 5-period smooth moving average, at the mid-price (High+Low)/2, offset 3 bars into the future.
GREEN LINE:
Interpretation and Use of Information Provided by the Green Line
The Green Line is the Balance Line of a significant lower time frame, even lower than the Red Line. Just like the Blue Line, it also has a relationship with AO but with AO of the 5 times lower time frame.
GreenLine is the trend and Balance Line of a lower time frame than the Red Line.
What is the AIMS Gator?
Now that you know about the Alligator and the relationship of the lines it should be easy for you to understand that the AIMS Gator is the “Multi-Dimensional Alligator”. We trade in the direction of 5 times higher time frame. Wouldn’t it be nice to know what the Alligator of the five times higher time frame telling us? In order to do so, we have chosen to display on M1, the information provided by the Red Line on M5.
AIMS Gator together with the Purple Magic Line, shows us the Red Line of M5 (5xHTF) on M1 (Current Time Frame).
Alligator is our Compass whereas AIMS Gator is our Map.
PURPLE Magic Line: Script Link
Interpretation and Use of Information Provided by the Purple Line
The Purple Line is the trend of a 5 times higher time frame.
The Purple Line – is a derivative of the Red Line of 5 times higher time frame. On M1, it is the Red Line of M5.
What is the Sleeping Alligator?
We generally want the Alligator to ‘sleep’ before we start looking for a trading opportunity.
The Alligator is considered asleep when the three lines are intertwined and horizontal.
When the Alligator is sleeping and purple magic is hovering below it like in the picture below, we get excited, looking for a range breakout, in this example buy only because gator and price is above the Purple Magic.

Super EMA PrismThis script implements the Binary Trade Logic (BTL) algorithm to calculate two distinct scores that range from 0 to 7. One score is calculated assigning a power of 2 weight to the positive sign of 3 Phi^3 distant Moving Average (MA) slopes. The other score is calculated assigning a power of 2 weight to the sign of the difference between the price and the value of 3 Phi^3 distant Moving Average (MA).
For the first score, hereafter called as the angle score (AS), the largest MA slope positive sign receives weight 4, the middle length MA slope positive sign receives weight 2 and the shortest MA slope positive sign receives weight 1. The positive sign of an MA is defined as 1 if the slope of the MA is positive and 0, otherwise. Therefore, for MAs 305, 72 and 17, if slope(MA305) > 0, slope(MA72) < 0 and slope(MA17) > 0, then score will be 4*1 + 2*0 + 1*1 = 5. Up to my knowledge, this score was first proposed by Bo Williams and named by him as Prisma.
For the second score, hereafter called as the value score (VS), if the price > largest MA, it receives weight 4. If the price > the middle length MA, it receives weight 2 and if the price > the the shortest MA, it receives weight 1. Therefore, for MAs 305, 72 and 17, if price < MA305, price > MA72 and price > MA17, then score will be 4*0 + 2*1 + 1*1 = 3. Up to my knowledge, this score was first proposed by Bo Williams and named by him as Prisma.
Both AS and VS are calculated for Phi^3 lengths (610, 144, 34) and for Phi^3/2 lengths (305, 72, 17). The scores of the same kind calculated for each set of length are combined multiplying the Phi^3 length score by 10 and adding with with the Phi^3/2 score, therefore providing a 2 digit score ranging from 0 to 77. For instance, if we have AS(610, 144, 34) = 7 and AS(305, 72, 17) = 5, we have AS=75. At the same time, if we have VS(610, 144, 34) = 6 and VS(305, 72, 17) = 4, we have VS=64.
VS score is plotted by default in black, but it can be on white for dark themes. AS is plotted with the color of the longest MA used.
Chart background is colored according to the range of values for AS and VS, checked in the following order:
if AS >= 13 and VS <= 13 then back color = red
if AS >= 13 or VS <= 13 then back color = orange
if AS >= 64 and VS >= 64 then back color = green
if AS >= 64 or VS >= 64 then back color = blue
otherwise back color = none (white o black)

Super MyMA PrismThis script implements the Binary Trade Logic (BTL) algorithm to calculate two distinct scores that range from 0 to 7. One score is calculated assigning a power of 2 weight to the positive sign of 3 Phi^3 distant Moving Average (MA) slopes. The other score is calculated assigning a power of 2 weight to the sign of the difference between the price and the value of 3 Phi^3 distant Moving Average (MA).
For the first score, hereafter called as the angle score (AS), the largest MA slope positive sign receives weight 4, the middle length MA slope positive sign receives weight 2 and the shortest MA slope positive sign receives weight 1. The positive sign of an MA is defined as 1 if the slope of the MA is positive and 0, otherwise. Therefore, for MAs 305, 72 and 17, if slope(MA305) > 0, slope(MA72) < 0 and slope(MA17) > 0, then score will be 4*1 + 2*0 + 1*1 = 5. Up to my knowledge, this score was first proposed by Bo Williams and named by him as Prisma.
For the second score, hereafter called as the value score (VS), if the price > largest MA, it receives weight 4. If the price > the middle length MA, it receives weight 2 and if the price > the the shortest MA, it receives weight 1. Therefore, for MAs 305, 72 and 17, if price < MA305, price > MA72 and price > MA17, then score will be 4*0 + 2*1 + 1*1 = 3. Up to my knowledge, this score was first proposed by Bo Williams and named by him as Prisma.
Both AS and VS are calculated for Phi^3 lengths (610, 144, 34) and for Phi^3/2 lengths (305, 72, 17). The scores of the same kind calculated for each set of length are combined multiplying the Phi^3 length score by 10 and adding with with the Phi^3/2 score, therefore providing a 2 digit score ranging from 0 to 77. For instance, if we have AS(610, 144, 34) = 7 and AS(305, 72, 17) = 5, we have AS=75. At the same time, if we have VS(610, 144, 34) = 6 and VS(305, 72, 17) = 4, we have VS=64.
The used Moving Averages can be chosen between EMA and MyMA. MyMA is a Moving Average that tries to mimic Bo William's MIMA. Due to the close resemblance between MyMA and MIMA, I do not feel comfortable to open this script source code. In order to learn how this script operates with EMAs, please refer to my Super EMA Prism indicator that has its source code open.
VS score is plotted by default in black, but it can be on white for dark themes. AS is plotted with the color of the longest MA used.
Chart background is colored according to the range of values for AS and VS, checked in the following order:
if AS >= 13 and VS <= 13 then back color = red
if AS >= 13 or VS <= 13 then back color = orange
if AS >= 64 and VS >= 64 then back color = green
if AS >= 64 or VS >= 64 then back color = blue
otherwise back color = none (white o black)

ATR _NormalizedThis script is good to use with Williams %R indicator, to find out when price has bottomed out.
ATR has to be over 90 and Williams %R ( lenght 52 ) has to be over 95 to find out level around which one is good to buy.
You can check back, to see that this worked very well over history. Best way to use this 2 indicators is with DCA ( dollar cost average ), as area where to buy can go a little bit down and up for as long as few months. So dont just jump in, use DCA .

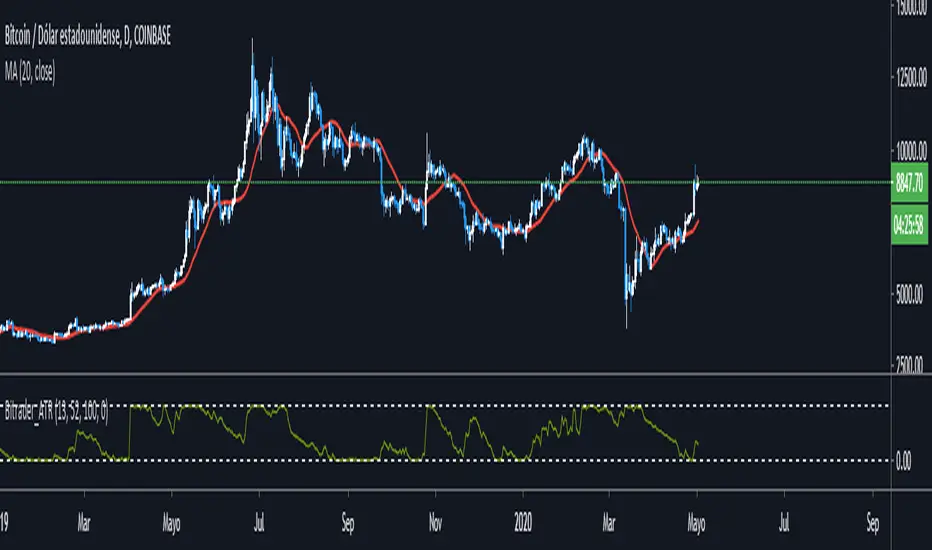
Bitrader_ATRUn verdadero rango normalizado de Larry Williams, es el Bitrader_ATR
La fórmula para el cálculo:
ATR_Normalize = 100 * MovingAvg (Cerrar - Bajo, período rápido) / (MovingAvg (Rango verdadero, período lento)
Esto es una indicación de que se puede definir con firmeza y claridad cuando el precio alcanza picos y cae a los fondos.
Cuando el indicador está en la zona alta, generalmente anuncia que el precio de la seguridad caerá, y cuando está en el área inferior, dice que los precios subirán.
***********************************************************
A normalized true range by Larry Williams, is the Bitrader_ATR
The formula for the calculation:
ATR_Normalize=100 * MovingAvg (Close – Low, fast period) / (MovingAvg (True Range , slow period)
This is an indication of that it can be firmly and clearly defined when the price reaches peaks an falls to bottoms.
When the indicator is in the high zone, it usually portends that the security price will fall, and when it is in the lower area – says that prices will rise.
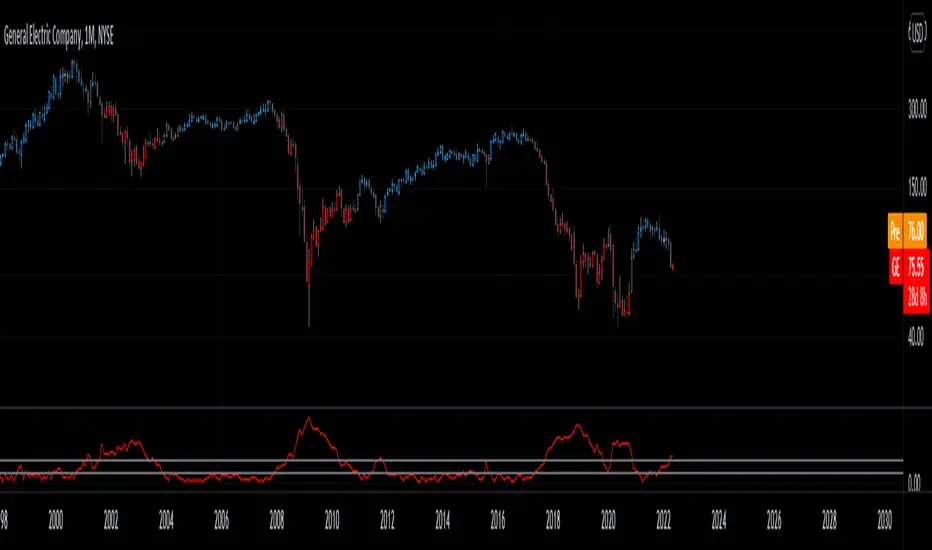
QQE WRThis is an improved version of the existing QQE. Its performs better because it relies on Williams %R instead of the RSI. The simplicity of the Williams %R gives the QQE better performance resulting in less false signals. It works across all instruments, especially volatile ones.

Remora4 indicadores en 1
Esto se logró combinando algunas de las ideas de otros tres indicadores:
- Williams Alligator
- Fractales y niveles
- Oscilador Asombroso
- Bitrader4.0
Como operar:
El Alligator nos muestra la tendencia, operar a favor de la tendencia.
Ubicar los fractales y determinar los breakouts con ellos.
El indicador Bitrader4.0 nos muestra la compra y venta de acuerdo a la configuración de los parámetros setup
Funcional en todos los timeframe.
////////////////////////////////
4 indicators in 1
This was achieved by combining some of the ideas from three other indicators:
- True Williams Alligator
- Fractals and Levels
- Awesome Oscillator
- Bitrader4.0
How to operate:
The trend will show us the alligator, operate in favor of the trend.
Locate the fractals and determine the breakouts with them.
The Bitrader4.0 indicator will show us buying and selling according to the setup parameters.
Functional in all timeframe.
ChaosVChaosV- Chaos Volume, is another Bill Williams' style indicator. It's essentially the Profitunity Candles, but in a Volume Bar setup. It incorporates MFI, to determine if a bar meets the Green, Squat, Fade or Fake requirements, as set by Bill Williams in his book Trading Chaos.

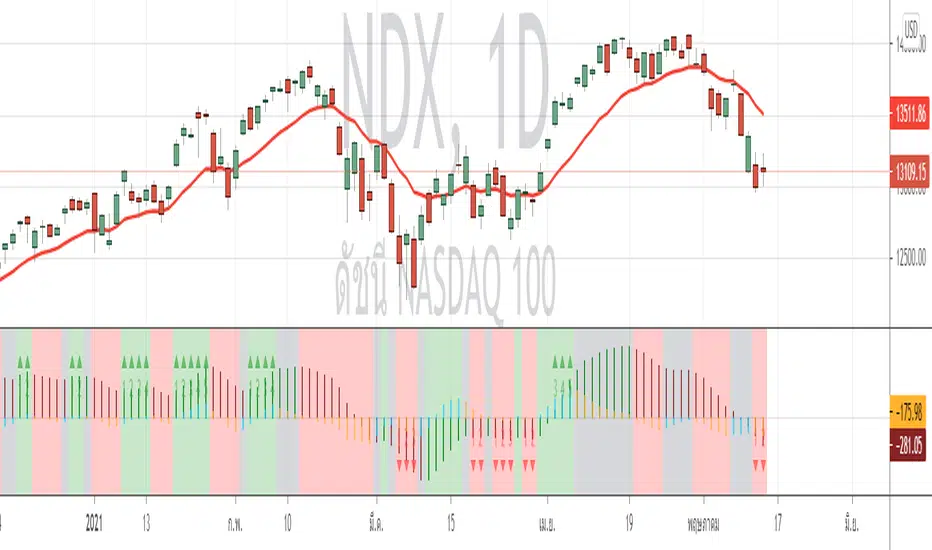
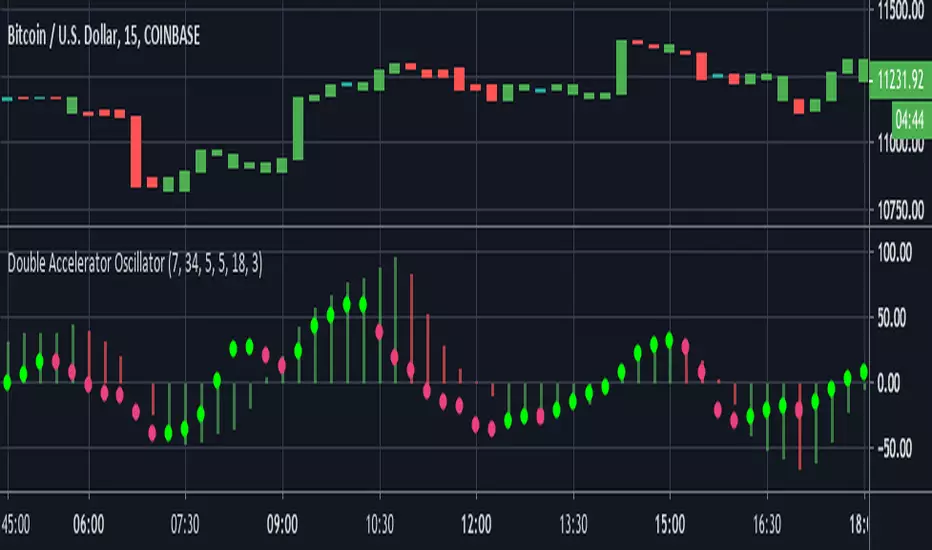
Double Accelerator OscillatorThis is a modified version of Bill Williams' Accelerator. The Accelerator measures the difference between the Awesome Oscillator(another Williams indicator) and its 5 day SMA.
This script plots 2 accelerators rather than 1. Users can define the lengths of the fast and slow SMA's used in the Awesome Oscillator calculation by adjusting the options in the input menu.
We set the default the lengths of the fast and slow SMA's used in the first Awesome Oscillator calculation as 34 and 7 periods. Then to find the Accelerator Oscillator, the difference between the Awesome Oscillator and its 7 period SMA is calculated. The second Accelerator uses shorter window lengths than the first. The fast SMA length is 5 by default and the slow SMA length is 18. Finally, the length of the Awesome Oscillator SMA used to calculate the second Accelerator Oscillator is 3.
By utilizing two Accelerator Oscillators with increasingly shorter window lengths, this indicator identifies changes in momentum very well.
The red and green histogram represents the first Accelerator Oscillator. It is green when the Accelerator is increasing and red when it is decreasing. I found this layout to be more practical than the standard, which plots the AC as green when it is greater than 0 and red when less than zero. The second Accelerator Oscillator is plotted as the bright green and pink circle line. It uses the same coloring conditions as above.
PpSignal PerPro V6 Indicator Version with alarmThis is the of PerPro V6 indicator version with alarm. Remember in trend changes the indicator may repaint the signal. Please use other indicators to accompany the entries.
in small periods, such as 1, 3 and 5 minutes and pairs or high volatility stock we have seen a repaint until confirms the trend.
if you want to use it in 1, 3 or 5 minutes condigurelo in tf 1h or 240 up. in 1h charts we recommend 480, 720 or D in forex, in stock 1h tf W, in 1D graph set in W or M. It may be at the beginning of a new signal repaint.
I'll leave it free for 3 months then I'll change the code and make it private.

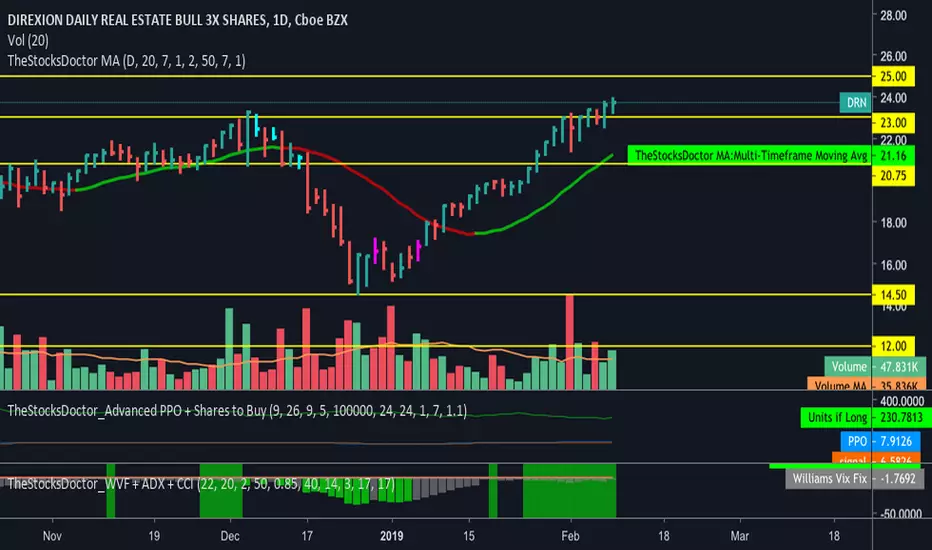
TheStocksDoctor_WVF + ADX + CCIThis script is a modified version of CM Williams Vix Fix for which I have added an indicator that shows when ADX and CCI are both indicating positive momentum - highlighted by green bars. This is part of TheStocksDoctor Trading System.
Inputs are as follows:
Lookback period Standard Deviation High ---> 22
Bolinger Band Length ---> 20
Bollinger Band Standard Dev.. ---> 2
Lookback period percentile high ---> 50
Highest Percentile ---> 0.85
----Highlight bars Below... --->
Show Highlight bar if WVF WAS true is now False --->
Show highlight bar if WVF IS True --->
----Highlight bars Below Use Filtered... --->
Show highlight bar for filtered entry --->
Show highlight bar for AGGRESSIVE Filtered Entry? --->
Check below to Turn all Bars Gray --->
Check box to Turn Bars gray? --->
Long-term look back current bar has to close Below... ---> 40
Medium-term look back current bar has to close below... ---> 14
Entry price action strength --close... ---> 3
--------Turn On/Off Alerts below... --->
---To activate alerts you HAVE To Check... --->
---You can un Check the box BELOW... --->
Show Williams Vix Fix Histogram... --->
Show Alert WVF = True? --->
Show Alert WVF wa true now False? --->
Show Alert WVF Filtered? --->
Show Alert WVF AGGRESSIVE Filter? --->
ADX Smoothing ---> 17
DI Length ---> 17