Targets For Many Indicators [LuxAlgo]The Targets For Many Indicators is a useful utility tool able to display targets for many built-in indicators as well as external indicators. Targets can be set for specific user-set conditions between two series of values, with the script being able to display targets for two different user-set conditions.
Alerts are included for the occurrence of a new target as well as for reached targets.
🔶 USAGE
Targets can help users determine the price limit where the price might start deviating from an indication given by one or multiple indicators. In the context of trading, targets can help secure profits/reduce losses of a trade, as such this tool can be useful to evaluate/determine user take profits/stop losses.
Due to these essentially being horizontal levels, they can also serve as potential support/resistances, with breakouts potentially confirming new trends.
In the above example, we set targets 3 ATR's away from the closing price when the price crosses over the script built-in SuperTrend indicator using ATR period 10 and factor 3. Using "Long Position Target" allows setting a target above the price, disabling this setting will place targets below the price.
Users might be interested in obtaining new targets once one is reached, this can be done by enabling "New Target When Reached" in the target logic setting section, resulting in more frequent targets.
Lastly, users can restrict new target creation until current ones are reached. This can result in fewer and longer-term targets, with a higher reach rate.
🔹 Dashboard
A dashboard is displayed on the top right of the chart, displaying the amount, reach rate of targets 1/2, and total amount.
This dashboard can be useful to evaluate the selected target distances relative to the selected conditions, with a higher reach rate suggesting the distance of the targets from the price allows them to be reached.
🔶 DETAILS
🔹 Indicators
Besides 'External' sources, each source can be set at 1 of the following Build-In Indicators :
ACCDIST : Accumulation/distribution index
ATR : Average True Range
BB (Middle, Upper or Lower): Bollinger Bands
CCI : Commodity Channel Index
CMO : Chande Momentum Oscillator
COG : Center Of Gravity
DC (High, Mid or Low): Donchian Channels
DEMA : Double Exponential Moving Average
EMA : Exponentially weighted Moving Average
HMA : Hull Moving Average
III : Intraday Intensity Index
KC (Middle, Upper or Lower): Keltner Channels
LINREG : Linear regression curve
MACD (macd, signal or histogram): Moving Average Convergence/Divergence
MEDIAN : median of the series
MFI : Money Flow Index
MODE : the mode of the series
MOM : Momentum
NVI : Negative Volume Index
OBV : On Balance Volume
PVI : Positive Volume Index
PVT : Price-Volume Trend
RMA : Relative Moving Average
ROC : Rate Of Change
RSI : Relative Strength Index
SMA : Simple Moving Average
STOCH : Stochastic
Supertrend
TEMA : Triple EMA or Triple Exponential Moving Average
VWAP : Volume Weighted Average Price
VWMA : Volume-Weighted Moving Average
WAD : Williams Accumulation/Distribution
WMA : Weighted Moving Average
WVAD : Williams Variable Accumulation/Distribution
%R : Williams %R
Each indicator is provided with a link to the Reference Manual or to the Build-In Indicators page.
The latter contains more information about each indicator.
Note that when "Show Source Values" is enabled, only values that can be logically found around the price will be shown. For example, Supertrend , SMA , EMA , BB , ... will be made visible. Values like RSI , OBV , %R , ... will not be visible since they will deviate too much from the price.
🔹 Interaction with settings
This publication contains input fields, where you can enter the necessary inputs per indicator.
Some indicators need only 1 value, others 2 or 3.
When several input values are needed, you need to separate them with a comma.
You can use 0 to 4 spaces between without a problem. Even an extra comma doesn't give issues.
The red colored help text will guide you further along (Only when Target is enabled)
Some examples that work without issues:
Some examples that work with issues:
As mentioned, the errors won't be visible when the concerning target is disabled
🔶 SETTINGS
Show Target Labels: Display target labels on the chart.
Candle Coloring: Apply candle coloring based on the most recent active target.
Target 1 and Target 2 use the same settings below:
Enable Target: Display the targets on the chart.
Long Position Target: Display targets above the price a user selected condition is true. If disabled will display the targets below the price.
New Target Condition: Conditional operator used to compare "Source A" and "Source B", options include CrossOver, CrossUnder, Cross, and Equal.
🔹 Sources
Source A: Source A input series, can be an indicator or external source.
External: External source if 'External" is selected in "Source A".
Settings: Settings of the selected indicator in "Source A", entered settings of indicators requiring multiple ones must be comma separated, for example, "10, 3".
Source B: Source B input series, can be an indicator or external source.
External: External source if 'External" is selected in "Source B".
Settings: Settings of the selected indicator in "Source B", entered settings of indicators requiring multiple ones must be comma separated, for example, "10, 3".
Source B Value: User-defined numerical value if "value" is selected in "Source B".
Show Source Values: Display "Source A" and "Source B" on the chart.
🔹 Logic
Wait Until Reached: When enabled will not create a new target until an existing one is reached.
New Target When Reached: Will create a new target when an existing one is reached.
Evaluate Wicks: Will use high/low prices to determine if a target is reached. Unselecting this setting will use the closing price.
Target Distance From Price: Controls the distance of a target from the price. Can be determined in currencies/points, percentages, ATR multiples, ticks, or using multiple of external values.
External Distance Value: External distance value when "External Value" is selected in "Target Distance From Price".
ค้นหาในสคริปต์สำหรับ "williams"

Neo's Divergence FractalsDivergence Fractals combine divergence candlestick patterns with concepts pioneered by Bill Williams and George Lane to create a precise trend following tool that responds very well to the FX market. This indicator is built off of my Neo Fractal data set, which unlike traditional Williams fractals, track highest and lowest closes instead of higher highs and lower lows. Through my own research, I've found Neo Fractals to be a much more accurate way of pinpointing %K and RSI extremes than Williams fractals, especially in scenarios where markets make higher highs or lower lows, but fail to close higher or lower. This can lead to false divergence signals because the stochastic and RSI values aren't referenced at their highest or lowest point.
If divergence is detected between the previous close and the closest fractal above or below the close, the script then waits for a close above (bullish), or below (bearish) the close where divergence was present, at which point, an up (bullish) or down (bearish) fractal will appear on the chart. Divergence signals followed by engulfing candles are also colored, so they're easy to spot. These are the highest quality reversal or in some cases trend continuation signals! Divergence Fractals can be a great entry tool, but can also be great for managing and closing active trades as well. This indicator was designed to work in tandem with my %K as well as my proprietary Lucky7 indicator, mainly on the 1HR chart.

Vix FIX / Stochastic Weights StrategyThis script is based off of Chris Moody's Vix Fix Indicator modified by OskarGallard and BigBitsIO's Stochastic Weights.
This script is a compilation of several different stochastic indicators (and RSI ) where the K value of each indicator is equally weighted. The purpose of the indicator is to combine many indicators together in a fashion that weights them easier. By default, the Stochastic and Stochastic RSI are both enabled - the idea is to speed up the relatively slower Stochastic and to slow down the relatively fast Stochastic RSI . BigBitsIO's Stochastics are also available that can also be added to the weighted calculation. Only the K value is weighted, as the D value is just a moving average of the weighted K.
- Why is this modifed stochastic useful?
- To weight multiple indicators together so that you can attempt to find optimal values shared amongst the indicators. Ex: If Stochastic RSI is 100 and Stochastic is 50, K would be 75 and not particularly high. If you add in a 50 RSI , the K would be 67 in this example. If we weight indicators together that all have a high value they could potentially help find elements that align together to produce a stronger signal.
In this script we have the red "S" triangles which are Exits (overbought stochastic crosses).
Added alerts for stochastic exit signals. Alerts are Pre-Set to only Alert on Bar Close.
The "Williams Vix Fix" is one of the most reliable indicators in history for finding market bottoms. The Vix Fix is simply a code from Larry Williams creating almost identical results for creating the same ability the Vix has to all assets.
The VIX has always been much better at signaling bottoms than tops. Simple reason is when market falls retail traders panic and increase volatility , and professionals come in and capitalize on the situation. At market tops there is no one panicking... just liquidity drying up.
The FE green triangles are "Filtered Entries".
The AE green triangles are "Aggressive Filtered Entries".
Added Alerts to Williams Vix Fix (Aggressive Entry and Filtered Entry). Alerts are Pre-Set to only Alert on Bar Close.
Added "Ehlrers StochCCI" indicator of user @glaz
The Ehlrers StochCCI is a variation of Ehlers Stochastic RSI replaced with CCI.
The John Ehlers' article in August, 2006, "Modeling The Market = Building Trading Strategies," describes a process for extracting trend and cyclic elements from market data, then recombining them for trading purposes. He used the Stochastic RSI denoted the cyclic elements.
Added ability to show Dots when StochCCI Crosses.
Sell: fuchsia dots.
Buy: green dots.
Added alerts for (Buy / Sell) StochCCI. Alerts are Pre-Set to only Alert on Bar Close.
DISCLAIMER: For educational and entertainment purposes only. Nothing in this content should be interpreted as financial advice or a recommendation to buy or sell any sort of security or investment including all types of crypto. DYOR, TYOB.

Indicators Combination Framework v3 IND [DTU]Hello All,
This script is a framework to analyze and see the results by combine selected indicators for (long, short, longexit, shortexit) conditions.
I was designed this for beginners and users to facilitate to see effects of the technical indicators combinations on the chart WITH NO CODE
You can improve your strategies according the results of this system by connecting the framework to a strategy framework/template such as Pinecoder, Benson, daveatt or custom.
This is enhanced version of my previous indicator "Indicators & Conditions Test Framework "
Currently there are 93 indicators (23 newly added) connected over library. You can also import an External Indicator or add Custom indicator (In the source)
It is possible to change it from Indicator to strategy (simple one) by just remarking strategy parts in the source code and see real time profit of your combinations
Feel free to change or use it in your source
Special thanks goes to Pine wizards: Trading view (built-in Indicators), @Rodrigo, @midtownsk8rguy, @Lazybear, @Daveatt and others for their open source codes and contributions
SIMPLE USAGE
1. SETTING: Show Alerts= True (To see your entries and Exists)
2. Define your Indicators (ex: INDICATOR1: ema(close,14), INDICATOR2: ema(close,21), INDICATOR3: ema(close,200)
3. Define Your Combinations for long & Short Conditions
a. For Long: (INDICATOR1 crossover INDICATOR2) AND (INDICATOR3 < close)
b. For Short: (INDICATOR1 crossunder INDICATOR2) AND (INDICATOR3 > close)
4. Select Strategy/template (Import strategy to chart) that you export your signals from the list
5. Analyze the best profit by changing Indicators values
SOME INDICATORS DETAILS
Each Indicator includes:
- Factorization : Converting the selected indicator to Double, triple Quadruple such as EMA to DEMA, TEMA QEMA
- Log : Simple or log10 can be used for calculation on function entries
- Plot Type : You can overlay the indicator on the chart (such ema) or you can use stochastic/Percentrank approach to display in the variable hlines range
- Extended Parametes : You can use default parameters or you can use extended (P1,P2) parameters regarding to indicator type and your choice
- Color : You can define indicator color and line properties
- Smooth : you can enable swma smooth
- indicators : you can select one of the 93 function like ema(),rsi().. to define your indicator
- Source : you can select from already defined indicators (IND1-4), External Indicator (EXT), Custom Indicator (CUST), and other sources (close, open...)
CONDITION DETAILS
- There are are 4 type of conditions, long entry, short entry, long exit, short exit.
- Each condition are built up from 4 combinations that joined with "AND" & "OR" operators
- You can see the results by enabling show alerts check box
- If you only wants to enter long entry and long exit, just fill these conditions
- If "close on opposite" checkbox selected on settings, long entry will be closed on short entry and vice versa
COMBINATIONS DETAILS
- There are 4 combinations that joined with "AND" & "OR" operators for each condition
- combinations are built up from compare 1st entry with 2nd one by using operator
- 1st and 2nd entries includes already defined indicators (IND1-5), External Indicator (EXT), Custom Indicator (CUST), and other sources (close, open...)
- Operators are comparison values such as >,<, crossover,...
- 2nd entry include "VALUE" parameter that will use to compare 1st indicator with value area
- If 2nd indicator selected different than "VALUE", value are will mean previous value of the selection. (ex: value area= 2, 2nd entry=close, means close )
- Selecting "NONE" for the 1st entry will disable calculation of current and following combinations
JOINS DETAILS
- Each combination will join wiht the following one with the JOIN (AND, OR) operator (if the following one is not equal "NONE")
CUSTOM INDICATOR
- Custom Indicator defines harcoded in the source code.
- You can call it with "CUST" in the Indicator definition source or combination entries source
- You can change or implement your custom indicator by updating the source code
EXTERNAL INDICATOR
- You can import an external indicator by selecting it from the ext source.
- External Indicator should be already imported to the chart and it have an plot function to output its signal
EXPORTING SIGNAL
- You can export your result to an already defined strategy template such as Pine coders, Benson, Daveatt Strategy templates
- Or you can define your custom export for other future strategy templates
ALERTS
- By enabling show alerts checkbox, you can see long entry exits on the bottom, and short entry exits aon the top of the chart
ADDITIONAL INFO
- You can see all off the inputs descriptions in the tooltips. (You can also see the previous version for details)
- Availability to set start, end dates
- Minimize repainting by using security function options (Secure, Semi Secure, Repaint)
- Availability of use timeframes
-
Version 3 INDICATORS LIST (More to be added):
▼▼▼ OVERLAY INDICATORS ▼▼▼
alma(src,len,offset=0.85,sigma=6).-------Arnaud Legoux Moving Average
ama(src,len,fast=14,slow=100).-----------Adjusted Moving Average
accdist().-------------------------------Accumulation/distribution index.
cma(src,len).----------------------------Corrective Moving average
dema(src,len).---------------------------Double EMA (Same as EMA with 2 factor)
ema(src,len).----------------------------Exponential Moving Average
gmma(src,len).---------------------------Geometric Mean Moving Average
highest(src,len).------------------------Highest value for a given number of bars back.
hl2ma(src,len).--------------------------higest lowest moving average
hma(src,len).----------------------------Hull Moving Average.
lagAdapt(src,len,perclen=5,fperc=50).----Ehlers Adaptive Laguerre filter
lagAdaptV(src,len,perclen=5,fperc=50).---Ehlers Adaptive Laguerre filter variation
laguerre(src,len).-----------------------Ehlers Laguerre filter
lesrcp(src,len).-------------------------lowest exponential esrcpanding moving line
lexp(src,len).---------------------------lowest exponential expanding moving line
linreg(src,len,loffset=1).---------------Linear regression
lowest(src,len).-------------------------Lovest value for a given number of bars back.
mcginley(src, len.-----------------------McGinley Dynamic adjusts for market speed shifts, which sets it apart from other moving averages, in addition to providing clear moving average lines
percntl(src,len).------------------------percentile nearest rank. Calculates percentile using method of Nearest Rank.
percntli(src,len).-----------------------percentile linear interpolation. Calculates percentile using method of linear interpolation between the two nearest ranks.
previous(src,len).-----------------------Previous n (len) value of the source
pivothigh(src,BarsLeft=len,BarsRight=2).-Previous pivot high. src=src, BarsLeft=len, BarsRight=p1=2
pivotlow(src,BarsLeft=len,BarsRight=2).--Previous pivot low. src=src, BarsLeft=len, BarsRight=p1=2
rema(src,len).---------------------------Range EMA (REMA)
rma(src,len).----------------------------Moving average used in RSI. It is the exponentially weighted moving average with alpha = 1 / length.
sar(start=len, inc=0.02, max=0.02).------Parabolic SAR (parabolic stop and reverse) is a method to find potential reversals in the market price direction of traded goods.start=len, inc=p1, max=p2. ex: sar(0.02, 0.02, 0.02)
sma(src,len).----------------------------Smoothed Moving Average
smma(src,len).---------------------------Smoothed Moving Average
super2(src,len).-------------------------Ehlers super smoother, 2 pole
super3(src,len).-------------------------Ehlers super smoother, 3 pole
supertrend(src,len,period=3).------------Supertrend indicator
swma(src,len).---------------------------Sine-Weighted Moving Average
tema(src,len).---------------------------Triple EMA (Same as EMA with 3 factor)
tma(src,len).----------------------------Triangular Moving Average
vida(src,len).---------------------------Variable Index Dynamic Average
vwma(src,len).---------------------------Volume Weigted Moving Average
volstop(src,len,atrfactor=2).------------Volatility Stop is a technical indicator that is used by traders to help place effective stop-losses. atrfactor=p1
wma(src,len).----------------------------Weigted Moving Average
vwap(src_).------------------------------Volume Weighted Average Price (VWAP) is used to measure the average price weighted by volume
▼▼▼ NON OVERLAY INDICATORS ▼▼
adx(dilen=len, adxlen=14, adxtype=0).----adx. The Average Directional Index (ADX) is a used to determine the strength of a trend. len=>dilen, p1=adxlen (default=14), p2=adxtype 0:ADX, 1:+DI, 2:-DI (def:0)
angle(src,len).--------------------------angle of the series (Use its Input as another indicator output)
aroon(len,dir=0).------------------------aroon indicator. Aroons major function is to identify new trends as they happen.p1 = dir: 0=mid (default), 1=upper, 2=lower
atr(src,len).----------------------------average true range. RMA of true range.
awesome(fast=len=5,slow=34,type=0).------Awesome Oscilator is an indicator used to measure market momentum. defaults : fast=len= 5, p1=slow=34, p2=type: 0=Awesome, 1=difference
bbr(src,len,mult=1).---------------------bollinger %%
bbw(src,len,mult=2).---------------------Bollinger Bands Width. The Bollinger Band Width is the difference between the upper and the lower Bollinger Bands divided by the middle band.
cci(src,len).----------------------------commodity channel index
cctbbo(src,len).-------------------------CCT Bollinger Band Oscilator
change(src,len).-------------------------A.K.A. Momentum. Difference between current value and previous, source - source . is most commonly referred to as a rate and measures the acceleration of the price and/or volume of a security
cmf(len=20).-----------------------------Chaikin Money Flow Indicator used to measure Money Flow Volume over a set period of time. Default use is len=20
cmo(src,len).----------------------------Chande Momentum Oscillator. Calculates the difference between the sum of recent gains and the sum of recent losses and then divides the result by the sum of all price movement over the same period.
cog(src,len).----------------------------The cog (center of gravity) is an indicator based on statistics and the Fibonacci golden ratio.
copcurve(src,len).-----------------------Coppock Curve. was originally developed by Edwin Sedge Coppock (Barrons Magazine, October 1962).
correl(src,len).-------------------------Correlation coefficient. Describes the degree to which two series tend to deviate from their ta.sma values.
count(src,len).--------------------------green avg - red avg
cti(src,len).----------------------------Ehler s Correlation Trend Indicator by
dev(src,len).----------------------------ta.dev() Measure of difference between the series and its ta.sma
dpo(len).--------------------------------Detrended Price OScilator is used to remove trend from price.
efi(len).--------------------------------Elders Force Index (EFI) measures the power behind a price movement using price and volume.
eom(len=14,div=10000).-------------------Ease of Movement.It is designed to measure the relationship between price and volume.p1 = div: 10000= (default)
falling(src,len).------------------------ta.falling() Test if the `source` series is now falling for `length` bars long. (Use its Input as another indicator output)
fisher(len).-----------------------------Fisher Transform is a technical indicator that converts price to Gaussian normal distribution and signals when prices move significantly by referencing recent price data
histvol(len).----------------------------Historical volatility is a statistical measure used to analyze the general dispersion of security or market index returns for a specified period of time.
kcr(src,len,mult=2).---------------------Keltner Channels Range
kcw(src,len,mult=2).---------------------ta.kcw(). Keltner Channels Width. The Keltner Channels Width is the difference between the upper and the lower Keltner Channels divided by the middle channel.
klinger(type=len).-----------------------Klinger oscillator aims to identify money flow’s long-term trend. type=len: 0:Oscilator 1:signal
macd(src,len).---------------------------MACD (Moving Average Convergence/Divergence)
mfi(src,len).----------------------------Money Flow Index s a tool used for measuring buying and selling pressure
msi(len=10).-----------------------------Mass Index (def=10) is used to examine the differences between high and low stock prices over a specific period of time
nvi().-----------------------------------Negative Volume Index
obv().-----------------------------------On Balance Volume
pvi().-----------------------------------Positive Volume Index
pvt().-----------------------------------Price Volume Trend
ranges(src,upper=len, lower=-5).---------ranges of the source. src=src, upper=len, v1:lower=upper . returns: -1 source=upper otherwise 0
rising(src,len).-------------------------ta.rising() Test if the `source` series is now rising for `length` bars long. (Use its Input as another indicator output)
roc(src,len).----------------------------Rate of Change
rsi(src,len).----------------------------Relative strength Index
rvi(src,len).----------------------------The Relative Volatility Index (RVI) is calculated much like the RSI, although it uses high and low price standard deviation instead of the RSI’s method of absolute change in price.
smi_osc(src,len,fast=5, slow=34).--------smi Oscillator
smi_sig(src,len,fast=5, slow=34).--------smi Signal
stc(src,len,fast=23,slow=50).------------Schaff Trend Cycle (STC) detects up and down trends long before the MACD. Code imported from
stdev(src,len).--------------------------Standart deviation
trix(src,len) .--------------------------the rate of change of a triple exponentially smoothed moving average.
tsi(src,len).----------------------------The True Strength Index indicator is a momentum oscillator designed to detect, confirm or visualize the strength of a trend.
ultimateOsc(len.-------------------------Ultimate Oscillator indicator (UO) indicator is a technical analysis tool used to measure momentum across three varying timeframes
variance(src,len).-----------------------ta.variance(). Variance is the expectation of the squared deviation of a series from its mean (ta.sma), and it informally measures how far a set of numbers are spread out from their mean.
willprc(src,len).------------------------Williams %R
wad().-----------------------------------Williams Accumulation/Distribution.
wvad().----------------------------------Williams Variable Accumulation/Distribution.
HISTORY
v3.01
ADD: 23 new indicators added to indicators list from the library. Current Total number of Indicators are 93. (to be continued to adding)
ADD: 2 more Parameters (P1,P2) for indicator calculation added. Par:(Use Defaults) uses only indicator(Source, Length) with library's default parameters. Par:(Use Extra Parameters P1,P2) use indicator(Source,Length,p1,p2) with additional parameters if indicator needs.
ADD: log calculation (simple, log10) option added on indicator function entries
ADD: New Output Signals added for compatibility on exporting condition signals to different Strategy templates.
ADD: Alerts Added according to conditions results
UPD: Indicator source inputs now display with indicators descriptions
UPD: Most off the source code rearranged and some functions moved to the new library. Now system work like a little bit frontend/backend
UPD: Performance improvement made on factorization and other source code
UPD: Input GUI rearranged
UPD: Tooltips corrected
REM: Extended indicators removed
UPD: IND1-IND4 added to indicator data source. Now it is possible to create new indicators with the previously defined indicators value. ex: IND1=ema(close,14) and IND2=rsi(IND1,20) means IND2=rsi(ema(close,14),20)
UPD: Custom Indicator (CUST) added to indicator data source and Combination Indicator source.
UPD: Volume added to indicator data source and Combination Indicator source.
REM: Custom indicators removed and only one custom indicator left
REM: Plot Type "Org. Range (-1,1)" removed
UPD: angle, rising, falling type operators moved to indicator library

Indicator Functions with Factor and HeikinAshiHello all,
This indicator returns below selected indicators values with entered parameters.
Also you can add factorization, functions candles, function HeikinAshi and more to the plot.
VERSION:
Version 1: returns series only source and Length with already defined default values
Version 2: returns series with source, Length, p1 and p2 parameters according to the indicator definition (ex: )
PARAMETERS p1 p2
for defining multi arguments (See indicators list) indicator input value usable with verison=V2 selected.. ex: for alma( src , len ,offset=0.85,sigma=6), set source=source, len=length, p1=0.85 an p2=6
FACTOR:
Add double triple, Quadruple factors to selected indicator (like converting EMA to 2-DEMA, 3-TEMA, 4-QEMA...)
1-Original
2-Double
3-Triple
4-Quadruple
LOG
Log: Use log, log10 on function entries
PLOTTING:
PType: Plotting type of the function on the screen
Original :use original values
Org. Range (-1,1): usable for indicators between range -1 and 1
Stochastic: Convert indicator values by using stochastic calculation between -1 & 1. (use AT/% length to better view)
PercentRank: Convert indicator values by using Percent Rank calculation between -1 & 1. (use AT/% length to better view)
ST/%: length for plotting Type for stochastic and Percent Rank options
Smooth: Use SWMA for smoothing the function
DISPLAY TYPES
Plot Candles: Display the selected indicator as candle by implementing values
Plot Ind: Display result of indicator with selected source
HeikinAshi: Display Selected indicator candles with Heikin Ashi calculation
INDICATOR LIST:
hide = 'DONT DISPLAY', //Dont display & calculate the indicator. (For my framework usage)
alma = 'alma( src , len ,offset=0.85,sigma=6)', // Arnaud Legoux Moving Average
ama = 'ama( src , len ,fast=14,slow=100)', //Adjusted Moving Average
acdst = 'accdist()', // Accumulation/distribution index.
cma = 'cma( src , len )', //Corrective Moving average
dema = 'dema( src , len )', // Double EMA (Same as EMA with 2 factor)
ema = 'ema( src , len )', // Exponential Moving Average
gmma = 'gmma( src , len )', //Geometric Mean Moving Average
hghst = 'highest( src , len )', //Highest value for a given number of bars back.
hl2ma = 'hl2ma( src , len )', //higest lowest moving average
hma = 'hma( src , len )', // Hull Moving Average .
lgAdt = 'lagAdapt( src , len ,perclen=5,fperc=50)', //Ehler's Adaptive Laguerre filter
lgAdV = 'lagAdaptV( src , len ,perclen=5,fperc=50)', //Ehler's Adaptive Laguerre filter variation
lguer = 'laguerre( src , len )', //Ehler's Laguerre filter
lsrcp = 'lesrcp( src , len )', //lowest exponential esrcpanding moving line
lexp = 'lexp( src , len )', //lowest exponential expanding moving line
linrg = 'linreg( src , len ,loffset=1)', // Linear regression
lowst = 'lowest( src , len )', //Lovest value for a given number of bars back.
pcnl = 'percntl( src , len )', //percentile nearest rank. Calculates percentile using method of Nearest Rank.
pcnli = 'percntli( src , len )', //percentile linear interpolation. Calculates percentile using method of linear interpolation between the two nearest ranks.
rema = 'rema( src , len )', //Range EMA (REMA)
rma = 'rma( src , len )', //Moving average used in RSI . It is the exponentially weighted moving average with alpha = 1 / length.
sma = 'sma( src , len )', // Smoothed Moving Average
smma = 'smma( src , len )', // Smoothed Moving Average
supr2 = 'super2( src , len )', //Ehler's super smoother, 2 pole
supr3 = 'super3( src , len )', //Ehler's super smoother, 3 pole
strnd = 'supertrend( src , len ,period=3)', //Supertrend indicator
swma = 'swma( src , len )', //Sine-Weighted Moving Average
tema = 'tema( src , len )', // Triple EMA (Same as EMA with 3 factor)
tma = 'tma( src , len )', //Triangular Moving Average
vida = 'vida( src , len )', // Variable Index Dynamic Average
vwma = 'vwma( src , len )', // Volume Weigted Moving Average
wma = 'wma( src , len )', //Weigted Moving Average
angle = 'angle( src , len )', //angle of the series (Use its Input as another indicator output)
atr = 'atr( src , len )', // average true range . RMA of true range.
bbr = 'bbr( src , len ,mult=1)', // bollinger %%
bbw = 'bbw( src , len ,mult=2)', // Bollinger Bands Width . The Bollinger Band Width is the difference between the upper and the lower Bollinger Bands divided by the middle band.
cci = 'cci( src , len )', // commodity channel index
cctbb = 'cctbbo( src , len )', // CCT Bollinger Band Oscilator
chng = 'change( src , len )', //Difference between current value and previous, source - source.
cmo = 'cmo( src , len )', // Chande Momentum Oscillator . Calculates the difference between the sum of recent gains and the sum of recent losses and then divides the result by the sum of all price movement over the same period.
cog = 'cog( src , len )', //The cog (center of gravity ) is an indicator based on statistics and the Fibonacci golden ratio.
cpcrv = 'copcurve( src , len )', // Coppock Curve. was originally developed by Edwin "Sedge" Coppock (Barron's Magazine, October 1962).
corrl = 'correl( src , len )', // Correlation coefficient . Describes the degree to which two series tend to deviate from their ta. sma values.
count = 'count( src , len )', //green avg - red avg
dev = 'dev( src , len )', //ta.dev() Measure of difference between the series and it's ta. sma
fall = 'falling( src , len )', //ta.falling() Test if the `source` series is now falling for `length` bars long. (Use its Input as another indicator output)
kcr = 'kcr( src , len ,mult=2)', // Keltner Channels Range
kcw = 'kcw( src , len ,mult=2)', //ta.kcw(). Keltner Channels Width. The Keltner Channels Width is the difference between the upper and the lower Keltner Channels divided by the middle channel.
macd = 'macd( src , len )', // macd
mfi = 'mfi( src , len )', // Money Flow Index
nvi = 'nvi()', // Negative Volume Index
obv = 'obv()', // On Balance Volume
pvi = 'pvi()', // Positive Volume Index
pvt = 'pvt()', // Price Volume Trend
rise = 'rising( src , len )', //ta.rising() Test if the `source` series is now rising for `length` bars long. (Use its Input as another indicator output)
roc = 'roc( src , len )', // Rate of Change
rsi = 'rsi( src , len )', // Relative strength Index
smosc = 'smi_osc( src , len ,fast=5, slow=34)', //smi Oscillator
smsig = 'smi_sig( src , len ,fast=5, slow=34)', //smi Signal
stdev = 'stdev( src , len )', //Standart deviation
trix = 'trix( src , len )' , //the rate of change of a triple exponentially smoothed moving average .
tsi = 'tsi( src , len )', //True Strength Index
vari = 'variance( src , len )', //ta.variance(). Variance is the expectation of the squared deviation of a series from its mean (ta. sma ), and it informally measures how far a set of numbers are spread out from their mean.
wilpc = 'willprc( src , len )', // Williams %R
wad = 'wad()', // Williams Accumulation/Distribution .
wvad = 'wvad()' //Williams Variable Accumulation/Distribution
I will update the indicator list when I will update the library
Thanks to tradingview, @RodrigoKazuma for their open source indicators

MACD PlusMoving Average Convergence Divergence – MACD
The MACD is an extremely popular indicator used in technical analysis. It can be used to identify aspects of a security's overall trend. Most notably these aspects are momentum, as well as trend direction and duration. What makes the MACD so informative is that it is actually the combination of two different types of indicators. First, the MACD employs two Moving Averages of varying lengths (which are lagging indicators) to identify trend direction and duration. Then, it takes the difference in values between those two Moving Averages (MACD Line) and an EMA of those Moving Averages (Signal Line) and plots that difference between the two lines as a histogram which oscillates above and below a center Zero Line. The histogram is used as a good indication of a security's momentum.
Added Color Plots to Settings Pane.
Switched MTF Logic to turn ON/OFF automatically w/ TradingView's Built in Feature.
Added Ability to Turn ON/OFF Show MacD & Signal Line.
Added Ability to Turn ON/OFF Show Histogram.
Added Ability to Change MACD Line Colors Based on Trend.
Added Ability to Highlight Price Bars Based on Trend.
Added Alerts to Settings Pane.
Customized Alerts to Show Symbol, TimeFrame, Closing Price, MACD Crosses Up & MACD Crosses Down Signals in Alert.
Alerts are Pre-Set to only Alert on Bar Close.
Added ability to show Dots when MACD Crosses.
Added Ability to Change Plot Widths in Settings Pane.
Added in Alert Feature where Cross Up if above 0 or cross down if below 0 (OFF By Default).
Squeeze Pro
Traditionally, John Carter's version uses 20 period SMAs as the basis lines on both the BB and the KC.
In this version, I've given the freedom to change this and try out different types of moving averages.
The original squeeze indicator had only one Squeeze setting, though this new one has three.
The gray dot Squeeze, call it a "low squeeze" or an "early squeeze" - this is the easiest Squeeze to form based on its settings.
The orange dot Squeeze is the original from the first Squeeze indicator.
And finally, the yellow dot squeeze, call it a "high squeeze" or "power squeeze" - is the most difficult to form and suggests price is under extreme levels of compression.
Colored Directional Movement Index (CDMI) , a custom interpretation of J. Welles Wilder’s Directional Movement Index (DMI), where :
DMI is a collection of three separate indicators ( ADX , +DI , -DI ) combined into one and measures the trend’s strength as well as its direction
CDMI is a custom interpretation of DMI which presents ( ADX , +DI , -DI ) with a color scale - representing the trend’s strength, color density - representing momentum/slope of the trend’s strength, and triangle up/down shapes - representing the trend’s direction. CDMI provides all the information in a single line with colored triangle shapes plotted on the bottom. DMI can provide quality information and even trading signals but it is not an easy indicator to master, whereus CDMI simplifies its usage. The CDMI adds additional insight of verifying/confirming the trend as well as its strength
Label :
Displaying the trend strength and direction
Displaying adx and di+/di- values
Displaying adx's momentum (growing or falling)
Where tooltip label describes "howto read colored dmi line"
Ability to display historical values of DMI readings displayed in the label.
Added "Expert Trend Locator - XTL"
The XTL was developed by Tom Joseph (in his book Applying Technical Analysis ) to identify major trends, similar to Elliott Wave 3 type swings.
Blue bars are bullish and indicate a potential upwards impulse.
Red bars are bearish and indicate a potential downwards impulse.
White bars indicate no trend is detected at the moment.
Added "Williams Vix Fix" signal. The Vix is one of the most reliable indicators in history for finding market bottoms. The Williams Vix Fix is simply a code from Larry Williams creating almost identical results for creating the same ability the Vix has to all assets.
The VIX has always been much better at signaling bottoms than tops. Simple reason is when market falls retail traders panic and increase volatility , and professionals come in and capitalize on the situation. At market tops there is no one panicking... just liquidity drying up.
The FE green triangles are "Filtered Entries"
The AE green triangles are "Aggressive Filtered Entries"

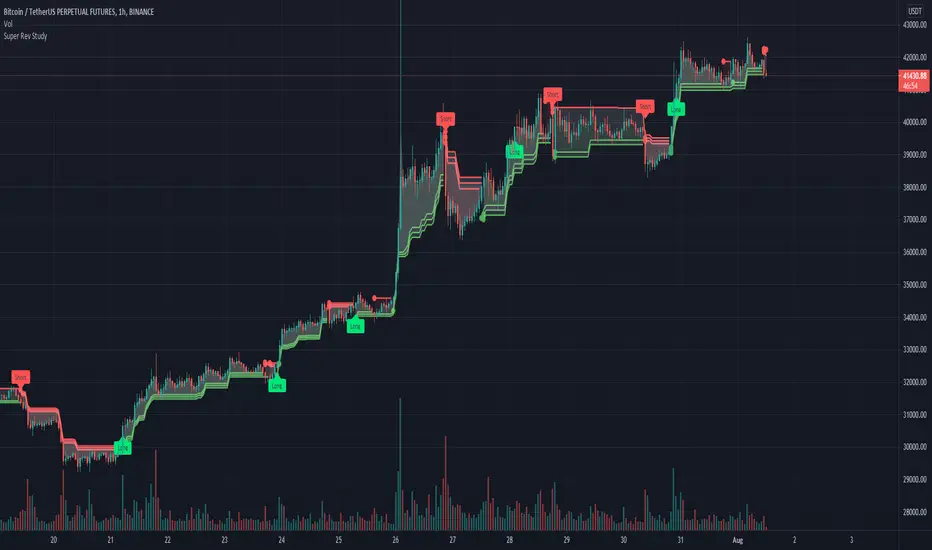
Super Rev StudyThe super Rev Study is a buy sell indicator that uses a combination of 3 super trend lines , EMA, Williams %R and the squeeze momentum indicator.
The super trend lines and ema are utilised to locate the trend.
The williams %R has been incorporated to determine overbought/oversold conditions.
The buy and sell flags are generated based on the following conditions:
The location of the price in relation to the super trend lines
if the price is above or below the EMA.
If the Williams %R is oversold/overbought
The squeeze momentum indicator can be added as a filter to only allows trade in certain conditions i.e bullish and above the 0 line or avoid trades if bearish and above the 0 line for example.
All the indicators involved can be customised to created a unique indicator
Created by manomanomano, Developed by @badshah_e_alam
Squeeze Momentum [Plus]The "Momentum" in this indicator is smoothed out using linear regression. The Momentum is what is displayed on the indicator as a histogram, its purpose is obvious (to show momentum).
What is a Squeeze? A squeeze occurs when Bollinger Bands tighten up enough to slip inside of Keltner Channels .
This is interpreted as price is compressing and building up energy before releasing it and making a big move.
Traditionally, John Carter's version uses 20 period SMAs as the basis lines on both the BB and the KC.
In this version, I've given the freedom to change this and try out different types of moving averages.
The original squeeze indicator had only one Squeeze setting, though this new one has three.
The gray dot Squeeze, call it a "low squeeze" or an "early squeeze" - this is the easiest Squeeze to form based on its settings.
The orange dot Squeeze is the original from the first Squeeze indicator.
And finally, the yellow dot squeeze, call it a "high squeeze" or "power squeeze" - is the most difficult to form and suggests price is under extreme levels of compression.
Now to explain the parameters:
Squeeze Input - This is just the source for the Squeeze to use, default value is closing price.
Length - This is the length of time used to calculate the Bollinger Bands and Keltner Channels .
Bollinger Bands Calculation Type - Selects the type of moving average used to create the Bollinger Bands .
Keltner Channel Calculation Type - Selects the type of moving average used to create the Keltner Channel.
Color Format - you to choose one of 5 different color schemes.
Draw Divergence - Self explanatory here, this will auto-draw divergence on the indicator.
Gray Background for Dark Mode - to make them more visually appealing.
Added ADX (Average Directional Index) that measure a trend’s strength. The higher the ADX value, the stronger the trend. The ADX line is white when it has a positive slope, otherwise it is gray. When the ADX has a very large dispersion with respect to the momentum histogram, increase the scale number.
Added "H (Hull Moving Average) Signal". Hull is a extremely responsive and smooth moving average created by Alan Hull in 2005. Have option to chose between 3 Hull variations.
Added "Williams Vix Fix" signal. The Vix is one of the most reliable indicators in history for finding market bottoms. The Williams Vix Fix is simply a code from Larry Williams creating almost identical results for creating the same ability the Vix has to all assets.
The VIX has always been much better at signaling bottoms than tops. Simple reason is when market falls retail traders panic and increase volatility, and professionals come in and capitalize on the situation. At market tops there is no one panicking... just liquidity drying up.
The FE green triangles are "Filtered Entries"
The AE green triangles are "Aggressive Filtered Entries"

Milan OscillatorBill Williams Breakout Setup
I have referred to the man multiple times whether tweeting about him or writing a blog post. Now I want to relearn how breakout trading works, again. A while ago, my friend invited a bunch of us into a Zoom conference sharing us how his setup works for him. He reintroduced me to Bill Williams' indicators which looked like below.
The rules are simple:
Prices are moving away from Alligator, open and closed above the first time.
AC is twice consecutively at par with the direction.
AO is twice consecutively at par with the direction.
Entry on the third candle to be sure, or the second if you're willing to risk it.
The chart above is an example from the 4 hourly time-frame. Before going into any entry, to get a macro perspective, should check on these time-frames first:
Weekly
3 Days
Daily
Bonus points if monthly time-frame is also at par with the bias. Here are the charts for the larger time-frame.
It's been profitable trading with the above setup but then I have an itch to scratch. I wanted to have just a single oscillator instead of two to look at. It will enable me to make decisions faster and can use my brain juice to think about something else.
So I combined the two to create a new oscillator. I call it the `Milan Oscillator` in honor of my friend Patris who reintroduced me to Bill Williams yet again. Patris' favorite team is AC Milan, here's to you bro 🍺
Here are the same charts above with Milan Oscillator.
The rules are a bit different than the rules above:
No entry when the oscillator is gray, this means AC and AO are disagreeing.
Prices are moving away from Alligator, open and closed above the first time.
Oscillator is twice consecutively at par with the direction.
Entry on the third candle to be sure, or the second if you're willing to risk it.
On lower volume moves, prices will retest alligator, can be an entry if the retest fails.
Feedbacks are appreciated.

AIMS Purple MagicThe Alligator is a Very Powerful Indicator
Some people think it's just 3 moving averages. But in reality, it is far more than that.
Read more about Alligator and Bill Williams
The Purple Magic Line has been derived from Bill Williams Alligator. Together the Alligator we call the AIMS Gator.
It is a smooth moving average based on the Chaos Red Line of the 5 times higher time frame.
Our Mantra: If you trade in line with the trend of the 5 times higher time frame, you will have a higher chance of catching breakouts in the direction of the trend.
So we have this rule, Always Trade when Price is Going Away from The Purple Line. Simple as that.
Buy Only: Price above the Purple Line
Sell Only: Price below the Purple Line.
What is The Alligator?
The Alligator Indicator was developed by Bill Williams and combines moving averages with fractal geometry.
The indicator helps traders to identify if the market is trending.
It consists of 3 lines: the blue line (aka the Alligator's Jaw),
the red Line (aka the Alligator's Teeth) and
the green Line (aka the Alligator's Lips).
Each has different lookback periods and offsets that can be set by the user.
The alligator is easy to use and can find trade setups, based on how close together or how far apart the lines are, resembling an alligator opening and closing his mouth. This indicator can be used in combination with other analysis techniques.
Based on calculations of Non-Linear mathematical formula we have arrived at a way to calculate the Trend of the 5 times higher time frame
The Purple Magic Indicates :
The Trend of Current and 5 times higher time frame
It helps prevent trading into Wave 4
It helps with counting Wave 3 and 4
You can use it to time early entry into Wave 5
The bounce of Purple after a wave 3 is often a 50% fib retracement.
Examples:
In the picture below you see an M5 chart and M1 chart.
On the left side, you see Alligator Red Line on the 5-minute chart
on the right side, you see The Purple Magic line. Which depicts the same price regions.
This is the Sweet Spot where we take trades.
In line with The Awesome oscillator if you time your entries based on a pullback towards the purple, it can be a system on its own. Nothing else required. But we have a better method.
When we put together, AIMS The Box, AIMS The Gator, and AIMS The Wave indicators, things work even smoother.
For more information visit the link below.

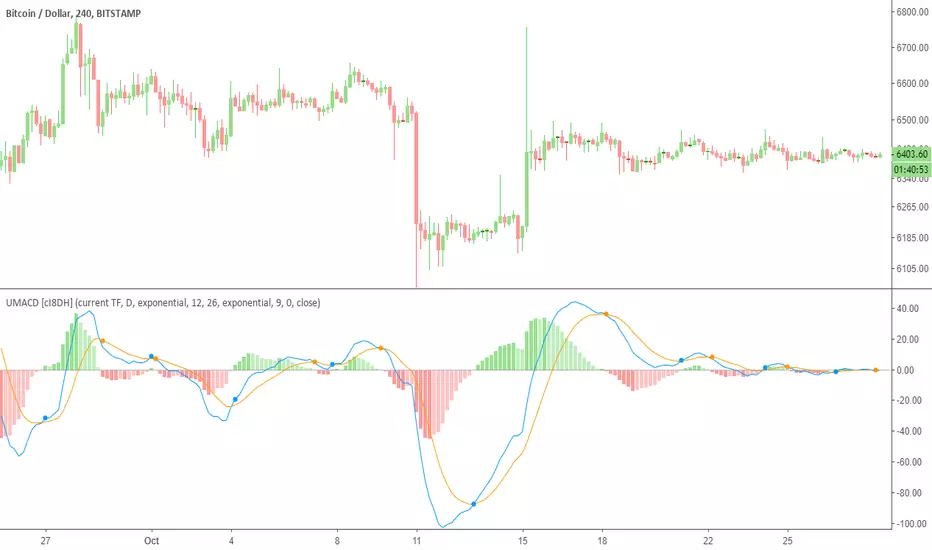
Ultimate MACD (UMACD) [cI8DH]Ultimate MACD ( UMACD ) includes True MACD fix, normalized MACD, multi time frame, bar coloring, and false cross avoidance options. It can also replicate Bill Williams Awesome Oscillator and Accelerator Oscillator. By default, this indicator is configured to work like the built-in MACD indicator. You need to customize it to your liking. Chart below shows example multi time frame setup.
True MACD and normalization
True MACD fix is similar to True RSI fix. The chart below proves that MACD is asymmetrical. This issue is most visible when analyzing charts across wide price ranges. It shows a logical problem in MACD, and most other indicators, as they can give you conflicting signals. For example, it can show long signal for both TRYUSD and its inverse pair USDTRY simultaneously. True MACD fixes this issue as shown in the chart below. Interestingly, this fix also normalizes MACD which is a major improvement upon regular MACD . (FYI, True MACD fix uses a different mechanism than my previous NMACD indicator.)
Avoiding false signals
This feature is very useful to avoid trading during sideways. To use this feature, set the std deviation multiplier option to a number greater than 1. I did some backtests on BTC chart with contract size set to 100% equity. It showed significant improvements for the time frames that I tested. (std deviation multiplier set to 1.5 @1h TF: 4x improvements, @2h: near 2x, 0.7 @4h: 2x, 0.4@12h: 3x, 0.4@daily: 1.5x). I also backtested True MACD fix separately and it showed significant improvement for most time frames.
Bar coloring
Bar coloring works similar to my previous indicators, Ultimate Money Flow and Ultimate RSI , and is subject to change in the future.
Bill Williams Awesome Oscillator and Accelerator Oscillator
Chart below both validates calculations in this indicator and also shows you how you can replicate Bill Williams AO indicators. You can apply all the features added to MACD to these indicators.
Here is a TL;DR list of my indicators to save you some time from looking at my obsolete indicators.
PS: I might publish the asymmetry fix as True MACD or as a general fix to all price-based indicators as an open source script in the future.
Fractal Levels Monitor w/ Trade Lines (ChadAnt) v2Small update. Prevents the break candle from getting another signal after the first buy/sell signal detected.
1. Fractal Level Detection
The indicator identifies Fractals, which are simply a series of bars where the center bar has the highest high (Bearish Fractal) or the lowest low (Bullish Fractal) compared to a set number of bars on either side (determined by the "Fractal Period" input, usually 2 to 5 bars).
Bullish Fractal Level (Support): The indicator plots a horizontal line at the lowest low of the most recently formed Bullish Fractal.
Bearish Fractal Level (Resistance): It plots a horizontal line at the highest high of the most recently formed Bearish Fractal.
2. The "Cross Candle" Event
The core idea isn't to trade the fractal itself, but the reaction after the fractal level is broken.
When the price breaks and closes through the established Bullish Level (support) or Bearish Level (resistance), that bar is marked as the Cross Candle.
This Cross Candle's High and Low are saved. This is the "setup" for the trade.
3. The Trade Signal (Entry Trigger)
A trade is only taken when the price breaks the extreme (High or Low) of the Cross Candle.
Buy Signal: The trade is entered long if the price breaks above the High of the Cross Candle.
Sell Signal: The trade is entered short if the price breaks below the Low of the Cross Candle.

Fractal Levels Monitor w/ Trade Lines (ChadAnt)1. Fractal Level Detection
The indicator identifies Fractals, which are simply a series of bars where the center bar has the highest high (Bearish Fractal) or the lowest low (Bullish Fractal) compared to a set number of bars on either side (determined by the "Fractal Period" input, usually 2 to 5 bars).
Bullish Fractal Level (Support): The indicator plots a horizontal line at the lowest low of the most recently formed Bullish Fractal.
Bearish Fractal Level (Resistance): It plots a horizontal line at the highest high of the most recently formed Bearish Fractal.
2. The "Cross Candle" Event
The core idea isn't to trade the fractal itself, but the reaction after the fractal level is broken.
When the price breaks and closes through the established Bullish Level (support) or Bearish Level (resistance), that bar is marked as the Cross Candle.
This Cross Candle's High and Low are saved. This is the "setup" for the trade.
3. The Trade Signal (Entry Trigger)
A trade is only taken when the price breaks the extreme (High or Low) of the Cross Candle.
Buy Signal: The trade is entered long if the price breaks above the High of the Cross Candle.
Sell Signal: The trade is entered short if the price breaks below the Low of the Cross Candle.


Volume Spread Analysis — Educational (VSA Study)Volume Spread Analysis — Educational (VSA Study)
Overview
This study is an educational tool built around classic Volume Spread Analysis (VSA), the methodology introduced by Tom Williams.
VSA looks at the relationship between volume, price spread, and closing position to highlight potential supply and demand imbalances.
The script is designed for learning and visual study, not for trade signals. It highlights well-known VSA events directly on the chart and adds reference lines and a colored moving average to help contextualize strength and weakness.
What It Shows
Major VSA Events: Stopping Volume (SV), Selling Climax (SC), Shakeout (SO), No Supply (NS), No Demand (ND), Buying Climax (BC), Upthrust (UT), Supply Coming In (SCI), End of Rising Market (EoRM), and Test Bars.
Trigger Lines: When a strong VSA bar appears, the script draws horizontal levels at the bar’s high and low. These act as educational “zones” where future price reactions can be studied.
Context Moving Average: A dotted MA changes color with price context (black or green when strength is confirmed, red when weakness dominates).
How It Works
Each event is identified using a blend of conditions:
Volume vs. its average
Spread vs. its average
Close location within the bar
Wick analysis (upper/lower shadows)
Short-term trend filters (5- and 10-period SMAs)
By combining these elements, the script maps chart activity to classical VSA definitions.
How to Study With It
Signs of Strength
Look for SC, SV, or SO bars.
Wait until price trades above the blue trigger line drawn from those bars.
Watch for a No Supply (NS) test bar in that zone.
Confirmation comes when the immediate next bar closes up and strong, with higher volume than the prior two bars.
The dotted MA should shift to black or green, showing supportive background strength.
Signs of Weakness
Watch for Supply Coming In, BC, or UT events.
Wait until price trades below the red trigger line.
Look for a No Demand (ND) bar in that area.
Confirmation comes when the following bar closes down and weak, with higher volume than the prior two bars.
The dotted MA should be red, reinforcing weakness.
Originality
This script was written from scratch with a focus on education and clarity. While VSA concepts themselves are public domain, the implementation here is unique:
It combines event detection, trigger zones, and a contextual MA in one framework.
It avoids acting as a trading system and instead provides a practical study workflow that traders can follow step by step.
Disclaimer
This indicator is for educational purposes only.
It does not generate buy or sell signals and should not be used as financial advice.
Trading involves risk; always perform your own analysis and risk management.

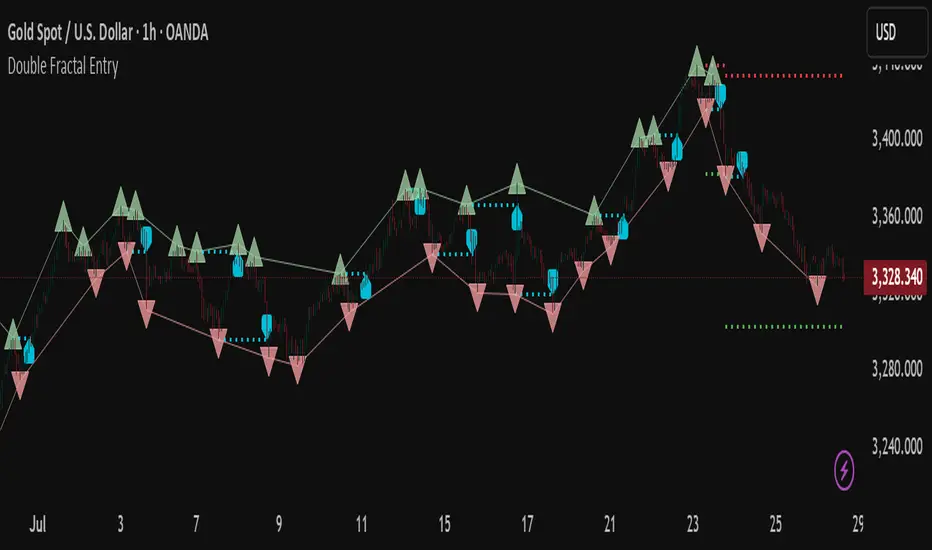
Double Fractal Entry📘 Double Fractal Entry – Original Structure-Based Entry System
Double Fractal Entry is a proprietary indicator that uses dynamic fractal structure to generate actionable buy/sell signals, with automatic Stop-Loss and Take-Profit placement. Unlike classic fractal tools or ZigZag-based visuals, this script constructs real-time structural channels from price extremes and offers precise entry points based on breakout or rejection behavior.
It is designed for traders who want a clear, structured approach to trading price action — without repainting, lagging indicators, or built-in oscillators.
🧠 Core Logic
This script combines three custom-built modules:
1. Fractal Detection and Channel Construction
- Fractals are detected using a configurable number of left/right bars (sensitivity).
- Confirmed upper/lower fractals are connected into two continuous channels.
- These channels represent real-time structure zones that evolve with price.
2. Entry Signal Logic
You can choose between two signal types:
- Breakout Mode – Triggers when price breaks above the upper fractal structure (for buys) or below the lower one (for sells).
- Rebound Mode – Triggers when price approaches a fractal channel and then rejects it (forms a reversal setup).
Each signal includes:
- Entry arrow on the chart
- Horizontal entry line
- Stop-Loss and Take-Profit lines
3. SL/TP Calculation
Unlike tools that use ATR or fixed values, SL and TP are dynamically set using the fractal range — the distance between the most recent upper and lower fractals. This makes the risk model adaptive to market volatility and structure.
📊 Visuals on the Chart
- 🔺 Green/Red triangle markers = confirmed fractals
- 📈 Lime/Red channel lines = evolving upper/lower structure
- 🔵 Blue arrow = signal direction (buy/sell)
- 📉 SL/TP lines = dynamically drawn based on fractal spacing
- 🔁 Signal history = optional, toggleable for backtesting
⚙️ Settings and Customization
- Fractal sensitivity (bars left/right)
- Entry mode: Breakout or Rebound
- SL and TP multiplier (based on fractal range)
- Visibility settings (signal history, lines, colors, etc.)
💡 What Makes It Unique
This is not just a variation of standard fractals or a ZigZag wrapper.
Double Fractal Entry was built entirely from scratch and includes:
- ✅ A dual-channel system that shows the live market structure
- ✅ Entry signals based on price behavior around key zones
- ✅ Volatility-adaptive SL/TP levels for realistic trade management
- ✅ Clean, non-repainting logic for both manual and automated use
The goal is to simplify structure trading and provide precise, repeatable entries in any market condition.
🧪 Use Cases
- Breakout mode – Ideal for trend continuation and momentum entries
- Rebound mode – Great for reversals, pullbacks, and range-bound markets
- Can be used standalone or combined with volume/trend filters
⚠️ Disclaimer
This tool is intended for technical analysis and educational use. It does not predict future market direction and should be used with proper risk management and strategy confirmation.

Double Fractal Entry📘 Double Fractal Entry – Original Structure-Based Entry System
Double Fractal Entry is a proprietary indicator that uses dynamic fractal structure to generate actionable buy/sell signals, with automatic Stop-Loss and Take-Profit placement. Unlike classic fractal tools or ZigZag-based visuals, this script constructs real-time structural channels from price extremes and offers precise entry points based on breakout or rejection behavior.
It is designed for traders who want a clear, structured approach to trading price action — without repainting, lagging indicators, or built-in oscillators.
🧠 Core Logic
This script combines three custom-built modules:
1. Fractal Detection and Channel Construction
- Fractals are detected using a configurable number of left/right bars (sensitivity).
- Confirmed upper/lower fractals are connected into two continuous channels.
- These channels represent real-time structure zones that evolve with price.
2. Entry Signal Logic
You can choose between two signal types:
- Breakout Mode – Triggers when price breaks above the upper fractal structure (for buys) or below the lower one (for sells).
- Rebound Mode – Triggers when price approaches a fractal channel and then rejects it (forms a reversal setup).
Each signal includes:
- Entry arrow on the chart
- Horizontal entry line
- Stop-Loss and Take-Profit lines
3. SL/TP Calculation
Unlike tools that use ATR or fixed values, SL and TP are dynamically set using the fractal range — the distance between the most recent upper and lower fractals. This makes the risk model adaptive to market volatility and structure.
📊 Visuals on the Chart
- 🔺 Green/Red triangle markers = confirmed fractals
- 📈 Lime/Red channel lines = evolving upper/lower structure
- 🔵 Blue arrow = signal direction (buy/sell)
- 📉 SL/TP lines = dynamically drawn based on fractal spacing
- 🔁 Signal history = optional, toggleable for backtesting
⚙️ Settings and Customization
- Fractal sensitivity (bars left/right)
- Entry mode: Breakout or Rebound
- SL and TP multiplier (based on fractal range)
- Visibility settings (signal history, lines, colors, etc.)
💡 What Makes It Unique
This is not just a variation of standard fractals or a ZigZag wrapper.
Double Fractal Entry was built entirely from scratch and includes:
- ✅ A dual-channel system that shows the live market structure
- ✅ Entry signals based on price behavior around key zones
- ✅ Volatility-adaptive SL/TP levels for realistic trade management
- ✅ Clean, non-repainting logic for both manual and automated use
The goal is to simplify structure trading and provide precise, repeatable entries in any market condition.
🧪 Use Cases
- Breakout mode – Ideal for trend continuation and momentum entries
- Rebound mode – Great for reversals, pullbacks, and range-bound markets
- Can be used standalone or combined with volume/trend filters
🔒 Invite-Only Notice
This is an invite-only script with a fully closed source.
All logic is original and developed by the author. It does not use or copy public open-source scripts, built-in indicators (RSI, MA, etc.), or repainting tricks. The entire entry and risk system is based on custom structural logic built from real-time price action.
⚠️ Disclaimer
This tool is intended for technical analysis and educational use. It does not predict future market direction and should be used with proper risk management and strategy confirmation.
Current Fractal High/Low (Dynamic)
This indicator dynamically tracks the most recent confirmed Fractal High and Fractal Low across any timeframe using custom left/right bar configurations.
🔍 Key Features:
Detects Fractal Highs and Lows based on user-defined pivot settings.
Draws a green line and label ("FH") at the most recent Fractal High.
Draws a red line and label ("FL") at the most recent Fractal Low.
All lines extend from the confirmation bar to the current candle.
Automatically removes old lines and labels for a clean, uncluttered chart.
🛠️ Customizable Inputs:
Left & Right bars for pivot sensitivity
Line width for visibility
📌 Use Cases:
Identifying structure shifts
Recognizing key swing points
Supporting liquidity and breakout strategies
💡 Fractals are confirmed only after the full formation of the pattern (left and right bars). This ensures reliability over reactivity.
This script is designed for intraday to swing traders who want a reliable way to visualize market turning points with minimal noise.

Trendfilter ChartIntroduction:
The "Trend Filter Chart" indicator is a comprehensive analytical tool designed to identify market trends through a combination of various technical analysis methods. This indicator utilizes multiple moving averages, power bars, and swing volatility to determine market direction and potential entry points. By combining these elements, the indicator aids in making informed trading decisions and interpreting market movements with greater precision.
The Trend Filter Chart uses several moving averages, including the 18-period and 52-period SMAs, as well as the 8-period SMA for lows and the 10-period SMA for highs. These moving averages are crucial for identifying trends and assisting in the definition of entry points.
A central feature of the indicator is the identification of power bars and ultra bars. These color-coded bars help visualize strong market movements characterized by significant changes in the weighted price range (high-low spread) and percentage price changes. Power bars and ultra bars indicate notable market activities that suggest the involvement of large market participants.
The variable Average Volatility and GSV middle line combines various volatility measures to create a comprehensive moving average. It is formed from the average of the short-term highs and lows, along with the average volatility calculated from the highest and lowest volatility values over the past days.
This calculation allows for capturing and visualizing the current trend in market volatility. This method provides an average trend line used to assess market direction.
Another important feature is the 5-over/Below-Channel signals, which indicate when five consecutive bars trade above or below the moving averages. These signals suggest potential trend continuations or reversals, providing valuable insights for trading decisions.
The integrated color signals support traders in identifying entry opportunities and evaluating market strength.
This indicator also identifies 10 different price patterns, including MA, correction patterns, and Inside/Outside Bar patterns and some others. These patterns are filtered through trend filters to provide potential entry setups. The underlying patterns are based on concepts by Larry Williams.
Depending on the pattern, they work differently in each market. Entry points, stop loss, and profit targets should be backtested in each market, as every market has its own characteristics.
For more information on how to use the patterns, please send me a message.
Disclaimer
The use of this indicator and the generated signals is at your own risk. The author assumes no responsibility for trading decisions made based on these signals. Please be aware that trading financial instruments involves risks.

Correct Fractal Swings by CRYPTOFORThis indicator adjusts and enhances the normal 3-fractal swing. The author of this definition, uncle_travis, takes into account swings with the absorption of 3 candles and uses them as structure points.

HTF Power of Three°Power of Three ( PO3 ) is one of the many concepts introduced by the Inner Circle Trader and inspired by Larry Williams.
The PO3 represents a three staged Smart Money campaign: Accumulation , Manipulation , and Distribution .
ICT traders assume that this pattern represents how any candle is built.
“This is applicable to every time measurement, as long as you have a beginning time, the highest value, the lowest value, and an ending in terms of measuring time.”
Consider the development of a Bullish Candle over Time:
– Candle Open (initial value price, prior to dynamic imbalance)
– Accumulation of longs around the opening price
– Manipulation where short liquidity is engineered and long liquidity is neutralized
– Range Expansion (dynamic price imbalance)
– Distribution pairing long exits with pending buy interest
– Candle Close (ending value price, post dynamic imbalance)
The same goes for the development of Bearish Candles, in reverse.
The HTF Power of Three° Indicator allows to monitor the selected Higher Timeframe Candle in real time:
– See where its Open, High, and Low are in the current lower resolution with high precision
– Know when it's supposed to Close by monitoring its own countdown (if below 1D)
– Note its Low to High range to gain a deeper understanding of LTF market profiles
– Study and backtest PO3 in Replay Mode with ease
– Trade PO3 with confidence without needing multiple layouts
This becomes very useful when studying, and especially using, PO3. One can use this as a tool to build narrative, as well as spotting important institutional levels.
You can also monitor more than one HTF PO3 at the time by stacking multiple instances of the indicator:
This works on any timeframe, even the seconds charts!
Note: if you select too high of a PO3 timeframe while on LTF you might receive an error due to TrandingView's data availability on that chart – this can also depend on your TradingView Plan.

Smaller Fractals (+ Transparency)Smaller Fractals (+ Transparency)
I find that fractals are super useful, but can visually clutter up the chart pretty quickly. Their opaqueness and just overall bigness can become a bit much.
As such, these are just like regular fractals, only smaller (pine script's`size.tiny` instead of the default `size.small`).
Also, you can set a transparency level to these little guys (default is 50%).
Simple, more polite, and hopefully more useful fractals for those wnting a cleaner looking chart. 😁

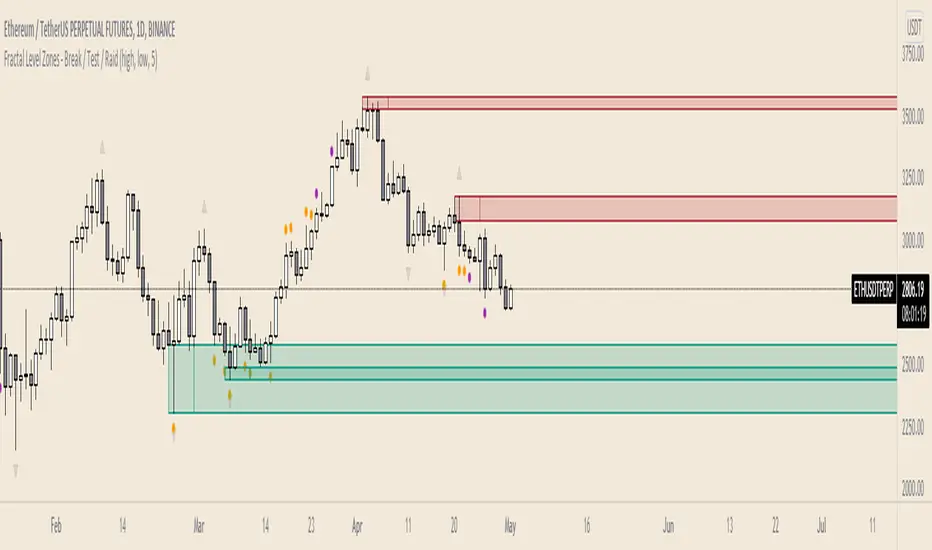
Fractal Level Zones - Break / Test / RaidFractal Level Zones - Break / Test / Raid
An experimental script that marks out the last two unbroken fractal high and low zones. The aim of the script is to focus on the type of candles that form and close in a zone. They can either tap into the zone or break them.
There are a number of outcomes:
- Break
- Break and retest
- Reversal
- Raid
When a zone is broken, the next untested fractal zone is printed.
How to use:
The indicator is to be used on higher time frames (M,W,D/4H). Monitor the type of candles that in form a zone (Daily TF recommended)
Default icon colours
Orange - Test of Zone
Purple - Break of fractal (can also be a raid)
Alert function included
Indicator in Use