Elliott Wave Full Fractal System v2.0Elliott Wave Full Fractal System v2.0 – Q.C. FINAL (Guaranteed R/R)
Elliott Wave Full Fractal System is a multi-timeframe wave engine that automatically labels Elliott impulses and ABC corrections, then builds a rule-based, ATR-driven risk/reward framework around the “W3–W4–W5” leg.
“Guaranteed R/R” here means every order is placed with a predefined stop-loss and take-profit that respect a minimum Reward:Risk ratio – it does not mean guaranteed profits.
Core Idea
This strategy turns a full fractal Elliott Wave labelling engine into a systematic trading model.
It scans fractal pivots on three wave degrees (Primary, Intermediate, Minor) to detect 5-wave impulses and ABC corrections.
A separate “Trading Degree” pivot stream, filtered by a 200-EMA trend filter and ATR-based dynamic pivots, is then used to find W4 pullback entries with a minimum, user-defined Reward:Risk ratio.
Default Properties & Risk Assumptions
The backtest uses realistic but conservative defaults:
// Default properties used for backtesting
strategy(
"Elliott Wave Full Fractal System - Q.C. FINAL (Guaranteed R/R)",
overlay = true,
initial_capital = 10000, // realistic account size
default_qty_type = strategy.percent_of_equity,
default_qty_value = 1, // 1% risk per trade
commission_type = strategy.commission.cash_per_contract,
commission_value = 0.005, // example stock commission
slippage = 0 // see notes below
)
Account size: 10,000 (can be changed to match your own account).
Position sizing: 1% of equity per trade to keep risk per idea sustainable and aligned with TradingView’s recommendations.
Commission: 0.005 cash per contract/share as a realistic example for stock trading.
Slippage: set to 0 in code for clarity of “pure logic” backtesting. Real-life trading will experience slippage, so users should adjust this according to their market and broker.
Always re-run the backtest after changing any of these values, and avoid using high risk fractions (5–10%+) as that is rarely sustainable.
1. Full Fractal Wave Engine
The script builds and maintains four pivot streams using ATR-adaptive fractals:
Primary Degree (Macro Trend):
Captures the large swings that define the major trend. Labels ①–⑤ and ⒶⒷⒸ using blue “Circle” labels and thicker lines.
Intermediate Degree (Trading Degree):
Captures the medium swings (swing-trading horizon). Uses teal labels ( (1)…(5), (A)(B)(C) ).
Minor Degree (Micro Structure):
Tracks short-term swings inside the larger waves. Uses red roman numerals (i…v, a b c).
ABC Corrections (Optional):
When enabled, the engine tries to detect standard A–B–C corrective structures that follow a completed 5-wave impulse and plots them with dashed lines.
Each degree uses a dynamic pivot lookback that expands when ATR is above its EMA, so the system naturally requires “stronger” pivots in volatile environments and reacts faster in quiet conditions.
2. Theory Rules & Strict Mode
Normal Mode: More permissive detection. Designed to show more wave structures for educational / exploratory use.
Strict Mode: Enforces key Elliott constraints:
Wave 3 not shorter than waves 1 and 5.
No invalid W4 overlap with W1 (for standard impulses).
ABC Logic: After a confirmed bullish impulse, the script expects a down-up-down corrective pattern (A,B,C). After a bearish impulse, it looks for up-down-up.
3. Trend Filter & Pivots
EMA Trend Filter: A configurable EMA (default 200) is used as a non-wave trend filter.
Price above EMA → Only long setups are considered.
Price below EMA → Only short setups are considered.
ATR-Adaptive Pivots: The pivot engine scales its left/right bars based on current ATR vs ATR EMA, making waves and trading pivots more robust in volatile regimes.
4. Dynamic Risk Management (Guaranteed R/R Engine)
The trading engine is designed around risk, not just pattern recognition:
ATR-Based Stop:
Stop-loss is placed at:
Entry ± ATR × Multiplier (user-configurable, default 2.0).
This anchors risk to current volatility.
Minimum Reward:Risk Ratio:
For each setup, the script:
Computes the distance from entry to stop (risk).
Projects a take-profit target at risk × min_rr_ratio away from entry.
Only accepts the setup if risk is positive and the required R:R ratio is achievable.
Result: Every order is created with both TP and SL at a predefined distance, so each trade starts with a known, minimum Reward:Risk profile by design.
“Guaranteed R/R” refers exclusively to this order placement logic (TP/SL geometry), not to win-rate or profitability.
5. Trading Logic – W3–W4–W5 Pattern
The Trading pivot stream (separate from visual wave degrees) looks for a simple but powerful pattern:
Bullish structure:
Sequence of pivots forms a higher-high / higher-low pattern.
Price is above the EMA trend filter.
A strong “W3” leg is confirmed with structure rules (optionally stricter in Strict mode).
Entry (Long – W4 Pullback):
The “height” of W3 is measured.
Entry is placed at a configurable Fibonacci pullback (default 50%) inside that leg.
ATR-based stop is placed below entry.
Take-profit is projected to satisfy min Reward:Risk.
Bearish structure:
Mirrored logic (lower highs/lows, price below EMA, W3 down, W4 retrace up, W5 continuation down).
Once a valid setup is found, the script draws a colored box around the entry zone and a label describing the type of signal (“LONG SETUP” or “SHORT SETUP”) with the suggested limit price.
6. Orders & Execution
Entry Orders: The strategy uses limit orders at the computed W4 level (“Sniper Long” or “Sniper Short”).
Exits: A single strategy.exit() is attached to each entry with:
Take-profit at the projected minimum R:R target.
Stop-loss at ATR-based level.
One Trade at a Time: New setups are only used when there is no open position (strategy.opentrades == 0) to keep the logic clear and risk contained.
7. Visual Guide on the Chart
Wave Labels:
Primary: ①,②,③,④,⑤, ⒶⒷⒸ
Intermediate: (1)…(5), (A)(B)(C)
Minor: i…v, a b c
Trend EMA: Single blue EMA showing the dominant trend.
Setup Boxes:
Green transparent box → long entry zone.
Red transparent box → short entry zone.
Labels: “LONG SETUP / SHORT SETUP” labels mark the proposed limit entry with price.
8. How to Use This Strategy
Attach the strategy to your chart
Choose your market (stocks, indices, FX, crypto, futures, etc.) and timeframe (for example 1h, 4h, or Daily). Then add the strategy to the chart from your Scripts list.
Start with the default settings
Leave all inputs on their defaults first. This lets you see the “intended” behaviour and the exact properties used for the published backtest (account size, 1% risk, commission, etc.).
Study the wave map
Zoom in and out and look at the three wave degrees:
Blue circles → Primary degree (big picture trend).
Teal (1)…(5) → Intermediate degree (swing structure).
Red i…v → Minor degree (micro waves).
Use this to understand how the engine is interpreting the Elliott structure on your symbol.
Watch for valid setups
Look for the coloured boxes and labels:
Green box + “LONG SETUP” label → potential W4 pullback long in an uptrend.
Red box + “SHORT SETUP” label → potential W4 pullback short in a downtrend.
Only trades in the direction of the EMA trend filter are allowed by the strategy.
Check the Reward:Risk of each idea
For each setup, inspect:
Limit entry price.
ATR-based stop level.
Projected take-profit level.
Make sure the minimum Reward:Risk ratio matches your own rules before you consider trading it.
Backtest and evaluate
Open the Strategy Tester:
Verify you have a decent sample size (ideally 100+ trades).
Check drawdowns, average trade, win-rate and R:R distribution.
Change markets and timeframes to see where the logic behaves best.
Adapt to your own risk profile
If you plan to use it live:
Set Initial Capital to your real account size.
Adjust default_qty_value to a risk level you are comfortable with (often 0.5–2% per trade).
Set commission and slippage to realistic broker values.
Re-run the backtest after every major change.
Use as a framework, not a signal machine
Treat this as a structured Elliott/R:R framework:
Filter signals by higher-timeframe trend, major S/R, volume, or fundamentals.
Optionally hide some wave degrees or ABC labels if you want a cleaner chart.
Combine the system’s structure with your own trade management and discretion.
Best Practices & Limitations
This is an approximate Elliott Wave engine based on fractal pivots. It does not replace a full discretionary Elliott analysis.
All wave counts are algorithmic and can differ from a manual analyst’s interpretation.
Like any backtest, results depend heavily on:
Symbol and timeframe.
Sample size (more trades are better).
Realistic commission/slippage settings.
The 0-slippage default is chosen only to show the “raw logic”. In real markets, slippage can significantly impact performance.
No strategy wins all the time. Losing streaks and drawdowns will still occur even with a strict R:R framework.
Disclaimer
This script is for educational and research purposes only and does not constitute financial advice or a recommendation to buy or sell any security. Past performance, whether real or simulated, is not indicative of future results. Always test on multiple symbols/timeframes, use conservative risk, and consult your financial advisor before trading live capital.
ค้นหาในสคริปต์สำหรับ "wave"

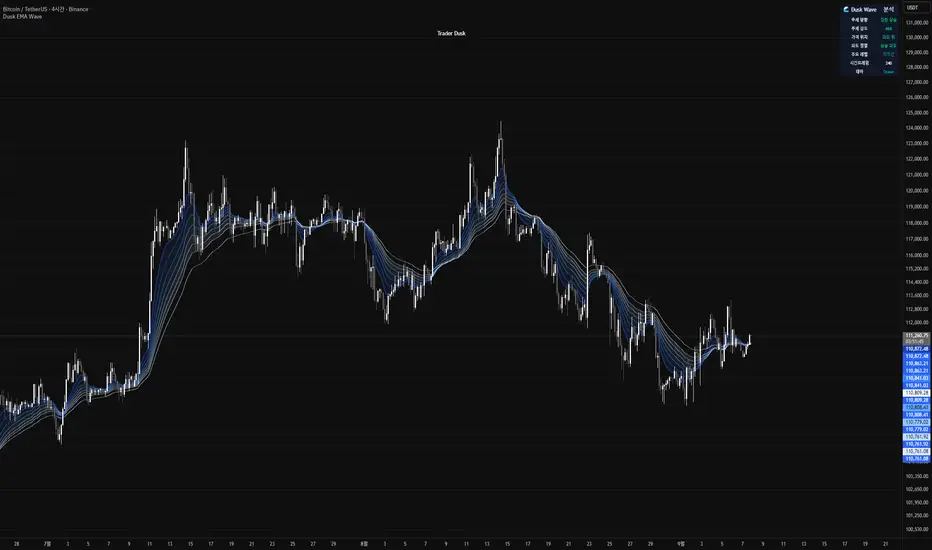
Dusk Wave🌊 Dusk Wave (시각적 분석 도구)
개요
기반 기술: 8단계 추세 파도 시각화
시간대: 모든 시간대 호환
신호: 신호 없음 (분석 전용)
용도: 추세 방향 및 강도 분석
Wave 테이블 설명
DUSK WAVE | TREND ANALYSIS
├─ Wave Alignment: 8개 파도 정렬 상태
├─ Trend Strength: 추세 강도 (Strong/Medium/Weak)
├─ Wave Direction: 파도 전체 방향 (Up/Down/Sideways)
├─ Fast Waves: 단기 파도 상태 (1-4번)
├─ Slow Waves: 장기 파도 상태 (5-8번)
├─ Convergence: 파도 수렴/발산 상태
└─ Trend Quality: 추세 품질 등급 (A/B/C/D)
Wave 해석 가이드
파란색 그라데이션: 8개 EMA 파도 표시
정렬 상태: 모든 파도가 같은 방향 = 강한 추세
파도 간격: 좁을수록 강한 추세, 넓을수록 약한 추세
색상 변화: 파도별 속도 차이 시각화
🌊 Dusk Wave (Visual Analysis Tool) - English Version
Overview
Core Technology: 8-Stage Trend Wave Visualization
Timeframe: Compatible with all timeframes
Signals: No signals (Analysis only)
Purpose: Trend direction and strength analysis
Wave Table Description
DUSK WAVE | TREND ANALYSIS
├─ Wave Alignment: 8 wave alignment status
├─ Trend Strength: Trend intensity (Strong/Medium/Weak)
├─ Wave Direction: Overall wave direction (Up/Down/Sideways)
├─ Fast Waves: Short-term wave status (Waves 1-4)
├─ Slow Waves: Long-term wave status (Waves 5-8)
├─ Convergence: Wave convergence/divergence state
└─ Trend Quality: Trend quality grade (A/B/C/D)
Wave Interpretation Guide
Blue Gradient: 8 EMA waves display
Alignment Status: All waves same direction = Strong trend
Wave Spacing: Closer = Stronger trend, Wider = Weaker trend
Color Changes: Visualizes speed differences between waves
Elliott Wave with Supertrend Exit - Strategy [presentTrading]## Introduction and How it is Different
The Elliott Wave with Supertrend Exit provides automated detection and validation of Elliott Wave patterns for algorithmic trading. It is designed to objectively identify high-probability wave formations and signal entries based on confirmed impulsive and corrective patterns.
* The Elliott part is mostly referenced from Elliott Wave by @LuxAlgo
Key advantages compared to discretionary Elliott Wave analysis:
- Wave Labeling and Counting: The strategy programmatically identifies swing pivot highs/lows with the Zigzag indicator and analyzes the waves between them. It labels the potential impulsive and corrective patterns as they form. This removes the subjectivity of manual wave counting.
- Pattern Validation: A rules-based engine confirms valid impulsive and corrective patterns by checking relative size relationships and fib ratios. Only confirmed wave counts are plotted and traded.
- Objective Entry Signals: Trades are entered systematically on the start of new impulsive waves in the direction of the trend. Pattern failures invalidate setups and stop out positions.
- Automated Trade Management: The strategy defines specific rules for profit targets at fib extensions, trailing stops at swing points, and exits on Supertrend reversals. This automates the entire trade lifecycle.
- Adaptability: The waveform recognition engine can be tuned by adjusting parameters like Zigzag depth and Supertrend settings. It adapts to evolving market conditions.
ETH 1hr chart
In summary, the strategy brings automation, objectivity and adaptability to Elliott Wave trading - removing subjective interpretation errors and emotional trading biases. It implements a rules-based, algorithmic approach for systematically trading Elliott Wave patterns across markets and timeframes.
## Trading Logic and Rules
The strategy follows specific trading rules based on the detected and validated Elliott Wave patterns.
Entry Rules
- Long entry when a new impulsive bullish (5-wave) pattern forms
- Short entry when a new impulsive bearish (5-wave) pattern forms
The key is entering on the start of a new potential trend wave rather than chasing.
Exit Rules
- Invalidation of wave pattern stops out the trade
- Close long trades on Supertrend downturn
- Close short trades on Supertrend upturn
- Use a stop loss of 10% of entry price (configurable)
Trade Management
- Scale out partial profits at Fibonacci levels
- Move stop to breakeven when price reaches 1.618 extension
- Trail stops below key swing points
- Target exits at next Fibonacci projection level
Risk Management
- Use stop losses on all trades
- Trade only highest probability setups
- Size positions according to chart timeframe
- Avoid overtrading when no clear patterns emerge
## Strategy - How it Works
The core logic follows these steps:
1. Find swing highs/lows with Zigzag indicator
2. Analyze pivot points to detect impulsive 5-wave patterns:
- Waves 1, 3, and 5 should not overlap
- Waves 3 and 5 must be longer than wave 1
- Confirm relative size relationships between waves
3. Validate corrective 3-wave patterns:
- Look for overlapping, choppy waves that retrace the prior impulsive wave
4. Plot validated waves and Fibonacci retracement levels
5. Signal entries when a new impulsive wave pattern forms
6. Manage exits based on pattern failures and Supertrend reversals
Impulsive Wave Validation
The strategy checks relative size relationships to confirm valid impulsive waves.
For uptrends, it ensures:
```
Copy code- Wave 3 is longer than wave 1
- Wave 5 is longer than wave 2
- Waves do not overlap
```
Corrective Wave Validation
The strategy identifies overlapping corrective patterns that retrace the prior impulsive wave within Fibonacci levels.
Pattern Failure Invalidation
If waves fail validation tests, the strategy invalidates the pattern and stops signaling trades.
## Trade Direction
The strategy detects impulsive and corrective patterns in both uptrends and downtrends. Entries are signaled in the direction of the validated wave pattern.
## Usage
- Use on charts showing clear Elliott Wave patterns
- Start with daily or weekly timeframes to gauge overall trend
- Optimize Zigzag and Supertrend settings as needed
- Consider combining with other indicators for confirmation
## Default Settings
- Zigzag Length: 4 bars
- Supertrend Length: 10 bars
- Supertrend Multiplier: 3
- Stop Loss: 10% of entry price
- Trading Direction: Both

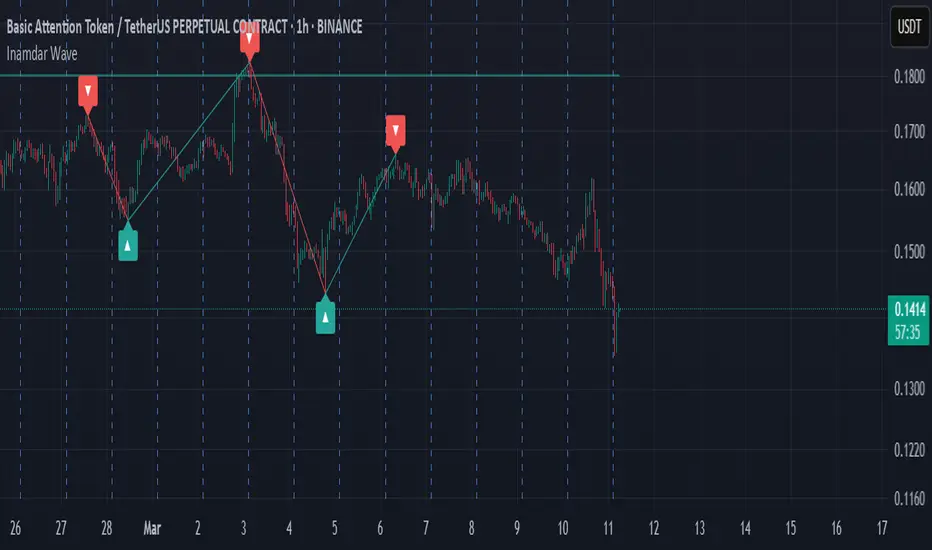
Inamdar Wave - Winning Wave
The **"Inamdar Wave"**, also known as the **"Winning Wave"**, is a cutting-edge market indicator designed to help traders ride the waves of momentum and capitalize on high-probability opportunities. With its unique ability to adapt to market shifts, the Inamdar Wave ensures you're always in sync with the market's most profitable moves, making it an indispensable tool for traders looking for consistent success.
### Key Features of the "Inamdar Wave":
1. **Dynamic Market Movement Detection**:
- The **Inamdar Wave** tracks the market’s momentum and identifies clear waves of movement, allowing traders to catch both upswings and downswings with ease.
- This indicator dynamically adjusts based on price action and volatility, ensuring you're always aligned with the market’s natural flow.
- Whether the market is trending or ranging, the **Inamdar Wave** keeps you on the right path, helping you surf the market's waves effortlessly.
2. **Highly Profitable Buy/Sell Signals**:
- The **Inamdar Wave** generates precise buy and sell signals that guide you to the most profitable entry and exit points.
- Its built-in filters ensure you avoid market noise, focusing only on high-probability trades that maximize your potential for profit.
- You’ll confidently enter trades at the start of each new wave, ensuring you ride the momentum for maximum gains.
3. **Visual Wave Highlighting**:
- Color-coded zones help you easily spot bullish (upward) and bearish (downward) waves.
- Green highlights signal upward waves, while red zones indicate downward waves, making it visually simple to recognize the current market direction.
- This feature allows for quick decision-making and a clear understanding of the market's direction at a glance.
4. **Tailored for Any Market Condition**:
- Whether you’re trading a calm or highly volatile market, the **Inamdar Wave** adapts to the changing conditions, ensuring consistent performance across all environments.
- Its flexibility allows it to work seamlessly with any asset class—stocks, forex, crypto, or commodities—making it an all-in-one solution for traders.
- The **Inamdar Wave**'s real-time adjustments keep it relevant regardless of market conditions or timeframes.
5. **Real-Time Alerts**:
- Get instant alerts when a new wave begins, whether it's a buy, sell, or wave reversal.
- You’ll never miss out on a profitable opportunity with real-time notifications that keep you one step ahead of the market.
- These alerts help you act quickly, maximizing the potential of every market movement.
### Inputs:
- **Wave Period**: Customize the sensitivity of the wave detection with adjustable periods to suit your trading style.
- **Signal Source**: Choose from different price sources to fine-tune how the **Inamdar Wave** reacts to market movements.
- **Signal Strength**: Control the sensitivity of wave detection to focus on only the strongest and most profitable moves.
- **Buy/Sell Signals**: Easily toggle buy/sell signals on your chart for enhanced clarity.
- **Wave Highlighting**: Turn visual wave highlights on or off, depending on your preference.
### Use Case:
The **Inamdar Wave** is perfect for traders looking to capture the most profitable waves in any market. Whether you're a short-term scalper or a long-term trend follower, this indicator keeps you in sync with the market’s natural rhythm, ensuring that you're always riding the winning wave. With its powerful buy/sell signals and dynamic wave detection, you'll be better positioned to take advantage of market momentum and secure consistent profits.
In conclusion, the **"Inamdar Wave"** is not just another indicator—it’s your key to riding the market’s most profitable waves with precision and confidence. By following the signals and staying in tune with the market’s natural flow, you’ll be able to maximize your gains and minimize your risks, ensuring a successful trading journey.
Descending Elliot Wave Patterns [theEccentricTrader]█ OVERVIEW
This indicator automatically draws descending Elliot Wave patterns and price projections derived from the ranges that constitute the patterns.
█ CONCEPTS
Green and Red Candles
• A green candle is one that closes with a close price equal to or above the price it opened.
• A red candle is one that closes with a close price that is lower than the price it opened.
Swing Highs and Swing Lows
• A swing high is a green candle or series of consecutive green candles followed by a single red candle to complete the swing and form the peak.
• A swing low is a red candle or series of consecutive red candles followed by a single green candle to complete the swing and form the trough.
Peak and Trough Prices (Basic)
• The peak price of a complete swing high is the high price of either the red candle that completes the swing high or the high price of the preceding green candle, depending on which is higher.
• The trough price of a complete swing low is the low price of either the green candle that completes the swing low or the low price of the preceding red candle, depending on which is lower.
Historic Peaks and Troughs
The current, or most recent, peak and trough occurrences are referred to as occurrence zero. Previous peak and trough occurrences are referred to as historic and ordered numerically from right to left, with the most recent historic peak and trough occurrences being occurrence one.
Range
The range is simply the difference between the current peak and current trough prices, generally expressed in terms of points or pips.
Support and Resistance
• Support refers to a price level where the demand for an asset is strong enough to prevent the price from falling further.
• Resistance refers to a price level where the supply of an asset is strong enough to prevent the price from rising further.
Support and resistance levels are important because they can help traders identify where the price of an asset might pause or reverse its direction, offering potential entry and exit points. For example, a trader might look to buy an asset when it approaches a support level , with the expectation that the price will bounce back up. Alternatively, a trader might look to sell an asset when it approaches a resistance level , with the expectation that the price will drop back down.
It's important to note that support and resistance levels are not always relevant, and the price of an asset can also break through these levels and continue moving in the same direction.
Upper Trends
• A return line uptrend is formed when the current peak price is higher than the preceding peak price.
• A downtrend is formed when the current peak price is lower than the preceding peak price.
• A double-top is formed when the current peak price is equal to the preceding peak price.
Lower Trends
• An uptrend is formed when the current trough price is higher than the preceding trough price.
• A return line downtrend is formed when the current trough price is lower than the preceding trough price.
• A double-bottom is formed when the current trough price is equal to the preceding trough price.
Muti-Part Upper and Lower Trends
• A multi-part return line uptrend begins with the formation of a new return line uptrend, or higher peak, and continues until a new downtrend, or lower peak, completes the trend.
• A multi-part downtrend begins with the formation of a new downtrend, or lower peak, and continues until a new return line uptrend, or higher peak, completes the trend.
• A multi-part uptrend begins with the formation of a new uptrend, or higher trough, and continues until a new return line downtrend, or lower trough, completes the trend.
• A multi-part return line downtrend begins with the formation of a new return line downtrend, or lower trough, and continues until a new uptrend, or higher trough, completes the trend.
Double Trends
• A double uptrend is formed when the current trough price is higher than the preceding trough price and the current peak price is higher than the preceding peak price.
• A double downtrend is formed when the current peak price is lower than the preceding peak price and the current trough price is lower than the preceding trough price.
Muti-Part Double Trends
• A multi-part double uptrend begins with the formation of a new uptrend that proceeds a new return line uptrend, and continues until a new downtrend or return line downtrend ends the trend.
• A multi-part double downtrend begins with the formation of a new downtrend that proceeds a new return line downtrend, and continues until a new uptrend or return line uptrend ends the trend.
Wave Cycles
A wave cycle is here defined as a complete two-part move between a swing high and a swing low, or a swing low and a swing high. The first swing high or swing low will set the course for the sequence of wave cycles that follow; for example a chart that begins with a swing low will form its first complete wave cycle upon the formation of the first complete swing high and vice versa.
Figure 1.
Fibonacci Retracement and Extension Ratios
The Fibonacci sequence is a series of numbers in which each number is the sum of the two preceding numbers, starting with 0 and 1. For example 0 + 1 = 1, 1 + 1 = 2, 1 + 2 = 3, and so on. Ultimately, we could go on forever but the first few numbers in the sequence are as follows: 0 , 1, 1, 2, 3, 5, 8, 13, 21, 34, 55, 89, 144.
The extension ratios are calculated by dividing each number in the sequence by the number preceding it. For example 0/1 = 0, 1/1 = 1, 2/1 = 2, 3/2 = 1.5, 5/3 = 1.6666..., 8/5 = 1.6, 13/8 = 1.625, 21/13 = 1.6153..., 34/21 = 1.6190..., 55/34 = 1.6176..., 89/55 = 1.6181..., 144/89 = 1.6179..., and so on. The retracement ratios are calculated by inverting this process and dividing each number in the sequence by the number proceeding it. For example 0/1 = 0, 1/1 = 1, 1/2 = 0.5, 2/3 = 0.666..., 3/5 = 0.6, 5/8 = 0.625, 8/13 = 0.6153..., 13/21 = 0.6190..., 21/34 = 0.6176..., 34/55 = 0.6181..., 55/89 = 0.6179..., 89/144 = 0.6180..., and so on.
1.618 is considered to be the 'golden ratio', found in many natural phenomena such as the growth of seashells and the branching of trees. Some now speculate the universe oscillates at a frequency of 0,618 Hz, which could help to explain such phenomena, but this theory has yet to be proven.
Traders and analysts use Fibonacci retracement and extension indicators, consisting of horizontal lines representing different Fibonacci ratios, for identifying potential levels of support and resistance. Fibonacci ranges are typically drawn from left to right, with retracement levels representing ratios inside of the current range and extension levels representing ratios extended outside of the current range. If the current wave cycle ends on a swing low, the Fibonacci range is drawn from peak to trough. If the current wave cycle ends on a swing high the Fibonacci range is drawn from trough to peak.
Elliot Wave Patterns
Ralph Nelson Elliott, authored his book on Elliott wave theory titled "The Wave Principle" in 1938. In this book, Elliott presented his theory of market behaviour, which he believed reflected the natural laws that govern human behaviour.
The Elliott Wave Theory is based on the principle that waves have a tendency to unfold in a specific sequence of five waves in the direction of the trend, followed by three waves leading in the opposite direction. This pattern is called a 5-3 wave pattern and is the foundation of Elliott's theory.
The five waves in the direction of the trend are labelled 1, 2, 3, 4, and 5, while the three waves in the opposite direction are labelled A, B, and C. Waves 1, 3, and 5 are impulse waves, while waves 2 and 4 are corrective waves. Waves A and C are also corrective waves, while wave B is an impulse wave.
According to Elliott, the pattern of waves is fractal in nature, meaning that it occurs on all time frames, from the smallest to the largest.
In Elliott Wave Theory, the distance that waves move from each other depends on the specific market conditions and the amplitude of the waves involved. There is no fixed rule or limit for how far waves should move from each other, however, there are several guidelines to help identify and measure wave distances. One of the most common guidelines is the Fibonacci ratios, which can be used to describe the relationships between wave lengths. For example, Elliott identified that wave 3 is typically the strongest and longest wave, and it tends to be 1.618 times the length of wave 1. Meanwhile, wave 2 tends to retrace between 50% and 78.6% of wave 1, and wave 4 tends to retrace between 38.2% and 78.6% of wave 3.
In general, the patterns are quite rare and the distances that the waves move in relation to one another is subject to interpretation. For such reasons, I have simply included the ratios of the current ranges as ratios of the preceding ranges in the wave labels and it will, ultimately, be up to the user to decide whether or not the patterns qualify as valid.
█ FEATURES
Inputs
• Show Projections
• Pattern Color
• Label Color
• Extend Current Projection Lines
█ LIMITATIONS
All green and red candle calculations are based on differences between open and close prices, as such I have made no attempt to account for green candles that gap lower and close below the close price of the preceding candle, or red candles that gap higher and close above the close price of the preceding candle. This may cause some unexpected behaviour on some markets and timeframes. I can only recommend using 24-hour markets, if and where possible, as there are far fewer gaps and, generally, more data to work with.

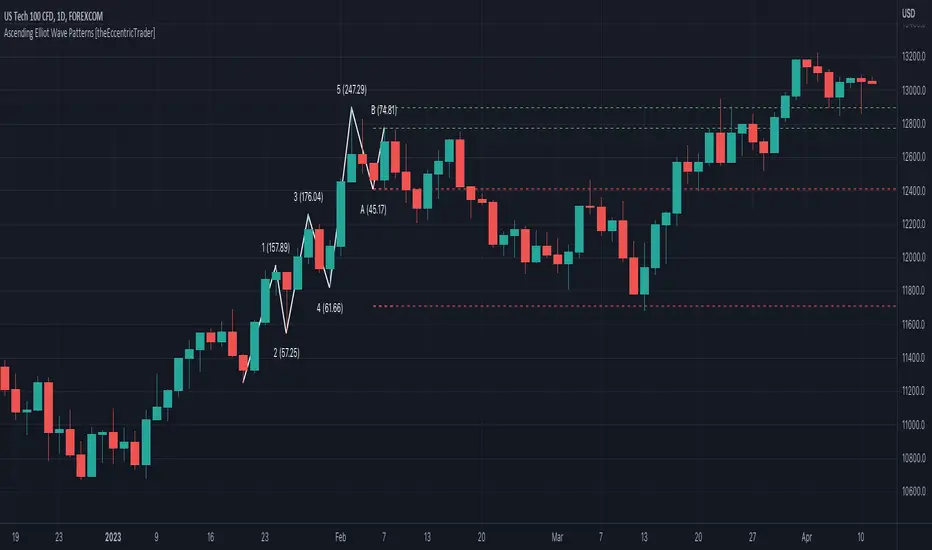
Ascending Elliot Wave Patterns [theEccentricTrader]█ OVERVIEW
This indicator automatically draws ascending Elliot Wave patterns and price projections derived from the ranges that constitute the patterns.
█ CONCEPTS
Green and Red Candles
• A green candle is one that closes with a close price equal to or above the price it opened.
• A red candle is one that closes with a close price that is lower than the price it opened.
Swing Highs and Swing Lows
• A swing high is a green candle or series of consecutive green candles followed by a single red candle to complete the swing and form the peak.
• A swing low is a red candle or series of consecutive red candles followed by a single green candle to complete the swing and form the trough.
Peak and Trough Prices (Basic)
• The peak price of a complete swing high is the high price of either the red candle that completes the swing high or the high price of the preceding green candle, depending on which is higher.
• The trough price of a complete swing low is the low price of either the green candle that completes the swing low or the low price of the preceding red candle, depending on which is lower.
Historic Peaks and Troughs
The current, or most recent, peak and trough occurrences are referred to as occurrence zero. Previous peak and trough occurrences are referred to as historic and ordered numerically from right to left, with the most recent historic peak and trough occurrences being occurrence one.
Range
The range is simply the difference between the current peak and current trough prices, generally expressed in terms of points or pips.
Support and Resistance
• Support refers to a price level where the demand for an asset is strong enough to prevent the price from falling further.
• Resistance refers to a price level where the supply of an asset is strong enough to prevent the price from rising further.
Support and resistance levels are important because they can help traders identify where the price of an asset might pause or reverse its direction, offering potential entry and exit points. For example, a trader might look to buy an asset when it approaches a support level , with the expectation that the price will bounce back up. Alternatively, a trader might look to sell an asset when it approaches a resistance level , with the expectation that the price will drop back down.
It's important to note that support and resistance levels are not always relevant, and the price of an asset can also break through these levels and continue moving in the same direction.
Upper Trends
• A return line uptrend is formed when the current peak price is higher than the preceding peak price.
• A downtrend is formed when the current peak price is lower than the preceding peak price.
• A double-top is formed when the current peak price is equal to the preceding peak price.
Lower Trends
• An uptrend is formed when the current trough price is higher than the preceding trough price.
• A return line downtrend is formed when the current trough price is lower than the preceding trough price.
• A double-bottom is formed when the current trough price is equal to the preceding trough price.
Muti-Part Upper and Lower Trends
• A multi-part return line uptrend begins with the formation of a new return line uptrend, or higher peak, and continues until a new downtrend, or lower peak, completes the trend.
• A multi-part downtrend begins with the formation of a new downtrend, or lower peak, and continues until a new return line uptrend, or higher peak, completes the trend.
• A multi-part uptrend begins with the formation of a new uptrend, or higher trough, and continues until a new return line downtrend, or lower trough, completes the trend.
• A multi-part return line downtrend begins with the formation of a new return line downtrend, or lower trough, and continues until a new uptrend, or higher trough, completes the trend.
Double Trends
• A double uptrend is formed when the current trough price is higher than the preceding trough price and the current peak price is higher than the preceding peak price.
• A double downtrend is formed when the current peak price is lower than the preceding peak price and the current trough price is lower than the preceding trough price.
Muti-Part Double Trends
• A multi-part double uptrend begins with the formation of a new uptrend that proceeds a new return line uptrend, and continues until a new downtrend or return line downtrend ends the trend.
• A multi-part double downtrend begins with the formation of a new downtrend that proceeds a new return line downtrend, and continues until a new uptrend or return line uptrend ends the trend.
Wave Cycles
A wave cycle is here defined as a complete two-part move between a swing high and a swing low, or a swing low and a swing high. The first swing high or swing low will set the course for the sequence of wave cycles that follow; for example a chart that begins with a swing low will form its first complete wave cycle upon the formation of the first complete swing high and vice versa.
Figure 1.
Fibonacci Retracement and Extension Ratios
The Fibonacci sequence is a series of numbers in which each number is the sum of the two preceding numbers, starting with 0 and 1. For example 0 + 1 = 1, 1 + 1 = 2, 1 + 2 = 3, and so on. Ultimately, we could go on forever but the first few numbers in the sequence are as follows: 0 , 1, 1, 2, 3, 5, 8, 13, 21, 34, 55, 89, 144.
The extension ratios are calculated by dividing each number in the sequence by the number preceding it. For example 0/1 = 0, 1/1 = 1, 2/1 = 2, 3/2 = 1.5, 5/3 = 1.6666..., 8/5 = 1.6, 13/8 = 1.625, 21/13 = 1.6153..., 34/21 = 1.6190..., 55/34 = 1.6176..., 89/55 = 1.6181..., 144/89 = 1.6179..., and so on. The retracement ratios are calculated by inverting this process and dividing each number in the sequence by the number proceeding it. For example 0/1 = 0, 1/1 = 1, 1/2 = 0.5, 2/3 = 0.666..., 3/5 = 0.6, 5/8 = 0.625, 8/13 = 0.6153..., 13/21 = 0.6190..., 21/34 = 0.6176..., 34/55 = 0.6181..., 55/89 = 0.6179..., 89/144 = 0.6180..., and so on.
1.618 is considered to be the 'golden ratio', found in many natural phenomena such as the growth of seashells and the branching of trees. Some now speculate the universe oscillates at a frequency of 0,618 Hz, which could help to explain such phenomena, but this theory has yet to be proven.
Traders and analysts use Fibonacci retracement and extension indicators, consisting of horizontal lines representing different Fibonacci ratios, for identifying potential levels of support and resistance. Fibonacci ranges are typically drawn from left to right, with retracement levels representing ratios inside of the current range and extension levels representing ratios extended outside of the current range. If the current wave cycle ends on a swing low, the Fibonacci range is drawn from peak to trough. If the current wave cycle ends on a swing high the Fibonacci range is drawn from trough to peak.
Elliot Wave Patterns
Ralph Nelson Elliott, authored his book on Elliott wave theory titled "The Wave Principle" in 1938. In this book, Elliott presented his theory of market behaviour, which he believed reflected the natural laws that govern human behaviour.
The Elliott Wave Theory is based on the principle that waves have a tendency to unfold in a specific sequence of five waves in the direction of the trend, followed by three waves leading in the opposite direction. This pattern is called a 5-3 wave pattern and is the foundation of Elliott's theory.
The five waves in the direction of the trend are labelled 1, 2, 3, 4, and 5, while the three waves in the opposite direction are labelled A, B, and C. Waves 1, 3, and 5 are impulse waves, while waves 2 and 4 are corrective waves. Waves A and C are also corrective waves, while wave B is an impulse wave.
According to Elliott, the pattern of waves is fractal in nature, meaning that it occurs on all time frames, from the smallest to the largest.
In Elliott Wave Theory, the distance that waves move from each other depends on the specific market conditions and the amplitude of the waves involved. There is no fixed rule or limit for how far waves should move from each other, however, there are several guidelines to help identify and measure wave distances. One of the most common guidelines is the Fibonacci ratios, which can be used to describe the relationships between wave lengths. For example, Elliott identified that wave 3 is typically the strongest and longest wave, and it tends to be 1.618 times the length of wave 1. Meanwhile, wave 2 tends to retrace between 50% and 78.6% of wave 1, and wave 4 tends to retrace between 38.2% and 78.6% of wave 3.
In general, the patterns are quite rare and the distances that the waves move in relation to one another is subject to interpretation. For such reasons, I have simply included the ratios of the current ranges as ratios of the preceding ranges in the wave labels and it will, ultimately, be up to the user to decide whether or not the patterns qualify as valid.
█ FEATURES
Inputs
• Show Projections
• Pattern Color
• Label Color
• Extend Current Projection Lines
█ LIMITATIONS
All green and red candle calculations are based on differences between open and close prices, as such I have made no attempt to account for green candles that gap lower and close below the close price of the preceding candle, or red candles that gap higher and close above the close price of the preceding candle. This may cause some unexpected behaviour on some markets and timeframes. I can only recommend using 24-hour markets, if and where possible, as there are far fewer gaps and, generally, more data to work with.
Wolfe Waves [BigBeluga]🔵 OVERVIEW
The Wolfe Waves pattern was first introduced by Bill Wolfe , a trader and analyst in the 1980s–1990s who specialized in market geometry and natural rhythm cycles. Wolfe observed that price often forms symmetrical wave structures that anticipate equilibrium points where supply and demand meet. These formations, called Wolfe Waves , gained popularity as a reliable pattern for forecasting both short- and long-term reversals.
The Wolfe Waves indicator automatically detects these patterns in real time. It tracks sequences of five pivots (points 1 through 5) and connects them with wave lines. Users can select either Bullish or Bearish Wolfe Waves depending on their trading bias. When the pattern fails, the lines automatically turn red to highlight invalidation.
🔵 CONCEPTS
Five-Point Structure – Wolfe Waves are defined by five pivots (1–5), which together form the basis of the wave pattern.
Bullish Pattern – Occurs when price compresses downward into point 5, signaling a potential upside reversal.
Bearish Pattern – Occurs when price extends upward into point 5, forecasting a downside reversal.
Validation & Failure – The pattern is considered valid once all five pivots form; if price fails to respect the expected breakout, the indicator marks the structure as broken with red lines.
🔵 FEATURES
Automatic detection of Bullish and Bearish Wolfe Waves.
Labels each pivot (1–5) on the chart for clarity.
Draws connecting lines between pivots to visualize the wave structure.
Projects target/dashed lines (EPA/ETA) based on Wolfe Wave geometry.
Lines automatically turn red when the pattern is broken, giving immediate feedback.
Customizable color scheme for bullish (lime) and bearish (orange) waves.
Adjustable sensitivity for pivot detection.
🔵 HOW TO USE
Choose between Bullish or Bearish mode depending on your analysis.
Watch for the formation of all five pivots; the indicator labels them clearly.
Look for potential entries near point 5, with the expectation that price will travel toward the projected EPA line.
Use invalidation (lines turning red) as a risk management warning to exit failed setups.
Combine with momentum, volume, or higher-timeframe analysis to increase reliability.
🔵 CONCLUSION
The Wolfe Waves brings the classic Wolfe Wave theory into an automated TradingView tool. Inspired by Bill Wolfe’s original concept of natural market cycles, this indicator detects, labels, and validates Wolfe Waves in real time. With automatic invalidation marking and customizable settings, it offers traders a structured way to harness one of the most well-known geometric reversal patterns.

Apex Edge – Wolfe Wave HunterApex Edge – Wolfe Wave Hunter
The modern Wolfe Wave, rebuilt for the algo era
This isn’t just another Wolfe Wave indicator. Classic Wolfe detection is rigid, outdated, and rarely tradable. Apex Edge – Wolfe Wave Hunter re-engineers the pattern into a modern, SMC-driven model that adapts to today’s liquidity-dominated markets. It’s not about drawing pretty shapes – it’s about extracting precision entries with asymmetric risk-to-reward potential.
🔎 What it does
Automatic Wolfe Wave Detection
Identifies bullish and bearish Wolfe Wave structures using pivot-based logic, symmetry filters, and slope tolerances.
Channel Glow Zones
Highlights the Wolfe channel and projects it forward into the future (bars are user-defined). This allows you to see the full potential of the trade before price even begins its move.
Stop Loss (SL) & Entry Arrow
At the completion of Wave 5, the algo prints a Stop Loss line and a tiny entry arrow (green for bullish, red for bearish). but the colours can be changed in user settings. This is the “execution point” — where the Wolfe setup becomes tradable.
Target Projection Lines
TP1 (EPA): Derived from the traditional 1–4 line projection.
TP2 (1.272 Fib): Optional secondary profit target.
TP3 (1.618 Fib): Optional extended target for large runners.
All TP lines extend into the future, so you can track them as price evolves.
Volume Confirmation (optional)
A relative volume filter ensures Wave 5 is formed with meaningful market participation before a setup is confirmed.
Alerts (ready out of the box)
Custom alerts can be fired whenever a bullish or bearish Wolfe Wave is confirmed. No need to babysit the charts — let the script notify you.
⚙️ Customisation & User Control
Every trader’s market and style is different. That’s why Wolfe Wave Hunter is fully customisable:
Arrow Colours & Size
Works on both light and dark charts. Choose your own bullish/bearish entry arrow colours for maximum visibility.
Tolerance Levels
Adjust symmetry and slope tolerance to refine how strict the channel rules are.
Tighter settings = fewer but cleaner zones.
Looser settings = more frequent setups, but with slightly lower structural quality.
Channel Glow Projection
Define how many bars forward the channel is drawn. This controls how far into the future your Wolfe zones are extended.
Stop Loss Line Length
Keep the SL visible without it extending infinitely across your chart.
Take Profit Line Colors
Each TP projection can be styled to your preference, allowing you to clearly separate TP1, TP2, and TP3.
This isn’t a one-size-fits-all tool. You can shape Wolfe detection logic to match the pairs, timeframes, and market conditions you trade most.
🚀 Why it’s different
Classic Wolfe waves are rare — this script adapts the model into something practical and tradeable in modern markets.
Liquidity-aligned — many setups align with structural sweeps of Wave 3 liquidity before driving into profit.
Entry built-in — most Wolfe scripts only draw the structure. Wolfe Wave Hunter gives you a precise entry point, SL, and projected TPs.
Backtest-friendly — you’ll quickly discover which assets respect Wolfe waves and which don’t, creating your own high-probability Wolfe watchlist.
⚠️ Limitations & Disclaimer
Not all markets respect Wolfe Waves. Some FX pairs, metals, and indices respect the structure beautifully; others do not. Backtest and create your own shortlist.
No guaranteed sweeps. Many entries occur after a liquidity sweep of Wave 3, but not all. The algo is designed to detect Wolfe completion, not enforce textbook liquidity rules.
Probabilistic, not predictive. Wolfe setups don’t win every time. Always use risk management.
High-RR focus. This is not a high-frequency tool. It’s designed for precision, asymmetric setups where risk is small and reward potential is large.
✅ The Bottom Line
Apex Edge – Wolfe Wave Hunter is a modern reimagination of the Wolfe Wave. It blends structural geometry, liquidity dynamics, and algo-driven execution into a single tool that:
Detects the pattern automatically
Provides SL, entry, and TP levels
Offers alerts for hands-off trading
Allows deep customisation for different markets
When it hits, it delivers outstanding risk-to-reward. Backtest, refine your tolerances, and build your watchlist of assets where Wolfe structures consistently pay.
This isn’t just Wolfe detection — it’s Wolfe trading, rebuilt for the modern trader.
Developer Notes - As always with the Apex Edge Brand, user feedback and recommendations will always be respected. Simply drop us a message with your comments and we will endeavour to address your needs in future version updates.

Smart Elliott Wave [The_lurker]🔷 Smart Elliott Wave – موجات إليوت الذكية
A professional indicator for automatically detecting and analyzing Elliott Wave patterns on the chart. Built on classical Elliott Wave theory, it enhances accuracy with dynamic Fibonacci validation and geometric logic—solving the most common issues traders face when applying Elliott Wave manually: complexity, subjectivity, and misinterpretation of corrections.
🎯 Key Features
Smart Elliott Wave offers a layered intelligent system that:
- Automatically detects impulsive and corrective wave structures
- Validates wave formations using Fibonacci rules
- Highlights potential reversal zones (PRZ)
- Sends instant alerts for newly detected patterns
- Supports both bullish and bearish trends
- Includes fully customizable user settings
🧠 Core Concept
The indicator analyzes price movement over time using pivot points (discovered via `ta.pivothigh` and `ta.pivotlow`) to detect wave structures that conform to Elliott Wave sequencing:
- Impulse Wave: 0-1-2-3-4-5
- Simple Correction: ABC
- Complex Correction: WXY
Each structure is validated through a strict set of logical rules combined with Fibonacci ratio checks to ensure pattern integrity and reduce false signals.
🧩 Wave Structure Components
1️⃣ Impulse Waves
- Wave 3 is not the shortest
- Wave 4 does not overlap Wave 1
- Waves 1, 3, and 5 are impulsive; Waves 2 and 4 are corrective
- Fibonacci validation can be applied to Waves 2 and 4 if enabled
2️⃣ Simple Corrections (ABC)
- Wave B partially retraces Wave A
- Wave C completes the structure without invalid overlap
- Fibonacci ratios validate the symmetry of A, B, and C (if enabled)
3️⃣ Complex Corrections (WXY)
- Only used if ABC structure is insufficient
- Requires 6 sequential pivot points: W, X, Y
- W and Y are corrective; X is a linking wave
- Follows both structural and ratio-based validations
📏 Dynamic Fibonacci Validation
When Enable Fibonacci Rules is active:
- Validates against common ratios:
`38.2%`, `50%`, `61.8%`, `78.6%`, `127.2%`, `161.8%`
- Adjustable **Fibonacci Tolerance** allows for controlled deviation
- Patterns are ignored if ratios fall outside the accepted range
🔮 Potential Reversal Zones (PRZ)
- Calculated from the most recent completed impulse wave
- Uses Fibonacci extensions to project PRZ ahead of price
- Customizable visibility and color for each ratio
- Used as dynamic take-profit or stop-loss zones
🖍️ Dual Trend Detection & Wave Coloring
- Supports both bullish and bearish patterns
- Automatic wave coloring for quick visual recognition:
- 🟦 Blue: Bullish waves
- 🟥 Red: Bearish waves
- Optional fill color for correction zones
🔔 Smart Alert System
Instant alerts are triggered when a valid wave pattern is confirmed:
- New impulse wave detected
- ABC correction appears
- Complex WXY correction formed
> Alerts are triggered only after the bar closes to prevent repainting.
⚙️ Indicator Settings
📌 Wave Detection Settings
- Pivot Left Strength: Bars to the left used for pivot detection
- Pivot Right Strength: Bars to the right for confirmation (0 = real-time)
- Enable Fibonacci Rules: Toggle Fibonacci ratio validation
- Fibonacci Tolerance: Allowed deviation in percentage
🎨 Display Settings
- Show Previous Patterns: Toggle between all patterns or only the latest
- Fill correction zones with color
- Customize wave and PRZ color schemes
📉 PRZ Settings
- Show/hide specific Fibonacci ratios
- Customize each PRZ color
- Set maximum bar extension for PRZ display
🔕 Alert Settings
- Enable or disable alerts for each type of pattern
📚 Practical Use Cases
- Daily or intraday price structure analysis
- Combine with RSI, MACD, or momentum indicators
- Filter weak signals using Fibonacci-based pattern validation
- Use PRZ zones as dynamic entry/exit targets
- Learn and reinforce Elliott Wave theory through real-time examples
📝 Important Notes
- Setting `Pivot Right = 0` allows for real-time pattern previews (may repaint)
- Disabling Fibonacci validation increases pattern count but reduces accuracy
- TradingView limits to 500 visual objects (labels, boxes, lines); older patterns may be removed
- PRZ extends up to 100 bars or 0.618 of the previous impulse duration by default
⚠️ Disclaimer:
This indicator is for educational and analytical purposes only. It does not constitute financial, investment, or trading advice. Use it in conjunction with your own strategy and risk management. Neither TradingView nor the developer is liable for any financial decisions or losses.
🔷 Smart Elliott Wave – موجات إليوت الذكية
مؤشر احترافي لرصد وتحليل أنماط موجات إليوت تلقائيًا على الرسم البياني، يعتمد على المبادئ الكلاسيكية للنظرية مع تعزيزها بالتحقق الرياضي والهندسي، ويهدف إلى تجاوز العقبات التي يواجهها معظم المتداولين عند تطبيق موجات إليوت يدويًا، مثل صعوبة التحديد، التقديرات الذاتية، وتشويش التصحيحات.
🎯 ما الذي يميز هذا المؤشر؟
يُقدّم Smart Elliott Wave نظامًا تراكبيًا ذكيًا يقوم بـ:
رصد تلقائي للموجات (الدافعة والتصحيحية)
التحقق من صحة النموذج باستخدام قواعد فيبوناتشي
عرض مناطق الانعكاس المحتملة (PRZ)
توليد تنبيهات لحظية عند تشكّل أنماط جديدة
دعم الاتجاهين (الصاعد والهابط)
واجهة إعدادات مرنة قابلة للتخصيص الكامل
🧠 الفكرة الأساسية
يعتمد المؤشر على تحليل حركة السعر عبر تسلسل زمني من النقاط المحورية (Pivots)، والتي تُكتشف باستخدام دوال مدمجة مثل ta.pivothigh وta.pivotlow. ثم يُبني فوق هذه النقاط نماذج هندسية متوافقة مع تسلسل موجات إليوت:
الموجة الدافعة (Impulse): تسلسل 0-1-2-3-4-5
التصحيح البسيط (ABC)
التصحيح المعقد (WXY)
ويتم التحقق من كل نموذج اعتمادًا على قواعد إليوت + نسب فيبوناتشي، ما يضمن موضوعية التصنيف، ودقة التحديد.
🧩 مكوّنات التحليل:
1️⃣ الموجات الدافعة (Impulse Waves):
يُشترط أن تكون الموجة الثالثة غير الأقصر.
لا تتداخل الموجة الرابعة مع نطاق الموجة الأولى.
تأكيد أن الموجات 1 و3 و5 دافعة، و2 و4 تصحيحية.
يتم التحقق من نسب تصحيح الموجتين 2 و4 حسب قواعد فيبوناتشي عند تفعيلها.
2️⃣ التصحيح البسيط (ABC):
B تصحيح جزئي للموجة A.
C تُكمل الهيكل بدون تداخل مع A.
يتم التحقق من أطوال الموجات وفق نسب فيبوناتشي لضمان التناسق.
3️⃣ التصحيح المعقد (WXY):
لا يتم تفعيله إلا عند فشل ABC في تفسير النمط.
يتطلب 6 نقاط محورية متسلسلة: W, X, Y.
W وY تصحيحيتان، وX رابط مركزي.
يخضع أيضًا لقواعد النسب والتماثل البنائي.
📏 التحقق باستخدام نسب فيبوناتشي:
عند تفعيل خاصية Enable Fibonacci Rules، يتم التحقق الصارم من نسب تصحيح الموجات:
النسب المعتمدة:
38.2%, 50%, 61.8%, 78.6%, 127.2%, 161.8%
إذا لم تكن الموجة ضمن نطاق النسبة + نسبة التسامح (Tolerance)، يتم تجاهل النموذج.
يُستخدم هذا التحقق أيضًا لرسم مناطق الانعكاس المحتملة (PRZ).
🔮 مناطق الانعكاس المحتملة (PRZ)
تُحسب PRZ باستخدام نسب فيبوناتشي انطلاقًا من نهاية آخر موجة دافعة.
تُعرض بشكل مستطيلات شفافة أو ملونة.
يمكن تخصيص كل نسبة لونًا وشكلًا خاصًا.
تُستخدم PRZ كأداة توقع للموجة التالية أو لتحديد أهداف وقف الخسارة وجني الأرباح ديناميكيًا.
🖍️ دعم الاتجاهين وتلوين الموجات:
يدعم المؤشر النماذج الصاعدة والهابطة بشكل تلقائي.
يتم استخدام تلوين بصري لتسهيل التمييز:
الأزرق: للموجات الصاعدة
الأحمر: للموجات الهابطة
لون تعبئة مخصص لمناطق التصحيح
🔔 نظام التنبيهات الذكية
يحتوي المؤشر على تنبيهات تلقائية يتم تفعيلها عند اكتمال أي نمط جديد.
يدعم التنبيهات التالية:
موجة دافعة جديدة
تصحيح بسيط ABC
تصحيح معقد WXY
التنبيهات تُطلق بعد إغلاق الشمعة التي تحقق فيها النموذج (غير فوري Repainting-safe)
⚙️ إعدادات المؤشر
📌 إعدادات تحليل الموجة:
Pivot Left Strength: عدد الأعمدة (bars) إلى اليسار لتحديد الانعكاس
Pivot Right Strength: الأعمدة إلى اليمين لتأكيد الانعكاس (0 يعني تنبؤ لحظي)
Enable Fibonacci Rules: تفعيل/تعطيل التحقق من فيبوناتشي
Fibonacci Tolerance: نسبة التفاوت المقبولة بالنسب المئوية
🎨 إعدادات العرض:
Show Previous Patterns: إظهار كل الأنماط المكتشفة أو آخر نمط فقط
PRZ Settings:
إظهار أو إخفاء نسب معينة
تخصيص الألوان
تحديد امتداد مربع PRZ زمنيًا (Max Bars)
🔕 إعدادات التنبيهات:
تفعيل/تعطيل تنبيه عند كل نمط جديد
📚 حالات الاستخدام العملية:
تحليل الحركة السعرية في بداية كل جلسة
دمج المؤشر مع أدوات مثل RSI أو MACD للحصول على إشارات مركّبة
مراقبة الموجات التوسعية والتصحيحية على فواصل 4H / Daily
استخدام PRZ كأداة لتحديد الأهداف أو وقف الخسارة
التعلم العملي لنظرية إليوت من خلال أمثلة حية
📝 ملاحظات مهمة:
تعيين Pivot Right = 0 يعني نقاط فورية (قد يعاد رسمها لاحقًا)
تعطيل فيبوناتشي يزيد عدد النماذج، لكن قد يُضعف دقتها
TradingView يحد عدد الكائنات المرسومة (Labels, Boxes, Lines) إلى 500، مما قد يؤدي إلى حذف الأنماط الأقدم تلقائيًا
PRZ يمتد افتراضيًا حتى 100 شمعة، أو 0.618 من مدة الموجة الدافعة السابقة
⚠️ إخلاء مسؤولية:
هذا المؤشر لأغراض تعليمية وتحليلية فقط. لا يُمثل نصيحة مالية أو استثمارية أو تداولية. استخدمه بالتزامن مع استراتيجيتك الخاصة وإدارة المخاطر. لا يتحمل TradingView ولا المطور مسؤولية أي قرارات مالية أو خسائر.

Weis Wave Volume MTF 🎯 Indicator Name
Weis Wave Volume (Multi‑Timeframe) — adapted from the original “Weis Wave Volume by LazyBear.”
This version adds multi‑timeframe (MTF) readings, configurable colors, font size, and screen position for clear dashboard‑style display.
🧠 Concept Background — What is Weis Wave Volume (WWV)?
The Weis Wave Volume indicator originates from Wyckoff and David Weis’ techniques.
Its purpose is to link price movement “waves” with the amount of traded volume to reveal how strong or weak each wave is.
Instead of showing bars one by one, WWV accumulates the total volume while price keeps moving in the same direction.
When price direction changes (up → down or down → up), it:
Finishes the previous wave volume total.
Starts a new wave and begins accumulating again.
Those wave volumes help traders see:
Effort vs Result: Big volume with small price move ⇒ absorption; low volume with big move ⇒ weak participation.
Trend confirmation or exhaustion: High volume waves in trend direction strengthen it, while low‑volume waves hint exhaustion.
⚙️ How this Script Works
Trend & Wave Detection
Compares close with the previous bar to determine up or down movement (mov).
Detects trend reversals (when mov direction changes).
Builds “waves,” each representing a continuous run of bars in one direction.
Volume Accumulation
While price keeps the same direction, the script adds each bar’s volume to the running total (vol).
When direction flips, it resets that total and starts a new wave.
Multi‑Timeframe Computation
Calculates these wave volumes on three timeframes at once, chosen dynamically:
Active Chart Timeframe Displays WWV for:
1 min 1 min
5 min 5 min
15 min 15 min
Any other Chart TF
It uses request.security() to pull each timeframe’s latest WWV value and current wave direction.
Visual Output
Instead of plotting histogram bars, it shows a table with three numeric values:
WWV (1): 25.3 M | (15): 312 M | (240): 2.46 B
Each value is color‑coded:
user‑selected Uptrend Color when price wave = up
user‑selected Downtrend Color when wave = down
You can position this small table in any corner/center (top / bottom × left / center / right).
Font size is user‑adjustable (Tiny → Huge).
📈 How Traders Use It
Quickly gauge buying vs selling effort across multiple horizons.
Compare short‑term wave volume to higher‑timeframe waves to spot:
Alignment → all up and big volumes = strong trend
Divergence → small or opposite‑colored higher‑TF wave = potential reversal or pause
Combine with Wyckoff, VSA, or standard trend analysis to judge if a breakout or pullback has real participation.
🧩 Key Features of This Version
Feature Description
Multi‑Timeframe Panel Displays WWV values for 3 selected TFs at once
Dynamic TF Mapping Auto‑adjusts which TFs to use based on chart
Up/Down Color Coding Customizable colors for wave direction
Adjustable Font and Placement Set font size (Tiny→Huge) and screen corner/center
No Histograms Keeps chart clean; acts as a compact WWV dashboard

Elliott Wave [BigBeluga]🔵 OVERVIEW
Elliott Wave automatically finds and draws an Elliott-style 5-wave impulse and a dashed projection for a potential -(a)→(b)→(c) correction. It detects six sequential reversal points from rolling highs/lows — 1, 2, 3, 4, 5, (a) — validates their relative placement, and then renders the wave with labels and horizontal reference lines. If price invalidates the structure by closing back through the Wave-5 level inside a 100-bar window, the pattern is cleared (optionally kept as “broken”) while key dotted levels remain for context.
🔵 CONCEPTS
Reversal harvesting from extremes : The script scans highest/lowest values over a user-set Length and stores swing points with their bar indices.
Six-point validation : A pattern requires six pivots (1…5 and (a)). Their vertical/temporal order must satisfy Elliott-style constraints before drawing.
Impulse + projection : After confirming 1→5, the tool plots a curved polyline through the pivots and a dashed forward path from (a) toward (b) (midpoint of 5 and (a)) and back to (c).
Risk line (invalidator) : The Wave-5 price is tracked; a close back through it within 100 bars marks the structure as broken.
Minimal persistence : When broken, the wave drawing is removed to avoid noise, while dotted horizontals for waves 5 and 4 remain as reference.
🔵 FEATURES
Automatic pivot collection from rolling highs/lows (user-controlled Length ).
Wave labeling : Points 1–5 are printed; the last collected swing is marked b
. Projected i
& i
are shown with a dashed polyline.
Breaker line & cleanup : If price closes above Wave-5 (opposite for bears) within 100 bars, the pattern is removed; only dotted levels of 5 and 4 stay.
Styling controls :
Length (pivot sensitivity)
Text Size for labels (tiny/small/normal/large)
Wave color input
Show Broken toggle to keep invalidated patterns visible
Lightweight memory : Keeps a compact buffer of recent pivots/draws to stay responsive.
🔵 HOW TO USE
Set sensitivity : Increase Length on noisy charts for cleaner pivots; decrease to catch earlier/shorter structures.
Wait for confirmation : Once 1→5 is printed and (a) appears, use the Wave-5 line as your invalidation. A close back through it within ~100 bars removes the active wave (unless Show Broken is on).
Plan with the dashed path : The (a)→(b)→(c) projection offers a scenario for potential corrective movement and risk placement.
Work MTF : Identify cleaner waves on higher TFs; refine execution on lower TFs near the breaker or during the move toward (b).
Seek confluence : Align with structure (S/R), volume/Delta, or your trend filter to avoid counter-context trades.
🔵 CONCLUSION
Elliott Wave systematizes discretionary wave analysis: it detects and labels the 5-wave impulse, projects a plausible (a)-(b)-(c) path, and self-cleans on invalidation. With clear labels, dotted reference levels, and a practical breaker rule, it gives traders an objective framework for scenario planning, invalidation, and timing.

Adaptive Causal Wavelet Trend FilterThe Adaptive Causal Wavelet Trend Filter is a technical indicator implementing causal approximations of wavelet transform properties for better trend detection with adaptive volatility response.
The Adaptive Causal Wavelet Trend Filter (ACWTF) applies mathematical principles derived from wavelet analysis to financial time series, providing robust trend identification with minimal lag. Unlike conventional moving averages, it preserves significant price movements while filtering market noise through signal processing that i describe below.
I was inspired to build this indicator after reading " Wavelet-Based Trend Identification in Financial Time Series " by In, F., & Kim, S. 2013 and reading about Mexican Hat wavelet filters.
The ACWTF maintains optimal performance across varying market regimes without requiring parameter adjustments by adapting filter characteristics to current volatility conditions.
Mathematical Foundation
Inspired by the Mexican Hat wavelet (Ricker wavelet), this indicator implements causal approximations of wavelet filters optimized for real-time financial analysis. The multi-resolution approach identifies features at different scales and the adaptive component dynamically adjusts filtering characteristics based on local volatility measurements.
Key mathematical properties include:
Non-linear frequency response adaptation
Edge-preserving signal extraction
Scale-space analysis through dual filter implementation
Volatility-dependent coefficient adjustment, which I love
Filter Methods
Adaptive: Implements a volatility-weighted combination of multiple filter types to optimize the time-frequency resolution trade-off
Hull: Provides a causal approximation of wavelet edge detection properties with forward-projection characteristics
VWMA: Incorporates volume information into the filtering process for enhanced signal detection
EMA Cascade: Creates a multi-pole filter structure that approximates certain wavelet scaling properties
Suggestion: try all as they will provide slightly different signals. Try also different time-frames.
Practical Applications
Trend Direction Identification: Clear visual trend direction with reduced noise and lag
Regime Change Detection: Early identification of significant trend reversals
Market Condition Analysis: Integrated volatility metrics provide context for current market behavior
Multi-timeframe Confirmation: Alignment between primary and secondary filters offers additional confirmation
Entry/Exit Timing: Filter crossovers and trend changes provide potential trading signals
The comprehensive information panel provides:
Current filter method and trend state
Trend alignment between timeframes
Real-time volatility assessment
Price position relative to filter
Overall trading bias based on multiple factors
Implementation Notes
Log returns option provides improved statistical properties for financial time series
Primary and secondary filter lengths can be adjusted to optimize for specific instruments and timeframes
The indicator performs particularly well during trend transitions and regime changes
The indicator reduces the need for using additional indicators to check trend reversion

Weis Wave Max█ Overview
Weis Wave Max is the result of my weis wave study.
David Weis said,
"Trading with the Weis Wave involves changes in behavior associated with springs, upthrusts, tests of breakouts/breakdowns, and effort vs reward. The most common setup is the low-volume pullback after a bullish/bearish change in behavior."
THE STOCK MARKET UPDATE (February 24, 2013)
I inspired from his sentences and made this script.
Its Main feature is to identify the largest wave in Weis wave and advantageous trading opportunities.
█ Features
This indicator includes several features related to the Weis Wave Method.
They help you analyze which is more bullish or bearish.
Highlight Max Wave Value (single direction)
Highlight Abnormal Max Wave Value (both directions)
Support and Resistance zone
Signals and Setups
█ Usage
Weis wave indicator displays cumulative volume for each wave.
Wave volume is effective when analyzing volume from VSA (Volume Spread Analysis) perspective.
The basic idea of Weis wave is large wave volume hint trend direction. This helps identify proper entry point.
This indicator highlights max wave volume and displays the signal and then proper Risk Reward Ratio entry frame.
I defined Change in Behavior as max wave volume (single direction).
Pullback is next wave that does not exceed the starting point of CiB wave (LH sell entry, HL buy entry).
Change in Behavior Signal ○ appears when pullback is determined.
Change in Behavior Setup (Entry frame) appears when condition of Min/Max Pullback is met and follow through wave breaks end point of CiB wave.
This indicator has many other features and they can also help a user identify potential levels of trade entry and which is more bullish or bearish.
In the screenshot below we can see wave volume zones as support and resistance levels. SOT and large wave volume /delta price (yellow colored wave text frame) hint stopping action.
█ Settings
Explains the main settings.
-- General --
Wave size : Allows the User to select wave size from ① Fixed or ② ATR. ② ATR is Factor x ATR(Length).
Display : Allows the User to select how many wave text and zigzag appear.
-- Wave Type --
Wave type : Allows the User to select from Volume or Volume and Time.
Wave Volume / delta price : Displays Wave Volume / delta price.
Simplified value : Allows the User to select wave text display style from ① Divisor or ② Normalized. Normalized use SMA.
Decimal : Allows the User to select the decimal point in the Wave text.
-- Highlight Abnormal Wave --
Highlight Max Wave value (single direction) : Adds marks to the Wave text to highlight the max wave value.
Lookback : Allows the User to select how many waves search for the max wave value.
Highlight Abnormal Wave value (both directions) : Changes wave text size, color or frame color to highlight the abnormal wave value.
Lookback : Allows the User to select SMA length to decide average wave value.
Large/Small factor : Allows the User to select the threshold large wave value and small wave value. Average wave value is 1.
delta price : Highlights large delta price by large wave text size, small by small text size.
Wave Volume : Highlights large wave volume by yellow colored wave text, small by gray colored.
Wave Volume / delta price : highlights large Wave Volume / delta price by yellow colored wave text frame, small by gray colored.
-- Support and Resistance --
Single side Max Wave Volume / delta price : Draws dashed border box from end point of Max wave volume / delta price level.
Single side Max Wave Volume : Draws solid border box from start point of Max wave volume level.
Bias Wave Volume : Draws solid border box from start point of bias wave volume level.
-- Signals --
Bias (Wave Volume / delta price) : Displays Bias mark when large difference in wave volume / delta price before and after.
Ratio : Decides the threshold of become large difference.
3Decrease : Displays 3D mark when a continuous decrease in wave volume.
Shortening Of the Thrust : Displays SOT mark when a continuous decrease in delta price.
Change in Behavior and Pullback : Displays CiB mark when single side max wave volume and pullback.
-- Setups --
Change in Behavior and Pullback and Breakout : Displays entry frame when change in behavior and pullback and then breakout.
Min / Max Pullback : Decides the threshold of min / max pullback.
If you need more information, please read the indicator's tooltip.
█ Conclusion
Weis Wave is powerful interpretation of volume and its tell us potential trend change and entry point which can't find without weis wave.
It's not the holy grail, but improve your chart reading skills and help you trade rationally (at least from VSA perspective).
Wolfe Wave Detector [LuxAlgo]The Wolfe Wave Detector displays occurrences of Wolfe Waves, alongside a target line. A multiple swing detection approach is used to maximize the number of detected waves.
The indicator includes a dashboard with the number of detected waves, as well as the number of reached targets.
🔶 USAGE
The Wolfe Wave pattern is a chart pattern composed of five segments, with the initial segment extremities (points XABCD) forming a channel containing price variations.
After the price reaches point D , we can expect a reversal toward a target line (point E ). The target line is obtained by connecting and extending point X -> C .
The script draws the XABCD pattern and a projection of where E might potentially be located.
The projection is derived from the intersection between the target line and a line starting from D , parallel to B-C . From this line, margins are added, left and right, creating a wedge-shaped figure in most cases.
When the price passes the target line, this is highlighted by a dot. The dot and pattern are green by default when the target is above D and red when the target is below D . Colors can be edited in the settings. The dashed target line is colored in the opposite color.
As seen in the above example, the price trend can reverse after reaching the target line.
🔹 Symmetry
Ideally, the Wolfe Wave must have a degree of symmetry; every upward line should have a similar angle to the other upward lines, and the same should be true for the downward lines.
Also, the lines forming the channel should be as parallel as possible.
Users have the option to adjust the tolerance:
Margin controls the wave symmetry of the pattern
Angle controls the channel symmetry of the pattern
It's important to note that in both cases, a lower number will lead to more symmetrical patterns, but they may appear less frequently.
It is also important to note that increasing the Margin can delay validating the pattern. In the meantime, the price could surpass the channel in the opposite direction, invalidating and deleting the otherwise valid pattern.
🔹 Multiple Swings
Users can set a Minimum Swing length (for example 2) and a Maximum Swing length (for example 100) which defines the range of the swing point detection length, higher values for these settings will detect longer-term Wolfe patterns, while a larger range will allow for the detection of a larger number of patterns.
By using multiple swings, it is possible to find smaller next to larger patterns at the same time.
The dashboard shows the number of patterns found and targets reached. When, for example, bullish patterns are disabled in the settings, the dashboard only shows the results of bearish patterns.
🔹 Extend Target Line
The publication includes a setting that allows the Target Line to be extended up to 50 bars further. As seen in the above example, the Target Line can still be reached even after the pattern has been finalized. Once the Target Line is reached, it won't be updated further.
Here is another example of a Target Line being reached later on.
The Target Line acted as a support level, after which where the price changed direction.
🔹 Show Progression
An option is included to show the progression before the pattern is completed. Users can make use of the XABC pattern or visualize where point D should be positioned.
The focus lies on the bar range (between the left and right borders of the grey rectangle). The pattern is considered invalid and deleted when point D is beyond these limits. The height of the rectangle is optional. Ideally, the price should be located between the top and bottom of the rectangle, but it is not mandatory.
Show Progression has three options including:
Full: Show all lines of XABC plus line C-D and rectangle for the position of point D
Partial: Show line C-D and rectangle for the position of point D
None: Only show valid completed patterns
The 'Partial' option in the 'Show Progression' feature is designed to help users locate the desired position of point D without the visual clutter caused by the XABC lines. This can be useful for those who prefer a cleaner visual representation of the evolving pattern.
🔶 SETTINGS
🔹 Swing Length
Minimum: Minimum length used for the swing detection.
Maximum Swing Length: Maximum length used for the swing detection.
🔹 Tolerance
Margin: Influences the symmetry of the pattern; with a higher number allowing for less symmetry.
Angle: Influences the symmetry of the channel; with a higher number allowing for less symmetry.
🔹 Style
Toggle: Bullish/Bearish + colors
Extend Target Line: Extend a maximum of 50 bars or until Target Line is reached
Show Progression: Show pattern progression
Dot Size: The size of the dot when the Target Line is reached
🔹 Dashboard
Show Dashboard: Toggle dashboard which shows the number of found patterns and targets reached.
Location: Location of the dashboard on the chart.
Text Size: Text size.
🔹 Calculation
Calculated Bars: Allows the usage of fewer bars for performance/speed improvement

Enhanced WaveTrend OscillatorThe Enhanced WaveTrend Oscillator is a modified version of the original WaveTrend. The WaveTrend indicator is a popular technical analysis tool used to identify overbought and oversold conditions in the market and generate trading signals. The enhanced version addresses certain limitations of the original indicator and introduces additional features for improved analysis and comparison across assets.
WaveTrend:
The original WaveTrend indicator calculates two lines based on exponential moving averages and their relationship to the asset's price. The first line measures the distance between the asset's price and its EMA, while the second line smooths the first line over a specific period. The result is divided by 0.015 multiplied by the smoothed difference ('d' for reference). The indicator aims to identify overbought and oversold conditions by analyzing the relationship between the two lines.
In the original formula, the rudimentary estimation factor 0.015 times 'd' fails to accomodate for approximately a quarter of the data, preventing the indicator from reaching the traditional stationary levels of +-100. This limitation renders the indicator quantitatively biased, as it relies on the user's subjective adjustment of the levels. The enhanced version replaces this factor with the standard deviation of the asset's price, resulting in improved estimation accuracy and provides a more dynamic and robust outcome, we thereafter multiply the result by 100 to achieve a more traditional oscillation.
Enhancements and Features:
The enhanced version of the WaveTrend indicator addresses several limitations of the original indicator and introduces additional features-
Dynamic Estimation: The original indicator uses an arbitrary estimation factor, while the enhanced version replaces it with the standard deviation of the asset's price. This modification provides a more dynamic and accurate estimation, adapting to the specific price characteristics of each asset.
Stationary Support and Resistance Levels: The enhanced version provides stationary key support and resistance levels that range from -150 to 150. These levels are determined based on the analysis of the indicator's data and encompass more than 95% of the indicator's values. These levels offer important reference points for traders to identify potential price reversals or significant price movements.
Comparison Across Assets: The enhanced version allows for better comparison and analysis across different assets. By incorporating the standard deviation of the asset's price, the indicator provides a more consistent and comparable interpretation of the market conditions across multiple assets.
Upon closer inspection of the modification in the enhanced version, we can observe that the resulting indicator is a smoothed variation of the Z-Score!
f_ewave(src, chlen, avglen) =>
basis = ta.ema(src, chlen)
dev = ta.stdev(src, chlen)
wave = (src - basis) / dev * 100
ta.ema(wave, avglen)
Z-Score Analysis:
The Z-Score is a statistical measurement that quantifies how far a particular data point deviates from the mean in terms of standard deviations. In the enhanced version, the calculation involves determining the basis (mean) and deviation (standard deviation) of the asset's price to calculate its Z-Score, thereafter applying a smoothing technique to generate the final WaveTrend value.
Utility:
The 𝗘𝗻𝗵𝗮𝗻𝗰𝗲𝗱 𝗪𝗧 indicator offers traders and investors valuable insights into overbought and oversold conditions in the market. By analyzing the indicator's values and referencing the stationary support and resistance levels, traders can identify potential trend reversals, evaluate market strength, and make better informed analysis.
It is important to note that this indicator should be used in conjunction with other technical analysis tools and indicators to confirm trading signals and validate market dynamics.
Credit:
The 𝗘𝗻𝗵𝗮𝗻𝗰𝗲𝗱 𝗪𝗧 indicator is a modification of the original WaveTrend Oscillator developed by @LazyBear on TradingView.
Example Charts:
Elliott Wave [LuxAlgo]The Elliott Wave indicator allows users to detect Elliott Wave (EW) impulses as well as corrective segments automatically on the chart. These are detected and displayed serially, allowing users to keep track of the evolution of an impulse or corrective wave.
Fibonacci retracements constructed from detected impulse waves are also included.
This script additionally allows users to get alerted on a wide variety of trigger conditions (see the ALERTS section below).
🔶 SETTINGS
🔹 Source
• "high" -> options high, close, maximum of open/close
• "low" -> options low, close, minimum of open/close
🔹 ZigZag
• The source and length are used to check whether a new Pivot Point is found.
Example:
• source = high/low, length = 10:
• There is a new pivot high when:
- previous high is higher than current high
- the highs of 10 bars prior to previous high are all lower
• These pivot points are used to form the ZigZag lines, which in their turn are used for pattern recognition
🔶 USAGE
The basic principles we use to identify Elliott Wave impulses are:
• A movement in the direction of the trend ( Motive/Impulse wave ) is divided in 5 waves (Wave 1 -> 5)
• The Corrective Wave (against the trend) is divided in 3 waves (Wave A -> C)
• The waves can be subdivided in smaller waves
• Wave 2 can’t retrace more than the beginning of Wave 1
• Wave 4 does not overlap with the price territory of Wave 1
Here we see an example:
Let's look at the development:
• 1 bar after point (5) a confirmed 5 Motive Wave pattern is found (1 -> 5; The 5 Waves can also be seen as one large Wave 1 ).
• Next, the script draws a set of Fibonacci lines, which are area's where the Corrective Wave potentially will bounce.
Here we see the fifth wave is getting larger, the previous highest point is updated, and the Wave 5 is larger than Wave 3 :
(At this point, the pattern is invalidated, and it display as dotted)
Further progression in time:
At this point, a confirmed " 3 Corrective Wave pattern " is found (a -> c)
When a new high has developed, a circle is drawn (in the same color of the lines)
However, when the bottom of the drawn box has breached, a red cross will be visualized.
Further progression:
Later on, a bearish confirmed " 5 Motive Wave pattern " is found (1 -> 5):
When a Corrective Wave becomes invalidated, the ABC pattern will display as dashed (not dotted):
🔶 TECHNIQUES
Pine Script™ introduces methods!
• More information can be found here:
• Pine Script™ v5 User Manual 👉 Methods
• Pine Script™ language reference manual 👉 method
🔶 ALERTS
Dynamic alerts are included in the script, you only need to set 1 alert to receive following messages:
• When a new EW Motive Pattern is found (Bullish/Bearish )
• When a new EW Corrective Pattern is found (Bullish/Bearish )
• When an EW Motive Pattern is invalidated (Bullish/Bearish )
• When an EW Corrective Pattern is invalidated (Bullish/Bearish )
• When possible, a start of a new EW Motive Wave is found (Bullish/Bearish )
• Here is information how you can set these alerts()

Function Sawtooth WaveThis is an indicator to draw a sawtooth wave on the chart.
It can be a useful perspective, as decaying markets tend to oscillate in reverse sawtooth waves, and bullish markets can oscillate in conventional sawtooth waves. With the right inputs, it can be an early warning signal for potential movements.
Something I've noted is that large waves cause a ripple effect and sets the frequency for the market until a change occurs. Sawtooth waves may help in capturing ripple waves.
Useful inputs are:
- Average True Range as wave height (amplitude)
- Periodicity of market as wave duration (frequency)
(Inputs will change the wave from conventional to reverse)
I hope that it is helpful.
GLHF
- DPT

ZigZag Multi [TradingFinder] Trend & Wave Lines - Structures🔵 Introduction
"Zigzag" is an indicator that forms based on price changes. Essentially, the function of this indicator is to connect consecutive and alternating High and Low pivots. This pattern assists in analyzing price changes and can also be used to identify classic patterns. "Zigzag" is an analytical tool that, by filtering partial price movements based on the specified period, can identify price waves across different time frames (short or long term).
🔵 Reason for Creation
The combination of "short term zigzag" and "long term zigzag" enhances accuracy and reduces analysis time. In a time frame, "long term zigzag" represents the main trend, while "short term zigzag" depicts short-term waves.
🔵 How to Use
After selecting the desired time frame and adding "zigzag" to the chart, begin utilization. Keep in mind to identify the main market trend from "long term zigzag" and the minor waves from "short term zigzag".
🟣 Important: Additionally, classic patterns such as HH, LH, LL, and HL can be recognized. All traders analyzing financial markets using classic patterns and Elliot Waves can benefit from the "zigzag" indicator to facilitate their analysis.
🔵 Settings
Short term zigzag : In this section, you can adjust settings such as time frame range, display mode, color, and line width of the zigzag lines.
Short term label : This section allows you to activate or deactivate the display of zigzag labels according to your needs. You can also customize their color and size.
Long term zigzag : Here, you can adjust settings for time frame range, display mode, color, and line width of zigzag lines.
Long term label : Similar to short term label settings.
The recommended time frame for "long term zigzag" is between 9 to 15, and for "short term zigzag" is between 3 to 5.
🟣 Important Notes :
Considering the different behaviors of financial markets and various time frames, it is recommended to experiment with different time frame settings when using "zigzag" to find the best settings for each symbol and time frame, thereby preventing potential errors.
🟣 Terminology Explanations :
"HH": When the price is higher than the previous peak (Higher High).
"HL": When the price is higher than the previous low (Higher Low).
"LH": When the price is lower than the previous peak (Lower High).
"LL": When the price is lower than the previous low (Lower Low).

ZigZag WavesHello All,
I am here with a new idea and script, " Zigzag Waves ". This indicator creates 3 Zigzags with different lengths, keeps the lengths of each zigzag wave and calculates/draws average waves for each zigzag. optionally it can reset the wave when zigzag direction changes and new highest/lowest found. And optionally it draws Exponential Moving Average(EMA) of the sum of waves. This idea is very new and at the moment there is no optimization for the Zigzag Periods. Maybe we altogether can improve the idea and find the best zigzag periods for different symbols and time frames.
Using the options You can play with the periods, add/remove EMA, set its color and reset the waves on new Highest/Lowest. As far as I see resetting the waves on new Highest/Lowest may bring better results.
if we enable "Reset the waves on new Highest/Lowest":
Using different periods and EMA length:
P.S. if you have ideas to improve this script, drop a comment under the script please.
Enjoy!

Filtered Waves [NXT2017] #Linda Raschke #basics on Arthur MerrilHI BIG PLAYERS,
this script I wrote for an enquiry of a tradingview-user. It should represent the Filtered Waves idea from Arthur Merril and used by Linda Raschke.
It's similar like a visualization of Elliott Waves.
On YouTube title "MTA UK Chapter Presentation with Linda Raschke" between 34-36 minutes Linda Raschke shows the rules for her Filterd Waves.
Any questions? Ask me!
King regards
NXT2017
========
TO MY PERSON
I'm the second winner of the official German Forex Trading Competition in 2018.
Look here to the ranks:
deutsche-trading-meisterschaften.de
I speak german, english and russian.
My strength in trading are Wolfe Wave pattern.

SuperWaveTrendWaveTrend with Crosses + HyperWave + Confluence Zones + Thresholds
SuperWaveTrend — Advanced Momentum System Integrating WaveTrend, HyperWave, Confluence Zones & Threshold Filters
SuperWaveTrend is an enhanced momentum indicator built upon the classic WaveTrend (WT) framework.
It integrates HyperWave extreme zones, top/bottom Confluence Zones, trend hesitation Threshold regions, WT crossover reversal signals, and more.
This indicator is suitable for:
• Trend following
• Swing trading
• Reversal spotting
• Overbought/oversold structure analysis
• Extreme market sentiment detection
Whether you’re scalping or planning swing entries, SuperWaveTrend offers a more precise and visually intuitive momentum structure.
Key Features
1. WaveTrend Core Structure (WT1 / WT2)
• WT1: Primary momentum line
• WT2: Signal line
• Momentum Spread Area (WT1 − WT2) visualization highlights shifts in trend strength
2. HyperWave Extreme Momentum Zones
Background highlight automatically appears during extreme momentum conditions:
• Purple-red: Extreme bullish zone
• Orange: Extreme bearish zone
Helps identify:
• Blow-off tops
• Panic sell-offs
• Extreme trend continuation phases
3. Confluence Zones (Top/Bottom Resonance)
Combines overbought/oversold signals with momentum structure to mark:
• Gold top zones → weakening bullish momentum
• Blue bottom zones → weakening bearish momentum
Useful for detecting:
• Bearish divergence tops
• Reversal bounces
• High-level exhaustion / low-level capitulation
4. Threshold Hesitation Zone (Gray)
When WT1 and WT2 converge tightly, a gray background highlights:
• Unclear direction
• Trend weakening
• Higher risk of false signals
Generally not recommended for new entries.
5. WT Crossover Signals (Cross Signals)
WT1 and WT2 crossovers are marked with color-coded dots:
• Green: Bullish cross
• Red: Bearish cross
A core signal for capturing reversal shifts.
⚠️ Creator’s Disclaimer & Usage Insights
***WARNING***
SuperWaveTrend is not designed for extremely strong one-sided trends.
During highly impulsive markets, signals may become delayed or less reliable.
Optimal Timeframes
Based on extensive backtesting, In swing-trading environments, the indicator performs most effectively on the 1H–4H timeframes, where momentum cycles form cleanly and Confluence Zones provide high-probability setups.
Trading Insights
• In swing-trading environments, Confluence Zones often coincide with excellent long/short opportunities, especially when momentum exhaustion is confirmed.
• When paired with a Bollinger Bands framework, the system exhibits significantly improved accuracy and structure clarity.
Have fun,
BigTrunks

OBV + WaveTrend Volume Scalper [GratefulFutures]This script is a combination script of three different strategies that provides buy and sell signals based on the change of volume with momentum confirmations.
Sources used:
This script relies on the outstanding scripts of the great script writer LazyBear: LazyBear
The following scripts were used in this publication:
1. A modified "On-Balance Volume Oscillator" modified from LazyBear's original script:
2. Wavetrend Oscillator with crosses, Author: LazyBear
3. Squeeze Momentum Oscillator, Author: LazyBear
This script functions based on the following criteria being true:
1. On balance volume oscillator turning from negative to positive (buy) or positive to negative (sell)
2. Squeeze Momentum value is increasing (buy) or decreasing (sell)
3. Wavetrend 1 (wt1) is greater than wavetrend 2 (wt2) (buy)/ Wavetrend 1 (wt1) is less than wavetrend 2 (wt2) (sell)
By combining these factors the indicator is able to signal exactly when net buying turns to net selling (OBV) and when this change is most advantageous to continue based on the momentum and price action of the underlying asset (SQMOMO and Wavetrend).
This allows you to pair volume and price action for a powerful tool to identify where price will reverse or continue providing exceptional entries for short term trades, especially when combined with other aspects such as support and resistance, or volume profile.
How to use:
Simply adjust the settings to your preference and read the given signals as generated.
Settings
There are multiple ways to tune the signals generated. It is set standard for my preferred use on a 1 minute chart.
OBV Oscillator Settings
The first 4 dropdowns in the Inputs section tune the On Balance Volume Oscillator (OBVO) portion of the indicator. You can choose if you want it to calculate based on close, open, high, low, or other value.
The most impactful in the entire settings is going to be the length and smoothing of the OBVO EMA. Making this number lower increasing the sensitivity to changes in volume, making the signals come quicker but is more susceptible to quick fluctuations. A value of between (5-20) is reasonable for the OBVO EMA length. There is a separate smoothing factor titled OBV Smoothing Length and below that, OBV Smoothing Type , a value of (2) is standard with "SMA" for smoothing type with a value of between 2-10 being reasonable. You may also play with these values to see what you like for your trading style.
Wavetrend Settings
The next 3 options are to modify the wavetrend portion of the indicator. I do not modify these from standard, and feel that they work appropriately on all time frames at the following values: n1 length (10), n2 length (20), Wavetrend Signal SMA length (4)
Squeeze Momentum Settings
The following 5 options through the end modify the Squeeze momentum portion of the indicator. The only one that modifies the signals generated is the KC Length , Making this number lower increasing the sensitivity to changes in price action, making the signals come quicker but is more susceptible to quick fluctuations. A value of between (18-25) is reasonable for KC Length .
Style Setting
You may select if you want to see the buy and sell signals. The following 5 options Raw OBV Osc through Squeeze Momentum allow you to see where each specific requirement was met, posted as a vertical line, but for live use it is recommended to turn all of these vertical lines off and only use the buy and sell signals.
Time Frames:
While this script is most effective on shorter time frames (1 minute for scalping and daytrading) it is also viable to use it on longer timeframes, due to the nature of its components being independent of time frame.
Examples of use - (Green and red vertical lines are for visualization purpose and are not part of the script)
SPY 1 Minute (Factory Settings):
SPX 15 minutes (Factory Settings):
Considerations
This script is meant primarily for short term trading, trades on the basis of seconds to minutes primarily. While they can be a good indication of volume lining up with momentum, it is always wise to use them in combination with other factors such as support, resistance, market structure, volume levels, or the many other techniques out there...
As Always... Happy Trading.
-Not_A_Mad_Scientist (GreatfulFutures Trade University)

Wolfe Wave PatternHello All!
For a while now, some of my followers have been asking me to develop Wolfe Wave Pattern . Here it's at your service as open-source and public indicator.
How it works?
- On each bar/tick it checks zigzag waves by using base period and updates the array that is used to keep zigzag levels and locations. Base period in the settings is the minimum zigzag period
- Then it searches if there is new bullish/bearish Wolfe Wave pattern according to last wave direction
- Before searching the pattern it calculates all possible 1234 waves. So any wave in 12345 uses base period or higher. it means that it search all possible candidates. This algorithm is much better than using a few zigzag periods.
- After getting all possible candidates, it checks if any of the found candidates is suitable for Wolfe Wave pattern and keeps them in a matrix
- if there are suitable candidate(s) it shows the latest one and triggers the alert
- it also follows the targets and if the price hits any of the target it extends the line and trigger the alert
- it doesn't check if any of the patterns hits stop-loss.
Options:
Base Period: minimum period to create the zigzag
Error Rate: there are usually so few perfect patterns, so we better consider deviation. if error rate is low than it finds less pattern with more accuracy, if error rate is high than it finds more pattern with less accuracy
- The other options are used for coloring the patterns and lines
Some examples:
P.S. I didn't have enough time to test the indicator, so please drop a comment if you see any issue while using it
Enjoy!
