Momentum Charge Theory (MCT)-(TechnoBlooms)The Momentum Charge Theory (MCT) Indicator is an advanced physics and mathematics-inspired trend detection system designed to identify market energy shifts with precision. Unlike traditional indicators that rely on static formulas, MCT integrates entropy, volatility, kinetic energy, and wavelet transforms to map price dynamics in real time.
Built on Scientific Principles – This indicator applies quantum-inspired charge-discharge mechanics to spot early trend formations and reversals. Think of price action like an energy system: it charges (builds momentum) before an explosive move and discharges when that energy dissipates.
Core Concepts Behind MCT
1️⃣ Directional Market Entropy – Measuring Trend Strength
Entropy quantifies market randomness – is the trend structured or chaotic?
✅ A high-entropy market is uncertain (choppy price action), while a low-entropy market signals a strong directional trend.
✅ MCT normalizes entropy, allowing traders to differentiate trend acceleration from market noise.
2️⃣ Information Flow Volatility – Identifying Breakout Zones
Inspired by Econophysics, this component measures volatility based on information flow rather than simple price movements.
✅ Helps spot high-volatility breakout conditions before they occur.
✅ Filters out false breakouts caused by random market noise.
3️⃣ Kinetic Energy Momentum (KEM) – The Physics of Price Acceleration
Just like in physics, momentum is a function of mass and velocity – in trading, this translates to volume and price change.
✅ Uses kinetic energy equations to identify price acceleration zones.
✅ Helps detect momentum shifts before price visibly reacts.
4️⃣ Hilbert Transform Approximation – Slope & Trend Direction Analysis
Applies Hilbert Transforms to estimate trend angle shifts.
✅ Detects momentum decay and early reversal signals.
✅ Captures the true trend slope rather than relying on lagging moving averages.
5️⃣ Wavelet Transform – Advanced Noise Filtering & Trend Confirmation
Market movements contain multiple frequencies – wavelet transforms isolate dominant trends while removing short-term price noise.
✅ Improves trend clarity by reducing false signals.
✅ Acts as a final confirmation filter before generating Charge & Discharge signals.
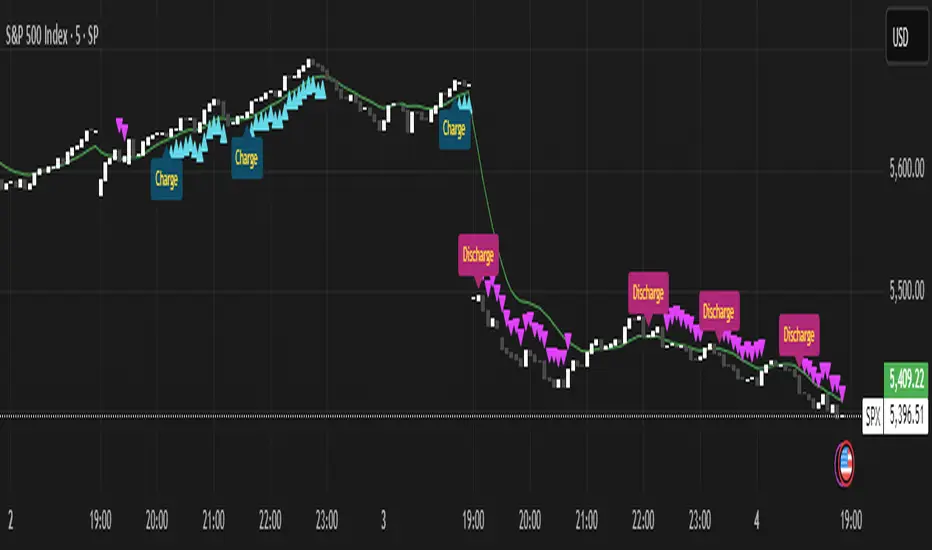
Charge & Discharge – The Energy Behind Market Moves
🔹 Charge (Uptrend Activation)
A blue triangle appears below the candle when market conditions align for a strong bullish move.
📈 Indicates momentum buildup, low entropy, and trend strength confirmation.
🔸 Discharge (Downtrend Activation)
A purple triangle appears above the candle when price momentum weakens and market entropy increases.
📉 Suggests a potential trend exhaustion or reversal.
Best Use Cases for Traders
✅ Momentum Traders – Catch trend initiations before they gain full traction.
✅ Breakout Traders – Identify high-information flow zones with volatility-driven signals.
✅ Trend Followers – Avoid false signals by relying on entropy-driven confirmations.
The MCT indicator can be combined with any of your usual indicators for trend confirmation.
ค้นหาในสคริปต์สำหรับ "wave"
Neon Momentum Waves StrategyIntroduction
The Neon Momentum Waves Strategy is a momentum-based indicator designed to help traders visualize potential shifts in market direction. It builds upon a MACD-style calculation while incorporating an enhanced visual representation of momentum waves. This approach may assist traders in identifying areas of increasing or decreasing momentum, potentially aligning with market trends or reversals.
How It Works
This strategy is based on a modified MACD (Moving Average Convergence Divergence) method, calculating the difference between two Exponential Moving Averages (EMAs). The momentum wave represents this difference, while an additional smoothing line (signal line) helps highlight potential momentum shifts.
Key Components:
Momentum Calculation:
Uses a fast EMA (12-period) and a slow EMA (26-period) to measure short-term and long-term momentum.
A signal line (20-period EMA of the MACD difference) smooths fluctuations.
The histogram (momentum wave) represents the divergence between the MACD value and the signal line.
Interpreting Momentum Changes:
Momentum Increasing: When the histogram rises above the zero line, it may indicate strengthening upward movement.
Momentum Decreasing: When the histogram moves below the zero line, it may signal a weakening trend or downward momentum.
Potential Exhaustion Points: Users can define custom threshold levels (default: ±10) to highlight when momentum is significantly strong or weak.
Visual Enhancements:
The neon glow effect is created by layering multiple plots with decreasing opacity, enhancing the clarity of momentum shifts.
Aqua-colored waves highlight upward momentum, while purple waves represent downward momentum.
Horizontal reference lines mark the zero line and user-defined thresholds to improve interpretability.
How It Differs from Traditional Indicators
Improved Visualization: Unlike standard MACD histograms, this approach provides clearer visual cues using a neon-style wave format.
Customizable Thresholds: Rather than relying solely on MACD crossovers, users can adjust sensitivity settings to better suit their trading style.
Momentum-Based Approach: The strategy is focused on visualizing shifts in momentum strength, rather than predicting price movements.
Potential Use Cases
Momentum Trend Awareness: Helps traders identify periods where momentum appears to be strengthening or fading.
Market Structure Analysis: May complement other indicators to assess whether price action aligns with momentum changes.
Flexible Timeframe Application: Can be used across different timeframes, depending on the trader’s strategy.
Important Considerations
This strategy is purely momentum-based and does not incorporate volume, fundamental factors, or price action confirmation.
Momentum shifts do not guarantee price direction changes—they should be considered alongside broader market context.
The strategy may perform differently in trending vs. ranging markets, so adjustments in sensitivity may be needed.
Risk management is essential—traders should apply proper stop-losses and position sizing techniques in line with their risk tolerance.
Conclusion
The Neon Momentum Waves Strategy provides a visually enhanced method of tracking momentum, allowing traders to observe potential changes in market strength. While not a predictive tool, it serves as a complementary indicator that may help traders in momentum-based decision-making. As with any technical tool, it should be used as part of a broader strategy that considers multiple factors in market analysis.

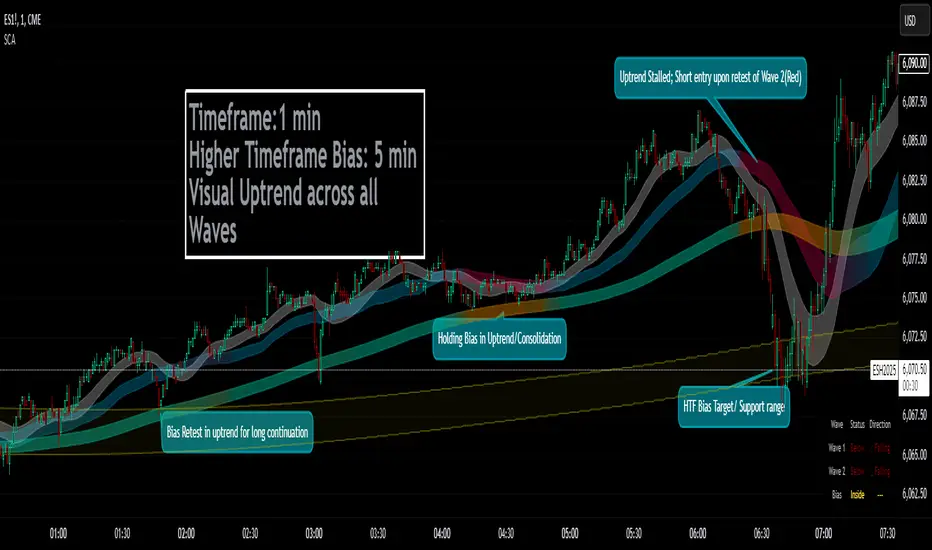
Smoothed Candle Averages- NovaTheMachineThis script utilizes a series of moving averages that the user is able to change as they see fit for their own use.
The averages plotted for the first 2 waves are the High-Low rays of the selected period of time with the chosen moving average style.
The Bias is the Heikin Ashi High-Low ray plotted over the chosen time period, while the Secondary Bias is a higher Timeframe Bias for the same period of time on a selected higher timeframe.
The visuals for each ray are able to be changed to either; lines, solid wave, or dynamic wave.
The Dynamic waves will change color according to the total dissection and utilize the Min-Max range selected as a weight for the strength of the trend. Thus providing an at-a-glance overview of the price relative to trend.
The key objective with this script is to gauge the longer term trend with the current price action, to establish patterns and determine strength of moves both away from and towards the moving average/bias.
When both waves are trending with the Bias, it can be reasoned that there is a strong trend established, when waves and Bias are mixed or trending sideways it can be reasoned there is a range forming or potential for a direction change. When price has broken the waves and biases we can reasonably assume that a new trend has been formed, using the waves and biases again to determine the strength and length of the trend.
The Table will display whether the current price is above or below each wave, and whether the price is continuing or retracing. The Signals plotted are used to help identify when price has broken a wave more swiftly.
Dow waveform analyzerDow Waveform Analyzer
1. Overview and Features of the Indicator
This indicator is a tool designed to analyze chart waveforms based on Dow Theory, identifying swing lows (support) and swing highs (resistance). It allows users to quickly and consistently determine trend direction. Compared to manual analysis, it provides more efficient and accurate results.
By using swing lows and swing highs, the indicator offers a more detailed understanding of trends than simple updates to highs and lows, aiding in the creation of effective trading strategies.
2. Identifying Wave Lows and Highs
Stock prices do not move in straight lines; instead, they rise and fall in waves. This indicator starts by identifying the wave lows and wave highs.
- Wave Low: The lowest point during a temporary price decline.
- Wave High: The highest point during a temporary price increase.
These are automatically identified using Pine Script’s built-in functions `pivotlow` and `pivothigh`.
3. Drawing the Waveform
The identified wave lows and highs are alternately connected to draw the waveform. However, there are cases where wave lows or highs occur consecutively:
- Consecutive Wave Lows: The lower low is used for drawing the waveform.
- Consecutive Wave Highs: The higher high is used for drawing the waveform.
4. Tracking Swing Lows/Highs and Trend Determination
Swing lows and swing highs are crucial markers that indicate the state of wave progression:
- Swing Low: The starting point of a wave (wave low) when the closing price exceeds the previous wave high.
- Swing High: The starting point of a wave (wave high) when the closing price falls below the previous wave low.
The changes in swing lows and swing highs as the waves progress allow for trend state determination.
5. Examples of Trend States
During an Uptrend:
- When the price surpasses a wave high, the swing low is updated, confirming the continuation of the uptrend.
End of an Uptrend:
- When the price falls below the swing low, the swing low disappears, and a swing high appears, signaling the end of the uptrend.
Sideways Movement:
- Swing lows and swing highs alternately appear, indicating a sideways trend.
Start of a Downtrend:
- When the price breaks below a wave low for the first time, the swing high is updated, confirming the start of the downtrend.
During a Downtrend:
- When the price breaks below a wave low, the swing high is updated, confirming the continuation of the downtrend.
End of a Downtrend:
- When the price surpasses a wave high, the swing high disappears, and a swing low reappears, signaling the end of the downtrend.
Restart of an Uptrend:
- When the swing low is updated, the uptrend resumes. The uptrend begins when the price surpasses a wave high, and the swing low is updated for the first time.
6. Applications
Trade Entries and Exits:
- Set stop orders for entry at the price level where a trend starts.
- Set stop orders for exit at the price level where a trend ends.
Trend Filtering:
- Use the indicator to confirm whether market conditions are suitable for entry based on the trend state. Analyze waveforms to aid trading strategies.
Guide for Drawing Trendlines:
- Utilize wave lows and highs as starting and ending points when drawing trendlines with drawing tools.
7. Parameters and Display Items
Pivot Points:
- Wave lows are marked with circles below the candlestick’s low, and wave highs are marked with circles above the candlestick’s high.
Number of Bars for Pivot Calculation:
- Specify the number of bars on either side used to identify highs (default: 2).
Waveform:
- Specify the color (default: blue) or toggle its visibility (default: visible).
Swing Lows/Highs:
- Displayed as large circles. The rightmost large circle on the chart indicates the current swing low or swing high. Historical swing points are also displayed to show the progression of state changes. Specify the color (default: green) or toggle visibility (default: visible).
1. インジケーターの概要と特徴
このインジケーターは、ダウ理論を基にチャートの波形を分析し、押し安値や戻り高値を特定するツールです。これにより、トレンドの方向を迅速かつ一貫して判断できます。手動での分析と比較して、効率的かつ精度の高い結果が得られる点が特徴です。
押し安値や戻り高値を利用することで、単純な高値・安値の更新よりも詳細にトレンドの状況を把握し、効果的な取引戦略の構築に役立ちます。
2. 波の谷と波の頂の特定
株価は直線的に動くのではなく、波を描きながら上昇や下落を繰り返します。このインジケーターは、まず波の谷と波の頂を特定するところから始まります。
波の谷: 一時的な下落の最安値
波の頂: 一時的な上昇の最高値
これらを Pine Script の内蔵関数(ピボットローとピボットハイ)を用いて自動的に特定しています。
3. 波形の描画方法
特定した波の谷と波の頂を交互に結んで波形を描画します。ただし、波の谷や頂が連続する場合があります。
波の谷が連続する場合: より低い谷を採用して波形を描く
波の頂が連続する場合: より高い頂を採用して波形を描く
4. 押し安値・戻り高値の追跡とトレンド判断
押し安値と戻り高値は、波の進行状況を示す重要な指標です。
押し安値: 終値が前回の高値を超えた際の波の谷
戻り高値: 終値が前回の安値を割り込んだ際の波の頂
波の進行に伴う押し安値・戻り高値の変化から、トレンドの状態を判断します。
5. トレンド状態の具体例
上昇トレンド中:
波の頂を株価が上抜け押し安値が更新され続けることで上昇トレンドを継続。
上昇トレンドの終了:
株価が押し安値を割ると、押し安値が消え、戻り高値が新たに出現して、上昇トレンドを終了。
横ばい状態:
押し安値と戻り高値が交互に切り替わる。
下降トレンドの開始:
波の谷を株価が下抜け戻り高値がはじめて更新されることで下降トレンド開始を確認。
下降トレンド中:
波の谷を株価が下抜け戻り高値が更新され続けることで下降トレンドを継続。
下降トレンドの終了:
株価が波の頂を超えると、戻り高値が消え、押し安値が再び出現して、下降トレンドを終了。
横ばい状態:
押し安値と戻り高値が交互に切り替わる。
上昇トレンドの再開:
押し安値が更新されることで上昇トレンドを確認。
波の頂を株価が上抜け押し安値がはじめて更新されることで上昇トレンド開始を確認。
6. 応用例
トレードのエントリーとエグジット:
トレンド発生の価格に逆指値を設定してエントリー。
トレンド終了の価格に逆指値を設定してエグジット。
トレンドフィルターとして活用:
エントリーに適したトレンド状況かを確認。波形を分析してトレード戦略の参考に。
トレンドラインを描く時の参考として活用:
波の谷と頂を描画ツールを使ってトレンドラインを描く時の起点や終点として活用。
7. パラメーターと表示項目
ピボット: 波の谷はローソク足の安値にサークルを表示、波の頂はローソク足の高値にサークルを表示。
ピボット計算用のバーの数: 高値を特定するために左右何本のローソク足を使用するかを設定(初期値: 2)。
波形: 色(初期値: 青)や表示(初期値: 表示)の指定。
押し安値・戻り高値: 大きなサークルで表示。チャートの一番右の大きなサークルが現在のもの。過去のものも状態変化の経緯を示すために表示。色(初期値: 緑)や表示(初期値: 表示)の指定。

Quarterly Sine Wave with Moving Averages - AYNETDescription
Sine Wave:
The sine wave oscillates with a frequency determined by frequency.
Its amplitude (amplitude) and vertical offset (offset) are adjustable.
Moving Averages:
Includes options for different types of moving averages:
SMA (Simple Moving Average).
EMA (Exponential Moving Average).
WMA (Weighted Moving Average).
HMA (Hull Moving Average).
The user can choose the type (ma_type) and the length (ma_length) via inputs.
Horizontal Lines:
highest_hype and lowest_hype are horizontal levels drawn at the user-specified values.
Quarter Markers:
Vertical lines and labels (Q1, Q2, etc.) are drawn at the start of each quarter.
Customization Options
Moving Average Type:
Switch between SMA, EMA, WMA, and HMA using the dropdown menu.
Sine Wave Frequency:
Adjust the number of oscillations per year.
Amplitude and Offset:
Control the height and center position of the sine wave.
Moving Average Length:
Change the length for any selected moving average.
Output
This indicator plots:
A sine wave that oscillates smoothly over the year, divided into quarters.
A customizable moving average calculated based on the chosen price (e.g., close).
Horizontal lines for the highest and lowest hype levels.
Vertical lines and labels marking the start of each quarter.
Let me know if you need additional features! 😊

ABC on Recursive Zigzag [Trendoscope]There are several implementations of ABC pattern in tradingview and pine script. However, we have made this indicator to provide users additional quantifiable information along with flexibility to experiment and develop their own strategy based on the patterns.
🎲 Highlights of this indicator over other ABC implementations are:
Implementation is based on recursive multi level zigzag allows bigger as well as smaller patterns to be identified
Allows users to set their trading rules with respect to entry, target and stop ratios, experiment and build their own strategy based on the ABC pattern.
Back test summary including win ratio and risk reward will help users understand the profitability based on different settings being used.
🎲 Concept of ABC Pattern
The ABC pattern, also known as the "Corrective Wave" or "Zigzag Pattern," is a fundamental concept in Elliott Wave Theory, which is widely used in technical analysis to identify and predict price movements in financial markets.
The ABC pattern is a three-wave corrective pattern that typically occurs within the context of a larger impulse or trending wave. It consists of two smaller waves in the opposite direction (A and C) separated by a corrective wave (B). These waves are labeled alphabetically and represent price movements.
Wave A (Impulse Wave): Wave A is the first leg of the ABC pattern and is characterized by a strong price move in the opposite direction of the prevailing trend. It is often driven by a fundamental or sentiment-driven event that temporarily disrupts the trend.
Wave B (Corrective Wave): Wave B is the corrective wave that follows Wave A. It represents a partial retracement of Wave A's price movement. Wave B can take various forms, such as a simple correction or a complex correction (e.g., a triangle or a flat correction). It typically doesn't retrace the entire length of Wave A.
Wave C (Impulse Wave): Wave C is the final leg of the ABC pattern and is characterized by a strong price move in the same direction as the prevailing trend. It often surpasses the starting point of Wave A and confirms the resumption of the larger trend.
🎲 Indicator Components
Upon loading the indicator on the chart, we can observe the following components on the chart.
Pattern Drawings is the graphical representation of present patterns. Please note that it is not necessary for patterns to be there on the chart all the time. Patterns will appear on the chart when price makes the patterns.
Trade Box is the box representing trade signals of the pattern. These trade levels are generated based on the user settings.
Summary Table is the back test summary containing details of historical pattern performance including Win Ratio and Risk Reward.
🎲 Indicator Settings
Details of each user settings are provided in the tooltips. Below is the snapshot of it.
🎲 Alerts
Basic level of alerts are built in the script using alert function to highlight the following conditions:
New ABC Pattern
Updates to existing Pattern
Both conditions will alert simple text messages. There is not much customization provided as part of this indicator. We will consider providing more options in future versions based on the interest and demand shown by users.

Bitcoin Market Cap wave model weeklyThis Bitcoin Market Cap wave model indicator is rooted in the foundation of my previously developed tool, the : Bitcoin wave model
To derive the Total Market Cap from the Bitcoin wave price model, I employed a straightforward estimation for the Total Market Supply (TMS). This estimation relies on the formula:
TMS <= (1 - 2^(-h)) for any h.This equation holds true for any value of h, which will be elaborated upon shortly. It is important to note that this inequality becomes the equality at the dates of halvings, diverging only slightly during other periods.
Bitcoin wave model is based on the logarithmic regression model and the sinusoidal waves, induced by the halving events.
This chart presents the outcome of an in-depth analysis of the complete set of Bitcoin price data available from October 2009 to August 2023.
The central concept is that the logarithm of the Bitcoin price closely adheres to the logarithmic regression model. If we plot the logarithm of the price against the logarithm of time, it forms a nearly straight line.
The parameters of this model are provided in the script as follows: log(BTCUSD) = 1.48 + 5.44log(h).
The secondary concept involves employing the inherent time unit of Bitcoin instead of days:
'h' denotes a slightly adjusted time measurement intrinsic to the Bitcoin blockchain. It can be approximated as (days since the genesis block) * 0.0007. Precisely, 'h' is defined as follows: h = 0 at the genesis block, h = 1 at the first halving block, and so forth. In general, h = block height / 210,000.
Adjustments are made to account for variations in block creation time.
The third concept revolves around investigating halving waves triggered by supply shock events resulting from the halvings. These halvings occur at regular intervals in Bitcoin's native time 'h'. All halvings transpire when 'h' is an integer. These events induce waves with intervals denoted as h = 1.
Consequently, we can model these waves using a sin(2pih - a) function. The parameter determining the time shift is assessed as 'a = 0.4', aligning with earlier expectations for halving events and their subsequent outcomes.
The fourth concept introduces the notion that the waves gradually diminish in amplitude over the progression of "time h," diminishing at a rate of 0.7^h.
Lastly, we can create bands around the modeled sinusoidal waves. The upper band is derived by multiplying the sine wave by a factor of 3.1*(1-0.16)^h, while the lower band is obtained by dividing the sine wave by the same factor, 3.1*(1-0.16)^h.
The current bandwidth is 2.5x. That means that the upper band is 2.5 times the lower band. These bands are forming an exceptionally narrow predictive channel for Bitcoin. Consequently, a highly accurate estimation of the peak of the next cycle can be derived.
The prediction indicates that the zenith past the fourth halving, expected around the summer of 2025, could result in Total Bitcoin Market Cap ranging between 4B and 5B USD.
The projections to the future works well only for weekly timeframe.
Enjoy the mathematical insights!

Bitcoin wave modelBitcoin wave model is based on the logarithmic regression model and the sinusoidal waves, induced by the halving events.
This chart presents the outcome of an in-depth analysis of the complete set of Bitcoin price data available from October 2009 to August 2023.
The central concept is that the logarithm of the Bitcoin price closely adheres to the logarithmic regression model. If we plot the logarithm of the price against the logarithm of time, it forms a nearly straight line.
The parameters of this model are provided in the script as follows: log (BTCUSD) = 1.48 + 5.44log(h).
The secondary concept involves employing the inherent time unit of Bitcoin instead of days:
'h' denotes a slightly adjusted time measurement intrinsic to the Bitcoin blockchain. It can be approximated as (days since the genesis block) * 0.0007. Precisely, 'h' is defined as follows: h = 0 at the genesis block, h = 1 at the first halving block, and so forth. In general, h = block height / 210,000.
Adjustments are made to account for variations in block creation time.
The third concept revolves around investigating halving waves triggered by supply shock events resulting from the halvings. These halvings occur at regular intervals in Bitcoin's native time 'h'. All halvings transpire when 'h' is an integer. These events induce waves with intervals denoted as h = 1.
Consequently, we can model these waves using a sin(2pih - a) function. The parameter determining the time shift is assessed as 'a = 0.4', aligning with earlier expectations for halving events and their subsequent outcomes.
The fourth concept introduces the notion that the waves gradually diminish in amplitude over the progression of "time h," diminishing at a rate of 0.7^h.
Lastly, we can create bands around the modeled sinusoidal waves. The upper band is derived by multiplying the sine wave by a factor of 3.1*(1-0.16)^h, while the lower band is obtained by dividing the sine wave by the same factor, 3.1*(1-0.16)^h.
The current bandwidth is 2.5x. That means that the upper band is 2.5 times the lower band. These bands are forming an exceptionally narrow predictive channel for Bitcoin. Consequently, a highly accurate estimation of the peak of the next cycle can be derived.
The prediction indicates that the zenith past the fourth halving, expected around the summer of 2025, could result in prices ranging between 200,000 and 240,000 USD.
Enjoy the mathematical insights!

Spread DifferentialThe Spread Differential tries to measure the speed of the market in any given direction. The histogram plots levels above or below zero in a sequence of Humps and Waves. Humps are repetitions of the previous trend before dropping to or near 0 whilst Waves are similar to Humps but the histogram must drop to or near 0 prior to forming another wave. You might notice that in no trend does the indicator ever form more than 2 waves. The indicator should be used in conjunction with the MA's selected in the panel to identify possible points of failure.

3rd WaveHello All,
In Elliott Wave Theory, 3rd wave is not the shortest one in the waves 1/3/5 and it's usually longest one. so if we can catch it then we may get good opportunities to trade. This script finds 3rd wave experimentally. it can be also the 3rd waves in the waves 1, 3, 5, A and C. the 3rd wave should have greater volume than other waves, the script can check its volume and compare with the volumes of the waves 1 and 2 optionally.
Pine Team released Pine version 5! This script was developed in v5 and it uses Library feature of Pine v5 for the zigzag functions. This script is also an example for the Pine developers who learn Pine v5 and Libraries.
Options:
Zigzag Period: is the length that is used to calculate highest/lowest and the zigzag waves
Min/Max Retracements: is the retracement rates to check the wave 2 according to wave 1. for example; if min/max values are 0.500-0.618 then wave 2 must be minimum 0.500 of wave 1 and maximum 0.618 of wave 1.
Check Volume Support: is an option to compare the volumes of1. 2. and . waves. if you enable this option then the script checks their volume and 3rd wave volume must be greater then 1 and 2
there are 4 options for the targets. you can enable/disable and change their levels. targets are calculated using length of wave 1.
Options to show breakout zone, zigzag, wave 1 and 2.
and some options for the colors.
The Library that is used in this script:
P.S. This is an experimental work and can be improved. So do not hesitate to drop your comments under the script ;)
Enjoy!

Elliott Wave: Pro ForecastElliott Wave: Pro Forecast (Dual-Path Prediction)
The "Fork in the Road" for Price Action. Most indicators show you where price has been. This indicator predicts where price could go using standard Elliott Wave Fibonacci ratios and volatility analysis.
Unlike standard forecasters that force a single path, Pro Forecast acknowledges that the market is probabilistic. It visualizes the two most likely outcomes simultaneously:
Continuation: The current trend extends deeper (or higher).
Reversal: The trend exhausts and begins a new 5-wave motive structure.
How It Works
The script identifies the most recent "Live Pivot" (the unconfirmed high or low currently forming) and calculates volatility based on the previous swing. It then projects future price action using two distinct models:
The Extension Model: Projects a generic 0.5 volatility continuation.
The Wave Model: Projects a standard Elliott Wave 5-step sequence (or ABC correction) using classic Fibonacci ratios (0.382 retracements, 1.618 extensions).
Key Features
Dual-Path Visualization: See the Bearish breakdown and Bullish bounce scenarios at the same time.
"Dip Buy" Mode (Linked Scenarios): A unique feature that links the two paths. Instead of reversing now, it simulates a reversal starting after the extension. This is perfect for planning entries at lower support levels.
Smart Target Grid: Draws horizontal dotted lines at key price targets, making it easier to line up predictions with existing Support/Resistance zones.
Invalidation Level: Automatically marks the "Hard Stop" level (Start of Wave 1). If price crosses this red line, the bullish/bearish thesis is invalid.
Zero-Floor Logic: Smart math ensures projections never predict negative stock prices, even on high-volatility/low-cap assets.
Settings Guide
Sensitivity: Controls how fast pivots are detected.
Daily Chart: Recommend 3-4 for a 1-week outlook.
4H Chart: Recommend 8-12.
Show Continuation: Toggles the "Extension" line (Orange).
Show Reversal: Toggles the "Next Wave" sequence (Blue).
Start Reversal after Extension?:
Unchecked: Reversal starts from the current price (Current Bounce).
Checked: Reversal starts from the end of the Extension line (Future Bounce).
Risk Disclaimer
This tool is for educational purposes and visualization only. It projects geometric probabilities based on past volatility, not certainty. Always use proper risk management.

Smart WaveTrend Crossover█ OVERVIEW
Smart WaveTrend Crossover is an indicator based on WaveTrend crossovers, designed to reduce the number of false signals typically produced by classic oscillator crossovers.
Instead of triggering a signal immediately at the line crossover, the indicator requires additional confirmation in the form of a price breakout from a box, created at the moment of the WaveTrend signal.
The script also includes:
- a trend filter based on a separate WaveTrend
- “fog” visualization
- candle coloring based on trend direction
- fully configurable entry signals
- automatic Take Profit / Stop Loss levels
- a real-time TP/SL table
█ CONCEPTS
Classic WaveTrend crossovers often generate noise, especially during consolidation.
Smart WaveTrend Crossover attempts to address this issue using a breakout confirmation mechanism:
- at the moment WT1 crosses WT2, a horizontal price box is created
- a trade signal is generated only when price closes outside the box
- an optional trend filter limits signals to the dominant market direction
The trend filter is built on a WaveTrend crossover using larger, slower parameters, independent from the signal-generating WaveTrend.
This allows short-term momentum to be separated from the broader market direction, and all trend filter parameters can be freely adjusted.
WaveTrend signal settings are not identical to the original / classic values.
They are configured to generate a higher number of signals, which works better in combination with breakout boxes and confirmation logic.
Signal sensitivity can be easily adjusted by modifying channel length and averaging parameters.
By default, show_only_matching is enabled:
- bullish crossover → bullish breakout only (BUY)
- bearish crossover → bearish breakout only (SELL)
█ FEATURES
WaveTrend (Signals & Trend):
- two independent WaveTrend setups:
- one for signal generation
- one for trend determination
- signal parameters configured more aggressively than classic defaults
- trend filter based on a slower WaveTrend crossover
- trend direction visualized using directional fog, not a histogram
WaveTrend Input Explanation:
- Channel Length – controls WaveTrend reaction speed (shorter = more signals)
- Average Length – smoothing of the main WT1 line
- MA Length – smoothing of the signal line WT2
- Source – price source used in calculations (default: hlc3)
Fog (Visualization):
- visual representation of market pressure in the direction of the trend
- fog height based on average candle size × offset_mult
- adjustable transparency or fully disableable
Breakout Boxes:
- a box is created on every WaveTrend direction change
- default height based on the signal candle range
- optional box expansion using average candle size × box_multiplier
Signals:
- triangles or “BUY / SELL” labels
- direction matching filter (show_only_matching)
- option to display all breakouts regardless of crossover direction
- built-in BUY and SELL alerts
Visual Settings:
- candle coloring based on WaveTrend trend direction
- full control over bullish and bearish colors
Risk Management – TP / SL:
- automatic TP1, TP2, TP3 and SL levels
- two calculation modes:
- Candle Multiplier – based on average candle range
- Percentage – percentage from entry price
- separate parameters for each level
- TP/SL lines drawn on the chart
- real-time TP/SL price table
█ HOW TO USE
Add the indicator to your TradingView chart → Indicators → search “Smart WaveTrend Crossover”
Key settings:
- WaveTrend Settings for Signals – signal sensitivity
- WaveTrend Settings for Trend – market direction filter
- Signal Settings – signal type and box logic
- Fog – pressure visualization
- Risk Management – TP/SL configuration
Signal meaning:
- BUY → upward breakout from a box after a bullish crossover
- SELL → downward breakout from a box after a bearish crossover
- visible boxes → breakout watch zones
- fog and candle color → current market direction
█ APPLICATIONS
Standalone entry system
- entering directly on BUY / SELL signals
- or entering on trend color change
Filter for price-action strategies
- using WaveTrend signals as directional confirmation
- e.g. level breakout + WaveTrend confirmation = entry
Trend indicator
- trading other tools only in the direction of the WaveTrend trend
- e.g. RSI breaks above 50 while WaveTrend trend is bullish
█ NOTES
- Default settings are a starting point and may require adjustment
- The indicator works best as part of a broader trading system

Enhanced Neowave Wave 1 Finder with ZigZagThis script is an advanced technical analysis indicator for the TradingView platform, written in Pine Script version 5. Its primary goal is to identify potential Elliott Wave "Wave 1" patterns, enhanced with principles from Neowave theory and a custom ZigZag indicator for more accurate pivot detection. The script is designed to be overlaid on the main price chart.
Core Functionality: Blending ZigZag and Neowave
The indicator's methodology is a two-part process. First, it identifies significant price swings using a robust ZigZag indicator. Then, it analyzes these swings based on a set of rules derived from Neowave and classic technical analysis to validate them as potential Wave 1 patterns.
Part 1: ZigZag Integration
The first major component is a comprehensive ZigZag indicator that forms the foundation for all subsequent analysis.
Pivot Detection: The pivots() function is the engine of the ZigZag. It scans the historical price data for significant high and low points (pivots) over a user-defined Length.
Segment Drawing: Once pivots are identified, the script draws lines connecting them, creating the classic ZigZag pattern on the chart.
Extended Direction & Ratios: This is an enhanced feature. The script doesn't just identify highs and lows; it categorizes them as:
Higher High (HH) or Lower High (LH)
Lower Low (LL) or Higher Low (HL)
This classification is crucial for understanding the market structure. It also calculates the price ratio of the most recent ZigZag leg relative to the previous one, which is used later for pattern validation.
Dynamic Updates: The ZigZag is not static. On each new bar, it can update its most recent pivot point if a new, more extreme price (a higher high or a lower low) is printed before the direction officially changes. This ensures the ZigZag is always reflecting the most current and significant price action.
Part 2: Neowave Wave 1 Finder
With the market structure defined by the ZigZag, the second part of the script applies a rigorous set of rules to identify potential Wave 1 patterns. A Wave 1 is the initial move of a new trend in Elliott Wave theory.
Key Validation Criteria
For a price move between two ZigZag pivots to be considered a valid Wave 1, it must pass a series of checks:
Significance: The move must have a minimum percentage change (Minimum Wave Length) and last for a minimum number of bars, filtering out insignificant noise.
Volume Confirmation: A genuine impulse wave is typically supported by increasing volume. The script checks if the volume during the potential Wave 1 is significantly higher than the recent average (Volume Increase Threshold).
Momentum Alignment: The direction of the wave must be confirmed by momentum indicators.
For a bullish (upward) Wave 1, the Relative Strength Index (RSI) must be in a bullish regime (above 50) and the MACD line must be above its signal line.
For a bearish (downward) Wave 1, the RSI must be below 50 and the MACD line must be below its signal line.
Structural Analysis (Impulse vs. Diagonal): The script attempts to differentiate between two types of Wave 1:
Impulse Wave: A strong, clean, and direct move.
Diagonal Wave: A more complex, overlapping, and often wedge-shaped pattern. This is identified by analyzing the time and price complexity of the move, along with the ZigZag leg ratios.
Wave 2 Retracement Check: A critical Neowave rule is that a valid Wave 1 must be followed by a valid Wave 2 retracement. The script looks at the next ZigZag leg to ensure it doesn't retrace more than 100% of the potential Wave 1. It also uses the ZigZag ratios to confirm the retracement falls within typical Fibonacci levels (e.g., 38.2% to 78.6%).
Display and User Interface
The script provides a rich visual experience to aid the trader in their analysis.
Wave Labels and Boxes: When a valid Wave 1 is detected, it is highlighted with a colored line (green for bullish, red for bearish) and a shaded background box. A label clearly marks it as "Wave 1 IMPULSE" or "Wave 1 DIAGONAL".
Fibonacci Retracement Levels: Upon detection of a Wave 1, the script automatically draws key Fibonacci retracement levels (38.2%, 50%, 61.8%, 78.6%). These levels are potential targets for the end of the subsequent Wave 2, offering potential entry points for a Wave 3 trade.
Information Labels: Additional labels provide at-a-glance confirmation of the conditions, showing whether volume and momentum criteria were met.
Customizable Inputs: Users have extensive control over the indicator's parameters, including the ZigZag length, volume thresholds, RSI levels, and the colors of all visual elements.
Alerts: The indicator can be configured to generate an alert whenever a new bullish or bearish Wave 1 pattern is confirmed, allowing traders to be notified of potential opportunities in real-time.

Market Cipher B by WeloTradesMarket Cipher B by WeloTrades: Detailed Script Description
//Overview//
"Market Cipher B by WeloTrades" is an advanced trading tool that combines multiple technical indicators to provide a comprehensive market analysis framework. By integrating WaveTrend, RSI, and MoneyFlow indicators, this script helps traders to better identify market trends, potential reversals, and trading opportunities. The script is designed to offer a holistic view of the market by combining the strengths of these individual indicators.
//Key Features and Originality//
WaveTrend Analysis:
WaveTrend Channel (WT1 and WT2): The core of this script is the WaveTrend indicator, which uses the smoothed average of typical price to identify overbought and oversold conditions. WT1 and WT2 are calculated to track market momentum and cyclical price movements.
Major Divergences (🐮/🐻): The script detects and highlights major bullish and bearish divergences automatically, providing traders with visual cues for potential reversals. This helps in making informed decisions based on divergence patterns.
Relative Strength Index (RSI):
RSI Levels: RSI is used to measure the speed and change of price movements, with specific levels indicating overbought and oversold conditions.
Customizable Levels: Users can configure the overbought and oversold thresholds, allowing for a tailored analysis based on individual trading strategies.
MoneyFlow Indicator:
Fast and Slow MoneyFlow: This indicator tracks the flow of capital into and out of the market, offering insights into the underlying market strength. It includes configurable periods and multipliers for both fast and slow MoneyFlow.
Vertical Positioning: The script allows users to adjust the vertical position of MoneyFlow plots to maintain a clear and uncluttered chart.
Stochastic RSI:
Stochastic RSI Levels: This combines the RSI and Stochastic indicators to provide a momentum oscillator that is sensitive to price changes. It is used to identify overbought and oversold conditions within a specified period.
Customizable Levels: Traders can set specific levels for more precise analysis.
//How It Works//
The script integrates these indicators through advanced algorithms, creating a synergistic effect that enhances market analysis. Here’s a detailed explanation of the underlying concepts and calculations:
WaveTrend Indicator:
Calculation: WaveTrend is based on the typical price (average of high, low, and close) smoothed over a specified channel length. WT1 and WT2 are derived from this typical price and further smoothed using the Average Channel Length. The difference between WT1 and WT2 indicates momentum, helping to identify cyclical market trends.
RSI (Relative Strength Index):
Calculation: RSI calculates the average gains and losses over a specified period to measure the speed and change of price movements. It oscillates between 0 and 100, with levels set to identify overbought (>70) and oversold (<30) conditions.
MoneyFlow Indicator:
Calculation: MoneyFlow is derived by multiplying price changes by volume and smoothing the results over specified periods. Fast MoneyFlow reacts quickly to price changes, while Slow MoneyFlow offers a broader view of capital movement trends.
Stochastic RSI:
Calculation: Stochastic RSI is computed by applying the Stochastic formula to RSI values, which highlights the RSI’s relative position within its range over a given period. This helps in identifying momentum shifts more precisely.
//How to Use the Script//
Display Settings:
Users can enable or disable various components like WaveTrend OB & OS levels, MoneyFlow plots, and divergence alerts through checkboxes.
Example: Turn on "Show Major Divergence" to see major bullish and bearish divergence signals directly on the chart.
Adjust Channel Settings:
Customize the data source, channel length, and smoothing periods in the "WaveTrend Channel SETTINGS" group.
Example: Set the "Channel Length" to 10 for a more responsive WaveTrend line or adjust the "Average Channel Length" to 21 for smoother trends.
Set Overbought & Oversold Levels:
Configure levels for WaveTrend, RSI, and Stochastic RSI in their respective settings groups.
Example: Set the WaveTrend Overbought Level to 60 and Oversold Level to -60 to define critical thresholds.
Money Flow Settings:
Adjust the periods and multipliers for Fast and Slow MoneyFlow indicators, and set their vertical positions for better visualization.
Example: Set the Fast Money Flow Period to 9 and Slow Money Flow Period to 12 to capture both short-term and long-term capital movements.
//Justification for Combining Indicators//
Enhanced Market Analysis:
Combining WaveTrend, RSI, and MoneyFlow provides a more comprehensive view of market conditions. Each indicator brings a unique perspective, making the analysis more robust.
WaveTrend identifies cyclical trends, RSI measures momentum, and MoneyFlow tracks capital movement. Together, they provide a multi-dimensional analysis of the market.
Improved Decision-Making:
By integrating these indicators, the script helps traders make more informed decisions. For example, a bullish divergence detected by WaveTrend might be validated by an RSI moving out of oversold territory and supported by increasing MoneyFlow.
Customization and Flexibility:
The script offers extensive customization options, allowing traders to tailor it to their specific needs and strategies. This flexibility makes it suitable for different trading styles and timeframes.
//Conclusion//
The indicator stands out due to its innovative combination of WaveTrend, RSI, and MoneyFlow indicators, offering a well-rounded tool for market analysis. By understanding how each component works and how they complement each other, traders can leverage this script to enhance their market analysis and trading strategies, making more informed and confident decisions.
Remember to always backtest the indicator first before implying it to your strategy.

NET BSP NET BSP derived from Buying & Selling Pressure which is a volatility indicator that monitors average metrics of green and red candles separately.
We could navigate more confidently through market with projected market balance.
BSP allowed us to track and analyze the ongoing performance of bullish and bearish impulsive waves and their corrections.
Due to unintuitive way of measuring decline with SP going up, I decided to remake it into more intuitive version with better precision.
When we encounter the fall it's better to have declining values of tool to be able to cover it visually with ease.
One of the solutions was to create a sense of balance of Buying Pressure against Selling Pressure.
Since we are oriented by growth, it'd be more logical to summarize the market balance with BP - SP
Comparison:
When Buying and Selling Pressure are equal, NET BSP would be at 0.
NETBSP > 0 and NETBSP > NETBSP = 🟢
NETBSP > 0 and NETBSP < NETBSP = 🟡
NETBSP < 0 and NETBSP < NETBSP = 🔴
NETBSP < 0 and NETBSP > NETBSP = 🟡
Hence, we get visualized stages of uptrends and downtrends which allows to evaluate chances and estimations of upcoming counter-waves.
Also, it is worth to note that output clearly shows how one wave is derived from another in terms of sizing.
Feel free to adjust NET BSP arguments to adapt sensitivity to the timeframe you're working on.

DB KCBB%D WavesDB KCBB%D Waves
What does the indicator do?
The indicator plots the percent difference between the low and high prices against a combined Kelpler Channel Bollinger Bands for the current timeframe. The low percent difference and the high percent difference each have their own waves plotted. A mirror mode default allows both waves to be visualized in a mirrored plot that clearly shows when outer bands are present and when they swap. Each percent difference band is displayed with a 1 bar lookback to visualize local tops/bottoms.
The overall trend is displayed using two sets of green/red colors on the percent difference waves so that each wave is recognizable, but the overall price trend is visible. A fast 3 SMA is taken of each percent difference wave to obtain the overall trend and then averaged together. The trend is then calculated based on direction from the previous bar period.
How should this indicator be used?
By default, the indicator will display in a mirror mode which will display both the low and high percent change waves mirrored to allow for the most pattern recognition possible. You will notice the percent difference waves swap from inner to outer, showing the overall market direction for that timeframe. When each percent difference wave interacts with the zero line, it indicates either buys or sells opportunities depending on which band is on the inside. When the inner wave crosses zero, special attention should be paid to the outer wave to know if it's a significant move. Likewise, when the outer wave peaks, it can indicate buy or sell opportunities depending on which wave is on the outside.
A zero line and other lines are displayed from the highest of the high percent difference wave over a long period of time. The lines can measure movement and possible oversold/overbought locations or large volatility. You can also use the lines for crossing points for either wave as alerts to know when to buy or sell zones are happening.
When individual percent difference waves are designed to be reviewed without mirroring, the mirror checkbox can be unchecked in the settings. Doing so will display both the high and low percent difference waves separately. Using this display, you can more cleanly review how each wave interacts with various line levels.
For those who desire to only have half of the mirror or one set of waves inverted against each other, check the "mirrored" and the "mirrored flipped" checkboxes in the settings. Doing so will display the top half of the mirror indicator, which is the low percent difference wave with the high percent difference wave inverted.
The indicator will also change the background color of its own pane to indicate possible buy/sell periods (work in progress).
Does the indicator include any alerts?
Yes, they are a work in progress but starting out with this release, we have:
NOTE: This is an initial release version of this indicator. Please do not use these alerts with bots yet, as they will repaint in real-time.
NOTE: A later release may happen that will delay firing the events until 1/2 of the current bar time has passed.
NOTE: As with any indicator watch your upper timeframe waves first before zooming into lower.
DB KCBB%D Buy Zone Alert
DB KCBB%D MEDIUM Buy Alert
DB KCBB%D STRONG Buy Alert
DB KCBB%D Sell Alert
DB KCBB%D STRONG Sell Alert
DB KCBB%D Trend Up Alert
DB KCBB%D Trend Down Alert
Use at your own risk and do your own diligence.
Enjoy!

OpenCipher AOpenCipher A is an open-source and free to use Overlay.
Features:
EMA Ribbons (Lengths: 5, 11, 15, 18, 21, 25, 29, 33)
Symbols ("Be careful" and "attention required" signals)
EMA Ribbons
The EMA RIbbons are a set of exponential moving averages. Blue and white ribbons = uptrend, gray ribbons = downtrend. The ribbons can act as support in uptrends and as resistance in downtrends.
Lengths and source of the ribbons are customizable.
Symbols
Green Dots: The green dot is a bullish symbol that appears whenever the EMA 11 crosses over EMA 33.
Red Cross: The red cross is a bearish symbol that appears whenever the EMA 5 crosses under EMA 11.
Blue Triangle: The blue triangle marks a possible trend reversal that appears whenever the EMA 5 crosses over EMA 25 while EMA 29 is below EMA 33.
Red Diamond: The red diamond is a bearish symbol that marks a potential local top whenever a bearish wavecross occurs (fast wave crosses under slow wave).
Yellow X: The yellow X is a warning signal that appears whenever a bearish wavecross occurs while the slow wave of the wavetrend is below -40 and the moneyflow is in the red (below zero).
Blood Diamond: The blood diamond is a bearish symbol that highlights whenever the red diamond and the red cross appear on the same candle.
Usage
Treat the symbols as signs that your attention might be required and don't trade based on them.

Hull Volume WavesInspired by the works of David Weis, this indicator is an alternative to his classic Weis Volume Waves.
As the name implies, this indicator uses a Hull Moving Average to detect price swings, and calculates the cumulative volume for each of them, separating the up swings from the down swings.
The chosen length of the HMA determines the size of each swing, meaning lower lengths will detect microswings while higher lengths will only include the main swings.
The length of each swing also determines the color of the upward and downward waves, and you can choose 2 colors each to generate a bullish and bearish gradient.
Extreme values are highlighted in the background. The indicator will compare the current up wave to the last N up volumes, or the current down wave to the last N down volumes. The lookback length can be changed in the menu.
I hope you find it useful!

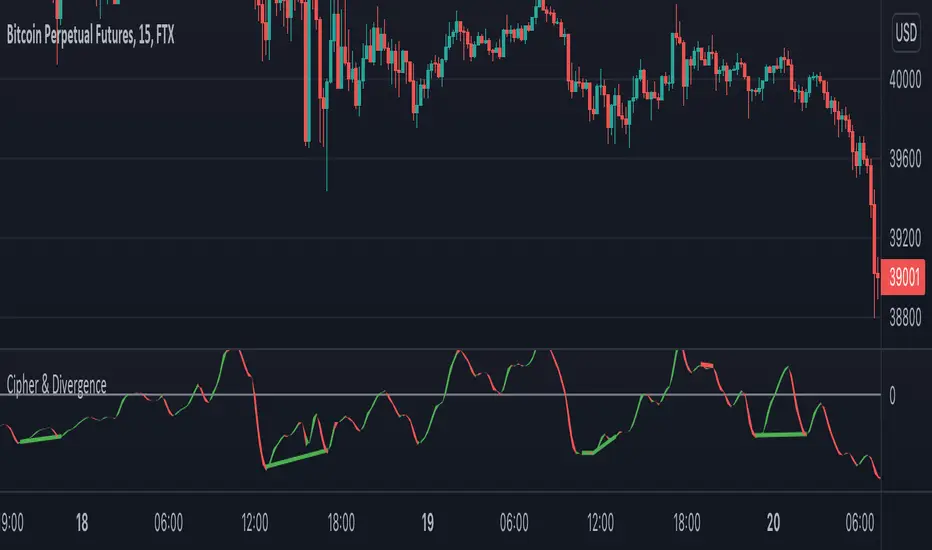
Cipher & DivergenceFor a long time I've been using complicated script with too much informations in it.
In this one I try to have just the bare minimum information to be able to analyse and find a potential reversal zone.
It is inspired from different wave trend / cipher script but has been tuned after months of backtest.
Extending the usage of the wave trend oscillator, which can be used with overbuy & oversell zone it might be better to wait for a confirmation of the movement. This confirmation can be identified by a pull back of the wave trend & price.
We can even confort ourself by waiting for reversal indicators.
Reversal may occurs after a divergence, wait for it, a cross of zero line followed by a PB to find your entry.
You can setup alert on bear / bull divergence but also when the wave trend cross the zero line to never miss a potential trade.
Huge thanks to LazyBear for his wave trend
And thanks vumanchu for his huge cipher script which was very useful for divergence finder
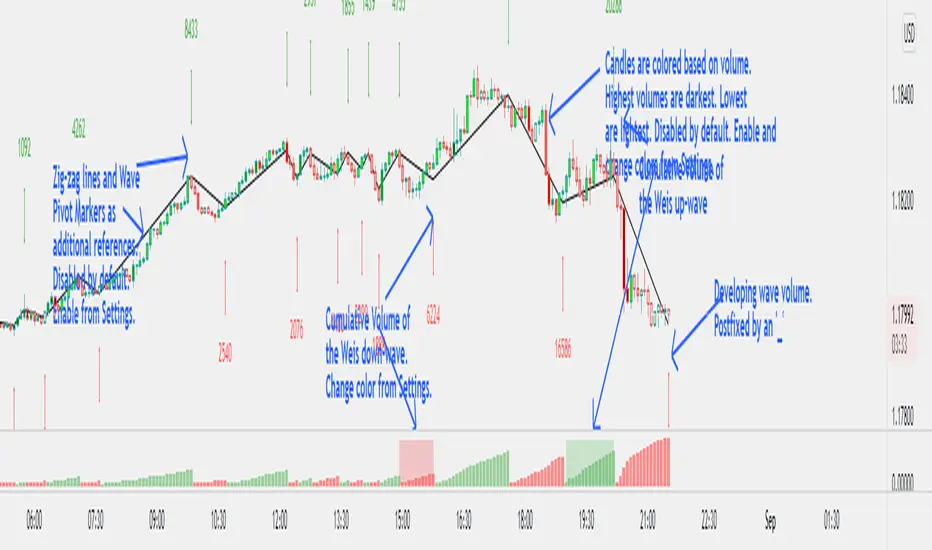
Weis Wave Volume NumbersWhat is it?
This is an indicator to complement @modhelius' Weis Wave Volume Indicator.
Original code has been modified to display wave volume (cumulative) numbers above or below the latest candle of the corresponding wave on the main pane. Since we are concerned only with relative volume, VOLUME NUMBERS HAVE BEEN SCALED DOWN. (If you need actual volume numbers, uncheck "Scale Down Volume" option in Settings). Rising wave volume is denoted in green. Falling wave volume is denoted in red. Developing wave volume is postfixed with a '_'. Confirmed wave volumes won't have this.
Who is it for?
This indicator is useful if you already use Weis Waves in your analysis and could do with an additional numerical representation of the wave volume on the main pane. Can be used in conjunciton with @modhelius' Weis Wave Volume (WWV) indicator (need to be added separately) to complement the visual representation of the waves. Can be used independently as well.
Pelase note that if you use any other Weis Wave indicator (other than @modhelius'), the numbers and the waveforms might not match.
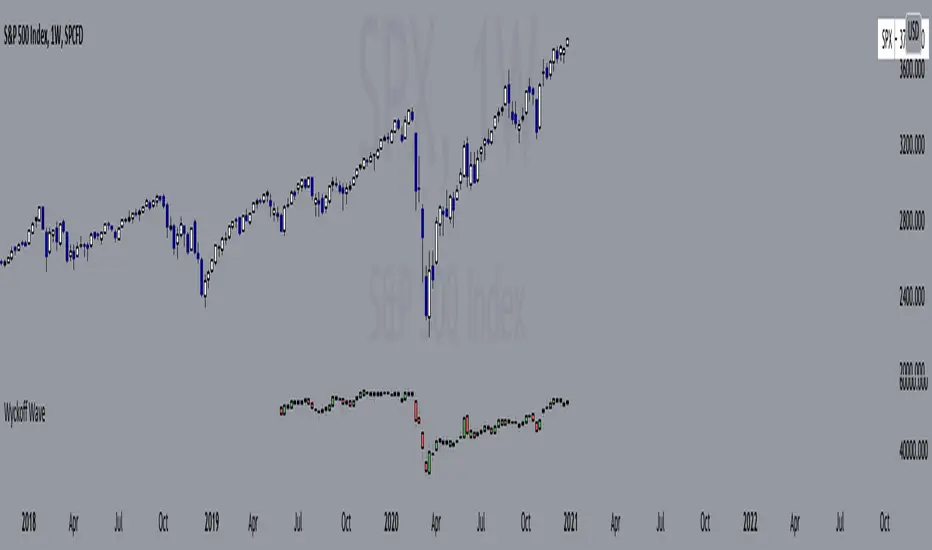
Wyckoff Wave"The Wyckoff Wave is a weighted index consisting of 12 stocks that are leaders in their perspective industries. It was introduced by the Stock Market Institute in 1931.
Made up of leaders in the important stock groups, the Wyckoff Wave represents the core of the American industrial complex.
The Wyckoff Wave has been a market indicator for Wyckoff students for over 50 years. While the stocks comprising the Wyckoff Wave have changed over time, it continues to be a sensitive leading market indicator. The Wyckoff Wave has consistently identified market trends.
The Wyckoff Wave is extremely helpful in predicting the stock market’s timing and the direction of the next market move.
The Wyckoff Wave is analyzed in five minute intervals and individual up and down iintra-day waves are created.
These individual waves, which include the price action and volume during those brief up and down market swings, also provide the data for other important Wyckoff Stock Market Institute indicators, including the Optimism-Pessimism volume index and the Trend Barometer.
These 12 stocks that make up the Wyckoff Wave. They are listed, along with their multipliers, below."
Wave Stock / Multiplier
AT&T / 79
Bank of America / 50
Boeing / 39
Bristol Myers / 119
Caterpillar / 35
DowDuPont / 72
Exxon Mobile / 32
IBM / 21
General Electric / 90
Ford / 25
Union Pacific / 60
WalMart / 43
In 2019, DowDuPont split into three companies: Dow, DuPont, and Corteva. Because TV limits the number of securities in a script to 40, only Dow and DuPont are factored into the Wave calculation (higher market caps than Corteva) with a multiplier of 36 each.
Renko Weis Wave VolumeThis is live and non-repainting Renko Weis Wave Volume tool. The tool has it’s own engine and not using integrated function of Trading View.
Renko charts ignore time and focus solely on price changes that meet a minimum requirement. Time is not a factor on Renko chart but as you can see with this script Renko RSI created on time chart.
Renko chart provide several advantages, some of them are filtering insignificant price movements and noise, focusing on important price movements and making support/resistance levels much easier to identify.
As source Closing price or High/Low can be used.
Traditional or ATR can be used for scaling. If ATR is chosen then there is rounding algorithm according to mintick value of the security. For example if mintick value is 0.001 and brick size (ATR/Percentage) is 0.00124 then box size becomes 0.001. And also while using dynamic brick size (ATR), box size changes only when Renko closing price changed.
This tool is based on the Weis Wave described by David H. Weis (a Wyckoff specialist). The Weis Waves Indicator sums up volumes in each wave. This is how we receive a bar chart of cumulative volumes of alternating waves and The cumulative volume makes the Weis wave charts unique.
If there is no volume information for the security then this tool has an option to use “True Range” instead of volume .
Better to use this script with the following one:
Enjoy!

Point and Figure (PnF) Weis Wave VolumeThis is live and non-repainting Point and Figure Chart Weis Wave Volume tool. The script has it’s own P&F engine and not using integrated function of Trading View.
Point and Figure method is over 150 years old. It consist of columns that represent filtered price movements. Time is not a factor on P&F chart but as you can see with this script P&F chart created on time chart.
P&F chart provide several advantages, some of them are filtering insignificant price movements and noise, focusing on important price movements and making support/resistance levels much easier to identify.
This tool is based on the Weis Wave described by David H. Weis (a Wyckoff specialist). The Weis Waves Indicator sums up volumes in each wave. This is how we receive a bar chart of cumulative volumes of alternating waves and The cumulative volume makes the Weis wave charts unique.
If there is no volume information for the security then this tool has an option to use “True Range” instead of volume .
If you are new to Point & Figure Chart then you better get some information about it before using this tool. There are very good web sites and books. Please PM me if you need help about resources.
Options in the Script
Box size is one of the most important part of Point and Figure Charting. Chart price movement sensitivity is determined by the Point and Figure scale. Large box sizes see little movement across a specific price region, small box sizes see greater price movement on P&F chart. There are four different box scaling with this tool: Traditional, Percentage, Dynamic (ATR), or User-Defined
4 different methods for Box size can be used in this tool.
User Defined: The box size is set by user. A larger box size will result in more filtered price movements and fewer reversals. A smaller box size will result in less filtered price movements and more reversals.
ATR: Box size is dynamically calculated by using ATR, default period is 20.
Percentage: uses box sizes that are a fixed percentage of the stock's price. If percentage is 1 and stock’s price is $100 then box size will be $1
Traditional: uses a predefined table of price ranges to determine what the box size should be.
Price Range Box Size
Under 0.25 0.0625
0.25 to 1.00 0.125
1.00 to 5.00 0.25
5.00 to 20.00 0.50
20.00 to 100 1.0
100 to 200 2.0
200 to 500 4.0
500 to 1000 5.0
1000 to 25000 50.0
25000 and up 500.0
Default value is “ATR”, you may use one of these scaling method that suits your trading strategy.
If ATR or Percentage is chosen then there is rounding algorithm according to mintick value of the security. For example if mintick value is 0.001 and box size (ATR/Percentage) is 0.00124 then box size becomes 0.001.
And also while using dynamic box size (ATR or Percentage), box size changes only when closing price changed.
Reversal : It is the number of boxes required to change from a column of Xs to a column of Os or from a column of Os to a column of Xs. Default value is 3 (most used). For example if you choose reversal = 2 then you get the chart similar to Renko chart.
Source: Closing price or High-Low prices can be chosen as data source for P&F charting.
There is only one option for Weis Wave Volume, “Use True Range (if no Volume info)” if you select this option and volume info is not avaliable then it uses “true range”, but if volume info is available, it never use true range. Default value is set to use true range.
