Alpha VWAP Regime🔥 Alpha VWAP Regime — Institutional VWAP Strategy (Closed Source)
Alpha VWAP Regime is a multi-layered VWAP trading system that identifies the active market regime and adapts its signals based on institutional liquidity behavior.
This strategy is closed-source because it uses a proprietary combination of VWAP structures, anchored pivot logic, band deviations, and regime detection filters that are not publicly available.
🧠 How the Strategy Works (Conceptual Explanation)
This strategy does not rely on a single VWAP line.
Instead, it builds a VWAP matrix consisting of:
1) Session VWAP
Defines fair value for the current session.
Used to detect intraday directional bias.
2) Anchored VWAP (AVWAP)
Automatically anchored to swing highs and lows (pivot-based).
Tracks where large players accumulated or distributed positions.
3) VWAP Bands (±1σ and ±2σ)
Used as dynamic volatility envelopes:
±1σ = fair-value zone / no-trade area
±2σ = mean-reversion extremes
4) Market Regime Classification (ADX-based)
The strategy determines which environment the market is in:
Trending Regime: ADX above threshold
Ranging Regime: ADX below threshold
Breakout Regime: Volume-based breakout of AVWAP
Each regime activates a different entry model.
📌 Entry Logic (High-Level Overview)
Trend Mode
Triggered only when ADX confirms a trend.
Entries occur near VWAP or −1σ using price-action confirmation.
Mean Reversion Mode
Activated when the market is ranging.
Entries target the ±2σ deviation bands.
Breakout Mode
Triggered by price crossing AVWAP with above-average volume.
Used to catch institutional continuation moves.
ALL Mode
Combines the three models for a full adaptive system.
📉 Exits & Risk Management
All stops and targets use ATR-based volatility sizing
Trend trades aim for larger targets
Mean-reversion trades aim for smaller snapback moves
Breakouts use wider stops but high R:R
🔍 How to Use the Strategy
Load the script on a clean chart
Choose your preferred regime mode (Trend / MR / Breakout / ALL)
Optionally hide VWAP indicators and display signals only
Use realistic position sizing and commissions
Evaluate performance across multiple assets and timeframes
🔒 Why It Is Closed-Source
The code uses:
A custom anchoring engine
Multi-layered regime filters
Dynamic VWAP matrix
Prop logic for bias scoring
These components were built from scratch and form a unique decision model, so the source is protected.
🇸🇦 الشرح العربي لاستراتيجية Alpha VWAP Regime
Alpha VWAP Regime هي استراتيجية تداول مؤسسية متقدمة تعتمد على تحليل السيولة، وتحديد حالة السوق (Market Regime)، ودمج عدة طبقات من VWAP داخل نموذج واحد متكيف.
الهدف من الاستراتيجية هو التداول في المناطق التي يتواجد فيها المال الذكي، وتجنب التداول في المناطق العشوائية أو منخفضة الجودة.
________________________________________
🧠 كيف تعمل الاستراتيجية؟
الاستراتيجية لا تعتمد على VWAP واحد، بل تستخدم “مصفوفة VWAP” كاملة تتكوّن من:
1) VWAP اليومي (Session VWAP)
يُستخدم لتحديد القيمة العادلة خلال الجلسة، وتحديد الاتجاه اللحظي (Intraday Bias).
________________________________________
2) VWAP المثبّت (Anchored VWAP)
يتم تثبيته تلقائيًا على:
• القمم المهمة (Swing Highs)
• القيعان المهمة (Swing Lows)
ويساعد في تحديد مناطق تمركز المؤسسات، ومناطق الانعكاس أو الاختراقات الحقيقية.
________________________________________
3) نطاقات VWAP (±1σ و ±2σ)
تُستخدم كأغلفة ديناميكية للسيولة والتقلب:
• ±1σ = منطقة القيمة العادلة (Fair-Value Zone)
→ غالبًا منطقة غير مناسبة للتداول (No-Trade Zone)
• ±2σ = مناطق التشبّع الحركي (Extremes)
→ مناسبة لاستراتيجيات الانعكاس (Mean Reversion)
________________________________________
4) تصنيف حالة السوق Market Regimes
الاستراتيجية تستخدم مؤشر ADX لتحديد حالة السوق الحالية:
حالة السوق الوصف
Trending اتجاه واضح وقوي
Ranging تذبذب بدون اتجاه
Breakout اختراق مدعوم بحجم تداول
كل Regime يفعّل نموذج دخول مختلف داخل الاستراتيجية.
________________________________________
🎯 نماذج الدخول داخل الاستراتيجية
1) نموذج الاتجاه (Trend Mode)
يعمل فقط عندما يكون السوق في اتجاه حقيقي.
يعتمد على دخول Pullbacks قرب VWAP أو نطاق −1σ مع تأكيد شموعي.
________________________________________
2) نموذج الانعكاس (Mean Reversion Mode)
يعمل فقط عندما يكون السوق متذبذبًا (Range).
الدخول عند لمس ±2σ بهدف العودة نحو VWAP.
________________________________________
3) نموذج الاختراق (Breakout Mode)
يستخدم اختراقات Anchored VWAP
ولكن بشرط وجود حجم تداول أعلى من المتوسط (Volume Confirmation).
________________________________________
4) وضع الدمج (ALL Mode)
يجمع بين النماذج الثلاثة ويجعل الاستراتيجية متكيفة تلقائيًا مع كل حالات السوق.
________________________________________
📉 الخروج وإدارة المخاطر
تستخدم الاستراتيجية نظامًا ديناميكيًا لإدارة المخاطر:
• وقف الخسارة مبني على ATR
• الأهداف مبنية على طبيعة النموذج
• الصفقات الاتجاهية تستهدف R:R أعلى
• صفقات MR أقصر وأسرع
• صفقات Breakout أوسع ولكن مدعومة بزخم قوي
________________________________________
🧩 كيفية استخدام الاستراتيجية
1. ضع الاستراتيجية على رسم بياني نظيف بدون مؤشرات إضافية
2. اختر نموذج الدخول المناسب من الإعدادات
3. فعّل أو أخفِ خطوط VWAP حسب الحاجة
4. استخدم إعدادات مخاطرة واقعية
5. اختبر الاستراتيجية على عدة أسواق وفريمات
________________________________________
🔒 سبب إغلاق الكود
تم إغلاق الكود لأنها تعتمد على:
• محرك تثبيت AVWAP خاص
• نظام Regime Detection متقدم
• مصفوفة VWAP متعددة الطبقات
• منطق دخول/خروج خاص تم تطويره بالكامل
كل ذلك يتطلب حماية الملكية الفكرية، لذا تم نشرها Closed-Source.
ค้นหาในสคริปต์สำหรับ "volume"
OBV EMA X BF 🚀Credit to Lancelot_Augur for the idea of EMAs of On Balance Volume.
The signals are generated when the faster OBV EMA crosses the slower one.
BACKGROUND COLORS:
Green = go long
Red = go short
White = you have been stopped out
This strategy uses a 3% stop loss.

Trend Surge Wick SniperTrend Surge Wick Sniper | Non-Repainting Trend + Momentum Strategy with TP1/TP2 & Dashboard
Trend Surge Wick Sniper is a complete crypto trading strategy designed for high-precision entries, smart exits, and non-repainting execution. It combines trend slope, wick rejection, volume confirmation, and CCI momentum filters into a seamless system that works in real-time conditions — whether you're manual trading or sending alerts to multi-exchange bots.
🧩 System Architecture Overview
This is not just a mashup of indicators — each layer is tightly integrated to filter for confirmed, high-quality setups. Here’s a detailed breakdown:
📈 Trend Logic
1. McGinley Dynamic Baseline
A responsive moving average that adapts to market speed better than EMA or SMA.
Smooths price while staying close to real action, making it ideal for basing alignment or trend context.
2. Gradient Slope Filter (ATR-normalized)
Calculates the difference between current and past McGinley values, divided by ATR for normalization.
If the slope exceeds a configurable threshold, it confirms an active uptrend or downtrend.
Optional loosened sensitivity allows for more frequent but still valid trades.
🚀 Momentum Timing
3. Smoothed CCI (ZLEMA / Hull / VWMA options)
Traditional CCI is enhanced with smoothing for stability.
Signals trades only when momentum is strong and accelerating.
Optional settings let users tune how responsive or smooth they want the CCI behavior to be.
🔒 Entry Filtering & Rejection Logic
4. Wick Trap Detection
Prevents entry during manipulated candles (e.g. stop hunts, wick traps).
Measures wick-to-body ratio against a minimum body size normalized by ATR.
Only trades when the candle shows a clean body and no manipulation.
5. Price Action Filters (Optional)
Long trades require price to break above previous high (or skip this with a toggle).
Short trades require price to break below previous low (or skip this with a toggle).
Ensures you're trading only when price structure confirms the breakout.
6. McGinley Alignment (Optional)
Price must be on the correct side of the McGinley line (above for longs, below for shorts).
Ensures that trades align with baseline trend, preventing early or fading entries.
📊 Volume Logic
7. Volume Spike Detection
Confirms that a real move is underway by requiring volume to exceed a moving average by a user-defined multiplier.
Uses SMA / EMA / VWMA for customizable behavior.
Optional relative volume mode compares volume against typical volume at that same time of day.
8. Volume Trend Filter
Compares fast vs. slow EMA of the volume spike ratio.
Ensures volume is not just spiking, but also increasing overall.
Prevents trades during volume exhaustion or fading participation.
9. Volume Strength Label
Classifies each bar’s volume as: Low, Average, High, or Very High
Shown in the dashboard for context before entries.
🎯 Entry Conditions
An entry occurs when all of the following align:
✅ Trend confirmed via gradient slope
✅ Momentum confirmed via smoothed CCI
✅ No wick trap pattern
✅ Price structure & McGinley alignment (if toggled on)
✅ Volume confirms participation
✅ 1-bar cooldown since last exit
💰 TP1 & TP2 Exit System
TP1 = 50% of position closed using a limit order at a % profit (e.g., 2%)
TP2 = remaining 50% closed at a second profit level (e.g., 4%)
These are set as limit orders at the time of entry and work even on backtest.
Alerts are sent separately for TP1 and TP2 to allow bot handling of staggered exits.
🧠 Trade Logic Controls
✅ process_orders_on_close=true ensures non-repainting behavior
✅ 1-bar cooldown after any exit prevents same-bar reversals
✅ Built-in canEnter condition ensures trades are separated and clean
✅ Alerts use customizable strings for entry/exit/TP1/TP2 — ready for webhook automation
📊 Real-Time On-Chart Dashboard
Toggleable, movable dashboard shows live trading stats:
🔵 Current Position: Long / Short / Flat
🎯 Entry Price
✅ TP1 / TP2 Hit Status
📈 Trend Direction: Up / Down / Flat
🔊 Volume Strength: Low / Average / High / Very High
🎛 Size and corner are adjustable via input settings
⚠️ Designed For:
1H / 4H Crypto Trading
Manual Traders & Webhook-Connected Bots
Scalability across volatile market conditions
Full TradingView backtest compatibility (no repainting / no fake signals)
📌 Notes
You can switch CCI smoothing type, volume MA type, and other filters via the settings panel.
Default TP1/TP2 levels are set to 2% and 4%, but fully customizable.
🛡 Disclaimer
This script is for educational purposes only and not financial advice. Use with backtesting and risk management before live deployment.
ZVGS Reactor🧠 ZVGS Reactor - High-Accuracy Trend Confirmation Strategy (Pine Script v6)
🚀 Overview
ZVGS Reactor is a precision-engineered, multi-layered trading strategy designed for crypto, forex, and equity markets. It blends adaptive trend tracking, directional strength confirmation, and volume validation to generate high-probability entries and exits. Built on a non-repainting foundation, the strategy ensures reliable performance in both backtesting and live trading environments.
🔹 How This Strategy Works (Indicator Fusion)
The ZVGS Reactor combines four core components:
1️⃣ ZLEMA Baseline for Trend Bias
📌 What It Does: Tracks the smoothed price trend and defines directional bias.
✔ Zero Lag Exponential Moving Average (ZLEMA)
Adaptive and responsive to price movement
Price above ZLEMA = bullish bias
Price below ZLEMA = bearish bias
2️⃣ Gradient Trend Filter for Momentum Slope
📌 What It Does: Measures slope strength to confirm directional momentum.
✔ Gradient Filter
Positive slope = bullish push
Negative slope = bearish pressure
3️⃣ Vortex Indicator (RMA Smoothed) for Trend Strength
📌 What It Does: Confirms whether the market is trending strongly in one direction.
✔ Vortex Indicator (VI)
VI+ > VI- = Bullish trend
VI- > VI+ = Bearish trend
Normalized & threshold-filtered for reliable confirmations
4️⃣ Volume Confirmation with Spike or Moving Average Toggle
📌 What It Does: Filters for strong market participation to reduce false breakouts.
✔ Volume Confirmation System
Spike Mode: Volume must exceed 1.5x its recent average
Toggle Option: Switch between spike mode and standard volume > average
Prevents entries in low-volume chop conditions
🎯 Entry & Exit Logic
✔ Long Entry (All Conditions Must Be Met):
Price above ZLEMA
Gradient slope > 0
Vortex confirms bullish strength
Volume passes confirmation filter
✔ Short Entry (All Conditions Must Be Met):
Price below ZLEMA
Gradient slope < 0
Vortex confirms bearish strength
Volume passes confirmation filter
✔ Exits (Fully Automated):
TP1: Close 50% at the first target
TP2: Fully exit at the second target
Stop Loss: Configurable SL included
🔧 Strategy Customization
All parameters are fully adjustable:
✅ ZLEMA length
✅ Volume confirmation mode (Spike or SMA)
✅ TP1/TP2/SL % levels
✅ Vortex length & threshold
✅ Gradient smoothing period
📈 Recommended Use Cases
Markets:
✅ Crypto (BTC, ETH, SOL, etc.)
✅ Forex (EUR/USD, GBP/JPY, etc.)
✅ Stocks & Indices (SPX, NASDAQ, DAX)
Timeframes:
✅ Swing: 1H – 4H – 1D
✅ Intraday: 5M – 15M – 30M
⚙️ Backtest Settings for Realistic Simulation
Initial Capital: $1,000
Commission: 0.05%
Slippage: 1
Date Filter: Built-in start and end time range
📢 TradingView Disclaimer
This script is for educational purposes only and does not constitute financial advice. Trading involves risk. Past performance is not indicative of future results. Always use demo testing before live deployment. Users are fully responsible for their own trading decisions.
🚀 Why Choose ZVGS Reactor?
✅ Zero-lag baseline with adaptive filtering
✅ Trend, strength, and volume confirmation
✅ Volume spike toggle for flexibility
✅ 100% Non-repainting — true signal stability
✅ Clean dashboard with real-time stats
✅ Works across all markets and timeframes
📢 Start Trading Smarter with ZVGS Reactor!
🔗 Use it on TradingView today and optimize your edge. 🔥

OBVious MA Strategy [1000X Trader]Exploring OBV: The OBVious MA Strategy
Are you using On Balance Volume (OBV) effectively? OBV is a gift to traders. OBV often provides a leading signal at the outset of a trend, when compression in the markets produces a surge in OBV prior to increased volatility.
This strategy demonstrates one method of utilizing OBV to your advantage. I call it the "OBVious MA Strategy ” only because it is so simple in its mechanics. This is meant to be a demonstration, not a strategy to utilize in live trading, as the primary utility of the OBVious MA indicator is as a volume confirmation filter that complements other components of a strategy. That said, I felt useful to present this indicator in isolation in this strategy to demonstrate the power it holds.
Strategy Features:
• OBV is the core signal: this strategy revolves around the On Balance Volume indicator. OBV is a straightforward indicator: it registers a value by adding total volume traded on up candles, and subtracts total volume on down candles, generating a line by connecting those values. OBV was described in 1963 by Joe Granville in his book "Granville's New Key to Stock Market Profits” in which the author argues that OBV is the most vital key to success as a trader, as volume changes are a major predictor of price changes.
• Dual Moving Averages: here we use separate moving averages for entries and exits. This allows for more granular trade management; for example, one can either extend the length of the exit MA to hold positions longer, or shorten the MA for swifter exits, independently of the entry signals.
Execution: long trades are taken when the OBV line crosses above the Long Entry Moving Average of the OBV. Long exits occur when the OBV line crosses under the Long Exit MA of the OBV. Shorts enter on a cross below the Short Entry MA, and exit on a cross above the Short Exit MA.
• Directional Trading: a direction filter can be set to "long" or "short," but not “both”, given that there is no trend filter in this strategy. When used in a bi-directional strategy with a trend filter, we add “both” to the script as a third option.
Application:
While this strategy outlines entry and exit conditions based on OBV crossovers with designated moving averages, is is, as stated, best used in conjunction with a supporting cast of confirmatory indicators (feel free to drop me a note and tell me how you've used it). It can be used to confirm entries, or you might try using it as a sole exit indicator in a strategy.
Visualization:
The strategy includes conditional plotting of the OBV MAs, which plot based on the selected trading direction. This visualization aids in understanding how OBV interacts with the set moving averages.
Further Discussion:
We all know the importance of volume; this strategy demonstrates one simple yet effective method of incorporating the OBV for volume analysis. The OBV indicator can be used in many ways - for example, we can monitor OBV trend line breaks, look for divergences, or as we do here, watch for breaks of the moving average.
Despite its simplicity, I'm unaware of any previously published cases of this method. The concept of applying MAs or EMAs to volume-based indicators like OBV is not uncommon in technical analysis, so I expect that work like this has been done before. If you know of other similar indicators or strategies, please mention in the comments.
One comparable strategy that uses EMAs of the OBV is QuantNomad’s "On Balance Volume Oscillator Strategy ", which uses a pair of EMAs on a normalized-range OBV-based oscillator. In that strategy, however, entries and exits occur on one EMA crossing the other, which places trades at distinctly different times than crossings of the OBV itself. Both are valid approaches with strength in simplicity.
Triple EMA + RSI + ATRThis comprehensive trading system combines triple EMA alignment, RSI momentum filtering, and dynamic ATR-based risk management. The strategy enters positions only when fast, medium, and slow EMAs align in proper order (bullish or bearish), confirmed by RSI remaining within defined thresholds (not overbought/oversold) and a volume spike above its moving average. Exits are managed intelligently using a multi-tier approach: a fixed stop-loss based on ATR, a first profit target at a predefined risk-reward ratio, and a trailing stop that activates after reaching a second, higher profit tier. Designed for trend-following with built-in momentum and volume confirmation, it features professional order execution with configurable commission and slippage for realistic backtesting. Visual cues including colored backgrounds and signal shapes enhance chart clarity.

多指标量化交易DIY- The indicator includes a very large menu of leading tools, each with its own logic to determine uptrend or downtrend impulses. Highlights include:
- Range Filter: Uses a dynamic centerline and bands computed via conditional EMA/SMA and range sizing to define directional movement. It can operate in a default mode or an alternative “DW” mode.
- Rational Quadratic Kernel (RQK): Applies a kernel smoothing model (Nadaraya Watson) to detect uptrends and downtrends with a focus on noise reduction.
- Supertrend, Half Trend, SSL Channel: Classic trend-following tools that derive direction from ATR-based bands or moving average channels.
- Ichimoku Cloud and SuperIchi: Multi-component systems validating trend via cloud position, conversion/base line relationships, projected cloud, and lagging span.
- TSI (True Strength Index), DPO (Detrended Price Oscillator), AO (Awesome Oscillator), MACD, STC (Schaff Trend Cycle), QQE Mod: Momentum and cycle tools that parse direction from crossovers, zero-line behavior, and momentum shifts.
- Donchian Trend Ribbon, Chandelier Exit: Trend and exit tools that can validate breakouts or sustained trend strength.
- ADX/DMI: Measures trend strength and directional movement via +DI/-DI relationships and minimum ADX thresholds.
- RSI and Stochastic: Use crossovers, level exits, or threshold filters to gate entries based on overbought/oversold dynamics or relative strength trends.
- Vortex, Chaikin Money Flow, VWAP, Bull Bear Power, ROC, Wolfpack Id, Hull Suite: A diverse set of directional, momentum, and volume-based indicators to suit different markets and styles.
- Trendline Breakout and Range Detector: Price-behavior filters that confirm signals during breakouts or within defined ranges.
Confirmation Filters
- Each filter is optional. When enabled, it must validate the leading condition for a signal to pass. Examples:
- EMA Filter: Requires price to be above a specified EMA for longs and below for shorts, filtering signals that contradict broader trend or baseline levels.
- 2 EMA Cross and 3 EMA Cross: Enforce moving average cross conditions (fast above slow for long, the reverse for short) or a three-line stacking logic for more stringent trend alignment.
- RQK, Supertrend, Half Trend, Donchian, QQE, Hull, MACD (crossover vs. zero-line), AO (zero line or AC momentum variants), SSL: Each adds its characteristic validation pattern.
- RSI family (MA cross, exits OB/OS zones, threshold levels) plus RSI MA direction and RSI/RSI MA limits: Multiple ways to constrain signals via relative strength behavior and trajectories.
- Choppiness Index and Damiani Volatility: Prevent entries during ranging conditions or insufficient volatility; choppiness thresholds and volatility states gate the trade.
- VWAP, Volume modes (above MA, simple up/down, delta), Chaikin Money Flow: Volume and flow conditions that ensure signals happen in supportive liquidity or accumulation/distribution contexts.
- ADX/DMI thresholds: Demand a minimum trend strength and directional DI alignment to reduce whipsaw trades.
- Trendline Breakout and Range Detector: Confirm that the price is breaking structure or remains within active range consistent with the leading setup.
- By combining several filters you can create strict, conservative entries or looser setups depending on your goals.
Range Filter Engine
- A core building block, the Range Filter uses conditional EMA and SMA functions to compute adaptive bands around a dynamic centerline. It supports two types:
- Type 1: The centerline updates when price exceeds the band thresholds; bands define acceptable drift ranges.
- Type 2: Uses quantized steps (via floor operations) relative to the previous centerline to handle larger moves in discrete increments.
- The engine offers smoothing for range values using a secondary EMA and can switch between raw and averaged outputs. Its hi/lo bands and centerline compose a corridor that defines directional movement and potential breakout confirmation.
Signal Construction
- The script computes:
- leadinglongcond and leadingshortcond : The primary directional signals from the chosen leading indicator.
- longCond and shortCond : Final signals formed by combining the leading conditions with all enabled confirmations. Each confirmation contributes a boolean gate. If a filter is disabled, it contributes a neutral pass-through, keeping the logic intact without enforcing that condition.
- Expiry Logic: The code counts consecutive bars where the leading condition remains true. If confirmations do not line up within the user-defined “Signal Expiry Candle Count,” the setup is abandoned and the signal does not trigger.
- Alternation: An optional state ensures that long and short signals alternate. This can reduce repeated entries in the same direction without a clear reset.
- Finally, longCondition and shortCondition represent the actionable signals after expiry and alternation logic. These drive the label plotting and alert conditions.
Visualization
- Buy and Sell Labels: When longCondition or shortCondition confirm, the script plots annotated labels directly on the chart, making entries easy to see at a glance. The labels use color coding and clear text tags (“long” vs. “short”).
- Dashboard: A table summarizes the status of the leading indicator and all confirmations. Each row shows the indicator label and whether it passed (✔️) or failed (❌) on the current bar. This intensely practical UI helps you diagnose why a signal did or did not trigger, empowering faster strategy iteration and parameter tuning.
- Failed Confirmation Markers: If a setup expires (count exceeds the limit) and confirmations failed to align, the script can mark the chart with a small label and provide a tooltip listing which confirmations did not pass. It’s a helpful audit trail to understand missed trades or prevent “chasing” invalid signals.
- Data Window Values: The script outputs signal states to the data window, which can be useful for debugging or building composite conditions in multi-indicator templates.
Inputs and Parameters
- You control the indicator from a comprehensive input panel:
- Setup: Signal expiry count, whether to enforce alternating signals, and whether to display labels and the dashboard (including position and size).
- Leading Indicator: Choose the primary signal generator from the large list.
- Per-Filter Toggles: For each confirmation, a respect... toggle enables or disables it. Many include sub-options (like MACD type, Stochastic mode, RSI mode, ADX variants, thresholds for choppiness/volatility, etc.) to fine-tune behavior.
- Range Filter Settings: Choose type and behavior; select default vs. DW mode and smoothing. The underlying functions adjust band sizes using ATR, average change, standard deviation, or user-defined scales.
- Because everything is customizable, you can adapt the indicator to different assets, volatility regimes, and timeframes.
Alerts and Automation
- The script defines alert conditions tied to longCondition and shortCondition . You can set these alerts in your chart to trigger notifications or webhook calls for automated execution in external bots. The alert text is simple, and you can configure your own message template when creating alerts in the chart, including JSON payloads for algorithmic integration.
Typical Workflow
- Select a Leading Indicator aligned with your style. For trend following, Supertrend or SSL may be appropriate; for momentum, MACD or TSI; for range/trend-change detection, Range Filter, RQK, or Donchian.
- Add a few key Confirmation Filters that complement the leading signal. For example:
- Pair Supertrend with EMA Filter and RSI MA Direction to ensure trend alignment and positive momentum.
- Combine MACD Crossover with ADX/DMI and Volume Above MA to avoid signals in low-trend or low-liquidity conditions.
- Use RQK with Choppiness Index and Damiani Volatility to only act when the market is trending and volatile enough.
- Set a sensible Signal Expiry Candle Count. Shorter expiry keeps entries timely and reduces lag; longer expiry captures setups that mature slowly.
- Observe the Dashboard during live markets to see which filters pass or fail, then iterate. Tighten or loosen thresholds and filter combinations as needed.
- For automation, turn on alerts for the final conditions and use webhook payloads to notify your trading robot.
Strengths and Practical Notes
- Flexibility: The indicator is a toolkit rather than a single rigid model. It lets you test different combinations rapidly and visualize outcomes immediately.
- Clarity: Labels, dashboard, and failed-confirmation markers make it easy to audit behavior and refine settings without digging into code.
- Robustness: The expiry and alternation options add discipline, avoiding the temptation to enter late or repeatedly in one direction without a reset.
- Modular Design: The logical gates (“respect…”) make the behavior transparent: if a filter is on, it must pass; if it’s off, the signal ignores it. This keeps reasoning clean.
- Avoiding Overfitting: Because you can stack many filters, it’s tempting to over-constrain signals. Start simple (one leading indicator and one or two confirmations). Add complexity only if it demonstrably improves your edge across varied market regimes.
Limitations and Recommendations
- No single configuration is universally optimal. Markets change; tune filters for the instrument and timeframe you trade and revisit settings periodically.
- Trend filters can underperform in choppy markets; likewise, momentum filters can false-trigger in quiet periods. Consider using Choppiness Index or Damiani to gate signals by regime.
- Use expiry wisely. Too short may miss good setups that need a few bars to confirm; too long may cause late entries. Balance responsiveness and accuracy.
- Always consider risk management externally (position sizing, stops, profit targets). The indicator focuses on signal quality; combining it with robust trade management methods will improve results.
Example Configurations
- Trend-Following Setup:
- Leading: Supertrend uptrend for longs and downtrend for shorts.
- Confirmations: EMA Filter (price above 200 EMA for long, below for short), ADX/DMI (trend strength above threshold with +DI/-DI alignment), Volume Above MA.
- Expiry: 3–4 bars to keep entries timely.
- Result: Strong bias toward sustained moves while avoiding weak trends and thin liquidity.
- Mean-Reversion to Momentum Crossover:
- Leading: RSI exits from OB/OS zones (e.g., RSI leaves oversold for long and leaves overbought for short).
- Confirmations: 2 EMA Cross (fast crossing slow in the same direction), MACD zero-line behavior for added momentum validation.
- Expiry: 2–3 bars for responsive re-entry.
- Result: Captures momentum transitions after short-term extremes, with extra confirmation to reduce head-fakes.
- Range Breakout Focus:
- Leading: Range Filter Type 2 or Donchian Trend Ribbon to detect breakouts.
- Confirmations: Damiani Volatility (avoid low-volatility false breaks), Choppiness Index (prefer trend-ready states), ROC positive/negative threshold.
- Expiry: 1–3 bars to act on breakout windows.
- Result: Better alignment to breakout dynamics, gating trades by volatility and regime.
Conclusion
- This indicator is a comprehensive, configurable framework that merges a chosen leading signal with an array of corroborating filters, disciplined expiry handling, and intuitive visualization. It’s designed to help you build high-quality entry signals tailored to your approach, whether that’s trend-following, breakout trading, momentum capturing, or a hybrid. By surfacing pass/fail states in a dashboard and allowing alert-based automation, it bridges the gap between discretionary analysis and systematic execution. With sensible parameter tuning and thoughtful filter selection, it can serve as a robust backbone for signal generation across diverse instruments and timeframes.

FlowStateTrader FlowState Trader - Advanced Time-Filtered Strategy
## Overview
FlowState Trader is a sophisticated algorithmic trading strategy that combines precision entry signals with intelligent time-based filtering and adaptive risk management. Built for traders seeking to achieve their optimal performance state, FlowState identifies high-probability trading opportunities within user-defined time windows while employing dynamic trailing stops and partial position management.
## Core Strategy Philosophy
FlowState Trader operates on the principle that peak trading performance occurs when three elements align: **Focus** (precise entry signals), **Flow** (optimal time windows), and **State** (intelligent position management). This strategy excels at finding reversal opportunities at key support and resistance levels while filtering out suboptimal trading periods to keep traders in their optimal flow state.
## Key Features
### 🎯 Focus Entry System
**Support/Resistance Zone Trading**:
- Dynamic identification of key price levels using configurable lookback periods
- Entry signals triggered when price interacts with these critical zones
- Volume confirmation ensures genuine breakout/reversal momentum
- Trend filter alignment prevents counter-trend disasters
**Entry Conditions**:
- **Long Signals**: Price closes above support buffer, touches support level, with above-average volume
- **Short Signals**: Price closes below resistance buffer, touches resistance level, with above-average volume
- Optional trend filter using EMA or SMA for directional bias confirmation
### ⏰ FlowState Time Filtering System
**Comprehensive Time Controls**:
- **12-Hour Format Trading Windows**: User-friendly AM/PM time selection
- **Multi-Timezone Support**: UTC, EST, PST, CST with automatic conversion
- **Day-of-Week Filtering**: Trade only weekdays, weekends, or both
- **Lunch Hour Avoidance**: Automatically skips low-volume lunch periods (12-1 PM)
- **Visual Time Indicators**: Background coloring shows active/inactive trading periods
**Smart Time Features**:
- Handles overnight trading sessions seamlessly
- Prevents trades during historically poor performance periods
- Customizable trading hours for different market sessions
- Real-time trading window status in dashboard
### 🛡️ Adaptive Risk Management
**Multi-Level Take Profit System**:
- **TP1**: First profit target with optional partial position closure
- **TP2**: Final profit target for remaining position
- **Flexible Scaling**: Choose number of contracts to close at each level
**Dynamic Trailing Stop Technology**:
- **Three Operating Modes**:
- **Conservative**: Earlier activation, tighter trailing (protect profits)
- **Balanced**: Optimal risk/reward balance (recommended)
- **Aggressive**: Later activation, wider trailing (let winners run)
- **ATR-Based Calculations**: Adapts to current market volatility
- **Automatic Activation**: Engages when position reaches profitability threshold
### 📊 Intelligent Position Sizing
**Contract-Based Management**:
- Configurable entry quantity (1-1000 contracts)
- Partial close quantities for profit-taking
- Clear position tracking and P&L monitoring
- Real-time position status updates
### 🎨 Professional Visualization
**Enhanced Chart Elements**:
- **Entry Zone Highlighting**: Clear visual identification of trading opportunities
- **Dynamic Risk/Reward Lines**: Real-time TP and SL levels with price labels
- **Trailing Stop Visualization**: Live tracking of adaptive stop levels
- **Support/Resistance Lines**: Key level identification
- **Time Window Background**: Visual confirmation of active trading periods
**Dual Dashboard System**:
- **Strategy Dashboard**: Real-time position info, settings status, and current levels
- **Performance Scorecard**: Live P&L tracking, win rates, and trade statistics
- **Customizable Sizing**: Small, Medium, or Large display options
### ⚙️ Comprehensive Customization
**Core Strategy Settings**:
- **Lookback Period**: Support/resistance calculation period (5-100 bars)
- **ATR Configuration**: Period and multipliers for stops/targets
- **Reward-to-Risk Ratios**: Customizable profit target calculations
- **Trend Filter Options**: EMA/SMA selection with adjustable periods
**Time Filter Controls**:
- **Trading Hours**: Start/end times in 12-hour format
- **Timezone Selection**: Four major timezone options
- **Day Restrictions**: Weekend-only, weekday-only, or unrestricted
- **Session Management**: Lunch hour avoidance and custom periods
**Risk Management Options**:
- **Trailing Stop Modes**: Conservative/Balanced/Aggressive presets
- **Partial Close Settings**: Enable/disable with custom quantities
- **Alert System**: Comprehensive notifications for all trade events
### 📈 Performance Tracking
**Real-Time Metrics**:
- Net profit/loss calculation
- Win rate percentage
- Profit factor analysis
- Maximum drawdown tracking
- Total trade count and breakdown
- Current position P&L
**Trade Analytics**:
- Winner/loser ratio tracking
- Real-time performance scorecard
- Strategy effectiveness monitoring
- Risk-adjusted return metrics
### 🔔 Alert System
**Comprehensive Notifications**:
- Entry signal alerts with price and quantity
- Take profit level hits (TP1 and TP2)
- Stop loss activations
- Trailing stop engagements
- Position closure notifications
## Strategy Logic Deep Dive
### Entry Signal Generation
The strategy identifies high-probability reversal points by combining multiple confirmation factors:
1. **Price Action**: Looks for price interaction with key support/resistance levels
2. **Volume Confirmation**: Ensures sufficient market interest and liquidity
3. **Trend Alignment**: Optional filter prevents counter-trend positions
4. **Time Validation**: Only trades during user-defined optimal periods
5. **Zone Analysis**: Entry occurs within calculated buffer zones around key levels
### Risk Management Philosophy
FlowState Trader employs a three-tier risk management approach:
1. **Initial Protection**: ATR-based stop losses set at strategy entry
2. **Profit Preservation**: Trailing stops activate once position becomes profitable
3. **Scaled Exit**: Partial profit-taking allows for both security and potential
### Time-Based Edge
The time filtering system recognizes that not all trading hours are equal:
- Avoids low-volume, high-spread periods
- Focuses on optimal liquidity windows
- Prevents trading during news events (lunch hours)
- Allows customization for different market sessions
## Best Practices and Optimization
### Recommended Settings
**For Scalping (1-5 minute charts)**:
- Lookback Period: 10-20
- ATR Period: 14
- Trailing Stop: Conservative mode
- Time Filter: Major session hours only
**For Day Trading (15-60 minute charts)**:
- Lookback Period: 20-30
- ATR Period: 14-21
- Trailing Stop: Balanced mode
- Time Filter: Extended trading hours
**For Swing Trading (4H+ charts)**:
- Lookback Period: 30-50
- ATR Period: 21+
- Trailing Stop: Aggressive mode
- Time Filter: Disabled or very broad
### Market Compatibility
- **Forex**: Excellent for major pairs during active sessions
- **Stocks**: Ideal for liquid stocks during market hours
- **Futures**: Perfect for index and commodity futures
- **Crypto**: Effective on major cryptocurrencies (24/7 capability)
### Risk Considerations
- **Market Conditions**: Performance varies with volatility regimes
- **Timeframe Selection**: Lower timeframes require tighter risk management
- **Position Sizing**: Never risk more than 1-2% of account per trade
- **Backtesting**: Always test on historical data before live implementation
## Educational Value
FlowState serves as an excellent learning tool for:
- Understanding support/resistance trading
- Learning proper time-based filtering
- Mastering trailing stop techniques
- Developing systematic trading approaches
- Risk management best practices
## Disclaimer
This strategy is for educational and informational purposes only. Past performance does not guarantee future results. Trading involves substantial risk of loss and is not suitable for all investors. Users should thoroughly backtest the strategy and understand all risks before live trading. Always use proper position sizing and never risk more than you can afford to lose.
---
*FlowState Trader represents the evolution of systematic trading - combining classical technical analysis with modern risk management and intelligent time filtering to help traders achieve their optimal performance state through systematic, disciplined execution.*

[Stratégia] VWAP Mean Magnet v9 (Simple Alert)This strategy is specifically designed for a ranging (sideways-moving) Bitcoin market.
A trade is only opened and signaled on the chart if all three of the following conditions are met simultaneously at the close of a candle:
Zone Entry
The price must cross into the signal zone: the red band for a Short (sell) position, or the green band for a Long (buy) position.
RSI Confirmation
The RSI indicator must also confirm the signal. For a Short, it must go above 65 (overbought condition). For a Long, it must fall below 25 (oversold condition).
Volume Filter
The volume on the entry candle cannot be excessively high. This safety filter is designed to prevent trades during risky, high-momentum breakouts.

Parallax Momentum MNQ Strategy# 📈 Parallax Momentum MNQ Strategy
## Overview
The Parallax Momentum MNQ Strategy is a sophisticated support/resistance breakout system specifically designed for Micro Nasdaq futures (MNQ) trading (also works on minis). This strategy combines dynamic level detection with momentum confirmation to identify high-probability entry opportunities while maintaining strict risk management protocols.
## 🎯 Key Features
### Core Strategy Logic
- **Dynamic Support/Resistance Detection**: Automatically identifies key levels using configurable lookback periods
- **Momentum Confirmation**: Volume-based filtering ensures trades align with market momentum
- **ATR-Based Risk Management**: Adaptive stop losses and take profits based on market volatility
- **Dual Entry System**: Both long and short opportunities with limit order execution
### Risk Management
- **ATR-Adaptive Stops**: Stop losses and take profits automatically adjust to market volatility
- **Reward-to-Risk Ratios**: Configurable R:R ratios with default 2:1 minimum
- **Maximum Loss Protection**: Optional daily loss limits to prevent overtrading
- **Session Time Filtering**: Trade only during specified market hours
### Strategy Modes
- **Conservative Mode**: 0.8x risk multiplier for cautious trading
- **Balanced Mode**: Standard 1.0x risk multiplier (default)
- **Aggressive Mode**: 1.2x risk multiplier for active trading
## 📊 Visual Features
### Dashboard Display
- Real-time strategy status and performance metrics
- Current support/resistance levels and ATR values
- Live risk-to-reward ratios for potential trades
- Win rate, profit factor, and drawdown statistics
- Adjustable dashboard size and positioning
### Chart Indicators
- Support and resistance lines with labels
- ATR-based levels (+/-1 ATR and +/-2 ATR)
- Dynamic visual updates as levels change
- Configurable line extensions and styling
## ⚙️ Configuration Options
### Entry Filters
- **Volume Filter**: Optional volume confirmation above SMA
- **Session Time Filter**: 12-hour format time restrictions
- **ATR vs Fixed Stops**: Choose between adaptive or fixed tick-based exits
### Risk Controls
- **ATR Period**: Default 14-period ATR calculation
- **Stop Loss Multiplier**: ATR-based stop distance (default 1.5x)
- **Take Profit Multiplier**: ATR-based target distance (default 1.5x)
- **Secondary Take Profit**: Optional TP2 with position scaling
## 📋 How It Works
### Entry Conditions
**Long Trades**: Triggered when price closes above support buffer but low touches support level, with volume and session confirmation
**Short Trades**: Triggered when price closes below resistance buffer but high touches resistance level, with volume and session confirmation
### Exit Strategy
- **Primary Take Profit**: ATR-based target with 2:1 R:R minimum
- **Stop Loss**: ATR-based protective stop
- **Optional TP2**: Extended target for partial profit taking
- **One Trade at a Time**: No overlapping positions
## 🎛️ Default Settings
- **Lookback Period**: 20 bars for support/resistance detection
- **ATR Period**: 14 bars for volatility calculation
- **Stop Loss**: 1.5x ATR from entry
- **Take Profit**: 1.5x ATR with 2:1 reward-to-risk ratio
- **Session**: 7:30 AM - 2:00 PM (configurable)
## ⚠️ Important Notes
### Risk Disclaimer
- This strategy is for educational and informational purposes only
- Past performance does not guarantee future results
- Always use proper position sizing and risk management
- Test thoroughly on historical data before live trading
- Consider market conditions and volatility when using
### Best Practices
- Backtest on sufficient historical data
- Start with conservative mode for new users
- Monitor performance regularly and adjust parameters as needed
- Use appropriate position sizing for your account
- Consider broker commissions and slippage in live trading
## 🔧 Customization
The strategy offers extensive customization options including:
- Adjustable time sessions with AM/PM format
- Configurable ATR and risk parameters
- Optional maximum daily loss limits
- Dashboard size and position controls
- Visual element toggles and styling
## 📈 Ideal For
- MNQ (Micro Nasdaq) futures traders
- Intraday momentum strategies
- Traders seeking systematic entry/exit rules
- Risk-conscious traders wanting automated stops
- Both beginner and experienced algorithmic traders
---
**Version**: Pine Script v5 Compatible
**Timeframe**: Works on multiple timeframes (test on 1m, 3m, 5m, 15m)
**Market**: Optimized for MNQ but adaptable to other instruments
**Strategy Type**: Trend following with momentum confirmation

US30 Stealth StrategyOnly works on US30 (CAPITALCOM) 5 Minute chart
📈 Core Concept:
This is a trend-following strategy that captures strong market continuations by entering on:
The 3rd swing in the current trend,
Confirmed by a volume-verified engulfing candle,
With adaptive SL/TP and position sizing based on risk.
🧠 Entry Logic:
✅ Trend Filter
Uses a 50-period Simple Moving Average (SMA).
Buy only if price is above SMA → Uptrend
Sell only if price is below SMA → Downtrend
✅ Swing Count Logic
For buy: Wait for the 3rd higher low
For sell: Wait for the 3rd lower high
Uses a 5-bar lookback to detect highs/lows
This ensures you’re not buying early — but after trend is confirmed with structure.
✅ Engulfing Candle Confirmation
Bullish engulfing for buys
Bearish engulfing for sells
Candle must engulf previous bar completely (body logic)
✅ Volume Filter
Current candle volume must be greater than the 20-period volume average
Ensures trades only occur with institutional participation
✅ MA Slope Filter
Requires the slope of the 50 SMA over the last 3 candles to exceed 0.1
Avoids chop or flat trends
Adds momentum confirmation to the trade
✅ Session Filter (Time Filter)
Trades only executed between:
2:00 AM to 11:00 PM Oman Time (UTC+4)
Helps avoid overnight chop and illiquidity
📊 Position Sizing & Risk Management
✅ Smart SL (Adaptive Stop Loss)
SL is based on full size of the signal candle (including wick)
But if candle is larger than 25 points, SL is cut to half the size
This prevents oversized risk from long signals during volatile moves.

Shockwave⚡️ Shockwave – Precision Momentum Strategy
🔹 Purpose
Shockwave is a precision-engineered trend and momentum strategy designed for aggressive, high-conviction trades. Built for volatile markets like crypto, this system enters only when trend, volume, and momentum are fully aligned — then exits intelligently using layered profit targets and trend weakening logic.
It filters out false breakouts, traps, and low-quality setups using advanced multi-factor confirmation. Ideal for trend-following traders who want cleaner signals, no repainting, and adaptive position handling.
🔹 Indicator Breakdown
1️⃣ ZLEMA + Gradient Filter (Trend Core)
Defines the trend using a Zero Lag EMA (ZLEMA) for responsiveness.
Gradient slope confirms acceleration or weakening in trend direction.
Uptrend: ZLEMA is rising and slope > 0.
Downtrend: ZLEMA is falling and slope < 0.
2️⃣ Smoothed CCI (Momentum Confirmation)
Uses ZLEMA as the source for CCI to avoid noise.
Bullish momentum: CCI rising above 0.
Bearish momentum: CCI falling below 0.
Filters out chop and premature entries.
3️⃣ Volume Spike Filter
Median-based filter confirms breakout volume integrity.
Requires volume > 1.5x median of previous candles.
Avoids low-volume whipsaws.
4️⃣ Vortex Indicator (Trend Strength Confirmation)
Confirms directional conviction by comparing VI+ vs VI–.
Long: VI+ > VI– and threshold difference is met.
Short: VI– > VI+ and trend strength is validated.
5️⃣ Wick Trap Filter (Reversal Trap Detection)
Blocks entries on manipulative upper/lower wick patterns.
Longs rejected if upper wick > 1.5× body and close is weak.
Shorts rejected if lower wick > 1.5× body and close is strong.
🔹 Strategy Logic & Trade Execution
✅ Entry Conditions
A trade is entered only when all the following align:
ZLEMA trend direction is confirmed.
CCI momentum matches the trend.
Volume spike confirms participation.
Vortex difference meets strength threshold.
No wick trap is present.
✅ Exit Conditions
TP1: 50% of the position is closed at the first profit level.
TP2: Remaining 50% is closed at the second target.
Weak Trend Exit: If ZLEMA slope flips against the trade, the position is closed early.
A 1-bar cooldown delay is enforced after closing to prevent same-bar reentry.
🔹 Take-Profit System
TP1: 50% close at +2% for longs / –2% for shorts
TP2: Full close at +4% for longs / –4% for shorts
Limit orders are used for precise profit-taking
TP1/TP2 status is tracked and displayed in the live dashboard
🔹 Risk Management (Important)
🚫 This strategy does not include a stop-loss by default.
Trades are exited using trend reversal detection or TP targets.
💡 Suggested risk controls:
Add a manual stop-loss based on recent swing high/low
Use appropriate position sizing based on volatility
Apply the strategy in strong trending environments
🔹 Default Backtest Settings
Initial Capital: $1,000
Position Size: 10% of equity per trade
Commission: 0.05%
Slippage: 1
Strategy Date Filter: Adjustable (default: 2023–2029)
🔹 How to Use Shockwave
Apply to any chart (best results on 1H or higher).
Review backtest performance.
Adjust take-profit percentages or thresholds as needed.
Use in strongly trending markets — avoid sideways ranges.
Add your own stop-loss if desired.
⚠️ Disclaimer
This strategy is for educational and informational purposes only. It is not financial advice. Trading involves risk, and past performance does not guarantee future results. Always test thoroughly and manage your own risk.
🚀 Why Use Shockwave?
✔ Multi-layer confirmation for high-quality entries
✔ Non-repainting logic for backtest/live consistency
✔ Adaptive trend/momentum filtering
✔ Dual profit targets for smart trade management
✔ Visual dashboard with live tracking

Prime Trend ReactorIntroduction
Prime Trend Reactor is an advanced crypto trend-following strategy designed to deliver precision entries and exits based on a multi-factor trend consensus system.
It combines price action, adaptive moving averages, momentum oscillators, volume analysis, volatility signals, and higher timeframe trend confirmation into a non-repainting, fully systematic approach.
This strategy is original: it builds a unique trend detection matrix by blending multiple forms of price-derived signals through weighted scoring, rather than simply stacking indicators.
It is not a mashup of public indicators — it is engineered from the ground up using custom formulas and strict non-repainting design.
It is optimized for 1-hour crypto charts but can be used across any asset or timeframe.
⚙️ Core Components
Prime Trend Reactor integrates the following custom components:
1. Moving Averages System
Fast EMA (8), Medium EMA (21), Slow EMA (50), Trend EMA (200).
Detects short-term, medium-term, and long-term trend structures.
EMA alignment is scored as part of the trend consensus system.
2. Momentum Oscillators
RSI (Relative Strength Index) with Smoothing.
RMI (Relative Momentum Index) custom-calculated.
Confirms price momentum behavior aligned with trend.
3. Volume Analysis
CMF (Chaikin Money Flow) for accumulation/distribution pressure.
OBV (On Balance Volume) EMA Cross for volume flow confirmation.
4. Volatility and Price Structure
Vortex Indicator (VI+ and VI-) for trend strength and directional bias.
Mean-Extreme Price Engine blends closing price with extremes (high/low) based on user-defined ratio.
5. Structure Breakout Detection
Detects structure breaks based on highest high/lowest low pivots.
Adds weight to trend strength on fresh breakouts.
6. Higher Timeframe Confirmation (HTF)
Uses higher timeframe EMAs and close to confirm macro-trend direction.
Smartly pulls HTF data with barmerge.lookahead_off to avoid repainting.
🔥 Entry and Exit Logic
Long Entry: Triggered when multi-factor trend consensus turns strongly bullish.
Short Entry: Triggered when consensus flips strongly bearish.
Take Profits (TP1/TP2):
TP1: Partial 50% profit at small target.
TP2: Full 100% close at larger target.
Exit on Trend Reversal:
If trend consensus reverses before hitting TP2, the strategy exits early to protect capital.
TP Hits and Trend Reversals fire real-time webhook-compatible alerts.
🧩 Trend Consensus Matrix (Original Concept)
Instead of relying on a single indicator, Prime Trend Reactor calculates a weighted score using:
EMA Alignment
Momentum Oscillators (RSI + RMI)
Volume Analysis
Volatility (Vortex)
Higher Timeframe Bias
Each component adds a weighted contribution to the final trend strength score.
Only when the weighted score exceeds a user-defined threshold does the system allow entries.
This multi-dimensional scoring system is original and engineered specifically to avoid noisy or lagging traditional signals.
📈 Visualization and Dashboard
Custom EMA Clouds dynamically fill between Fast/Medium EMAs.
Colored Candles show real-time trend direction.
Dynamic Dashboard displays:
Current Position (Long/Short/Flat)
Entry Price
TP1 and TP2 Hit Status
Bars Since Entry
Win Rate (%)
Profit Factor
Current Trend Signal
Consensus Score (%)
🛡️ Non-Repainting Design
All trend calculations are based on current and confirmed past data.
HTF confirmations use barmerge.lookahead_off.
No same-bar entries and exits — enforced logic prevents overlap.
No lookahead bias.
Strict variable handling ensures confirmed-only trend state transitions.
✅ 100% TradingView-approved non-repainting behavior.
📣 Alerts and Webhooks
This strategy includes full TradingView webhook support:
Long/Short Entries
TP1 Hit (Partial Exit)
TP2 Hit (Full Exit)
Exit on Trend Reversal
All alerts use constant-string JSON formatting compliant with TradingView multi-exchange bots:
📜 TradingView Mandatory Disclaimer
This strategy is a tool to assist in market analysis. It does not guarantee profitability. Trading financial markets involves risk. You are solely responsible for your trading decisions. Past performance does not guarantee future results.

AccumulationPro Money Flow StrategyAccumulationPro Money Flow Strategy identifies stock trading opportunities by analyzing money flow and potential long-only opportunities following periods of increased money inflow. It employs proprietary responsive indicators and oscillators to gauge the strength and momentum of the inflow relative to previous periods, detecting money inflow, buying/selling pressure, and potential continuation/reversals, while using trailing stop exits to maximize gains while minimizing losses, with careful consideration of risk management and position sizing.
Setup Instructions:
1. Configuring the Strategy Properties:
Click the "Settings" icon (the gear symbol) next to the strategy name.
Navigate to the "Properties" tab within the Settings window.
Initial Capital: This value sets the starting equity for the strategy backtesting. Keep in mind that you will need to specify your current account size in the "Inputs" settings for position sizing.
Base Currency: Leave this setting at its "Default" value.
Order Size: This setting, which determines the capital used for each trade during backtesting, is automatically calculated and updated by the script. You should leave it set to "1 Contract" and the script will calculate the appropriate number of contracts based on your risk per trade, account size, and stop-loss placement.
Pyramiding: Set this setting at 1 order to prevent the strategy from adding to existing positions.
Commission: Enter your broker's commission fee per trade as a percentage, some brokers might offer commission free trading. Verify Price for limit orders: Keep this value as 0 ticks.
Slippage: This value depends on the instrument you are trading, If you are trading liquid stocks on a 1D chart slippage might be neglected. You can Keep this value as 1 ticks if you want to be conservative.
Margin for long positions/short positions: Set both of these to 100% since this strategy does not employ leverage or margin trading.
Recalculate:
Select the "After order is filled" option.
Select the "On every tick" option.
Fill Orders: Keep “Using bar magnifier” unselected.
Select "On bar close". Select "Using standard OHLC"
2. Configuring the Strategy Inputs:
Click the "Inputs" tab in the Settings window.
From/Thru (Date Range): To effectively backtest the strategy, define a substantial period that includes various bullish and bearish cycles. This ensures the testing window captures a range of market conditions and provides an adequate number of trades. It is usually favorable to use a minimum of 8 years for backtesting. Ensure the "Show Date Range" box is checked.
Account Size: This is your actual current Account Size used in the position sizing table calculations.
Risk on Capital %: This setting allows you to specify the percentage of your capital you are willing to risk on each trade. A common value is 0.5%.
3. Configuring Strategy Style:
Select the "Style" tab.
Select the checkbox for “Stop Loss” and “Stop Loss Final” to display the black/red Average True Range Stop Loss step-lines
Make sure the checkboxes for "Upper Channel", "Middle Line", and "Lower Channel" are selected.
Select the "Plots Background" checkboxes for "Color 0" and "Color 1" so that the potential entry and exit zones become color-coded.
Having the checkbox for "Tables" selected allows you to see position sizing and other useful information within the chart.
Have the checkboxes for "Trades on chart" and "Signal Labels" selected for viewing entry and exit point labels and positions.
Uncheck* the "Quantity" checkbox.
Precision: select “Default”.
Check “Labels on price scale”
Check “Values in status line”
Strategy Application Guidelines:
Entry Conditions:
The strategy identifies long entry opportunities based on substantial money inflow, as detected by our proprietary indicators and oscillators. This assessment considers the strength and momentum of the inflow relative to previous periods, in conjunction with strong price momentum (indicated by our modified, less-lagging MACD) and/or a potential price reversal (indicated by our modified, less-noisy Stochastic). Additional confirmation criteria related to price action are also incorporated. Potential entry and exit zones are visually represented by bands on the chart.
A blue upward-pointing arrow, accompanied by the label 'Long' and green band fills, signifies a long entry opportunity. Conversely, a magenta downward-pointing arrow, labeled 'Close entry(s) order Long' with yellow band fills, indicates a potential exit.
Take Profit:
The strategy employs trailing stops, rather than fixed take-profit levels, to maximize gains while minimizing losses. Trailing stops adjust the stop-loss level as the stock price moves in a favorable direction. The strategy utilizes two types of trailing stop mechanisms: one based on the Average True Range (ATR), and another based on price action, which attempts to identify shifts in price momentum.
Stop Loss:
The strategy uses an Average True Range (ATR)-based stop-loss, represented by two lines on the chart. The black line indicates the primary ATR-based stop-loss level, set upon trade entry. The red line represents a secondary ATR stop-loss buffer, used in the position sizing calculation to account for potential slippage or price gaps.
To potentially reduce the risk of stop-hunting, discretionary traders might consider using a market sell order within the final 30 to 60 minutes of the main session, instead of automated stop-loss orders.
Order Types:
Market Orders are intended for use with this strategy, specifically when the candle and signal on the chart stabilize within the final 30 to 60 minutes of the main trading session.
Position Sizing:
A key aspect of this strategy is that its position size is calculated and displayed in a table on the chart. The position size is calculated based on stop-loss placement, including the stop-loss buffer, and the capital at risk per trade which is commonly set around 0.5% Risk on Capital per Trade.
Backtesting:
The backtesting results presented below the chart are for informational purposes only and are not intended to predict future performance. Instead, they serve as a tool for identifying instruments with which the strategy has historically performed well.
It's important to note that the backtester utilizes a tiny portion of the capital for each trade while our strategy relies on a diversified portfolio of multiple stocks or instruments being traded at once.
Important Considerations:
Volume data is crucial; the strategy will not load or function correctly without it. Ensure that your charts include volume data, preferably from a centralized exchange.
Our system is designed for trading a portfolio. Therefore, if you intend to use our system, you should employ appropriate position sizing, without leverage or margin, and seek out a variety of long opportunities, rather than opening a single trade with an excessively large position size.
If you are trading without automated signals, always allow the chart to stabilize. Refrain from taking action until the final 1 hour to 30 minutes before the end of the main trading session to minimize the risk of acting on false signals.
To align with the strategy's design, it's generally preferable to enter a trade during the same session that the signal appears, rather than waiting for a later session.
Disclaimer:
Trading in financial markets involves a substantial degree of risk. You should be aware of the potential for significant financial losses. It is imperative that you trade responsibly and avoid overtrading, as this can amplify losses. Remember that market conditions can change rapidly, and past performance is not indicative of future results. You could lose some or all of your initial investment. It is strongly recommended that you fully understand the risks involved in trading and seek independent financial advice from a qualified professional before using this strategy.

Titan X 📈 Titan X – Optimized Trend Strategy with Gradient ZLEMA, RMI, CCI, ROC, and Volume Confirmation
Titan X is a precision-engineered trend-following strategy designed for crypto markets and high-volatility assets. It is not just a combination of indicators, but a carefully constructed, non-repainting system where each component plays a specific role in confirming high-probability trade setups. The strategy detects strong directional moves, confirms them with momentum and volume, and manages trade exits without relying on traditional stop losses.
🔍 How the Indicators Work Together
✅ 1. ZLEMA Baseline + Gradient Filter
A Zero Lag Exponential Moving Average (ZLEMA) is used to track directional trend with minimal lag.
A gradient (slope) is calculated from the ZLEMA to measure trend acceleration. This confirms whether a trend is gaining strength or losing momentum.
Entries are only taken when the ZLEMA gradient exceeds a user-defined threshold, ensuring trades are only taken in strong, developing trends.
✅ 2. RMI – Relative Momentum Index (with Memory)
RMI captures sustained momentum direction over time.
It helps validate that price isn't just spiking, but truly trending.
Titan X uses RMI as a trend memory filter, requiring consistent momentum alignment before entry.
✅ 3. Momentum Timing – ROC + CCI
The Rate of Change (ROC) determines the strength and direction of recent momentum.
The Commodity Channel Index (CCI) checks price deviation from a moving average baseline, identifying whether momentum is aligned with market structure.
This combo prevents trades in weak, flat, or conflicting conditions.
✅ 4. Volume Spike Confirmation
Titan X uses a relative volume filter, requiring the current bar’s volume to exceed a moving average threshold.
This ensures trades are only triggered when there is clear breakout interest from market participants, helping avoid fakeouts and low-volume moves.
🎯 Trade Entry & Exit Rules
✅ Entry Conditions:
All five filters must align:
Trend direction (ZLEMA slope)
Momentum (ROC & CCI)
Trend memory (RMI)
Volume (Spike filter)
Trades are entered on the next bar after all confirmations, ensuring 100% non-repainting behavior.
✅ Take Profit System (Multi-Level TP):
TP1: Closes 50% of the position at a user-defined % gain (default: 2%)
TP2: Closes the remaining 50% of the position at a higher % gain (default: 4%)
Each TP is executed via limit order to ensure realistic and backtestable fills.
❌ No Stop Loss Used
Instead of using fixed stop losses, Titan X closes positions early when trend conditions weaken.
This dynamic exit logic is based on a reversal in ZLEMA gradient, which serves as a weak trend detection system.
⏱️ Cooldown Logic
A 1-bar cooldown is enforced between trades to avoid same-bar exit/entry violations on TradingView.
This improves execution accuracy and avoids overtrading on choppy price action.
📊 Real-Time Strategy Dashboard
Titan X includes a live dashboard that provides full transparency:
Current Position (Long / Short / Flat)
Entry Price
TP1 Hit? / TP2 Hit?
Bars Since Entry
Win Rate (%)
Profit Factor
Ideal for both manual monitoring and automated bot strategies.
🔔 Bot-Ready Multi-Exchange Alerts
Alerts can be configured for:
ENTER-LONG, ENTER-SHORT
EXIT-LONG, EXIT-SHORT
TP1 / TP2 targets
Messages are fully customizable and designed for platforms like:
WonderTrading
3Commas
TradingConnector
⚙️ Designed For:
Timeframes: 1H and 4H (optimized for crypto)
Markets: Altcoins, BTC/ETH, high-volatility pairs
Traders: Trend-followers, momentum scalpers, algo bot users
Goal: High accuracy entries, structured exits, zero repainting, and flexible trade management
⚠️ TradingView Disclosure
This strategy is provided for educational purposes only. It does not constitute investment advice, nor does it guarantee any returns. Trading carries risk; test thoroughly before using in live environments.

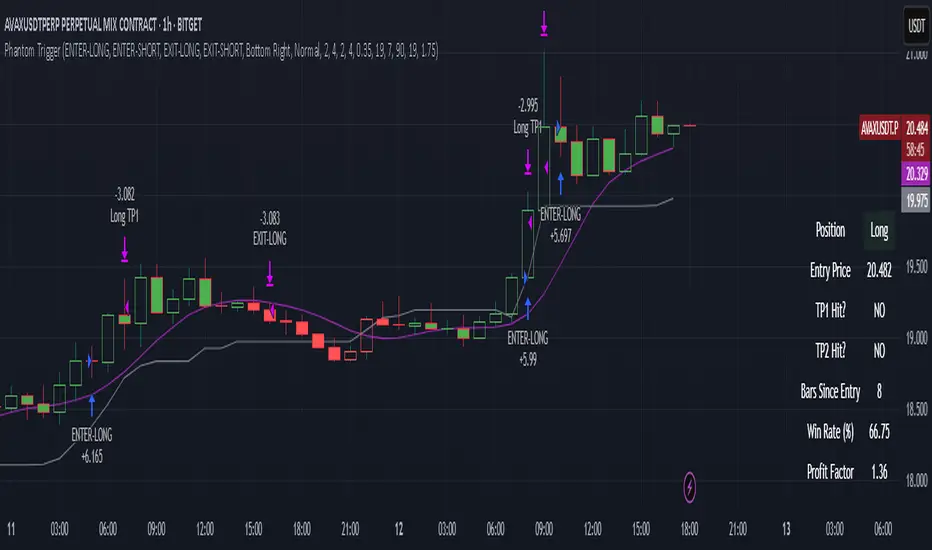
Phantom Trigger Phantom Trigger – Precision Trend Execution with TP1/TP2 and Weak Trend Exits
Phantom Trigger is a professional-grade trend-following strategy designed for crypto and high-volatility assets. It combines advanced trend detection with precise risk-managed exits using a multi-level take-profit system.
🔍 What It Does
Identifies strong directional moves using a multi-stage smoothed trend model
Confirms entries using structure-based logic and volume pressure
Filters trades using bias zones, confirmation levels, and trend acceleration
Automatically manages trades with two-stage take-profits (TP1 and TP2)
Exits early on trend weakness before reversal
Includes a styled real-time dashboard and bar coloring for visual guidance
Sends bot-compatible alerts for multi-exchange automation
⚙️ Core Components
Trend Engine: A smoothed dynamic filter detects real-time trend direction and momentum shifts
Bias Structure: Mid-high/low range-based logic determines if price is favoring bullish or bearish structure
Confirmation Levels: Short- and long-term zone crossovers confirm directional alignment
Volume Filter: Detects volume expansion spikes to validate strong breakout potential
TP1/TP2 Logic: Dynamically sets two profit targets and executes partial and full exits automatically
Weak Trend Exit: Closes positions one bar before reversal using directional filters
🧠 How to Use
Works best on crypto (1H, 4H) and high-volume instruments
Use dashboard stats to monitor position status, PnL, and TP1/TP2 progression
Alerts are pre-labeled and compatible with bots like 3Commas, Wunderbit, etc.
Can be adapted for both scalping and swing trading
📊 Dashboard
The built-in real-time dashboard displays current trade status, entry price, TP1/TP2 progress, win rate, profit factor, and bars since entry. It updates live with every candle and provides a quick-glance overview to support your decision-making during active trades.
🧠 How to Use
Works best on crypto (1H, 4H) and high-volume instruments
Use dashboard stats to monitor position status, PnL, and TP1/TP2 progression
Alerts are pre-labeled and compatible with bots like 3Commas, Wunderbit, etc.
Can be adapted for both scalping and swing trading
⚠️ Disclaimer
This script is for educational purposes only and does not constitute financial advice. Always test strategies thoroughly using demo or backtesting environments before applying to live markets. Past performance is not indicative of future results.
Stealth Trigger X🔰 Stealth Trigger X — Smart Divergence & Breakout Strategy with Trend Weakness Exit
Stealth Trigger X is a precision-engineered, non-repainting strategy designed for traders who rely on high-conviction breakouts and trend confirmation. Rather than relying on lagging or oversimplified signals, this strategy fuses divergence logic, volatility detection, volume filtering, and slope-based trend validation into one clean system — making it both responsive and reliable.
📌 Core Components (How It Works):
1. ZLEMA (Zero-Lag Exponential Moving Average):
Used as the primary trend baseline. Unlike a standard EMA, ZLEMA compensates for lag by using a double-smoothing technique that allows the strategy to detect trend direction changes sooner — especially useful in crypto and fast-moving markets.
2. Gradient Filter (Slope of ZLEMA):
Rather than waiting for price to cross a moving average, the strategy measures the slope of the ZLEMA itself. Positive slope = uptrend, negative slope = downtrend. This gives us early trend validation and exit signals based on weakening momentum.
3. Vortex Indicator (Directional Volatility):
A diff-based implementation of the Vortex Indicator is used to validate whether volatility is expanding in favor of the trend. This prevents false entries during indecision phases or low-momentum conditions.
4. White Line Bias Filter (Structural Trend):
The strategy calculates the midpoint of the highest high and lowest low over a user-defined period. This “White Line” serves as a structural trend bias, ensuring entries align with the broader context — not just momentary momentum.
5. Volume Spike Confirmation:
To avoid manipulation and choppy conditions, the strategy confirms breakouts only when the current bar’s volume exceeds the median volume of recent candles by a set multiplier. This filters out noise and ensures only high-conviction moves trigger entries.
6. Breakout with Divergence Timing:
A hybrid logic checks for price breaking previous range highs/lows (breakouts), combined with simulated divergence behavior based on RSI-like momentum. This helps align entry timing with areas where price is likely to accelerate.
⚙️ Trade Management Logic:
Entry Conditions:
Triggered when all conditions align: ZLEMA slope, Vortex confirmation, White Line bias, volume spike, and divergence-based breakout.
Take Profits:
TP1: 50% of position is closed using a limit order
TP2: Remaining 50% closed with another limit order
This split exit approach lets profits run while locking in gains early.
Exits on Trend Weakness:
If trend conditions weaken (slope flip or vortex flip), the position is exited before a full reversal occurs — helping protect capital during exhaustion phases.
Reentry Delay:
Enforces a 1-bar cooldown between exit and new entries to avoid “ping-pong” signals and maintain clean backtest results.
📊 Real-Time Dashboard (On-Chart):
Displays critical stats including:
Current position (Long, Short, or Flat)
Entry price
TP1 and TP2 hit status
Win rate (%)
Profit factor
Bars since entry
This makes live trading or visual backtesting easy to interpret and track.
✅ Key Facts:
Non-Repainting: All signals are calculated using confirmed bar data only. No future bars or security() functions are used.
Original Logic: This is not a generic mashup. Each component (ZLEMA slope, vortex diff, breakout divergence, volume spike filtering, White Line structure) is optimized to work in tandem.
Best Timeframes: 1H – 4H
Markets: Crypto, Forex, Indices — any market with trending behavior and measurable volume
⚠️ Disclaimer:
This strategy is for educational purposes only. It is not financial advice or a recommendation to trade. Past performance does not guarantee future results. Always trade with proper risk management and backtest strategies before live deployment.
🧠 Summary:
Stealth Trigger X is built for traders who want:
Precision entries
Early trend exits
Reliable backtest integrity
Clean logic with no repainting
It is especially effective in breakout environments where volume and momentum align — and excels at avoiding weak or manipulated trends.

Trend MatrixFinal TradingView-Compliant Description for Trend Matrix
Trend Matrix is a precision-engineered trend-following strategy built for high-confidence entries and tactical trade management.
This strategy combines multiple non-repainting filters, each with a distinct role, to form a unified "trend matrix" that confirms directional bias, volume commitment, and momentum strength — all before entry is considered.
🔍 Core Components & Why They’re Used
🧠 Gaussian Filter (Custom)
A smoothed Gaussian-weighted moving average is used to detect trend direction changes. Unlike standard EMAs, this filter minimizes lag while retaining smooth transitions — ideal for confirming trend shifts without false reversals.
📈 RMI Trend Memory
A Relative Momentum Index is used to validate trend direction persistence. RMI's ability to filter out short-term oscillations makes it ideal for confirming whether a trend is still active.
📊 Gradient Filter (ZLEMA-based)
Measures the slope of a ZLEMA-smoothed close. If slope flips, it signals a potential trend weakness. This provides real-time confirmation for entry or exit bias.
📉 Volume Spike Detection
Confirms that breakouts or trend continuations are supported by volume commitment. Uses a dynamic SMA-based volume filter with a user-defined multiplier.
🟦 White Line (Bias Midpoint)
This structural component calculates the midpoint of the highest high and lowest low over a range — providing directional context and helping eliminate trades in consolidation zones.
🎯 Entry Conditions
Long entries require:
Gaussian trend flip to the upside
RMI > 50 (bullish memory)
Volume spike confirmation
Positive gradient (ZLEMA slope)
Price above White Line (bias filter)
Short entries use the inverse logic.
All entries enforce a cooldown bar to prevent same-bar reversals or whipsaw trades.
🎯 Exit Conditions
Take Profit 1: 50% of position at +2%
Take Profit 2: Remaining 50% at +4%
Early Exit on Trend Weakness:
Position closes fully if the trend weakens (RMI flip or gradient reversal)
📊 Dashboard + Performance Tracking
The built-in dashboard shows:
Current Position
Entry Price
TP1/TP2 Hit Status
Bars Since Entry
Win Rate (%)
Profit Factor
Useful for manual tracking or live trading review.
🌐 Multi-Exchange Bot Compatibility
Trend Matrix is built with universal trade alerts using customizable comment= fields. This makes it compatible with any exchange-connected bot platform such as:
WunderTrading
3Commas
Alertatron
Cornix
Or any webhook-based trading system
Alerts are sent using the {{strategy.order.comment}} placeholder, allowing you to route entries and exits through your preferred exchange account on Binance, Bybit, OKX, Kraken, and others.
🛠️ Customization
All components are modular:
TP1/TP2 levels
Gaussian length & sigma
Volume spike filter sensitivity
Gradient & White Line length
RMI settings
You can tailor the strategy for different assets or timeframes — optimized for crypto 1H, but works with stocks, FX, or lower timeframes with adjusted parameters.
✅ Final Notes
Trend Matrix is not just a mashup — it's a synchronized system of filters with clear roles, designed to maximize trade confidence and minimize noise. Every layer of confirmation serves a purpose, making this a highly adaptive trend-following tool for any market environment.
⚠️ Disclaimer (as required by TradingView)
This script is for educational purposes only and does not constitute financial advice. Use at your own risk. Always test strategies thoroughly before applying them in live trading environments. Past performance is not indicative of future results.
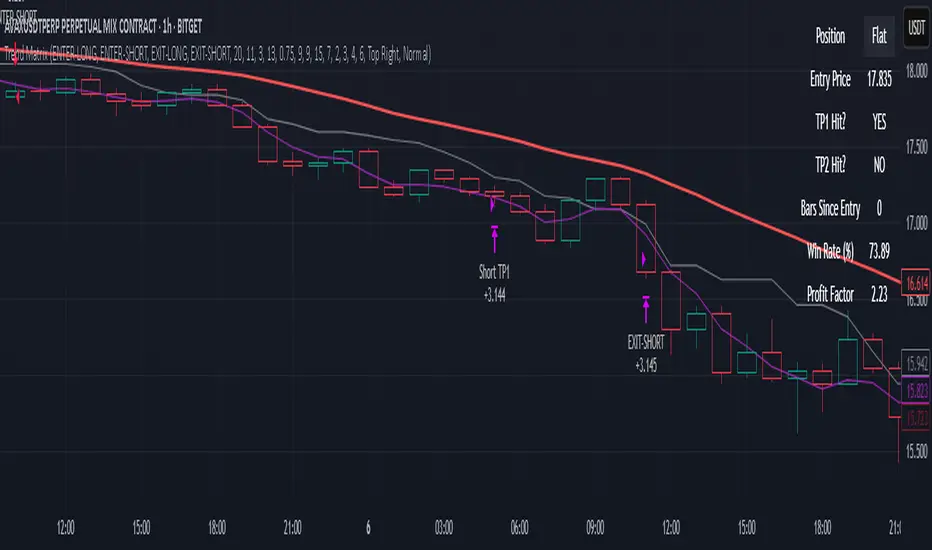
Gradient Sniper Elite🧠 Gradient Sniper Elite — Precision Trend Detection and Tactical Trade Execution for Crypto
Gradient Sniper Elite is a high-performance crypto trend strategy engineered for accuracy, adaptability, and smart execution on the 1-hour timeframe. This script is not just a mashup — it's a purpose-built system that combines trend, momentum, and volume filters in a structured and non-repainting framework designed for optimal entry and exit timing.
🔍 What Makes It Original?
This strategy combines several proven concepts into a unified, precision-calibrated trade engine:
✅ ZLEMA Gradient Filter: A slope-based trend filter that captures the direction and strength of momentum shifts without repainting.
✅ TEMA Confirmation: Triple EMA logic confirms trend acceleration or exhaustion by analyzing layered EMA cross-smoothing.
✅ RMI-Based Trend Direction: Replaces traditional RSI with a Relative Momentum Index (RMI), which smooths price momentum and avoids lag.
✅ ROC & Smoothed CCI: Dual momentum filters ensure that trades align with both velocity and structure of price moves.
✅ Volume Spike Filter: Filters out false breakouts and manipulation by confirming entries only during statistically significant volume surges.
✅ TP1/TP2 Split Take Profit Logic: 50% partial exit at TP1 and full exit at TP2. Ensures flexible profit-taking while maximizing trend continuation gains.
✅ Trend Weakness Exit: Trades are exited cleanly when the trend begins to weaken (as confirmed by RMI flip), preventing overstay and drawdown.
✅ 1-Bar Reversal Delay: The system enforces a 1-bar delay between a trade closure and any potential reversal entry, ensuring clean trend reversals and realistic live trading behavior.
✅ No Stop Loss: This strategy does not use a stop loss. Instead, it exits trades based on trend weakness or TP2 being hit. This avoids premature exits in volatile crypto environments, while maintaining controlled and dynamic trade management logic.
⚙️ How It Works
This strategy uses multi-layered confirmation:
Trend Structure
ZLEMA Gradient: Captures the slope of price action.
White Line + Fast/Slow Tether Lines: Define macro trend structure and act as dynamic S/R filters.
Momentum Alignment
Rate of Change (ROC): Measures directional velocity.
Smoothed CCI: Refines entry timing within the trend.
TEMA: Adds second-layer trend confirmation.
Volume Confirmation
Entry signals are validated by detecting relative volume spikes compared to a moving average baseline, avoiding entries on low-volume or fake breakouts.
Trade Management
Dynamic take-profits (TP1/TP2).
Immediate exit on trend weakening.
No same-bar entry/exit — reversal entries are delayed until after full exit confirmation.
No stop loss — trade management is handled via trend logic and take profit levels.
📊 Dashboard Overview
Gradient Sniper Elite includes a built-in dashboard in the top-right corner of the chart. It dynamically updates on each bar and shows:
📍 Position: Displays "Long", "Short", or "Flat" depending on the active trade
💰 Entry Price: The exact price where the trade was entered
📈 Unrealized %: Current profit/loss as a percentage
💵 Unrealized $: Estimated PnL in dollars, scaled to your backtest capital
📊 Trades / Win Rate: Live counter for total trades, win/loss count, and win rate
🎯 TP1 Hit / TP2 Hit: Shows ✅ or ❌ depending on whether each target level was reached during the current trade
This dashboard helps you monitor trade status, track live performance, and validate signal behavior in real time — all without repainting or relying on external tools.
📈 How to Use
Timeframe: Optimized for the 1-hour timeframe, but adaptable.
Asset Class: Primarily built for crypto markets, especially fast-moving alts like AVAX, LINK, QNT, etc.
Trade Mode: Supports long and short trades with clean reversal logic.
Dashboard: Live stats including position status, TP1/TP2 hit, win rate, and real-time PnL tracking.
Backtest Ready: Built with full compliance to TradingView backtest engine — results are realistic and match live-bar behavior.
⚠️ No Repainting — No Guesswork
Every element in this script is designed to work with confirmed bar data only. There is zero forward-looking logic. This makes Gradient Sniper Elite fully compatible with both backtesting and live algo execution.
🧩 Why This Isn’t Just a Mashup
Each indicator in this strategy has a specific role:
ZLEMA: Core trend slope engine.
TEMA: Trend reinforcement.
RMI: Directional decision layer.
CCI & ROC: Entry timing refinement.
Volume Filter: Risk filtering.
They’re not merged randomly, but combined in sequence to eliminate noise and optimize entries.
📌 Disclaimer
This script is for informational and educational purposes only. It does not constitute financial advice or a recommendation to buy or sell any asset. Always do your own research and use appropriate risk management when trading. Past performance does not guarantee future results.
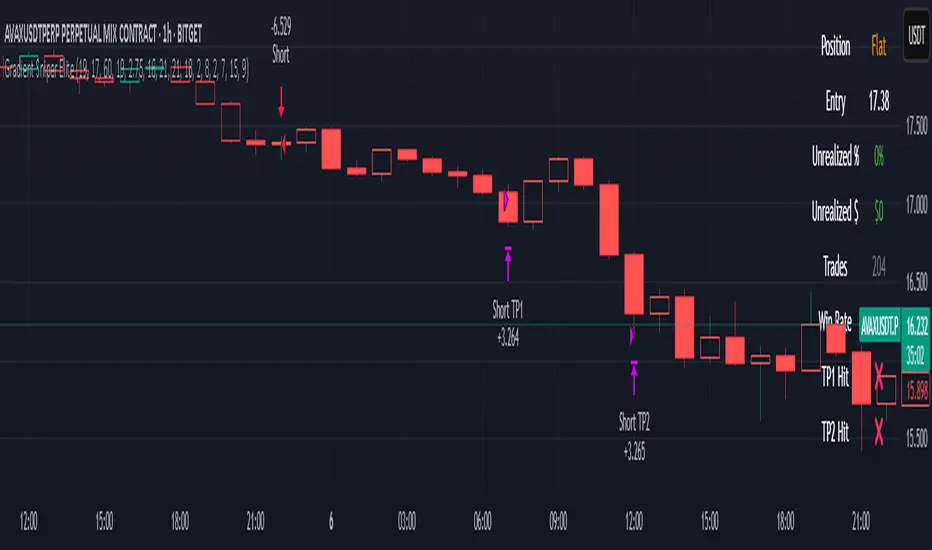
Apex Trend SniperApex Trend Sniper - Advanced Trend Trading Strategy (Pine Script v5)
🚀 Overview
The Apex Trend Sniper is an advanced, fully automated trend-following strategy designed for crypto, forex, and stock markets. It combines momentum analysis, trend confirmation, volume validation, and adaptive risk management to capture high-probability trades. Unlike many strategies, this system is 100% non-repainting, ensuring reliable backtesting and real-time execution.
🔹 How This Strategy Works (Indicator Mashup)
The Apex Trend Sniper leverages multiple indicators to create a robust multi-layered confirmation system:
1️⃣ Trend Identification with RMI & McGinley Dynamic
📌 What It Does: Identifies the dominant trend and prevents trading against market conditions.
✔ McGinley Dynamic Baseline:
A highly adaptive moving average that dynamically reacts to price changes.
Price above the baseline = bullish trend.
Price below the baseline = bearish trend.
✔ Relative Momentum Index (RMI):
A refined Relative Strength Index (RSI) that filters out weak trends.
Above 50 = bullish confirmation.
Below 50 = bearish confirmation.
2️⃣ Trend Strength Confirmation with Vortex Indicator
📌 What It Does: Confirms that a detected trend is strong and valid.
✔ Vortex Indicator (VI):
Measures directional movement and trend strength.
A bullish trend is confirmed when VI+ > VI-.
A bearish trend is confirmed when VI- > VI+.
3️⃣ Volume Spike Detection for Trade Validation
📌 What It Does: Ensures that trades are placed only during strong market participation.
✔ Volume Confirmation:
A trade signal is only valid if volume spikes above the moving average.
Helps avoid false breakouts and weak trends.
4️⃣ Entry & Exit Strategy with Multi-Level Take Profits
📌 What It Does: Enters trades only when all conditions align and manages risk effectively.
✔ Entry Conditions (All must be met):
Price is above/below McGinley Dynamic.
RMI confirms trend direction.
Vortex indicator confirms trend strength.
Volume spike is detected.
✔ Exit Conditions:
Take Profit 1 (TP1): Secures 50% of the position at the first price target.
Take Profit 2 (TP2): Closes the remaining position at the second price target.
Exit Before Reversal: If an opposite trend signal appears, the position is closed early.
Trend Weakness Exit: If momentum weakens, the trade is exited automatically.
📌 Strategy Customization
🔧 Fully customizable to fit any trading style:
✔ McGinley Dynamic Length – Adjust baseline sensitivity.
✔ RMI & Vortex Settings – Fine-tune momentum filters.
✔ Volume Thresholds – Modify spike detection for better accuracy.
✔ Take Profit Levels – Set TP1 & TP2 based on market volatility.
📢 How to Use Apex Trend Sniper
1️⃣ Apply the strategy to any TradingView chart.
2️⃣ Customize the settings to fit your trading approach.
3️⃣ Use the backtest report to evaluate performance.
4️⃣ Monitor the dashboard to track real-time trade execution.
📌 Recommended Timeframes & Markets
✔ Best Markets:
✅ Crypto (BTC, ETH, SOL, etc.)
✅ Forex (EUR/USD, GBP/USD, JPY/USD, etc.)
✅ Stocks & Indices (S&P500, NASDAQ, etc.)
✔ Optimal Timeframes:
✅ Swing Trading: 1H – 4H – 1D
✅ Intraday & Scalping: 5M – 15M – 30M
📌 Backtest Settings for Realistic Performance
✔ Initial Capital: $1000 (or more for scaling).
✔ Commission: 0.05% (to simulate exchange fees).
✔ Slippage: 1-2 (to account for execution delay).
✔ Date Range: Test across different market conditions.
📢 TradingView Disclaimer
📌 This script is for educational purposes only and does not constitute financial advice. Trading carries significant risk, and past performance does not guarantee future results. Always test strategies thoroughly before applying them in a live market. Users are responsible for their own trading decisions.
🚀 Why Choose Apex Trend Sniper?
✅ Non-Repainting – No misleading signals.
✅ Multi-Layer Confirmation – Reduces false trades.
✅ Volume & Trend Strength Validation – Ensures high-probability entries.
✅ Adaptive Risk Management – Secures profits while maximizing trends.
✅ Versatile Across Markets & Timeframes – Works for crypto, forex, and stocks.
📢 Start Trading Smarter with Apex Trend Sniper! 🚀
🔗 Try it now on TradingView and optimize your trend-following strategy. 🔥

Nifty scalping 3 minutes options on Dhan
Strategy Description for Publishing: Nifty Scalping 3 Minutes Options on Dhan
Overview:
The Nifty Scalping 3 Minutes Options on Dhan strategy is an enhanced version tailored for trading Nifty Options, building on the core logic used in the previously published Nifty Scalping 3 Minutes Strategy. This strategy provides automated order execution via JSON alerts for seamless integration with the Dhan platform, enabling hands-free options trading.
This system is designed to capture short-term market moves using a combination of technical indicators like the Jurik Moving Average (JMA), Exponential Moving Average (EMA), and Bollinger Bands, while also allowing traders to manage risk effectively with custom inputs for maximum loss per lot and partial profit booking.
For more details on the core logic and performance of the strategy, please refer to our earlier published strategy:
Nifty Scalping 3 Minutes Strategy
Key Features:
JMA and EMA Crossovers: Trades are executed when the Jurik Moving Average (JMA) crosses over (for long trades) or under (for short trades) the Exponential Moving Average (EMA), signaling trend direction.
Price-Volume Spike Detection: Ensures that trades are executed only when significant market activity is detected, avoiding low-momentum conditions. Price-volume relationships are monitored to confirm the strength of market movements.
Bollinger Band Noise Filter: Filters out low-volatility periods by executing trades only when prices break through the upper or lower Bollinger Bands, confirming high volatility.
Customizable Risk Management: Traders can set their own maximum risk per lot (e.g., ₹650), and the strategy adjusts the stop-loss accordingly to ensure that no trade exceeds this threshold.
Partial Profit Booking: A predefined percentage (e.g., 60%) of the position can be booked as profit once the first profit target is reached, with the remaining position trailed using an ATR-based stop.
STBT/BTST Support: The strategy offers the flexibility to carry trades overnight, supporting Sell Today, Buy Tomorrow (STBT) and Buy Today, Sell Tomorrow (BTST).
Time-Based Exit: The strategy automatically closes any open positions by 3:20 PM to avoid the volatile end-of-day market conditions.
Inputs for Traders:
Option Quantity: Select the number of contracts to trade (e.g., 10).
Maximum Risk Per Lot: Set your maximum allowable loss per lot (e.g., ₹650), ensuring that your risk is managed effectively.
Partial Profit Booking Percentage: Define what percentage of your position to book as profit (e.g., 60%) when the first target is hit.
STBT/BTST Option: Choose whether to allow positions to be carried overnight.
Alert Secret Key: Input your secret key for the Dhan platform to trigger automated orders via JSON alerts.
Option Expiry Date: Specify the expiry date for the options being traded.
Trade Logic:
Long Trades: Triggered when JMA crosses above EMA, supported by filters like price-volume spikes and Bollinger Band breakouts. The strategy waits for momentum confirmation before entering long trades, with stop-loss and profit-taking mechanisms in place.
Short Trades: Triggered when JMA crosses below EMA, with confirmation through additional filters to ensure strong market trends before entering short positions.
Risk Management:
Stop-Loss: A dynamic stop-loss is placed for each trade based on the trader's maximum risk per lot. The stop-loss adapts to market conditions using ATR trailing stops to capture further gains as the trade progresses.
Partial Profit Booking: Once the first profit target is hit (2.1x risk for long trades and 2.5x risk for short trades), a percentage of the position is booked as profit, and the remainder is trailed using an ATR stop.
Automation via JSON Alerts:This strategy sends automated JSON alerts to the Dhan platform for seamless execution of orders. The alerts support multi-leg orders for both entry and exit, ensuring that trades are executed efficiently without manual intervention.
Why Use This Strategy?
The Nifty Scalping 3 Minutes Options on Dhan strategy is perfect for traders who want to capitalize on quick market moves in options, backed by strong risk management and automation. With automated alerts, customizable inputs, and advanced technical filters, this strategy is ideal for traders looking to engage in high-probability options trades with minimal effort.
For more detailed information about the underlying logic, you can refer to the previously published Nifty Scalping 3 Minutes Strategy here.
Disclaimer:
This strategy is provided as an educational tool, and we are not affiliated with or sponsored by Dhan. The strategy integrates with the Dhan platform for automated trading, but there is no formal relationship between this strategy and Dhan.

Trend Crawler with Dynamic TP and Trailing Stop### Description of "Trend Crawler with Dynamic TP and Trailing Stop"
#### Overview
The "Trend Crawler with Dynamic TP and Trailing Stop" is a comprehensive trading strategy designed for medium-frequency trading on various timeframes and markets. It utilizes a combination of trend identification and volatility analysis to determine optimal entry and exit points, aiming to maximize profitability by adapting to changing market conditions.
#### Strategy Mechanics
1. **Moving Averages**: Users can select between Simple Moving Average (SMA) and Exponential Moving Average (EMA) to define the trend. The strategy uses two moving averages (fast and slow) to identify the trend direction. A crossover of the fast MA above the slow MA signals a potential bullish trend, while a crossunder signals a bearish trend.
2. **Volume Analysis**: The strategy incorporates volume analysis to confirm the strength of the trend. It calculates a standard deviation of volume from its moving average to detect significant increases in trading activity, which supports the trend direction indicated by the MAs.
3. **Price Spread and RSI**: It uses the price spread (difference between the close and open of each bar) and the Relative Strength Index (RSI) to filter entries based on market momentum and overbought/oversold conditions. This helps in refining the entries to avoid weak or overly extended moves.
4. **Dynamic Take Profit and Trailing Stop**:
- **Trailing Stop**: As the position moves into profit, the strategy adjusts the stop loss dynamically to protect gains, using a trailing stop mechanism.
- **Dynamic Take Profit**: The take profit levels are adjusted based on the volatility (measured by the standard deviation of the price spread) to capture maximum profit from significant moves.
#### Usage
To use the strategy:
- Set the desired moving average type and lengths according to the asset and timeframe being traded.
- Adjust the RSI thresholds to match the market's volatility and trading style.
- Set the base take profit and stop loss levels along with the trailing stop distance based on risk tolerance and trading objectives.
#### Justification for Originality
While the use of moving averages, RSI, and volume analysis may be common, the integration of these elements with dynamic adjustments for take profit and trailing stops based on real-time volatility analysis offers a unique approach. The strategy adapts not just to trend direction but also to the market's momentum and volatility, providing a tailored trading solution that goes beyond standard indicator-based strategies.
#### Strategy Results and Settings
Backtesting should be conducted with realistic account sizes and include considerations for commission and slippage to ensure that the results are not misleading. Risk per trade should be kept within a sustainable range (ideally less than 5% of account equity), and the strategy should be tested over a sufficient sample size (at least 100 trades) to validate its effectiveness.
#### Chart Presentation
The script’s output includes:
- Colored backgrounds to indicate bullish or bearish market conditions.
- Plots of trailing stops to visually manage risk.
- Entry points are marked with shapes on the chart, providing clear visual cues for trading decisions.
#### Conclusion
This strategy offers traders a robust framework for trend following with enhanced risk management through dynamic adjustments based on real-time market analysis. It's designed to be versatile and adaptable to a wide range of markets and trading styles, providing traders with a tool that not only follows trends but also adapts to market changes to secure profits and reduce losses.
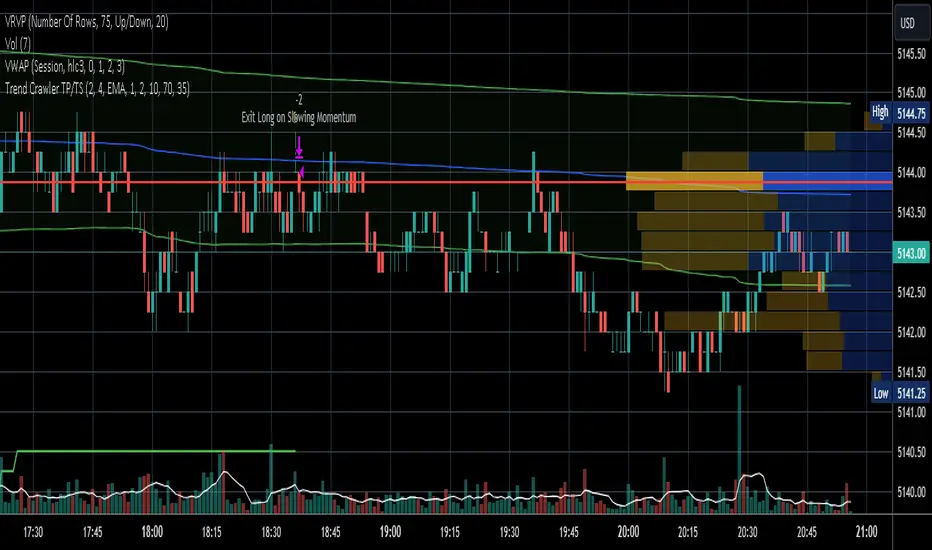
SSP + VWMAInput menu allows you to set long / short entries using,
Net volume change from above or below zero.,
Net volume changes of positive to negative values,
VWAP rising or falling.
VWMA rising or falling
Stop loss and take profit are built in to test the most profitable strategy.
uncheck net volume in menu bar to remove background colours on chart
Uncheck VWAP and VWMAto test long and short entries ( using net volume change ) note session look back is available to edit, if use take profit is unchecked then this will simulate net volume change from positive to negative.
Check VWMA or VWAP to simulate long or short entries
With VWAP checked this will simulate VWAP entries with rising / falling VWAP with previous take profit and stop losses that we’re profitable.
