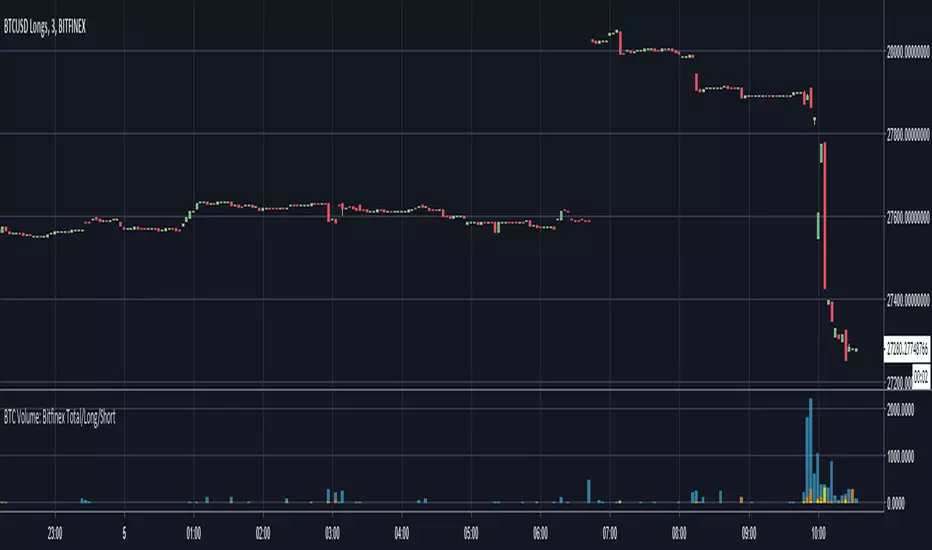
BTC Volume: Bitfinex Total/Long/ShortQuick little script to show Bitfinex LONG/SHORT positions in context to overall volume on the TF. Works best on small TFs to eliminate fluctuation in margin positions impacting the 'accuracy' of volume.
Base Color Scheme
Blue: Total Bitfinex traded volume
Yellow: Assumed Volume of BTCUSDLONGS (Close Position - Open Position)
Orange: Assumed Volume of BTCUSDSHORTS (Close Position - Open Position)
Work is based on conversations and community interaction through Crypto Traders Pro.
ค้นหาในสคริปต์สำหรับ "volume"
Daily VolumeShows a table in the top right of the chart with a few options:
Only show intraday: By default the table will not be visible on timeframes of 1D or above, but this can be changed to show all the time if desired.
Daily volume: Displays the volume for the day so far, regardless of what timeframe is currently showing.
Yesterday's volume: Displays the volume from the previous day. As with the daily volume , it will show the entire previous day's volume regardless of the current timeframe.
Average Volume: Displays the average volume based on a user-specified number of days. The default value is 30 days.
Text color and table color: Choose the color settings for the table text and background.

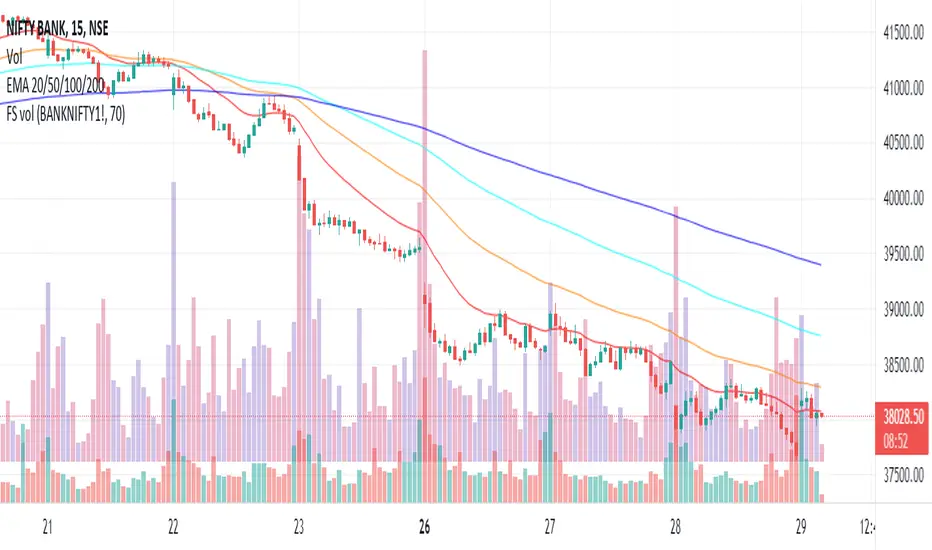
Plot futures volumes with indexMost of the times, F&O traders like to draw their own trendlines or mark other levels on the underlying instrument where volumes of the underlying is a key parameter. When such an instrument is a non-tradeable index, then one needs to switch to the futures chart for volumes. This script plots the volumes from futures on the underlying index so that traders don't need to switch charts just for futures volumes! Hope it is useful to some. Cheers!
Falling and Growing VolumeFalling & Growing Volume is an indicator which shows growing and falling volumes in different colors. If current volume greater then previous volume then it is considered as growing volume otherwise as falling volume.
Propagation Volumes and TrendsWith this, i calculate RSI of the HL2 of the volume and use like an oscillator, this will use to measure the strength of the trend and the "Volume Flow" to follow the trend.
I use like foundation the LazyBear "Volume Flow Indicator" "honor a quien honor merece"
Background:
I think the volume as the price could be represented by candles or other graphic to use indicators and strengthen their analysis, due to lack of registration of this it is first necessary to calculate a volume graph, if the candle traditionally negative price brand then the total volume is taken as negative for the period. An example of this is in the On Balance Volume indicator, the problem is that there is no way to analyze the volume using other methods. An approximate volume of the spread could be the use of the price spread to make a synthetic behavior
As traditionally is observed if Open> Close then the candle and the volume will be negative and vice versa; the next step, is estimate the amounts of the candle necessary to calculate the ratio to use for the volume and thus idealize their spread within the candle:
VLOW = Volume x Low
vHigh = x High Volume
VOpen = vClose
vClose = Volume x Close
This graph can show a stable synthetic form of fluctuations in the volume trend affected by price.
ideas, comments and suggestions (or corrections).They are always welcome
High Volume Breakout DetectorThis indicator is a dedicated volume analysis tool displayed in a separate pane below the price chart. It visually highlights significant volume surges (spikes) by comparing the current bar's volume to a dynamic threshold based on a Simple Moving Average (SMA) of volume.
Key Concepts and Methodology:
- The core calculation uses a user-configurable Simple Moving Average (default: 20 periods) of historical volume to establish a baseline of "normal" trading activity.
- A customizable multiplier (default: 1.50, meaning 150% of the SMA) defines the threshold for a volume spike. When the current bar's volume meets or exceeds this threshold, it is classified as a spike—indicating unusually high participation that often accompanies breakouts, reversals, climaxes, or institutional activity.
- Volume bars are plotted as columns and colored based on two factors:
- Candle direction: Green shades for bullish candles (close ≥ open), red shades for bearish candles (close < open).
- Spike status: Brighter/solid colors for confirmed spikes, muted/translucent colors for normal volume. This candle-matched coloring helps traders quickly assess whether the surge supports buying pressure (green spike on up candle) or selling/distribution (red spike on down candle).
- Optional overlays include the volume SMA line (blue) and the dynamic threshold line (orange, plotted as circles for easy distinction).
Features and Customization:
- Fully adjustable inputs: SMA length, multiplier threshold, colors for up/down/normal/spike bars, and toggles for showing the SMA line, threshold line, or background highlighting on spikes.
- Built-in alert condition triggers reliably on volume spikes (≥ selected multiplier of SMA), with a constant message string including ticker, timeframe, volume value, and threshold reference.
How to Use:
- Add to any chart in a separate pane (overlay=false).
- Look for brighter colored volume bars as potential signals of conviction in price moves. For example:
- Green spikes on up candles may signal strong accumulation or breakout confirmation.
- Red spikes on down candles may indicate distribution or exhaustion selling.
- Combine with price action, support/resistance, or trend indicators for confluence.
- Ideal for day trading, swing trading, or spotting volume climaxes on stocks, forex, crypto, or futures across any timeframe.
The unique combination of candle-direction-matched coloring for spikes, visual threshold plotting, and focused spike highlighting provides clearer, more actionable insight into directional volume pressure compared to standard volume displays.

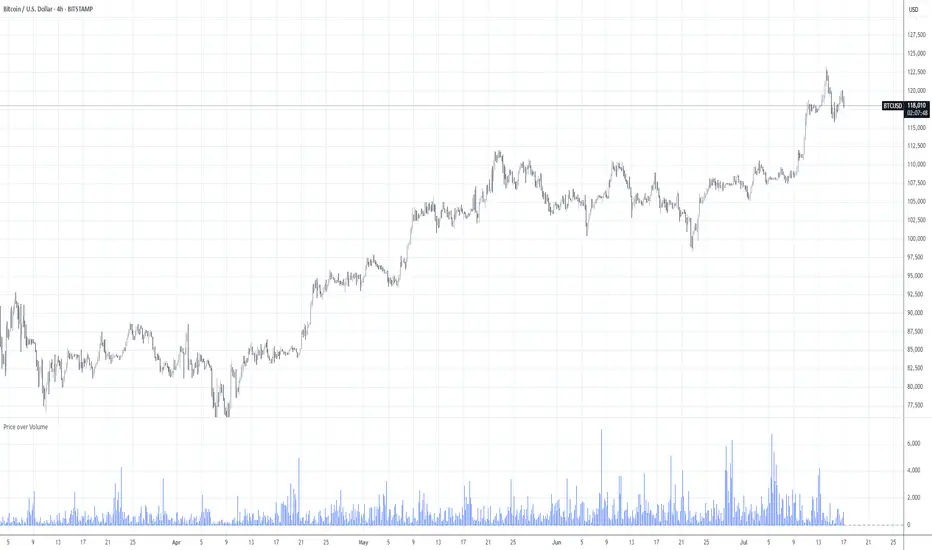
Price over VolumeVersion 0.1
Price over Volume Indicator
Description
The Price over Volume indicator calculates the ratio of the closing price to the trading volume (price / volume) for the current chart's symbol and displays it as a histogram in a separate pane. A horizontal zero line is included as a reference to highlight positive and negative values or periods of undefined data (e.g., zero volume). The indicator is designed to help traders analyze the relationship between price movements and trading volume.
Insights Provided
Price-Volume Dynamics: The indicator shows how price per unit of volume fluctuates, offering insights into market efficiency and liquidity. High ratios may indicate low volume relative to price, suggesting potential volatility or thin markets, while low ratios may reflect high volume supporting price stability.
Trend and Momentum Analysis: Spikes or trends in the price-to-volume ratio can signal significant market events, such as buying/selling pressure or low liquidity periods, helping traders identify potential reversals or continuations.
Zero Line Reference: The zero line helps identify periods where the ratio is undefined (e.g., zero volume) or negative (if applicable), aiding in the interpretation of market conditions.
Volume Sensitivity: By normalizing price by volume, the indicator highlights how volume influences price movements, which is useful for assessing the strength of trends or breakouts.
How to Use
Setup: Apply the indicator to any chart with price and volume data (e.g., stocks, cryptocurrencies like BINANCE:BTCUSDT). The histogram appears in a separate pane below the main chart.
Interpretation :
High Ratios: Indicate low trading volume relative to price, potentially signaling overbought conditions or low liquidity. Use with caution in thin markets.
Low Ratios: Suggest high volume supporting price levels, indicating stronger market participation or stability.
Spikes: Watch for sudden increases in the ratio, which may precede volatility or significant price moves.
Zero Line: Periods where the histogram is absent (due to zero volume) indicate no trading activity, useful for identifying illiquid periods.
Trading Applications:
Confirmation Tool: Combine with other indicators (e.g., RSI, MACD) to confirm trend strength. A rising price-to-volume ratio with a price uptrend may indicate weakening volume support, suggesting a potential reversal.
Volume Analysis: Use alongside volume-based indicators (e.g., OBV, VWAP) to assess whether price movements are backed by sufficient volume.
Scalping/Day Trading: Monitor intraday ratio changes to identify high-impact periods with low volume, which may offer short-term trading opportunities.
Customization: Adjust the histogram color or style (e.g., change to line plot) via the Pine Editor to suit your preferences. Consider adding smoothing (e.g., moving average) for cleaner signals.
Notes
Data Requirements: Ensure the chart’s symbol has valid volume data. Symbols with no volume (e.g., some forex pairs) will result in undefined (na) values.
Limitations: The indicator is sensitive to zero-volume periods, which may cause gaps in the histogram. Use on high-liquidity symbols for best results.
Performance: Lightweight and efficient, suitable for all timeframes.
This indicator is ideal for traders seeking to understand the interplay between price and volume, offering a unique perspective on market dynamics for informed trading decisions.
[blackcat] L1 Net Volume DifferenceOVERVIEW
The L1 Net Volume Difference indicator serves as an advanced analytical tool designed to provide traders with deep insights into market sentiment by examining the differential between buying and selling volumes over precise timeframes. By leveraging these volume dynamics, it helps identify trends and potential reversal points more accurately, thereby supporting well-informed decision-making processes. The key focus lies in dissecting intraday changes that reflect short-term market behavior, offering critical input for both swing and day traders alike. 📊
Key benefits encompass:
• Precise calculation of net volume differences grounded in real-time data.
• Interactive visualization elements enhancing interpretability effortlessly.
• Real-time generation of buy/sell signals driven by dynamic volume shifts.
TECHNICAL ANALYSIS COMPONENTS
📉 Volume Accumulation Mechanisms:
Monitors cumulative buy/sell volumes derived from comparative closing prices.
Periodically resets accumulation counters aligning with predefined intervals (e.g., 5-minute bars).
Facilitates identification of directional biases reflecting underlying market forces accurately.
🕵️♂️ Sentiment Detection Algorithms:
Employs proprietary logic distinguishing between bullish/bearish sentiments dynamically.
Ensures consistent adherence to predefined statistical protocols maintaining accuracy.
Supports adaptive thresholds adjusting sensitivities based on changing market conditions flexibly.
🎯 Dynamic Signal Generation:
Detects transitions indicating dominance shifts between buyers/sellers promptly.
Triggers timely alerts enabling swift reactions to evolving market dynamics effectively.
Integrates conditional logic reinforcing signal validity minimizing erroneous activations.
INDICATOR FUNCTIONALITY
🔢 Core Algorithms:
Utilizes moving averages along with standardized deviation formulas generating precise net volume measurements.
Implements Arithmetic Mean Line Algorithm (AMLA) smoothing techniques improving interpretability.
Ensures consistent alignment with established statistical principles preserving fidelity.
🖱️ User Interface Elements:
Dedicated plots displaying real-time net volume markers facilitating swift decision-making.
Context-sensitive color coding distinguishing positive/negative deviations intuitively.
Background shading highlighting proximity to key threshold activations enhancing visibility.
STRATEGY IMPLEMENTATION
✅ Entry Conditions:
Confirm bullish/bearish setups validated through multiple confirmatory signals.
Validate entry decisions considering concurrent market sentiment factors.
Assess alignment between net volume readings and broader trend directions ensuring coherence.
🚫 Exit Mechanisms:
Trigger exits upon hitting predetermined thresholds derived from historical analyses.
Monitor continuous breaches signifying potential trend reversals promptly executing closures.
Execute partial/total closes contingent upon cumulative loss limits preserving capital efficiently.
PARAMETER CONFIGURATIONS
🎯 Optimization Guidelines:
Reset Interval: Governs responsiveness versus stability balancing sensitivity/stability.
Price Source: Dictates primary data series driving volume calculations selecting relevant inputs accurately.
💬 Customization Recommendations:
Commence with baseline defaults; iteratively refine parameters isolating individual impacts.
Evaluate adjustments independently prior to combined modifications minimizing disruptions.
Prioritize minimizing erroneous trigger occurrences first optimizing signal fidelity.
Sustain balanced risk-reward profiles irrespective of chosen settings upholding disciplined approaches.
ADVANCED RISK MANAGEMENT
🛡️ Proactive Risk Mitigation Techniques:
Enforce strict compliance with pre-defined maximum leverage constraints adhering strictly to guidelines.
Mandatorily apply trailing stop-loss orders conforming to script outputs reinforcing discipline.
Allocate positions proportionately relative to available capital reserves managing exposures prudently.
Conduct periodic reviews gauging strategy effectiveness rigorously identifying areas needing refinement.
⚠️ Potential Pitfalls & Solutions:
Address frequent violations arising during heightened volatility phases necessitating manual interventions judiciously.
Manage false alerts warranting immediate attention avoiding adverse consequences systematically.
Prepare contingency plans mitigating margin call possibilities preparing proactive responses effectively.
Continuously assess automated system reliability amidst fluctuating conditions ensuring seamless functionality.
PERFORMANCE AUDITS & REFINEMENTS
🔍 Critical Evaluation Metrics:
Assess win percentages consistently across diverse trading instruments gauging reliability.
Calculate average profit ratios per successful execution measuring profitability efficiency accurately.
Measure peak drawdown durations alongside associated magnitudes evaluating downside risks comprehensively.
Analyze signal generation frequencies revealing hidden patterns potentially skewing outcomes uncovering systematic biases.
📈 Historical Data Analysis Tools:
Maintain comprehensive records capturing every triggered event meticulously documenting results.
Compare realized profits/losses against backtested simulations benchmarking actual vs expected performances accurately.
Identify recurrent systematic errors demanding corrective actions implementing iterative refinements steadily.
Document evolving performance metrics tracking progress dynamically addressing identified shortcomings proactively.
PROBLEM SOLVING ADVICE
🔧 Frequent Encountered Challenges:
Unpredictable behaviors emerging within thinly traded markets requiring filtration processes.
Latency issues manifesting during abrupt price fluctuations causing missed opportunities.
Overfitted models yielding suboptimal results post-extensive tuning demanding recalibrations.
Inaccuracies stemming from incomplete/inaccurate data feeds necessitating verification procedures.
💡 Effective Resolution Pathways:
Exclude low-liquidity assets prone to erratic movements enhancing signal integrity.
Introduce buffer intervals safeguarding major news/event impacts mitigating distortions effectively.
Limit ongoing optimization attempts preventing model degradation maintaining optimal performance levels consistently.
Verify reliable connections ensuring uninterrupted data flows guaranteeing accurate interpretations reliably.
USER ENGAGEMENT SEGMENT
🤝 Community Contributions Welcome
Highly encourage active participation sharing experiences & recommendations!
THANKS
Heartfelt acknowledgment extends to all developers contributing invaluable insights about volume-based trading methodologies! ✨

Delta Volume[integral]Delta Volume – Visualizing Accumulated Candle Dominance
This indicator measures and accumulates the net difference between bullish and bearish candle volumes over a user-defined range of bars. It integrates the volume dominance over time, offering traders a unique view into how buying or selling pressure has been distributed.
🔍 Concept & Logic
Delta Volume Calculation
For each bar, the script looks x to y bars back in time (e.g., from 10 bars ago to 5 bars ago) and:
Adds volume for bullish candles (close > open)
Subtracts volume for bearish candles (close < open)
This gives us a snapshot of volume dominance for that range.
What is Integration in This Context?
Integration, in this script, refers to the accumulation (summation) of these dominance differences over a period.
Much like integrating a function in calculus (i.e., area under the curve), here we are integrating the "net advantage" of buyers vs. sellers.
Over time, this builds a cumulative picture of directional pressure, showing whether buyers (positive integration) or sellers (negative integration) are in control.
Why It Matters
Unlike simple volume charts, this tool filters noise by focusing on who is dominating the market—buyers or sellers—and tracks that dominance over time.
It gives a macro-level view of pressure buildup, which can precede major breakouts or reversals.
📊 Visual Features
Buy Volume (green columns): Sum of volumes from bullish candles.
Sell Volume (red columns): Sum of volumes from bearish candles.
Candle Difference (white line): Net dominance difference (Buy - Sell).
Integrated Dominance Difference: Cumulative label showing the total buyer-seller dominance over the defined integration period.
Zero Line (dashed): Balance point.
🧠 Use Case
Detect divergences between price and cumulative volume pressure.
Confirm trend strength when integrated delta volume aligns with price movement.
Spot accumulation or distribution phases invisible on price action alone.
⚠️ If you're applying this to symbols with no volume data (e.g., certain Forex or indices), the script will stop with an error message.

Bullish/Bearish Volume Indicator ABDJO1- red bars are bearish volume
2- yellow bars are a weakness of bearish volume.
3-green bars are a strong bullish volume.
4-Orange bars are a weakness of bullish volume.
1. Price Movements
The chart does not explicitly show price movements, but the volume bars can give us indirect clues. Typically, a transition from green (strong bullish volume) to red (bearish volume) suggests a potential reversal from an uptrend to a downtrend. The presence of orange bars (weakness of bullish volume) following green bars indicates a decrease in buying momentum, which often precedes a price decline.
2. Trading Volume
Green Bars: Represent strong bullish volume, indicating strong buying interest.
Orange Bars: Indicate a weakening of bullish volume, suggesting that buyers are losing strength or interest at higher price levels.
Yellow Bars: Represent a weakening of bearish volume, which could indicate that selling pressure is decreasing and a potential reversal or stabilization in price might occur.
Red Bars: Signify strong bearish volume, indicating strong selling pressure.
3. Price-Volume Relationship
The transition from green to orange and then to red bars shows a typical pattern where initial strong buying interest (green) is followed by a decrease in buyer enthusiasm (orange), and eventually overtaken by sellers (red). This pattern often corresponds to a peak in prices followed by a reversal to the downside.
4. Technical Indicators
Without specific price data, traditional indicators like MA (Moving Averages), MACD (Moving Average Convergence Divergence), or KDJ (Stochastic Oscillator) cannot be calculated directly. However, the volume pattern itself can be used as a rudimentary momentum indicator, with decreasing bullish volume (orange) and increasing bearish volume (red) suggesting a bearish momentum.
5. Support and Resistance Levels
Support Level: Could be hypothesized near the transition point from yellow to green bars, where buyers previously started to overpower sellers.
Resistance Level: Likely near the transition from green to orange bars, where sellers begin to regain control and buying momentum fades.
6. Overall Trend Patterns
The overall trend, inferred from the volume bars, suggests a bullish phase losing momentum and transitioning into a bearish phase. This is typical of a market top where buying interest wanes and sellers begin to dominate.
7. Future Projections and Recommendations
Given the observed shift from bullish to bearish volume, there is a higher likelihood of a downward price movement in the near term. Investors should consider this a potential sell signal, especially as bearish volume (red bars) increases. Caution is advised for buyers, and it might be prudent for holders to take profits or set stop-loss orders to protect against potential declines.

Highest Volume [Quant Alchemy]This indicator is designed for traders looking to enhance their strategy based on volume analysis. The "Highest Volume Signal" identifies significant volume changes and signals potential points of interest.
**Features:**
- **Lookback Period Customization**: Set the number of bars to look back for analyzing the highest volume.
- **Volume Signal Multiplier**: Configure the percentage by which the current bar's volume must exceed the highest volume found in the lookback period to trigger a signal.
- **Visualization**: The indicator plots a shape (triangle) above bars where the signal occurs, making it easy to spot.
**Usage:**
- **Strategy Enhancement**: Use the indicator to identify potential points to signal strategy action when unusually high volume is observed.
- **Customizable Parameters**: Adjust the lookback period and volume signal multiplier to fit your trading style.
**How It Works:**
- The indicator calculates the highest volume among bars within a user-defined lookback period.
- It then compares the volume of the current bar to this highest volume. If the current volume exceeds the highest volume by a set percentage (volume signal multiplier), a signal is generated.
- The indicator is particularly useful in volatile markets where volume spikes can precede significant price movements.
**Application:**
Ideal for short-term traders and those who use volume analysis as part of their trading strategy. The indicator provides an additional layer of confirmation for making informed decisions in trading positions.

Volume+The enhanced Volume+ Indicator is a valuable tool that builds upon the traditional Volume indicator by incorporating a technique known as linear prediction.
In traditional Volume analysis, the volume data for a bar is only known once the bar has closed. However, with the enhanced Volume+ Indicator, we utilize linear prediction to estimate the closing volume of the k-bar before it actually closes. This estimation is based on historical volume observed in the market.
By employing this indicator, traders and investors can gain an early insight into the potential volume of the current bar, even before it concludes. This can be particularly useful for those who wish to make informed decisions based on volume analysis and its impact on price movements.
===========================中文版本===========================
增强的Volume+指标是一个有价值的工具,它通过结合一种称为线性预测的技术建立在传统成交量指标的基础上。
在传统的成交量分析中,只有在柱线收盘后才能知道柱线的成交量数据。然而,通过增强的Volume+指标,我们利用线性预测来估计 k 柱实际收盘前的收盘成交量。该估计基于市场观察到的历史交易量。
通过使用该指标,交易者和投资者可以在k柱结束之前就尽早了解当前柱的潜在交易量。对于那些希望根据交易量分析及其对价格变动的影响做出明智决策的人来说,这尤其有用。

PVSRA Volume Price - Some people say "Price Action is King". I say, we cannot know how the MMs (Market Makers) will move price next, period. But price tends to consolidate above key SR when MMs are filling short orders for SM (Smart Money) and long orders for DM (Dumb Money), and price tends to consolidate below key SR when MMs are filling long orders for SM and short orders for DM. The MMs are also "SM", and they tend to do the other SMs "one better"! This means that after the MMs fill the SM/DM orders, they might move price a bit further in an attempt to stop out some of those SM executed orders and sucker in more DM; both giving liquidity for the MMs to add to their own SM side position. Yes, the MMs are bastards. But the point is that could leave price not "nicely" above or below a SR anymore, yet more consolidation can occur.
Volume - Increases in activity denote increase in interest. But, is it long or short interest? Where is price in the bigger picture when this is happening? Is it at relative highs, or lows in the overall price action? And if a high volume bar is for a candle which you can examine by going to lower TF charts, you might see where in the spread of that candle the most volume occurred, high or low! Using volume is about taking note of relative increases in volume and what price is doing at the same time. Are the better volumes favoring the lower or the higher prices, as the MMs waffle price up and down? And do the volumes get particularly notable when the MMs take price above or below key SR?
S&R - Read all about S&R at "Baby Pips.com". What I want you to realize here is that the whole, half and quarter numbered price levels (hereinafter referred to as "Levels") are the most important SR of all in this market! Not because price stops, pauses, proceeds or reverses there, but because it is above or below these levels that important consolidation (MMs filling SM orders) takes place. Once SM long orders are filled, they become interested in placing orders to close them at higher prices, and hence the MMs will be moving price higher, eventually. Once SM short orders are filled, they become interested in placing orders to close them at lower prices, and hence the MMs will be moving price lower, eventually.
PVSRA - If we can spot consolidations above/below key SR, examine the overall price action on various TF charts, and take note of where the notable increases in volume have most recently occurred (did volume favor relative highs or lows), then we can build a consensus about what kind of orders the MMs have most recently been filling; buying to open longs or close shorts, or selling to open shorts or close longs. And we can get a better idea if things will next become bullish or bearish. And once PA confirms our bullish or bearish PVSRA results, by recognizing the importance of Levels we can look beyond current PA in the direction it is going and look to historic PA S&R (consolidation around key Levels) to come up with candidates for where the price might be headed. And bull or bear swings typically run in terms of 100+, 150+, 200+ pips, .....etc. And now you know why.
Okay. Now, if this is your first introduction to PVSRA, and having just read the above, you are likely scratching your head and still confused. That is normal. I will tell you a secret about the market and why you have a right to be confused. The secret is this. The market cannot be defined by mathematics nor by immutable logic. This is why the most advanced mathematicians over a century have never even come close to cracking the market. It cannot be done. Something else, other than math and immutable logic is the fundamental operand in the market. Have you ever watched a child attempt a jigsaw puzzle for the first time? And watched as that child grew and attempted more of them, and more complex ones? What is at work in the market I will elaborate on later, but for now trust me in this. We need to apply ourselves to learning how to do PVSRA just as a child attacks learning how to do jigsaw puzzles. And we must continue doing PVSRA, because in time our mind will "learn" when we have just picked up an important piece of the puzzle, and that we know where it goes! Developing the skill of PVSRA is an art form. We must not allow ourselves to feel badly if we miss clues. PVSRA is an art form that takes time to perfect. Over time our skill will grow and our "read" of the unpredictable market will improve. We must take to ongoing learning and application of PVSRA.
Introduction to How the Market Really Works
Does anybody remember the "lil' Abner" cartoons in the Sunday papers? Let me draw for you a mental picture of how the market really works.....
Imagine Daddy Yokum ferociously racing a buckboard wagon up and down the steep inclines and declines in the rough, rocky mountain road that has sharp turns and a sheer cliff on one side. The wagon wheels are spewing rocks off the side of the cliff! Even Daddy Yokum's shotgun is going off due to the jolting of the buckboard! Daddy Yokum has a demented look on his face, but he is smiling! The horse has a wild look in it's eyes and is frothing at the mouth. There are two passengers being tossed around in the back of the buckboard, terror stricken! Now, let's pan back from this cartoon picture and place the labels needed. On the side of the wagon is the sign "Market Pricing". The demented, smiling Daddy Yokum, is the Market Maker. The passengers being tossed around are the buyers and sellers.
.....Got it? Market prices are not determined by the buyers and sellers. They are determined by the Robber Bank Market Makers (MMs).
MMs are Market Manipulators of Price, and Thieves!
The "market" is the sole creation of the Robber Banks that "make the market". While it serves the world of commerce, they run it to make profits. And they opened the market up to foster prolific currency trading by others for the sole purpose of making more profits. They move prices up and down to "create liquidity" to fill the orders of SM (Smart Money) and DM (Dumb Money), for the commissions they make by filling the orders. When they have some orders above the current price and some below the current price, who do you think determines the sequence of direction and distance the price is going to move so these orders can be filled? And always - since they know how they are going to move price next - they take positions themselves to make additional profits.
They do this by:
1. Manipulating price to sucker into the market DM that is taking the wrong side position.
2. Manipulating price to sucker into the market SM that is taking the right side position, but too soon, and later manipulating price to hit their stops.
They have total control of pricing, and by these actions they effectively "steal" from others the money to fill their own "right side" positions before moving the price to the next area they have decided on for filling orders, and for taking profit on their positions built beforehand. Don't get me wrong. I do not object to the market volatility these thieving Robber Banks create. We need it. But we also need to understand what these people are like, the cloth they are cut from. They are crooks, and we have to be extra careful about trading in the market they operate. On some special days you can see them in their true colors. We should witness it. Take note of it. Speak of it. And remember it!

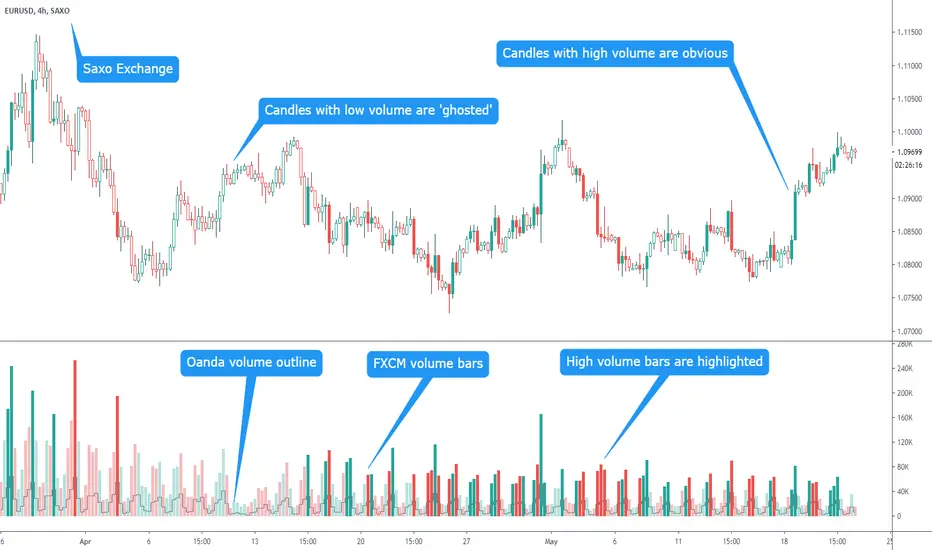
Multi-Exchange Volume w Candle HighlightI've been investigating the value of studying candle volume. I realised all the exchanges give different volume. So I've made an indicator that shows the volume from multiple exchanges.
You can choose a primary exchange for the main changes and a secondary exchange for a line chart in front. These exchanges are INDEPENDANT of the exchange you are looking at so if your broker does not show volume, you can use the volume supplied by another broker who does. For example, you might be looking at a chart from Saxo exchange (who I don't think supplies volume) but see volume from FXCM as the primary with pattern confirmation from Oanda as the secondary.
You'll can see the patterns are the same but FXCM has higher overall volume than Oanda
In addition you can choose to highlight the high volume bars and highlight the high volume candles.
I find it useful as I can look at a move and easily see whether there is volume behind it - if there is a move with low volume is it sustainable?
You have the option to switch all the extra features on and off so if you prefer you can just look at a classic volume chart whilst looking at a candle chart from an exchange that does not supply volume.
I'm honest as to whether I find my scripts useful in my trading (they are always technically correct) or not and I think this one is good.
Intrabar Volume Flow IntelligenceIntrabar Volume Flow Intelligence: A Comprehensive Analysis:
The Intrabar Volume Flow Intelligence indicator represents a sophisticated approach to understanding market dynamics through the lens of volume analysis at a granular, intrabar level. This Pine Script version 5 indicator transcends traditional volume analysis by dissecting price action within individual bars to reveal the true nature of buying and selling pressure that often remains hidden when examining only the external characteristics of completed candlesticks. At its core, this indicator operates on the principle that volume is the fuel that drives price movement, and by understanding where volume is being applied within each bar—whether at higher prices indicating buying pressure or at lower prices indicating selling pressure—traders can gain a significant edge in anticipating future price movements before they become obvious to the broader market.
The foundational innovation of this indicator lies in its use of lower timeframe data to analyze what happens inside each bar on your chart timeframe. While most traders see only the open, high, low, and close of a five-minute candle, for example, this indicator requests data from a one-minute timeframe by default to see all the individual one-minute candles that comprise that five-minute bar. This intrabar analysis allows the indicator to calculate a weighted intensity score based on where the price closed within each sub-bar's range. If the close is near the high, that volume is attributed more heavily to buying pressure; if near the low, to selling pressure. This methodology is far more nuanced than simple tick volume analysis or even traditional volume delta calculations because it accounts for the actual price behavior and distribution of volume throughout the formation of each bar, providing a three-dimensional view of market participation.
The intensity calculation itself demonstrates the coding sophistication embedded in this indicator. For each intrabar segment, the indicator calculates a base intensity using the formula of close minus low divided by the range between high and low. This gives a value between zero and one, where values approaching one indicate closes near the high and values approaching zero indicate closes near the low. However, the indicator doesn't stop there—it applies an open adjustment factor that considers the relationship between the close and open positions within the overall range, adding up to twenty percent additional weighting based on directional movement. This adjustment ensures that strongly directional intrabar movement receives appropriate emphasis in the final volume allocation. The adjusted intensity is then bounded between zero and one to prevent extreme outliers from distorting the analysis, demonstrating careful consideration of edge cases and data integrity.
The volume flow calculation multiplies this intensity by the actual volume transacted in each intrabar segment, creating buy volume and sell volume figures that represent not just quantity but quality of market participation. These figures are accumulated across all intrabar segments within the parent bar, and simultaneously, a volume-weighted average price is calculated for the entire bar using the typical price of each segment multiplied by its volume. This intrabar VWAP becomes a critical reference point for understanding whether the overall bar is trading above or below its fair value as determined by actual transaction levels. The deviation from this intrabar VWAP is then used as a weighting mechanism—when the close is significantly above the intrabar VWAP, buying volume receives additional weight; when below, selling volume is emphasized. This creates a feedback loop where volume that moves price away from equilibrium is recognized as more significant than volume that keeps price near balance.
The imbalance filter represents another layer of analytical sophistication that separates meaningful volume flows from normal market noise. The indicator calculates the absolute difference between buy and sell volume as a percentage of total volume, and this imbalance must exceed a user-defined threshold—defaulted to twenty-five percent but adjustable from five to eighty percent—before the volume flow is considered significant enough to register on the indicator. This filtering mechanism ensures that only bars with clear directional conviction contribute to the cumulative flow measurements, while bars with balanced buying and selling are essentially ignored. This is crucial because markets spend considerable time in equilibrium states where volume is simply facilitating position exchanges without directional intent. By filtering out these neutral periods, the indicator focuses trader attention exclusively on moments when one side of the market is demonstrating clear dominance.
The decay factor implementation showcases advanced state management in Pine Script coding. Rather than allowing imbalanced volume to simply disappear after one bar, the indicator maintains decayed values using variable state that persists across bars. When a new significant imbalance occurs, it replaces the decayed value; when no significant imbalance is present, the previous value is multiplied by the decay factor, which defaults to zero point eight-five. This means that a large volume imbalance continues to influence the indicator for several bars afterward, gradually diminishing in impact unless reinforced by new imbalances. This decay mechanism creates persistence in the flow measurements, acknowledging that large institutional volume accumulation or distribution campaigns don't execute in single bars but rather unfold across multiple bars. The cumulative flow calculation then sums these decayed values over a lookback period, creating a running total that represents sustained directional pressure rather than momentary spikes.
The dual moving average crossover system applied to these volume flows creates actionable trading signals from the underlying data. The indicator calculates both a fast exponential moving average and a slower simple moving average of the buy flow, sell flow, and net flow values. The use of EMA for the fast line provides responsiveness to recent changes while the SMA for the slow line provides a more stable baseline, and the divergence or convergence between these averages signals shifts in volume flow momentum. When the buy flow EMA crosses above its SMA while volume is elevated, this indicates that buying pressure is not only present but accelerating, which is the foundation for the strong buy signal generation. The same logic applies inversely for selling pressure, creating a symmetrical approach to detecting both upside and downside momentum shifts based on volume characteristics rather than price characteristics.
The volume threshold filtering ensures that signals only generate during periods of statistically significant market participation. The indicator calculates a simple moving average of total volume over a user-defined period, defaulted to twenty bars, and then requires that current volume exceed this average by a multiplier, defaulted to one point two times. This ensures that signals occur during periods when the market is actively engaged rather than during quiet periods when a few large orders can create misleading volume patterns. The indicator even distinguishes between high volume—exceeding the threshold—and very high volume—exceeding one point five times the threshold—with the latter triggering background color changes to alert traders to exceptional participation levels. This tiered volume classification allows traders to calibrate their position sizing and conviction levels based on the strength of market participation supporting the signal.
The flow momentum calculation adds a velocity dimension to the volume analysis. By calculating the rate of change of the net flow EMA over a user-defined momentum length—defaulted to five bars—the indicator measures not just the direction of volume flow but the acceleration or deceleration of that flow. A positive and increasing flow momentum indicates that buying pressure is not only dominant but intensifying, which typically precedes significant upward price movements. Conversely, negative and decreasing flow momentum suggests selling pressure is building upon itself, often preceding breakdowns. The indicator even calculates a second derivative—the momentum of momentum, termed flow acceleration—which can identify very early turning points when the rate of change itself begins to shift, providing the most forward-looking signal available from this methodology.
The divergence detection system represents one of the most powerful features for identifying potential trend reversals and continuations. The indicator maintains separate tracking of price extremes and flow extremes over a lookback period defaulted to fourteen bars. A bearish divergence is identified when price makes a new high or equals the recent high, but the net flow EMA is significantly below its recent high—specifically less than eighty percent of that high—and is declining compared to its value at the divergence lookback distance. This pattern indicates that while price is pushing higher, the volume support for that movement is deteriorating, which frequently precedes reversals. Bullish divergences work inversely, identifying situations where price makes new lows without corresponding weakness in volume flow, suggesting that selling pressure is exhausted and a reversal higher is probable. These divergence signals are plotted as distinct diamond shapes on the indicator, making them visually prominent for trader attention.
The accumulation and distribution zone detection provides a longer-term context for understanding institutional positioning. The indicator uses the bars-since function to track consecutive periods where the net flow EMA has remained positive or negative. When buying pressure has persisted for at least five consecutive bars, average intensity exceeds zero point six indicating strong closes within bar ranges, and volume is elevated above the threshold, the indicator identifies an accumulation zone. These zones suggest that smart money is systematically building long positions across multiple bars despite potentially choppy or sideways price action. Distribution zones are identified through the inverse criteria, revealing periods when institutions are systematically exiting or building short positions. These zones are visualized through colored fills on the indicator pane, creating a backdrop that helps traders understand the broader volume flow context beyond individual bar signals.
The signal strength scoring system provides a quantitative measure of conviction for each buy or sell signal. Rather than treating all signals as equal, the indicator assigns point values to different signal components: twenty-five points for the buy flow EMA-SMA crossover, twenty-five points for the net flow EMA-SMA crossover, twenty points for high volume presence, fifteen points for positive flow momentum, and fifteen points for bullish divergence presence. These points are summed to create a buy score that can range from zero to one hundred percent, with higher scores indicating that multiple independent confirmation factors are aligned. The same methodology creates a sell score, and these scores are displayed in the information table, allowing traders to quickly assess whether a signal represents a tentative suggestion or a high-conviction setup. This scoring approach transforms the indicator from a binary signal generator into a nuanced probability assessment tool.
The visual presentation of the indicator demonstrates exceptional attention to user experience and information density. The primary display shows the net flow EMA as a thick colored line that transitions between green when above zero and above its SMA, indicating strong buying, to a lighter green when above zero but below the SMA, indicating weakening buying, to red when below zero and below the SMA, indicating strong selling, to a lighter red when below zero but above the SMA, indicating weakening selling. This color gradient provides immediate visual feedback about both direction and momentum of volume flows. The net flow SMA is overlaid in orange as a reference line, and a zero line is drawn to clearly delineate positive from negative territory. Behind these lines, a histogram representation of the raw net flow—scaled down by thirty percent for visibility—shows bar-by-bar flow with color intensity reflecting whether flow is strengthening or weakening compared to the previous bar. This layered visualization allows traders to simultaneously see the raw data, the smoothed trend, and the trend of the trend, accommodating both short-term and longer-term trading perspectives.
The cumulative delta line adds a macro perspective by maintaining a running sum of all volume deltas divided by one million for scale, plotted in purple as a separate series. This cumulative measure acts similar to an on-balance volume calculation but with the sophisticated volume attribution methodology of this indicator, creating a long-term sentiment gauge that can reveal whether an asset is under sustained accumulation or distribution across days, weeks, or months. Divergences between this cumulative delta and price can identify major trend exhaustion or reversal points that might not be visible in the shorter-term flow measurements.
The signal plotting uses shape-based markers rather than background colors or arrows to maximize clarity while preserving chart space. Strong buy signals—meeting multiple criteria including EMA-SMA crossover, high volume, and positive momentum—appear as full-size green triangle-up shapes at the bottom of the indicator pane. Strong sell signals appear as full-size red triangle-down shapes at the top. Regular buy and sell signals that meet fewer criteria appear as smaller, semi-transparent circles, indicating they warrant attention but lack the full confirmation of strong signals. Divergence-based signals appear as distinct diamond shapes in cyan for bullish divergences and orange for bearish divergences, ensuring these critical reversal indicators are immediately recognizable and don't get confused with momentum-based signals. This multi-tiered signal hierarchy helps traders prioritize their analysis and avoid signal overload.
The information table in the top-right corner of the indicator pane provides real-time quantitative feedback on all major calculation components. It displays the current bar's buy volume and sell volume in millions with appropriate color coding, the imbalance percentage with color indicating whether it exceeds the threshold, the average intensity score showing whether closes are generally near highs or lows, the flow momentum value, and the current buy and sell scores. This table transforms the indicator from a purely graphical tool into a quantitative dashboard, allowing discretionary traders to incorporate specific numerical thresholds into their decision frameworks. For example, a trader might require that buy score exceed seventy percent and intensity exceed zero point six-five before taking a long position, creating objective entry criteria from subjective chart reading.
The background shading that occurs during very high volume periods provides an ambient alert system that doesn't require focused attention on the indicator pane. When volume spikes to one point five times the threshold and net flow EMA is positive, a very light green background appears across the entire indicator pane; when volume spikes with negative net flow, a light red background appears. These backgrounds create a subliminal awareness of exceptional market participation moments, ensuring traders notice when the market is making important decisions even if they're focused on price action or other indicators at that moment.
The alert system built into the indicator allows traders to receive notifications for strong buy signals, strong sell signals, bullish divergences, bearish divergences, and very high volume events. These alerts can be configured in TradingView to send push notifications to mobile devices, emails, or webhook calls to automated trading systems. This functionality transforms the indicator from a passive analysis tool into an active monitoring system that can watch markets continuously and notify the trader only when significant volume flow developments occur. For traders monitoring multiple instruments, this alert capability is invaluable for efficient time allocation, allowing them to analyze other opportunities while being instantly notified when this indicator identifies high-probability setups on their watch list.
The coding implementation demonstrates advanced Pine Script techniques including the use of request.security_lower_tf to access intrabar data, array manipulation to process variable-length intrabar arrays, proper variable scoping with var keyword for persistent state management across bars, and efficient conditional logic that prevents unnecessary calculations. The code structure with clearly delineated sections for inputs, calculations, signal generation, plotting, and alerts makes it maintainable and educational for those studying Pine Script development. The use of input groups with custom headers creates an organized settings panel that doesn't overwhelm users with dozens of ungrouped parameters, while still providing substantial customization capability for advanced users who want to optimize the indicator for specific instruments or timeframes.
For practical trading application, this indicator excels in several specific use cases. Scalpers and day traders can use the intrabar analysis to identify accumulation or distribution happening within the bars of their entry timeframe, providing early entry signals before momentum indicators or price patterns complete. Swing traders can use the cumulative delta and accumulation-distribution zones to understand whether short-term pullbacks in an uptrend are being bought or sold, helping distinguish between healthy retracements and trend reversals. Position traders can use the divergence detection to identify major turning points where price extremes are not supported by volume, providing low-risk entry points for counter-trend positions or warnings to exit with-trend positions before significant reversals.
The indicator is particularly valuable in ranging markets where price-based indicators produce numerous false breakout signals. By requiring that breakouts be accompanied by volume flow imbalances, the indicator filters out failed breakouts driven by low participation. When price breaks a range boundary accompanied by a strong buy or sell signal with high buy or sell score and very high volume, the probability of successful breakout follow-through increases dramatically. Conversely, when price breaks a range but the indicator shows low imbalance, opposing flow direction, or low volume, traders can fade the breakout or at minimum avoid chasing it.
During trending markets, the indicator helps traders identify the healthiest entry points by revealing where pullbacks are being accumulated by smart money. A trending market will show the cumulative delta continuing in the trend direction even as price pulls back, and accumulation zones will form during these pullbacks. When price resumes the trend, the indicator will generate strong buy or sell signals with high scores, providing objective entry points with clear invalidation levels. The flow momentum component helps traders stay with trends longer by distinguishing between healthy momentum pauses—where momentum goes to zero but doesn't reverse—and actual momentum reversals where opposing pressure is building.
The VWAP deviation weighting adds particular value for traders of liquid instruments like major forex pairs, stock indices, and high-volume stocks where VWAP is widely watched by institutional participants. When price deviates significantly from the intrabar VWAP and volume flows in the direction of that deviation with elevated weighting, it indicates that the move away from fair value is being driven by conviction rather than mechanical order flow. This suggests the deviation will likely extend further, creating continuation trading opportunities. Conversely, when price deviates from intrabar VWAP but volume flow shows reduced intensity or opposing direction despite the weighting, it suggests the deviation will revert to VWAP, creating mean reversion opportunities.
The ATR normalization option makes the indicator values comparable across different volatility regimes and different instruments. Without normalization, a one-million share buy-sell imbalance might be significant for a low-volatility stock but trivial for a high-volatility cryptocurrency. By normalizing the delta by ATR, the indicator accounts for the typical price movement capacity of the instrument, making signal thresholds and comparison values meaningful across different trading contexts. This is particularly valuable for traders running the indicator on multiple instruments who want consistent signal quality regardless of the underlying instrument characteristics.
The configurable decay factor allows traders to adjust how persistent they want volume flows to remain influential. For very short-term scalping, a lower decay factor like zero point five will cause volume imbalances to dissipate quickly, keeping the indicator focused only on very recent flows. For longer-term position trading, a higher decay factor like zero point nine-five will allow significant volume events to influence the indicator for many bars, revealing longer-term accumulation and distribution patterns. This flexibility makes the single indicator adaptable to trading styles ranging from one-minute scalping to daily chart position trading simply by adjusting the decay parameter and the lookback bars.
The minimum imbalance percentage setting provides crucial noise filtering that can be optimized per instrument. Highly liquid instruments with tight spreads might show numerous small imbalances that are meaningless, requiring a higher threshold like thirty-five or forty percent to filter noise effectively. Thinly traded instruments might rarely show extreme imbalances, requiring a lower threshold like fifteen or twenty percent to generate adequate signals. By making this threshold user-configurable with a wide range, the indicator accommodates the full spectrum of market microstructure characteristics across different instruments and timeframes.
In conclusion, the Intrabar Volume Flow Intelligence indicator represents a comprehensive volume analysis system that combines intrabar data access, sophisticated volume attribution algorithms, multi-timeframe smoothing, statistical filtering, divergence detection, zone identification, and intelligent signal scoring into a cohesive analytical framework. It provides traders with visibility into market dynamics that are invisible to price-only analysis and even to conventional volume analysis, revealing the true intentions of market participants through their actual transaction behavior within each bar. The indicator's strength lies not in any single feature but in the integration of multiple analytical layers that confirm and validate each other, creating high-probability signal generation that can form the foundation of complete trading systems or provide powerful confirmation for discretionary analysis. For traders willing to invest time in understanding its components and optimizing its parameters for their specific instruments and timeframes, this indicator offers a significant informational advantage in increasingly competitive markets where edge is derived from seeing what others miss and acting on that information before it becomes consensus.

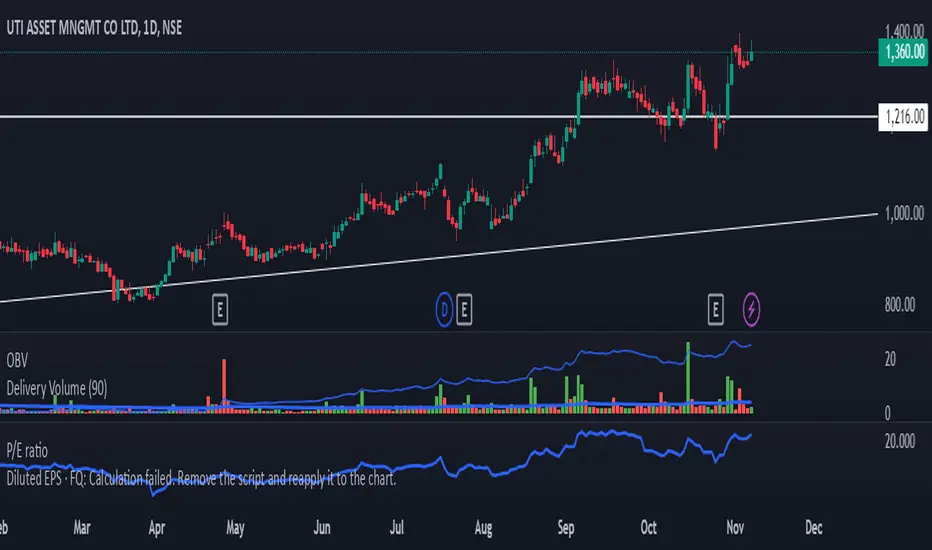
Delivery Volume IndicatorDelivery Volume Indicator
The Delivery Volume Indicator is designed to provide insights into trading volume specifically delivered on a daily basis, scaled in lakhs (hundreds of thousands) for ease of interpretation. This tool can be especially useful for traders looking to monitor delivery-based volume changes and trends, as it helps to distinguish between bullish and bearish volume flows.
Key Features:
Daily Volume in Lakhs: The indicator pulls daily volume data and scales it to lakhs for more readable values.
Bullish/Bearish Color Coding: The indicator color-codes volume columns to reflect market sentiment. Columns are displayed in green when the price closes higher than it opens (bullish) and in red when the price closes lower than it opens (bearish).
Adjustable EMA: A customizable Exponential Moving Average (EMA) is applied to the scaled delivery volume. The EMA line, displayed in blue, helps smooth out volume trends and allows traders to adjust the period for personal strategy alignment.
How to Use:
Observe the delivery volume changes to track market sentiment over time. Increased bullish delivery volume could indicate accumulating interest, while increased bearish delivery volume might suggest distribution.
Utilize the EMA to identify longer-term trends in delivery volume, with shorter EMA periods for quick volume shifts and longer periods for gradual trend changes.
This indicator is ideal for traders seeking volume-based insights that align closely with price action.
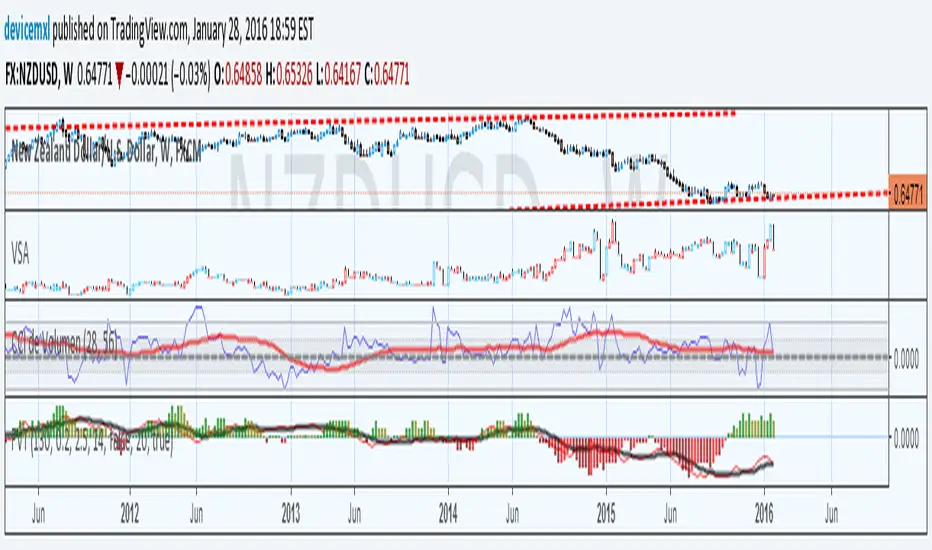
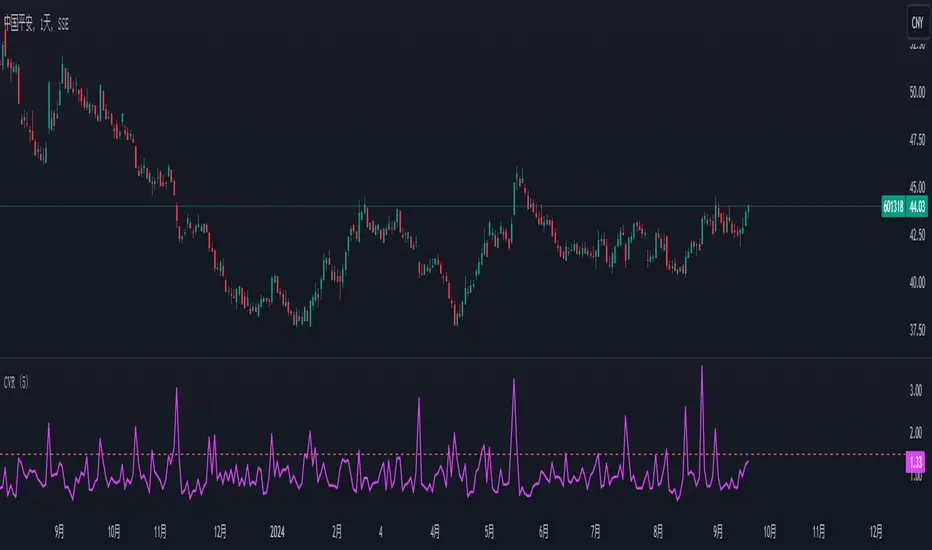
China's stock market volume ratio1. Introduction to Volume Ratio:
In China's stock market, the volume ratio is an indicator used to measure relative trading volume. It compares the average volume per minute after the market opens to the average volume per minute over the past five trading days.
2. Application of Volume Ratio:
When there is a sudden surge in volume, the volume ratio chart will show a sharp upward break, indicating an increase in trading volume (initial market movements can be disregarded). Conversely, when volume contracts, the volume ratio will move downward.
If the volume ratio is greater than 1, it indicates that the average trading volume per minute for the current day is higher than the average over the past five days, signifying increased trading activity.
If the volume ratio is less than 1, it means that today's trading volume is lower than the average of the past five days, indicating decreased trading activity.
3. Volume Ratio Calculation:
The formula for calculating the volume ratio is:
Volume Ratio=Current Total Volume/(Average Volume per Minute over the Last 5 Days * Accumulated Market Open Time (in minutes))
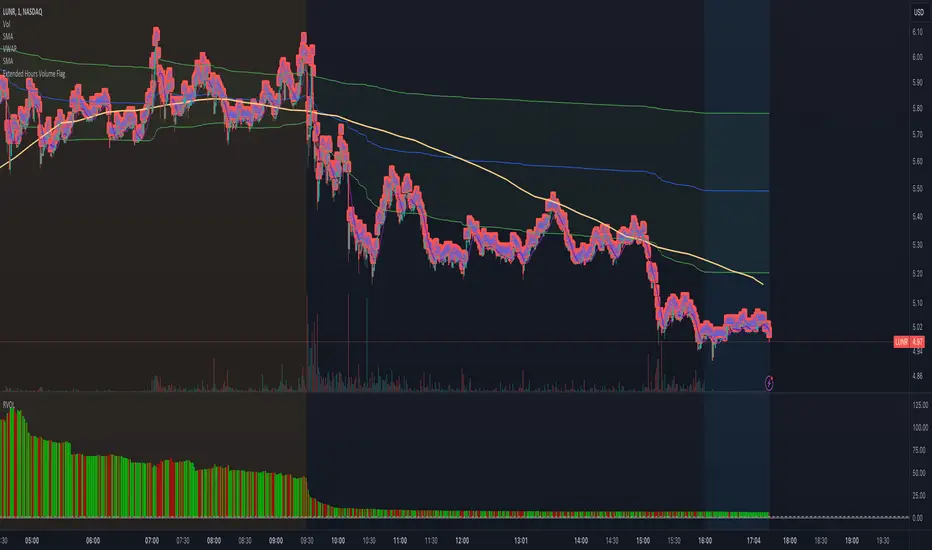
Extended Hours Volume FlagOverview: The Extended Hours Volume Flag Indicator is a powerful tool designed for traders who are interested in monitoring and analyzing the volume activity during the extended trading hours—specifically the premarket (4:00 AM to 9:30 AM) and afterhours (4:00 PM to 8:00 PM) sessions. This indicator identifies and flags stocks where the trading volume during these extended hours exceeds 20% of the Average Volume (AVOL) during regular trading hours. Such occurrences often signal unusual activity or potential market-moving events, which can be crucial for informed trading decisions.
Concept: Volume is a critical factor in trading, often providing insights into market sentiment and potential price movements. However, volume during extended hours can be particularly revealing as it may indicate heightened interest or activity outside of the regular trading session. The Extended Hours Volume Flag Indicator is built on the concept that significant volume during premarket or afterhours trading sessions, relative to the average regular session volume, could be an early indicator of upcoming volatility or trends.
How It Works:
Session Segmentation: The indicator distinguishes between regular trading hours (9:30 AM to 4:00 PM) and extended hours (premarket and afterhours). It accumulates the trading volume separately for these sessions.
Volume Comparison: It calculates the Average Volume (AVOL) over a user-defined period (default is 14 days) during regular trading hours. It then compares the extended hours volume to this AVOL.
Flagging Condition: If the volume during the extended hours exceeds 20% of the AVOL, the indicator flags the stock with a warning symbol on the chart. This visual cue helps traders quickly identify stocks with potentially significant afterhours or premarket activity.
Reset Mechanism: The accumulated volumes reset at the start of the new trading day, ensuring accurate calculations for each day.
Usage: This indicator is ideal for traders who are looking for early signals of market activity outside regular hours, which might not be immediately visible when looking solely at price action. It is particularly useful for day traders and swing traders who want to keep an eye on potential premarket or afterhours catalysts.
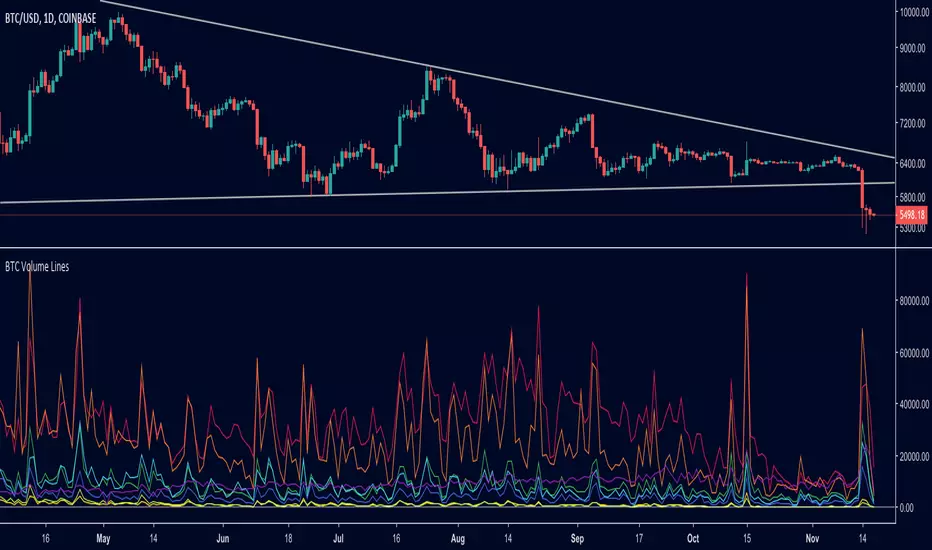
BTC Volume Lines [v2018-11-17] @ LekkerCryptisch.nlCombine the volume of 8 BTCUSD exchanges in one graph.
Three use cases:
1) See the absolute volumes in one graph
2) See the relative volumes in one graph
3) See the deviation of the EMA the volumes in one graph
Smart Volume Radar (TR/EN)
ENGLISH DESCRIPTION
Stop guessing the volume bars! This indicator is designed to be a "Decision Maker" for traders who want to understand the true power behind price movements instantly. It replaces complex volume analysis with a simple, high-contrast dashboard.
Key Features:
🚦 Traffic Light Logic: The entire panel changes color based on the volume status.
Dark Green: Volume is above average (Fuel is ready 🚀).
Dark Red: Volume is below average (No interest / Trap Zone ⚠️).
📊 RVOL (Relative Volume): Shows exactly how many times the current volume is compared to the average (e.g., 2.5x).
🧠 Trader Logic (Smart Status): It doesn't just show numbers; it interprets them for you:
DEAD: No liquidity, stay away.
STANDARD: Routine market flow.
POWER ENTRY: Ideal volume for breakouts.
ULTRA HIGH (FOMO): Warning! Volume is too high, a reversal might be near.
👀 High Contrast Design: Dark solid backgrounds with white bold text for maximum readability on any chart.
How to Use:
Look at the panel color. If it's RED, ignore breakout signals (likely a fakeout).
If it's GREEN, check the "Trader Note" at the bottom.
If you see "POWER ENTRY", the trend is supported by real volume.

RVOL Highlighter (Bullish Volume Spikes)Description:
A simple yet powerful indicator that highlights candles with unusually high buying volume.
What it does:
Identifies candles where relative volume (RVOL) exceeds your chosen threshold AND the candle is bullish (green). These high-volume bullish candles often signal strong institutional buying interest or momentum breakouts.
How it works:
Calculates RVOL by comparing current volume to the simple moving average of volume over your selected period
Only highlights candles that meet BOTH conditions: RVOL above threshold + bullish close
Highlighted candles appear in bright magenta for easy visibility on dark mode charts
Settings:
RVOL Period: Lookback period for average volume calculation (default: 10)
RVOL Threshold: Minimum relative volume multiplier to trigger highlight (default: 2.5x)
Highlight Color: Customizable (default: magenta #FF00FF)
Use cases:
Spot potential breakout entries with volume confirmation
Identify accumulation zones
Filter for high-conviction bullish moves
Works on any timeframe and any asset. The actual RVOL value is available in the data window when hovering over candles.

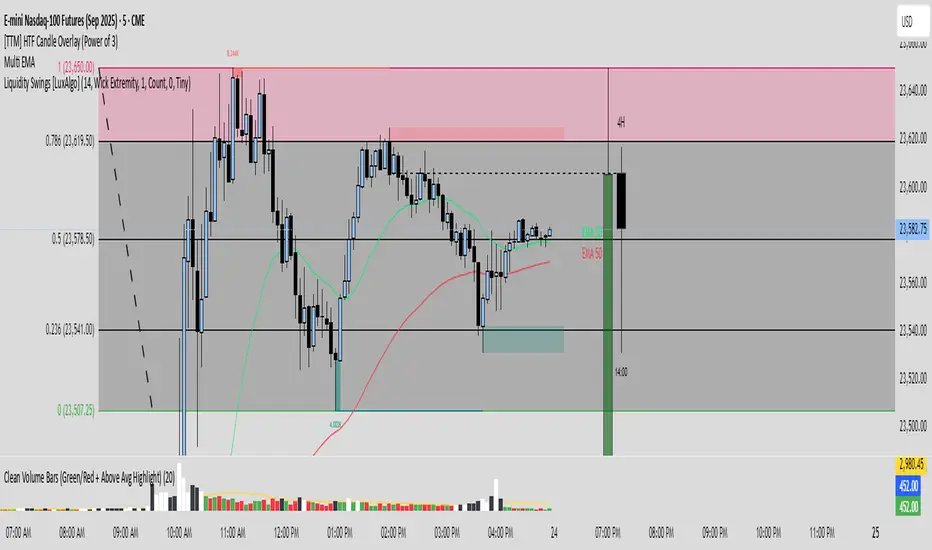
Clean Volume Bars (Green/Red + Above Avg Highlight)📊 Clean Volume Bars (Green/Red + Above Avg Highlight)
This script provides a clearer view of market volume by combining standard green/red volume bars with dynamic highlights for above-average activity.
Features:
✅ Green / Red Volume Bars – standard visualization:
Green when the candle closes higher than it opened
Red when the candle closes lower than it opened
✅ Average Volume Line – a simple moving average (default 20 periods) to track relative volume.
✅ Above Average Highlights – bars that exceed the average volume are emphasized:
White for above-average bullish volume
Black for above-average bearish volume
How to Use:
Look for white volume spikes during up candles → potential strong bullish activity.
Watch for black volume spikes during down candles → potential strong bearish pressure.
Combine with price action, trend, or other indicators for confluence (this is not a standalone trading system).
OBR 15min Session Opening Range Breakout + Volume Trend DeltaQuick Overview
This Pine Script plots the opening range for London and New York sessions, highlights breakout levels, draws previous session pivots, and offers a live volume delta table for trend confirmation.
Session Opening Range
- Captures the high/low of the first 15 minutes (configurable) for both London & NY sessions.
- Fills the range area with adjustable semi‑transparent colors.
- Optional alerts fire on breakout above the high or below the low.
Previous Session Levels
- Automatically draws previous day’s High, Low, Open and previous 4‑hour High/Low.
- Helps identify key S/R zones as price approaches ORB breakouts.
Volume Trend Delta
- Uses a CMO‑weighted moving average and ATR bands to detect trend state.
- Accumulates bullish vs. bearish volume during each trend.
- Displays Bull Vol, Bear Vol, and Delta % in a movable table for quick strength checks.
How to Use
1. Let the opening range complete (first 15 min).
2. Look for price closing above/below the ORB—enter long on an upside break, short on a downside break.
3. Check the Volume Delta table: positive delta confirms buying strength; negative delta confirms selling pressure.
4. Use previous day/4h levels as additional support/resistance filters.
Settings & Customization
- ORB Duration & Session Times (London/NY), fill colors, and toggles.
- Enable/disable Previous Day & 4H levels.
- Trend Period, Momentum Window, and Delta table position/size.
- Pre‑built alert conditions for all ORB breakouts.
Developer Notes
- Fully commented for easy adjustments.
- Modular sections: ORB, previous levels, trend delta, and alerts.
- No external libraries—pure Pine Script v6.
Tip
Combine ORB breakouts with Volume Delta and prior session pivots to filter false signals and trade stronger, more reliable moves.
