Ichimoku by FarmerBTCLegal Disclaimer
This strategy, "Ichimoku by FarmerBTC," is provided for educational and informational purposes only. It does not constitute financial advice and should not be relied upon as such. Trading and investing involve substantial risk, including the potential for losing more than your initial investment. Past performance is not indicative of future results. Always consult with a qualified financial advisor before making trading or investment decisions. The author of this strategy is not responsible for any financial losses incurred through its use.
Overview
The "Ichimoku by FarmerBTC" strategy is a trend-following system built on the Ichimoku Cloud indicator, enhanced with volume analysis and a high-timeframe Simple Moving Average (HTF SMA) condition. It is designed to identify long-only trade opportunities and performs optimally on higher timeframes, such as the daily chart or above.
Core Components
1. Ichimoku Cloud
The Ichimoku Cloud is a comprehensive trend-following indicator that helps identify the overall market direction and momentum. It consists of:
Conversion Line (Tenkan-Sen): Measures short-term momentum.
Base Line (Kijun-Sen): Filters medium-term trends.
Leading Span A: The average of the Conversion and Base Lines, forming one cloud boundary.
Leading Span B: The midpoint of the highest high and lowest low over a longer period, forming the other cloud boundary.
Key Ichimoku Rules Applied:
The strategy identifies bullish trends when:
The price is above the cloud.
The cloud is bullish (Leading Span A > Leading Span B).
2. High-Timeframe Simple Moving Average (HTF SMA)
This condition ensures alignment with the broader trend:
Default SMA Length: 13 periods.
Default Timeframe: 1 day.
HTF SMA Rule:
Trades are allowed only when the price is above the HTF SMA, ensuring alignment with the larger trend.
3. Volume Analysis
The strategy uses volume to validate trade setups:
Volume MA: A 20-period moving average of volume is calculated.
Trades are allowed only when the current volume is at least 1.5x the Volume MA, indicating strong market participation.
Entry and Exit Rules
Entry Condition (Long Only):
Price above the Ichimoku Cloud: Confirms a bullish trend.
Bullish Cloud: Leading Span A > Leading Span B indicates upward momentum.
Price above the HTF SMA: Ensures alignment with the broader trend.
Volume exceeds threshold: Confirms strong market participation.
Exit Condition:
The strategy exits the position when the price moves below the Ichimoku Cloud, signaling a potential trend reversal.
Best Timeframes
This strategy is optimized for daily (1D) or higher timeframes (e.g., weekly 1W). Using it on lower timeframes may produce false signals due to increased noise in price and volume data.
Default Settings
Ichimoku Settings:
Conversion Line Period: 10
Base Line Period: 30
Lagging Span Period: 53
Displacement: 26
HTF SMA Settings:
SMA Length: 13
Timeframe: 1 Day
Volume Settings:
Volume MA Length: 20
Volume Multiplier: 1.5x
Visualization
Ichimoku Cloud:
Dynamic cloud coloring (green for bullish, red for bearish) helps identify the current trend.
HTF SMA:
A purple line overlays the chart, providing a clear representation of the high-timeframe trend.
Volume Panel:
An optional panel displays volume (blue histogram) and the Volume Moving Average (orange line) to analyze market participation.
Advantages of This Strategy
High Accuracy on Higher Timeframes:
Filtering trades using the Ichimoku Cloud, HTF SMA, and volume ensures robust trend alignment, reducing false signals.
Volume Confirmation:
Incorporates volume as a validation metric to enter trades only during strong market participation.
Easy Customization:
Parameters like Ichimoku periods, SMA length, timeframe, and volume thresholds can be adjusted to suit different assets or trading styles.
Limitations
Not Suitable for Low Timeframes:
Lower timeframes can produce excessive noise, leading to false signals.
Long-Only:
The strategy is designed only for bullish markets and does not support short trades.
Lagging Nature of Indicators:
Both the Ichimoku Cloud and SMA are lagging indicators, meaning they react to past price movements.
Conclusion
The "Ichimoku by FarmerBTC" strategy is an excellent tool for trend-following on daily or higher timeframes. Its combination of Ichimoku Cloud, high-timeframe SMA, and volume ensures a robust framework for identifying high-probability long trades in trending markets. However, users are advised to test the strategy thoroughly and manage their risk appropriately. Always consult with a financial professional before making trading decisions.
ค้นหาในสคริปต์สำหรับ "volume"

Max Pain StrategyThe Max Pain Strategy uses a combination of volume and price movement thresholds to identify potential "pain zones" in the market. A "pain zone" is considered when the volume exceeds a certain multiple of its average over a defined lookback period, and the price movement exceeds a predefined percentage relative to the price at the beginning of the lookback period.
Here’s how the strategy functions step-by-step:
Inputs:
length: Defines the lookback period used to calculate the moving average of volume and the price change over that period.
volMultiplier: Sets a threshold multiplier for the volume; if the volume exceeds the average volume multiplied by this factor, it triggers the condition for a potential "pain zone."
priceMultiplier: Sets a threshold for the minimum percentage price change that is required for a "pain zone" condition.
Calculations:
averageVolume: The simple moving average (SMA) of volume over the specified lookback period.
priceChange: The absolute difference in price between the current bar's close and the close from the lookback period (length).
Pain Zone Condition:
The condition for entering a position is triggered if both the volume is higher than the average volume by the volMultiplier and the price change exceeds the price at the length-period ago by the priceMultiplier. This is an indication of significant market activity that could result in a price move.
Position Entry:
A long position is entered when the "pain zone" condition is met.
Exit Strategy:
The position is closed after the specified holdPeriods, which defines how many periods the position will be held after being entered.
Visualization:
A small triangle is plotted on the chart where the "pain zone" condition is met.
The background color changes to a semi-transparent red when the "pain zone" is active.
Scientific Explanation of the Components
Volume Analysis and Price Movement: These are two critical factors in trading strategies. Volume often serves as an indicator of market strength (or weakness), and price movement is a direct reflection of market sentiment. Higher volume with significant price movement may suggest that the market is entering a phase of increased volatility or trend formation, which the strategy aims to exploit.
Volume analysis: The study of volume as an indicator of market participation, with increased volume often signaling stronger trends (Murphy, J. J., Technical Analysis of the Financial Markets).
Price movement thresholds: A large price change over a short period may be interpreted as a breakout or a potential reversal point, aligning with volatility and liquidity analysis (Schwager, J. D., Market Wizards).
Repainting Check: This strategy does not involve any repainting because it is based on current and past data, and there is no reference to future values in the decision-making process. However, any strategy that uses lagging indicators or conditions based on historical bars, like close , is inherently a lagging strategy and might not predict real-time price action accurately until after the fact.
Risk Management: The position hold duration is predefined, which adds an element of time-based risk control. This duration ensures that the strategy does not hold a position indefinitely, which could expose it to unnecessary risk.
Potential Issues and Considerations
Repainting:
The strategy does not utilize future data or conditions that depend on future bars, so it does not inherently suffer from repainting issues.
However, since the strategy relies on volume and price change over a set lookback period, the decision to enter or exit a trade is only made after the data for the current bar is complete, meaning the trade decisions are somewhat delayed, which could be seen as a lagging feature rather than a repainting one.
Lagging Nature:
As with many technical analysis-based strategies, this one is based on past data (moving averages, price changes), meaning it reacts to market movements after they have already occurred, rather than predicting future price actions.
Overfitting Risk:
With parameters like the lookback period and multipliers being user-adjustable, there is a risk of overfitting to historical data. Adjusting parameters too much based on past performance can lead to poor out-of-sample results (Gauthier, P., Practical Quantitative Finance).
Conclusion
The Max Pain Strategy is a simple approach to identifying potential market entries based on volume spikes and significant price changes. It avoids repainting by relying solely on historical and current bar data, but it is inherently a lagging strategy that reacts to price and volume patterns after they have occurred. Therefore, the strategy can be effective in trending markets but may struggle in highly volatile, sideways markets.

TRIN (Arms Index) Trading StrategyThe TRIN (Arms Index), also known as the Short-Term Trading Index, is a technical indicator designed to gauge the internal strength or weakness of the market. It compares the number of advancing and declining stocks to the advancing and declining volume (AD Volume). A TRIN value above 1.0 generally indicates bearish market conditions, while a value below 1.0 suggests bullish market sentiment.
Strategy Rules:
Entry Condition (Long Position): When the TRIN value is above 1.0, the strategy enters a long position, indicating that the market may be oversold, and a potential reversal could occur.
Exit Condition: The strategy exits the long position when the closing price is higher than the previous day’s high, signaling a potential rebound in the market.
This strategy aims to capitalize on short-term market inefficiencies by entering trades during periods of potential market weakness and exiting when signs of recovery appear.
How the TRIN Index Works:
The TRIN is calculated as follows:
TRIN=Advancing Issues / Declining IssuesAdvancing Volume / Declining Volume
TRIN=Advancing Volume / Declining VolumeAdvancing Issues / Declining Issues
A TRIN value above 1.0 indicates that the market is potentially oversold (more declining stocks with higher volume), while a value below 1.0 suggests the market may be overbought (more advancing stocks with higher volume) .
Empirical Evidence:
Market Sentiment Indicator: The TRIN has been widely used as a sentiment indicator. Research by Zweig (1997) suggests that extreme TRIN values can serve as a contrarian signal, indicating potential turning points in the market. For instance, a TRIN above 2.0 is often considered a sign of panic selling, which can precede a market bottom .
Overbought/Oversold Conditions: Studies have shown that indicators like TRIN, which measure market breadth and volume, can be effective in identifying overbought and oversold conditions. According to Fama and French (1988), market sentiment indicators that consider both price and volume data can offer insights into future price movements .
Risks and Limitations:
False Signals:
One of the primary risks of using the TRIN-based strategy is the possibility of false signals. A TRIN value above 1.0 does not always guarantee a market rebound, especially in sustained bearish trends. In such cases, the strategy might enter long positions prematurely, leading to losses.
Research by Brock, Lakonishok, and LeBaron (1992) found that while market indicators like TRIN can be useful, they are not foolproof and can generate multiple false positives, particularly in volatile markets .
Market Regimes:
The effectiveness of the TRIN index can vary depending on the market regime. In strongly trending markets, either bullish or bearish, the TRIN may not provide reliable reversal signals, and relying on it could result in trades that go against the prevailing trend. For instance, during strong bear markets, the TRIN may frequently remain above 1.0, leading to multiple losing trades as the market continues to decline.
Short-Term Focus:
The TRIN strategy is inherently short-term focused, aiming to capture quick market reversals. This makes it sensitive to market noise and less effective for longer-term investors. Moreover, short-term trading strategies often require more frequent adjustments and can incur higher transaction costs, which may erode profitability over time.
Liquidity and Execution Risk:
Since the TRIN strategy requires entering and exiting trades based on short-term market movements, it is vulnerable to liquidity and execution risks. In fast-moving markets, the execution of trades may be delayed, leading to slippage and potentially unfavorable entry or exit points.
Conclusion:
The TRIN (Arms Index) Trading Strategy can be an effective tool for traders looking to capitalize on short-term market inefficiencies and potential reversals. However, it is important to recognize the risks associated with this strategy, including false signals, sensitivity to market regimes, and execution risks. Traders should employ proper risk management techniques and consider combining the TRIN with other indicators to improve the robustness of the strategy.
While the TRIN provides valuable insights into market sentiment, it is not a standalone solution and should be used in conjunction with a broader trading plan that takes into account both technical and fundamental analysis.
References:
Arms, Richard W. "Volume Adjusted Moving Averages." Technical Analysis of Stocks & Commodities, 1993.
Zweig, Martin. Winning on Wall Street. Warner Books, 1997.
Fama, Eugene F., and Kenneth R. French. "Permanent and Temporary Components of Stock Prices." Journal of Political Economy, 1988.
Brock, William, Josef Lakonishok, and Blake LeBaron. "Simple Technical Trading Rules and the Stochastic Properties of Stock Returns." Journal of Finance, 1992.

TradeBuilderOverview
TradeBuilder is an ever-growing toolbox that lets you combine and compound any number of bundled indicators and algorithms to create a compound strategy. At launch, we're including two Moving Averages (SMA, EMA), RSI, and Stochastic Oscillator, with many more to come. You can use any combination of indicators, be it just one, two, or all.
Key Concepts
Indicator Integration: Tradebuilder allows the use of Moving Averages, RSI, and Stochastic Oscillators, with customizable parameters for each. More indicators to come.
Mode Selection : Choose between Confirm Trend Mode (using indicators to confirm trends) and Momentum Mode (using indicators to spot reversals).
Trade Flexibility : Offers options for both long and short trades, enabling diverse trading strategies.
Customizable Inputs : Easily toggle indicators on or off and adjust specific settings like periods and thresholds.
Signal Generation : Combines multiple conditions to generate entry and exit signals.
Input Parameters:
Moving Average (MA):
use_ma : Enable this to include the Moving Average in your strategy.
ma_cross_type : Choose between "Close/MA" (price crossing the MA) or "MA/MA" (one MA crossing another).
ma_length : Set the period for the primary MA.
ma_type : Choose between "SMA" (Simple Moving Average) or "EMA" (Exponential Moving Average).
ma_length2 : Set the period for the secondary MA if using the "MA/MA" cross type.
ma_type2 : Set the type for the secondary MA.
Relative Strength Index (RSI):
use_rsi : Enable this to include RSI in your strategy.
rsi_length : Set the period for RSI calculation.
rsi_overbought : Define the overbought level.
rsi_oversold : Define the oversold level.
Stochastic Oscillator:
use_stoch : Enable this to include the Stochastic Oscillator in your strategy.
stoch_k : Set the %K period.
stoch_d : Set the %D period.
stoch_smooth : Define the smoothing factor.
stoch_overbought : Set the overbought level.
stoch_oversold : Set the oversold level.
Confirmation or Momentum Mode:
confirm_trend : Set this to true to use RSI and Stochastic Oscillator to confirm trends (long when above overbought, short when below oversold). Set to false to trade on momentum (short when above overbought, long when below oversold).
Tip: When set to false and used with just momentum oscillators like Stochastic or RSI, it's geared toward scalping as it essentially becomes momentum trading.
Trade Directions:
trade_long : Enable to allow long trades.
trade_short : Enable to allow short trades.
Example Strategy on E-mini S&P 500 Index Futures ( CME_MINI:ES1! ), 1-minute Chart
Let’s say you want to create a strategy to go long when:
A 5-period SMA crosses above a 100-period EMA.
RSI is above 20.
The Stochastic Oscillator is above 95.
Trend Confirmation Mode is on.
For short:
A 5-period SMA crosses below a 100-period EMA.
RSI is below 45.
The Stochastic Oscillator is below 5.
Trend Confirmation Mode is on.
Here’s how you would set it up in Tradebuilder:
use_ma = true
ma_cross_type = "MA/MA"
ma_length = 5
ma_type = "SMA"
ma_length2 = 100
ma_type2 = "EMA"
use_rsi = true
rsi_length = 14
rsi_overbought = 20
rsi_oversold = 45
use_stoch = true
stoch_k = 8
stoch_d = 1
stoch_smooth = 1
stoch_overbought = 95
stoch_oversold = 5
confirm_trend = true
trade_long = true
trade_short = false
Alerts
Here is how to set TradeBuilder alerts: open a TradingView chart, attach TradeBuilder, right-click on chart -> Add Alert. Condition: Symbol (e.g. NQ) >> TradeBuilder >> Open-Ended Alert >> Once Per Bar Close.
Development Roadmap
We plan to add many more compoundable indicators to TradeBuilder over the coming months from all walks of technical analysis, including Volume, Volatility, Trend Detection/Validation, Momentum, Divergences, Chart Patterns, Support/Resistance Analysis. etc.

SuperTrend Trapping Candle StrategyHello traders!
How this indicator works?
The main functionality of this indicator is to find entry based upon SuperTrend indicator. This indicator helps us to find trapping candle to enter into the market.
What is a trapping candle?
A trapping candle is a candle that shows strength in opposite direction to SuperTrend. This helps us to enter in a trade before the move start in the current trend's direction. There are two types of trapping candles signals I have added currently:
1. Volume is high than previous candle in the opposite direction.
2. 3 candles of opposite direction with decreasing volume .
How to enter in a trade in uptrend market?
SuperTrend shows a green signal
A green triangle formed below red candle
Enter into the trade when price is above red candle high
SL could be place below red candle or swing low if it is near
How to enter in a trade in downtrend market?
SuperTrend shows a red signal
A red triangle formed above green candle
Enter into the trade when price is below green candle low
SL could be place above green candle high or swing high if it is near
How to avoid to enter in a trade in sideways market?
You can follow price action strategies
Or you can follow some indicator to find sideways market
Indicator settings and how to change?
ATR Length - For SuperTrend, this is default value.
Factor - For SuperTrend, changed to 2 to provide fast signals.
Candle Height - For trapping candle price, default set to 0.003% of the current price.

Ruckard TradingLatinoThis strategy tries to mimic TradingLatino strategy.
The current implementation is beta.
Si hablas castellano o espanyol por favor consulta MENSAJE EN CASTELLANO más abajo.
It's aimed at BTCUSDT pair and 4h timeframe.
STRATEGY DEFAULT SETTINGS EXPLANATION
max_bars_back=5000 : This is a random number of bars so that the strategy test lasts for one or two years
calc_on_order_fills=false : To wait for the 4h closing is too much. Try to check if it's worth entering a position after closing one. I finally decided not to recheck if it's worth entering after an order is closed. So it is false.
calc_on_every_tick=false
pyramiding=0 : We only want one entry allowed in the same direction. And we don't want the order to scale by error.
initial_capital=1000 : These are 1000 USDT. By using 1% maximum loss per trade and 7% as a default stop loss by using 1000 USDT at 12000 USDT per BTC price you would entry with around 142 USDT which are converted into: 0.010 BTC . The maximum number of decimal for contracts on this BTCUSDT market is 3 decimals. E.g. the minimum might be: 0.001 BTC . So, this minimal 1000 amount ensures us not to entry with less than 0.001 entries which might have happened when using 100 USDT as an initial capital.
slippage=1 : Binance BTCUSDT mintick is: 0.01. Binance slippage: 0.1 % (Let's assume). TV has an integer slippage. It does not have a percentage based slippage. If we assume a 1000 initial capital, the recommended equity is 142 which at 11996 USDT per BTC price means: 0.011 BTC. The 0.1% slippage of: 0.011 BTC would be: 0.000011 . This is way smaller than the mintick. So our slippage is going to be 1. E.g. 1 (slippage) * 0.01 (mintick)
commission_type=strategy.commission.percent and commission_value=0.1 : According to: binance . com / en / fee / schedule in VIP 0 level both maker and taker fees are: 0.1 %.
BACKGROUND
Jaime Merino is a well known Youtuber focused on crypto trading
His channel TradingLatino
features monday to friday videos where he explains his strategy.
JAIME MERINO STANCE ON BOTS
Jaime Merino stance on bots (taken from memory out of a 2020 June video from him):
'~
You know. They can program you a bot and it might work.
But, there are some special situations that the bot would not be able to handle.
And, I, as a human, I would handle it. And the bot wouldn't do it.
~'
My long term target with this strategy script is add as many
special situations as I can to the script
so that it can match Jaime Merino behaviour even in non normal circumstances.
My alternate target is learn Pine script
and enjoy programming with it.
WARNING
This script might be bigger than other TradingView scripts.
However, please, do not be confused because the current status is beta.
This script has not been tested with real money.
This is NOT an official strategy from Jaime Merino.
This is NOT an official strategy from TradingLatino . net .
HOW IT WORKS
It basically uses ADX slope and LazyBear's Squeeze Momentum Indicator
to make its buy and sell decisions.
Fast paced EMA being bigger than slow paced EMA
(on higher timeframe) advices going long.
Fast paced EMA being smaller than slow paced EMA
(on higher timeframe) advices going short.
It finally add many substrats that TradingLatino uses.
SETTINGS
__ SETTINGS - Basics
____ SETTINGS - Basics - ADX
(ADX) Smoothing {14}
(ADX) DI Length {14}
(ADX) key level {23}
____ SETTINGS - Basics - LazyBear Squeeze Momentum
(SQZMOM) BB Length {20}
(SQZMOM) BB MultFactor {2.0}
(SQZMOM) KC Length {20}
(SQZMOM) KC MultFactor {1.5}
(SQZMOM) Use TrueRange (KC) {True}
____ SETTINGS - Basics - EMAs
(EMAS) EMA10 - Length {10}
(EMAS) EMA10 - Source {close}
(EMAS) EMA55 - Length {55}
(EMAS) EMA55 - Source {close}
____ SETTINGS - Volume Profile
Lowest and highest VPoC from last three days
is used to know if an entry has a support
VPVR of last 100 4h bars
is also taken into account
(VP) Use number of bars (not VP timeframe): Uses 'Number of bars {100}' setting instead of 'Volume Profile timeframe' setting for calculating session VPoC
(VP) Show tick difference from current price {False}: BETA . Might be useful for actions some day.
(VP) Number of bars {100}: If 'Use number of bars (not VP timeframe)' is turned on this setting is used to calculate session VPoC.
(VP) Volume Profile timeframe {1 day}: If 'Use number of bars (not VP timeframe)' is turned off this setting is used to calculate session VPoC.
(VP) Row width multiplier {0.6}: Adjust how the extra Volume Profile bars are shown in the chart.
(VP) Resistances prices number of decimal digits : Round Volume Profile bars label numbers so that they don't have so many decimals.
(VP) Number of bars for bottom VPOC {18}: 18 bars equals 3 days in suggested timeframe of 4 hours. It's used to calculate lowest session VPoC from previous three days. It's also used as a top VPOC for sells.
(VP) Ignore VPOC bottom advice on long {False}: If turned on it ignores bottom VPOC (or top VPOC on sells) when evaluating if a buy entry is worth it.
(VP) Number of bars for VPVR VPOC {100}: Number of bars to calculate the VPVR VPoC. We use 100 as Jaime once used. When the price bounces back to the EMA55 it might just bounce to this VPVR VPoC if its price it's lower than the EMA55 (Sells have inverse algorithm).
____ SETTINGS - ADX Slope
ADX Slope
help us to understand if ADX
has a positive slope, negative slope
or it is rather still.
(ADXSLOPE) ADX cut {23}: If ADX value is greater than this cut (23) then ADX has strength
(ADXSLOPE) ADX minimum steepness entry {45}: ADX slope needs to be 45 degrees to be considered as a positive one.
(ADXSLOPE) ADX minimum steepness exit {45}: ADX slope needs to be -45 degrees to be considered as a negative one.
(ADXSLOPE) ADX steepness periods {3}: In order to avoid false detection the slope is calculated along 3 periods.
____ SETTINGS - Next to EMA55
(NEXTEMA55) EMA10 to EMA55 bounce back percentage {80}: EMA10 might bounce back to EMA55 or maybe to 80% of its complete way to EMA55
(NEXTEMA55) Next to EMA55 percentage {15}: How much next to the EMA55 you need to be to consider it's going to bounce back upwards again.
____ SETTINGS - Stop Loss and Take Profit
You can set a default stop loss or a default take profit.
(STOPTAKE) Stop Loss % {7.0}
(STOPTAKE) Take Profit % {2.0}
____ SETTINGS - Trailing Take Profit
You can customize the default trailing take profit values
(TRAILING) Trailing Take Profit (%) {1.0}: Trailing take profit offset in percentage
(TRAILING) Trailing Take Profit Trigger (%) {2.0}: When 2.0% of benefit is reached then activate the trailing take profit.
____ SETTINGS - MAIN TURN ON/OFF OPTIONS
(EMAS) Ignore advice based on emas {false}.
(EMAS) Ignore advice based on emas (On closing long signal) {False}: Ignore advice based on emas but only when deciding to close a buy entry.
(SQZMOM) Ignore advice based on SQZMOM {false}: Ignores advice based on SQZMOM indicator.
(ADXSLOPE) Ignore advice based on ADX positive slope {false}
(ADXSLOPE) Ignore advice based on ADX cut (23) {true}
(STOPTAKE) Take Profit? {false}: Enables simple Take Profit.
(STOPTAKE) Stop Loss? {True}: Enables simple Stop Loss.
(TRAILING) Enable Trailing Take Profit (%) {True}: Enables Trailing Take Profit.
____ SETTINGS - Strategy mode
(STRAT) Type Strategy: 'Long and Short', 'Long Only' or 'Short Only'. Default: 'Long and Short'.
____ SETTINGS - Risk Management
(RISKM) Risk Management Type: 'Safe', 'Somewhat safe compound' or 'Unsafe compound'. ' Safe ': Calculations are always done with the initial capital (1000) in mind. The maximum losses per trade/day/week/month are taken into account. ' Somewhat safe compound ': Calculations are done with initial capital (1000) or a higher capital if it increases. The maximum losses per trade/day/week/month are taken into account. ' Unsafe compound ': In each order all the current capital is gambled and only the default stop loss per order is taken into account. That means that the maximum losses per trade/day/week/month are not taken into account. Default : 'Somewhat safe compound'.
(RISKM) Maximum loss per trade % {1.0}.
(RISKM) Maximum loss per day % {6.0}.
(RISKM) Maximum loss per week % {8.0}.
(RISKM) Maximum loss per month % {10.0}.
____ SETTINGS - Decimals
(DECIMAL) Maximum number of decimal for contracts {3}: How small (3 decimals means 0.001) an entry position might be in your exchange.
EXTRA 1 - PRICE IS IN RANGE indicator
(PRANGE) Print price is in range {False}: Enable a bottom label that indicates if the price is in range or not.
(PRANGE) Price range periods {5}: How many previous periods are used to calculate the medians
(PRANGE) Price range maximum desviation (%) {0.6} ( > 0 ): Maximum positive desviation for range detection
(PRANGE) Price range minimum desviation (%) {0.6} ( > 0 ): Mininum negative desviation for range detection
EXTRA 2 - SQUEEZE MOMENTUM Desviation indicator
(SQZDIVER) Show degrees {False}: Show degrees of each Squeeze Momentum Divergence lines to the x-axis.
(SQZDIVER) Show desviation labels {False}: Whether to show or not desviation labels for the Squeeze Momentum Divergences.
(SQZDIVER) Show desviation lines {False}: Whether to show or not desviation lines for the Squeeze Momentum Divergences.
EXTRA 3 - VOLUME PROFILE indicator
WARNING: This indicator works not on current bar but on previous bar. So in the worst case it might be VP from 4 hours ago. Don't worry, inside the strategy calculus the correct values are used. It's just that I cannot show the most recent one in the chart.
(VP) Print recent profile {False}: Show Volume Profile indicator
(VP) Avoid label price overlaps {False}: Avoid label prices to overlap on the chart.
EXTRA 4 - ZIGNALY SUPPORT
(ZIG) Zignaly Alert Type {Email}: 'Email', 'Webhook'. ' Email ': Prepare alert_message variable content to be compatible with zignaly expected email content format. ' Webhook ': Prepare alert_message variable content to be compatible with zignaly expected json content format.
EXTRA 5 - DEBUG
(DEBUG) Enable debug on order comments {False}: If set to true it prepares the order message to match the alert_message variable. It makes easier to debug what would have been sent by email or webhook on each of the times an order is triggered.
HOW TO USE THIS STRATEGY
BOT MODE: This is the default setting.
PROPER VOLUME PROFILE VIEWING: Click on this strategy settings. Properties tab. Make sure Recalculate 'each time the order was run' is turned off.
NEWBIE USER: (Check PROPER VOLUME PROFILE VIEWING above!) You might want to turn on the 'Print recent profile {False}' setting. Alternatively you can use my alternate realtime study: 'Resistances and supports based on simplified Volume Profile' but, be aware, it might consume one indicator.
ADVANCED USER 1: Turn on the 'Print price is in range {False}' setting and help us to debug this subindicator. Also help us to figure out how to include this value in the strategy.
ADVANCED USER 2: Turn on the all the (SQZDIVER) settings and help us to figure out how to include this value in the strategy.
ADVANCED USER 3: (Check PROPER VOLUME PROFILE VIEWING above!) Turn on the 'Print recent profile {False}' setting and report any problem with it.
JAIME MERINO: Just use the indicator as it comes by default. It should only show BUY signals, SELL signals and their associated closing signals. From time to time you might want to check 'ADVANCED USER 2' instructions to check that there's actually a divergence. Check also 'ADVANCED USER 1' instructions for your amusement.
EXTRA ADVICE
It's advised that you use this strategy in addition to these two other indicators:
* Squeeze Momentum Indicator
* ADX
so that your chart matches as close as possible to TradingLatino chart.
ZIGNALY INTEGRATION
This strategy supports Zignaly email integration by default. It also supports Zignaly Webhook integration.
ZIGNALY INTEGRATION - Email integration example
What you would write in your alert message:
||{{strategy.order.alert_message}}||key=MYSECRETKEY||
ZIGNALY INTEGRATION - Webhook integration example
What you would write in your alert message:
{ {{strategy.order.alert_message}} , "key" : "MYSECRETKEY" }
CREDITS
I have reused and adapted some code from
'Directional Movement Index + ADX & Keylevel Support' study
which it's from TradingView console user.
I have reused and adapted some code from
'3ema' study
which it's from TradingView hunganhnguyen1193 user.
I have reused and adapted some code from
'Squeeze Momentum Indicator ' study
which it's from TradingView LazyBear user.
I have reused and adapted some code from
'Strategy Tester EMA-SMA-RSI-MACD' study
which it's from TradingView fikira user.
I have reused and adapted some code from
'Support Resistance MTF' study
which it's from TradingView LonesomeTheBlue user.
I have reused and adapted some code from
'TF Segmented Linear Regression' study
which it's from TradingView alexgrover user.
I have reused and adapted some code from
"Poor man's volume profile" study
which it's from TradingView IldarAkhmetgaleev user.
FEEDBACK
Please check the strategy source code for more detailed information
where, among others, I explain all of the substrats
and if they are implemented or not.
Q1. Did I understand wrong any of the Jaime substrats (which I have implemented)?
Q2. The strategy yields quite profit when we should long (EMA10 from 1d timeframe is higher than EMA55 from 1d timeframe.
Why the strategy yields much less profit when we should short (EMA10 from 1d timeframe is lower than EMA55 from 1d timeframe)?
Any idea if you need to do something else rather than just reverse what Jaime does when longing?
FREQUENTLY ASKED QUESTIONS
FAQ1. Why are you giving this strategy for free?
TradingLatino and his fellow enthusiasts taught me this strategy. Now I'm giving back to them.
FAQ2. Seriously! Why are you giving this strategy for free?
I'm confident his strategy might be improved a lot. By keeping it to myself I would avoid other people contributions to improve it.
Now that everyone can contribute this is a win-win.
FAQ3. How can I connect this strategy to my Exchange account?
It seems that you can attach alerts to strategies.
You might want to combine it with a paying account which enable Webhook URLs to work.
I don't know how all of this works right now so I cannot give you advice on it.
You will have to do your own research on this subject. But, be careful. Automating trades, if not done properly,
might end on you automating losses.
FAQ4. I have just found that this strategy by default gives more than 3.97% of 'maximum series of losses'. That's unacceptable according to my risk management policy.
You might want to reduce default stop loss setting from 7% to something like 5% till you are ok with the 'maximum series of losses'.
FAQ5. Where can I learn more about your work on this strategy?
Check the source code. You might find unused strategies. Either because there's not a substantial increases on earnings. Or maybe because they have not been implemented yet.
FAQ6. How much leverage is applied in this strategy?
No leverage.
FAQ7. Any difference with original Jaime Merino strategy?
Most of the times Jaime defines an stop loss at the price entry. That's not the case here. The default stop loss is 7% (but, don't be confused it only means losing 1% of your investment thanks to risk management). There's also a trailing take profit that triggers at 2% profit with a 1% trailing.
FAQ8. Why this strategy return is so small?
The strategy should be improved a lot. And, well, backtesting in this platform is not guaranteed to return theoric results comparable to real-life returns. That's why I'm personally forward testing this strategy to verify it.
MENSAJE EN CASTELLANO
En primer lugar se agradece feedback para mejorar la estrategia.
Si eres un usuario avanzado y quieres colaborar en mejorar el script no dudes en comentar abajo.
Ten en cuenta que aunque toda esta descripción tenga que estar en inglés no es obligatorio que el comentario esté en inglés.
CHISTE - CASTELLANO
¡Pero Jaime!
¡400.000!
¡Tu da mun!

NIFTY_2min_FVG_sell_StrategyThis strategy is designed for scalping Nifty on a 2-minute chart, focusing exclusively on short entries. The script's purpose is to identify and act on specific bearish patterns based on volume analysis and price action.
Concept & Core Logic
The strategy operates on a two-stage confirmation process:
Volume Absorption: The initial condition seeks to identify potential bearish movements by detecting signs of buying pressure being absorbed by sellers. This suggests that a upward move may be losing momentum.
Fair Value Gap (FVG) Confirmation: After a volume absorption signal, the strategy waits for a Bearish Fair Value Gap (FVG) to appear. A short entry signal is generated only after a candle closes below the FVG zone, serving as confirmation of bearish intent.
Risk Management
The strategy employs a fixed take profit and stop loss for each trade, based on the Nifty underlying price:
Take Profit: The exit signal is triggered when a trade reaches a 30-point profit.
Stop Loss: The exit signal is triggered when a trade reaches a 35-point loss.
Intended Use
This tool is intended for traders who:
Utilize mechanical, rule-based systems for intraday trading and scalping.
Are interested in studying a structured approach that combines volume analysis with price action inefficiencies like Fair Value Gaps.

DAX-30 ATRXVersion 1 of DAX-30 ATRX algo.
Revised versions may be available in future.
To be used on the 45 minute timeframe only.
Algorithm is also profitable on the NAS100 - but use with caution.
Optimized Settings:
Higher-TF for trend bias - 4 hours
HTF EMA length - 5
Min HA body size (pts) - 0.5
RSI length - 14
RSI threshold for longs - 40
Fisher length - 11
Volume MA length - 20
Volume spike multiplier - 1.2
ATR length - 14
ATR-mean length - 80
Min ATR / ATR_mean multiplier - 0.8
Max ATR / ATR_mean multiplier - 2.5
SL = ATR x - 0.9
TP = ATR x - 2.1
NY Session ON
Max trades per day - 1

Crypto Scalping Strategy by SAIFOverview
An optimized scalping strategy designed for cryptocurrency markets, focusing on breakout opportunities with strict risk controls and optional safe compounding features. This strategy combines price action, volume analysis, and multi-timeframe trend confirmation.
Key Features
Breakout Detection System
Identifies significant price breakouts using dynamic channel analysis
Confirms breakouts with volume surge validation
Filters trades based on multi-timeframe trend alignment
Multi-Timeframe Trend Confirmation
Analyzes 1-hour and 4-hour timeframes for trend direction
Only takes trades aligned with higher timeframe trends
Uses long-term moving averages for trend validation
Advanced Risk Management
Conservative default risk: 1% per trade
ATR-based stop-loss placement (2x ATR)
Trailing stop mechanism to protect profits
Minimum profit target before trailing activates
Built-in position sizing based on account equity
Safe Capital Management Options
Fixed Capital Mode: Trade with consistent position sizes
Safe Compounding Mode: Gradually scales position size based on realized profits only
Drawdown Protection: 80% equity floor prevents excessive capital erosion
Leverage Control: 10x leverage factored into position calculations
Technical Filters
Momentum confirmation via oscillator conditions
Directional movement analysis
Volume threshold requirements
Trend strength validation
Position Sizing
The strategy automatically calculates position sizes based on:
Your specified risk percentage
Current ATR volatility
Available leverage
Account equity (with optional compounding)
Trade Management
Entry: Executes on confirmed breakouts with volume and trend alignment
Stop Loss: Placed at 2x ATR from entry
Take Profit: Uses trailing stops that activate after minimum profit threshold
Exit: Automatically managed through strategy exits
Customization Options
Adjustable channel length for breakout detection
Configurable volume multiplier for surge detection
Customizable oscillator thresholds
Flexible ATR period for volatility measurement
Optional compounding vs. fixed capital modes
Adjustable trailing stop parameters
Visual Features
Channel boundaries plotted on chart
Entry signals marked with arrows
Background coloring indicates trend direction
Real-time info table shows:
Current risk level
Compounding status
Capital values
Drawdown protection status
Alert Capabilities
Built-in alert conditions for:
Buy signals (breakout opportunities)
Sell signals (breakdown opportunities)
Important Disclaimers
⚠️ Educational Purpose Only: This strategy is provided for educational and research purposes. It is not investment advice.
⚠️ High-Risk Trading: Scalping and leverage trading carry substantial risk of loss. Cryptocurrency markets are highly volatile.
⚠️ Not Financial Advice: This tool does not constitute financial, investment, or trading advice. Always conduct your own research and consult qualified professionals.
⚠️ Leverage Warning: This strategy uses 10x leverage, which can amplify both gains and losses significantly.
⚠️ Backtesting Limitations: Past performance does not guarantee future results. Real trading involves slippage, execution delays, and emotional factors not present in backtesting.
⚠️ Capital at Risk: Only trade with capital you can afford to lose completely. Never trade with borrowed money or funds needed for living expenses.
Commission & Fees
Commission: 0.13% per trade
Initial capital: $100 (default)
Commission costs are factored into backtest results
Best Practices
Start Small: Begin with minimum capital and conservative risk settings
Test Thoroughly: Backtest across different market conditions and timeframes
Monitor Performance: Track win rate, profit factor, and maximum drawdown
Adjust Parameters: Optimize settings for your specific trading pairs
Use Alerts: Set up notifications to avoid missing opportunities
Manage Emotions: Follow the strategy rules consistently without override
Recommended Markets
High liquidity cryptocurrency pairs (BTC, ETH major pairs)
Assets with clear trending behavior
Markets with sufficient volume for scalping
Timeframes: 1H to 4H charts recommended
Risk Reminder
Scalping requires:
Quick decision-making
Tight risk management
Consistent discipline
Understanding of market microstructure
Proper capitalization
Always practice proper risk management. The strategy includes safety features, but no system can eliminate trading risk entirely. Trade responsibly.

Sniper Perfect: Institutional Flow & Adaptive Risk ProtocolOverview Sniper Perfect is an advanced trend-following system designed to filter out "fakeouts" and institutional traps using a multi-layered verification protocol. It combines Volume Flow (VFI), Volatility (CHOP), and Momentum (RSI) to ensure entry only occurs in high-probability setups.
Key Features
🛡️ The Triple Filter Protocol
Strict Choppiness Filter: Uses a strict CHOP threshold (40). If the market is moving sideways, the algorithm locks all new entries to prevent whipsaws.
RSI Extremes Protection: Prevents FOMO buying at tops (Overbought > 70) and panic selling at bottoms (Oversold < 30).
Conflict Zone Detection: Identifies divergence between Price action and Money Flow. If price rises but institutional money exits, the background turns Gray and trading is disabled.
🔒 Adaptive Risk Management
Heat-Breathing Stop Loss: The SL distance adjusts dynamically based on market Volume and Volatility ("Heat").
Ratchet Mechanism: A mechanical lock ensures the Stop Loss can ONLY move in the direction of profit. It never loosens, guaranteeing that paper profits are protected.
📊 Live Dashboard A real-time panel in the bottom-right corner displays:
VFI Flow: Positive/Negative money flow.
Market Status: Active vs. Locked (Choppy).
RSI Status: Neutral, Overbought, or Oversold.
Visual Guide
🟢 Lime Zone: Clean Bullish Trend.
🔴 Red Zone: Clean Bearish Trend.
🟠 Orange Zone: High Choppiness (Stay Out).
🟣 'X' Marker: Exact price where the Stop Loss was triggered.
Disclaimer: For educational and research purposes only. Always manage your risk.

Sniper PerfectOverview Sniper Perfect is an advanced trend-following system designed to filter out "fakeouts" and institutional traps using a multi-layered verification protocol. It combines Volume Flow (VFI), Volatility (CHOP), and Momentum (RSI) to ensure entry only occurs in high-probability setups.
Key Features
🛡️ The Triple Filter Protocol
Strict Choppiness Filter: Uses a strict CHOP threshold (40). If the market is moving sideways, the algorithm locks all new entries to prevent whipsaws.
RSI Extremes Protection: Prevents FOMO buying at tops (Overbought > 70) and panic selling at bottoms (Oversold < 30).
Conflict Zone Detection: Identifies divergence between Price action and Money Flow. If price rises but institutional money exits, the background turns Gray and trading is disabled.
🔒 Adaptive Risk Management
Heat-Breathing Stop Loss: The SL distance adjusts dynamically based on market Volume and Volatility ("Heat").
Ratchet Mechanism: A mechanical lock ensures the Stop Loss can ONLY move in the direction of profit. It never loosens, guaranteeing that paper profits are protected.
📊 Live Dashboard A real-time panel in the bottom-right corner displays:
VFI Flow: Positive/Negative money flow.
Market Status: Active vs. Locked (Choppy).
RSI Status: Neutral, Overbought, or Oversold.
Visual Guide
🟢 Lime Zone: Clean Bullish Trend.
🔴 Red Zone: Clean Bearish Trend.
🟠 Orange Zone: High Choppiness (Stay Out).
🟣 'X' Marker: Exact price where the Stop Loss was triggered.
Disclaimer: For educational and research purposes only. Always manage your risk.

The Truth Sniper: Breathing Edition**Overview**
This is a highly advanced trend-following strategy designed to filter out market noise ("Fakeouts") and manage risk using a dynamic "Breathing Ratchet" mechanism. It combines traditional trend analysis with institutional money flow logic to identify the true market direction.
**Key Features**
**1. The Conflict Zone (Gray Zone Filter)**
Most strategies fail during low-volume accumulation or distribution phases. This algorithm introduces a "Conflict Zone" logic:
* **True Rally (Green):** Price is above EMA50 AND Money Flow (VFI) is positive.
* **True Drop (Red):** Price is below EMA50 AND Money Flow (VFI) is negative.
* **Conflict (Gray Background):** When Price and Money Flow disagree (e.g., Price rising on negative volume), the background turns Gray. **Trading is disabled** in these zones to avoid bull/bear traps.
**2. Breathing Stop-Loss Mechanism (Volatility Adjusted)**
The Stop Loss isn't static. It "breathes" based on market heat (Volume/RSI):
* **High Heat (High Volatility):** The SL loosens its grip, moving towards the bottom of the Fibonacci zone to allow price fluctuation without premature exits.
* **Low Heat (Low Volatility):** The SL tightens aggressively towards the price to lock in profits during slow momentum.
**3. The Ratchet Lock (Slippage Prevention)**
To ensure maximum profit retention, the "Breathing" mechanism is governed by a **Ratchet Logic**:
* **For Longs:** The Stop Loss can ONLY move UP. If the "Breathing" calculation suggests lowering the stop (due to increased volatility), the Ratchet blocks it, keeping the SL at the highest historical level.
* **For Shorts:** The Stop Loss can ONLY move DOWN.
**4. Fibonacci Exit Zones**
Exits are calculated based on a 60-day dynamic High/Low lookback, creating "Zones" (0-23.6%, 23.6-38.2%, etc.) that the price must conquer. The SL trails these zones mechanically.
**Visual Guide**
* **Lime/Red Background:** Active Trade Zone (Confirmed Trend).
* **Gray Background:** Conflict Zone (Stay Out / Hold).
* **Purple 'X':** The exact price level where the Stop Loss was hit (Fixed marker).
* **Stepline:** The active Stop Loss level (Visible only during open trades).
**Disclaimer**
This script is for educational and research purposes only. Always manage your risk.

Trend Signal MomentumOVERVIEW
Signal Trend Momentum is a hybrid strategy that combines multiple confirmations and filters to obtain better potential trading signals. Each confirmation and filter in Signal Trend Momentum aims to avoid possible false and trap signals.
HYBRID CONCEPTS
Smart Money Concept – This indicator forms market structure and Bullish & Bearish Order Block areas to make it easier to identify market trends and strong areas where price reversals often occur. Its purpose is to simplify recognizing market direction and serve as the first confirmation.
MSS + BOS (Market Structure Shift + Break of Structure) – This indicator serves as additional confirmation for the Smart Money Concept. With the presence of two types of market structure, the market trend direction becomes clearer and more convincing.
RSI Momentum Signal – This indicator becomes the third confirmation. When the Market Trend is clear and convincing, supported by the formation of Bearish and Bullish Order Blocks, the role of the Momentum Signal here becomes crucial as it provides trend momentum based on overbought and oversold areas.
Momentum Position – This indicator becomes the next confirmation based on buyer and seller VOLUME in the market. If buyer volume is higher, the momentum position will be depicted on the chart with an upward arrow, and conversely, if seller volume is higher, it will be depicted with a downward arrow.
SnR (Support and Resistance) – This final indicator is Support and Resistance, which will serve as the last and more convincing confirmation. Support and Resistance will strengthen the Order Block areas formed by the Smart Money Concept indicator. A Bullish Order Block + Support creates a higher possibility for an upward trend in the market, conversely, a Bearish Order Block + Resistance creates a higher possibility for a downward trend in the market.
The combination of these several indicators will provide a strong market direction + persistent buyer and seller areas, as well as depict momentum based on volume + RSI which serve as additional confirmations.
These additional confirmations will produce stronger signals and help avoid false and trap signals in the market.
HOW TO USE
A SHORT SIGNAL will be strong if there is a Downtrend Market Structure + Bearish Order Block + Resistance + Oversold RSI Momentum + Strong Seller Volume Momentum.
A LONG SIGNAL will be strong if there is an Uptrend Market Structure + Bullish Order Block + Support + Overbought RSI Momentum + Strong Buyer Volume Momentum.
CONCLUSION
Signal Trend Momentum is a combination of several powerful indicators designed to produce stronger, clearer, and easier-to-read signals.
This strategy is highly suitable for traders seeking more convincing trade signals based on multiple confirmations from the combined indicators, thereby creating a strong signal with a higher probability.

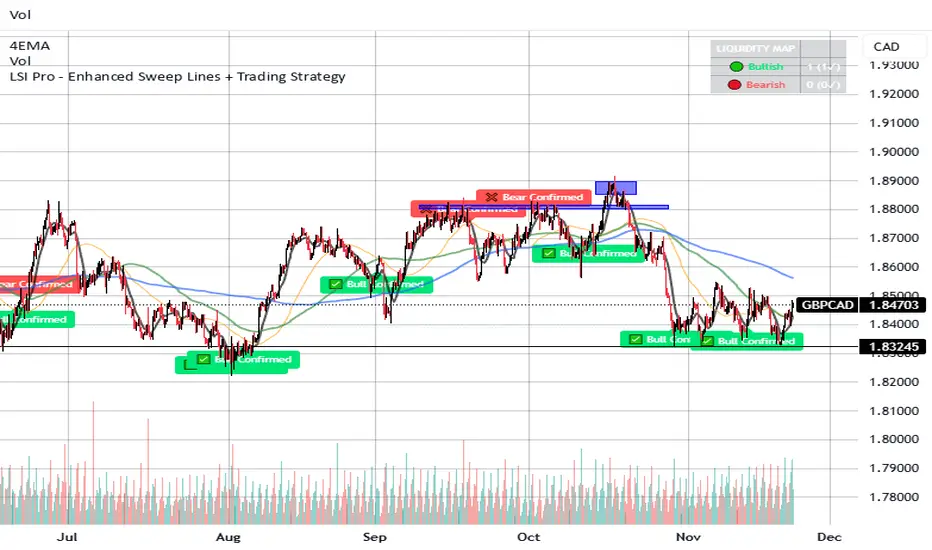
LSI Pro - Enhanced Sweep Lines + Trading StrategyThis is a very powerful and sensitive indicator, it embrace the institutional sweep, signaling the high volumes area with the liquidity areas and levels with bear or bull confirmations.
and more ...
It works very good with most instruments such crypto - forex and stocks.
write me to get access.
The Butterfly Elephant EffectStrategy Overview: The Butterfly Elephant Effect
Concept & Philosophy:
Welcome to "The Butterfly Elephant Effect," a sophisticated multi-indicator strategy that operates on the principle that small, precise technical signals (the Butterfly) can trigger significant market moves (the Elephant Effect). This strategy is designed to identify high-probability reversal points by combining three powerful analytical systems into one cohesive framework. It seeks to catch major trend reversals at key support and resistance levels, using a confluence of volume, momentum, and overbought/oversold oscillators.
Core Components:
The strategy intelligently synthesizes three distinct systems:
Lucky Balls System (Volume & Trend):
Utilizes the Negative Volume Index (NVI) and Positive Volume Index (PVI) to understand smart money activity and trend strength.
Plots these indices on the price chart, scaled to the recent price range for actionable signals.
Generates signals when price interacts with a moving average envelope, identifying potential exhaustion points.
Momentum Confirmation System:
Combines RSI, CCI, and PPO momentum oscillators into a single, refined line.
This "Momentum Composite" line is used to confirm the strength of a reversal signal as it crosses the dynamic envelope bands.
Lucky Table System (Market Breadth & Confluence):
This is the heart of the strategy's filtering mechanism. It runs 36 different oscillator readings across 6 different timeframes for Stochastic, Williams %R, RSI, and MACD.
It counts the number of these oscillators that are in extreme overbought or oversold territory.
A "Lucky Table" signal is generated when the number of matching oscillators exceeds your customizable threshold (e.g., 30 out of 36), indicating a massive, multi-timeframe consensus on market exhaustion.
The Ultimate Signals:
The strategy's most powerful entries are the specially named signals that require a perfect storm of conditions:
🐘 Elephant Long Signal: Triggers when the Momentum System gives a buy, the Lucky Table shows extreme oversold consensus, AND the price is at or below the adjusted lower envelope band. This represents a potential major bullish reversal from a support zone.
🦋 Butterfly Short Signal: Triggers when the Momentum System gives a sell, the Lucky Table shows extreme overbought consensus, AND the price is at or above the adjusted upper envelope band. This represents a potential major bearish reversal from a resistance zone.
Key Features:
Visual Clarity: A rich set of plotshapes (🪜, 🐍, 🐸, ✈️, ⚽) makes it easy to identify the contributing signals from each subsystem on the chart.
Comprehensive Dashboard: A real-time table displays all 36 oscillator values from the Lucky Table, color-coded for quick assessment of market conditions.
Flexible Risk Management: Includes optional Profit Target and Stop Loss based on a percentage of entry price.
Highly Customizable: Every parameter—from lookback lengths and scale factors to the crucial match threshold—can be adjusted to fit your trading style and instrument.
How to Use:
Add the strategy to your chart.
Look for the primary Elephant (🐘) or Butterfly (🦋) signals near the envelope boundaries.
Use the Lucky Table on the top-right to confirm the strength of the oversold/overbought conditions.
Manage your trade using the built-in PT/SL or your own discretion.
Ideal For: Swing traders and position traders looking for high-conviction entries at potential market turning points.
Disclaimer: This is a complex strategy designed for educational and research purposes. Always test and forward-test any strategy in a simulated environment before committing real capital. Past performance is not indicative of future results.
PS Look out for the Frog :-)

nOI + Funding + CVD • strategynOI + Funding + CVD Strategy
Overview
This strategy is designed for cryptocurrency trading on platforms like TradingView, focusing on perpetual futures markets. It combines three key indicators—Normalized Open Interest (nOI), Funding Rate, and Cumulative Volume Delta (CVD)—to generate buy and sell signals for long and short positions. The strategy aims to capitalize on market imbalances, such as overextended open interest, funding rate extremes, and volume deltas, which often signal potential reversals or continuations in trending markets.
The script supports pyramiding (up to 10 positions), uses percentage-based position sizing (default 10% of equity per trade), and allows customization of trade directions (longs and shorts can be enabled/disabled independently). It includes multiple signal systems for entries, various exit mechanisms (including stop-loss, take-profit, time-based exits, and conditional closes based on indicators), a Martingale add-on system for averaging positions during drawdowns, and handling of opposite signals (ignore, close, or reverse).
This strategy is not financial advice; backtest thoroughly and use at your own risk. It requires data sources for Open Interest (OI) and Funding Rates, which are fetched via TradingView's security functions (e.g., from Binance for funding premiums).
Key Indicators
1. Normalized Open Interest (nOI)
Group: Open Interest
Purpose: Measures the relative level of open interest over a lookback window to identify overbought (high OI) or oversold (low OI) conditions, which can indicate potential exhaustion in trends.
Calculation:
Fetches OI data (close) from the symbol's standard ticker (e.g., "{symbol}_OI").
Normalizes OI within a user-defined window (default: 500 bars) using min-max scaling: (OI - min_OI) / (max_OI - min_OI) * 100.
Upper threshold (default: 70%): Signals potential short opportunities when crossed from above.
Lower threshold (default: 30%): Signals potential long opportunities when crossed from below.
Visualization: Plotted as a line (teal above upper, red below lower, gray in between). Horizontal lines at upper, mid (50%), lower, and a separator at 102%.
Notes: Handles non-crypto symbols by adjusting timeframe to daily if intraday. Errors if no OI data available.
2. Funding Rate
Group: Funding Rate
Purpose: Tracks the average funding rate (premium index) to detect market sentiment extremes. Positive funding suggests bull bias (longs pay shorts), negative suggests bear bias.
Calculation:
Fetches premium index data from Binance (e.g., "binance:{base}usdt_premium").
Supports lower timeframe aggregation (default: enabled, using 1-min TF) for smoother data.
Averages open and close premiums, clamps values, and scales/shifts for plotting (base: 150, scale: 1000x).
Upper threshold (default: 1.0%): Overheat for shorts.
Lower threshold (default: 1.0%): Overcool for longs.
Ultra level (default: 1.8%): Extreme for additional short signals.
Smoothing: Uses inverse weighted moving average (IWMA) or lower-TF aggregation to reduce noise.
Visualization: Shifted plot (green positive, red negative) with filled areas. Horizontal lines for overheat, overcool, base (0%), and ultra.
Notes: Custom ticker option for non-standard symbols.
3. Cumulative Volume Delta (CVD)
Group: CVD (Cumulative Volume Delta)
Purpose: Measures net buying/selling pressure via volume delta, normalized to identify divergences or confirmations with price.
Calculation:
Delta: +volume if close > open, -volume if close < open.
Cumulative: Rolling cumsum over a window (default: 500 bars), smoothed with EMA (default: 20).
Normalized: Scaled by absolute max in window (-1 to 1 range).
Scaled/shifted for plotting (base: 300 or 0 if anchored, scale: 120x).
Upper threshold (default: 1.0%): Over for shorts.
Lower threshold (default: 1.0%): Under for longs.
Visualization: Shifted plot (aqua positive, purple negative) with filled areas. Horizontal lines for over, under, and separator (default: 252).
Filter Options (for Signal A):
Enable filter (default: false).
Require sign match (Long ≥0, Short ≤0).
Require extreme zones.
Require momentum (rising/falling over N bars, default: 3).
Signal Logics for Entries
Entries are triggered by buy/sell signals from multiple systems (A, B, C, D), filtered by direction toggles and entry conditions.
Signal System A: OI + Funding (with optional CVD filter)
Enabled: Default true.
Sell (Short): nOI > upper threshold, falling over N bars (default: 3), delta ≥ threshold (default: 3%), funding > overheat, and CVD filter OK.
Buy (Long): nOI < lower threshold, rising over N bars (default: 3), delta ≥ threshold (default: 3%), funding < overcool, and CVD filter OK.
Signal System B: Short - Funding Crossunder + Filters
Enabled: Default true.
Sell (Short): Funding crosses under overheat level, optional: CVD > over, nOI < upper.
Signal System C: Short - Ultra Funding
Enabled: Default false.
Sell (Short): Funding crosses ultra level (up or down, both default true).
Signal System D: Long - Funding Crossover + Filters
Enabled: Default true.
Buy (Long): Funding crosses over overcool level, optional: CVD < under, nOI > lower.
Combined: Sell if A/B/C active; Buy if A/D active.
Entry Filters
Cooldown: Optional pause between entries (default: false, 3 bars).
Max Entries: Limit pyramiding (default: true, 6 max).
Entries only if both filters pass and direction allowed.
Opposite Signal Handling
Mode: Ignore (default), Reverse (close and enter opposite), or Close (exit only).
Processed before regular entries.
Position Management
Martingale (3 Steps):
Enabled per step (default: all true).
Triggers add-ons at loss levels (defaults: 5%, 8%, 11%) by adding % to position (default: 100% each).
Resets on position close.
Break Even:
Enabled (default: true).
Activates at profit threshold (default: 5%), sets SL better by offset (default: 0.1%).
Exit Systems
Multiple exits checked in sequence.
Exit 1: SL/TP
Enabled: Separate for long/short (default: true).
SL: % from avg price (defaults: 1% long/short).
TP: % from avg price (defaults: 2% long/short).
Exit 2: Funding
Enabled: Separate for long (up) / short (down) (default: true).
Long Exit: Funding > upper exit threshold (default: 0.8%).
Short Exit: Funding < lower exit threshold (default: 0.8%).
Exit 3: nOI
Enabled: Separate for long (up) / short (down) (default: true).
Long Exit: nOI > upper exit (default: 85%).
Short Exit: nOI < lower exit (default: 15%).
Exit 4: Global SL
Enabled: Default true.
Exit: If position loss ≥ % (default: 7%).
Exit 5: Break Even (integrated in position block)
Exit 6: Time Limit
Enabled: Separate for long/short (default: true).
Exit: After N bars in trade (defaults: 30 each).
Timer updates on add-ons if enabled (default: true).
Visual Elements
Buy/Sell Labels: Small labels ("BUY"/"SELL") on bars with signals, limited to last 30.
All indicators plotted on a separate pane (overlay=false).
Usage Notes
Backtesting: Adjust parameters based on asset/timeframe. Test on historical data.
Data Requirements: Works best on crypto perps with OI and funding data.
Risk Management: Incorporates SL/TP and global SL; monitor drawdowns with Martingale.
Customization: All thresholds, enables, and scales are inputs for fine-tuning.
Version: Pine Script v6.
For questions or improvements, contact the author. Happy trading!

MA Break Trend Strategy - Multi Stop MethodsThis is a trend-following trading strategy with multiple stop loss options for both long and short positions.
Entry Signal: Trades are triggered when price crosses above (long) or below (short) a configurable moving average (EMA or SMA, default 200-period)
Volume Confirmation: Optional filter requiring volume to exceed a multiplier (default 1.5x) of the 20-period volume average before entering trades
Five Stop Loss Methods:
- ATR-based: Dynamic stop using Average True Range multiplier below/above entry price
- MA Buffer: Stop set at a percentage offset from a separate moving average (default 50-period EMA)
- Donchian Channel: Uses the lowest low/highest high over a specified lookback period
- Keltner Channel: ATR-based bands around an EMA basis
- Lowest Low/Highest High: Simple swing point stops based on recent price extremes
- Trailing Stops: All stop methods automatically trail in the profitable direction (upward for longs, downward for shorts) to lock in gains while never moving against the position
Visual Indicators:
- Plots the trend-following moving average in blue
- Shows active stop loss levels in red when in a position
- Displays reference lines for all stop types when flat
- Entry signals marked with triangles (green up for long, red down for short)
- Background highlighting for volume-confirmed crossovers
FluxVector Liquidity Universal Trendline FluxVector Liquidity Trendline FFTL
Summary in one paragraph
FFTL is a single adaptive trendline for stocks ETFs FX crypto and indices on one minute to daily. It fires only when price action pressure and volatility curvature align. It is original because it fuses a directional liquidity pulse from candle geometry and normalized volume with realized volatility curvature and an impact efficiency term to modulate a Kalman like state without ATR VWAP or moving averages. Add it to a clean chart and use the colored line plus alerts. Shapes can move while a bar is open and settle on close. For conservative alerts select on bar close.
Scope and intent
• Markets. Major FX pairs index futures large cap equities liquid crypto top ETFs
• Timeframes. One minute to daily
• Default demo used in the publication. SPY on 30min
• Purpose. Reduce false flips and chop by gating the line reaction to noise and by using a one bar projection
• Limits. This is a strategy. Orders are simulated on standard candles only
Originality and usefulness
• Unique fusion. Directional Liquidity Pulse plus Volatility Curvature plus Impact Efficiency drives an adaptive gain for a one dimensional state
• Failure mode addressed. One or two shock candles that break ordinary trendlines and saw chop in flat regimes
• Testability. All windows and gains are inputs
• Portable yardstick. Returns use natural log units and range is bar high minus low
• Protected scripts. Not used. Method disclosed plainly here
Method overview in plain language
Base measures
• Return basis. Natural log of close over prior close. Average absolute return over a window is a unit of motion
Components
• Directional Liquidity Pulse DLP. Measures signed participation from body and wick imbalance scaled by normalized volume and variance stabilized
• Volatility Curvature. Second difference of realized volatility from returns highlights expansion or compression
• Impact Efficiency. Price change per unit range and volume boosts gain during efficient moves
• Energy score. Z scores of the above form a single energy that controls the state gain
• One bar projection. Current slope extended by one bar for anticipatory checks
Fusion rule
Weighted sum inside the energy score then logistic mapping to a gain between k min and k max. The state updates toward price plus a small flow push.
Signal rule
• Long suggestion and order when close is below trend and the one bar projection is above the trend
• Short suggestion and flip when close is above trend and the one bar projection is below the trend
• WAIT is implicit when neither condition holds
• In position states end on the opposite condition
What you will see on the chart
• Colored trendline teal for rising red for falling gray for flat
• Optional projection line one bar ahead
• Optional background can be enabled in code
• Alerts on price cross and on slope flips
Inputs with guidance
Setup
• Price source. Close by default
Logic
• Flow window. Typical range 20 to 80. Higher smooths the pulse and reduces flips
• Vol window. Typical range 30 to 120. Higher calms curvature
• Energy window. Typical range 20 to 80. Higher slows regime changes
• Min gain and Max gain. Raise max to react faster. Raise min to keep momentum in chop
UI
• Show 1 bar projection. Colors for up down flat
Properties visible in this publication
• Initial capital 25000
• Base currency USD
• Commission percent 0.03
• Slippage 5
• Default order size method percent of equity value 3%
• Pyramiding 0
• Process orders on close off
• Calc on every tick off
• Recalculate after order is filled off
Realism and responsible publication
• No performance claims
• Intrabar reminder. Shapes can move while a bar forms and settle on close
• Strategy uses standard candles only
Honest limitations and failure modes
• Sudden gaps and thin liquidity can still produce fast flips
• Very quiet regimes reduce contrast. Use larger windows and lower max gain
• Session time uses the exchange time of the chart if you enable any windows later
• Past results never guarantee future outcomes
Open source reuse and credits
• None

Batman Strategy v1
1. Overview & Core Concept
The "Batman Strategy V1" is a comprehensive trend-following and pyramid-trading framework designed for multiple asset classes. Its core concept is to identify strong, established trends and systematically enter positions in stages (pyramiding) to maximize gains during sustained market movements.
This strategy is built on a proprietary scoring system that synthesizes multiple market dimensions—including stage analysis, relative strength, and volume dynamics—into clear, actionable signals. It is not a simple indicator mashup; it's a complete system with defined entry, exit, and risk management protocols.
2. Key Features
Proprietary Trend Scoring: The strategy grades market conditions from 'A' (strong bull trend) to 'Z' (strong bear trend) using a unique combination of ADX and RSI calculations, providing a nuanced view of trend maturity and strength.
Advanced Relative Strength Analysis: Automatically compares the asset's performance against a relevant market index (e.g., NIFTY for Indian stocks, NDX for US stocks, or a total crypto market cap for crypto) to ensure it is a market leader.
Heikin-Ashi Based Logic: Utilizes Heikin-Ashi candles for its core calculations to filter out market noise and provide smoother trend signals.
Multi-Tranche Pyramiding: The strategy is designed to enter a position with an initial tranche and add up to four subsequent positions if the trend continues favorably, based on a proprietary breakout logic (`ha_close > breakout`).
Dynamic & Multi-Option Exits: Offers three distinct, user-selectable trailing stop mechanisms for exits: SuperTrend, V-Stop, and Chandelier Exit. This allows traders to tailor the exit logic to their risk tolerance and the asset's volatility. The data source for these exits can also be switched between the standard chart and Heikin-Ashi candles.
Integrated Risk Management: Implements a sophisticated stop-loss system that adjusts based on the number of open trades, aiming to move to break-even after the third tranche and protecting capital.
3. How to Use This Strategy
Configuration: In the script settings, first set your desired backtesting date range. Then, configure the "Entry," "Tranching," and "Exit" parameters to suit your trading style. The most important choice is the "Exit Indicator," as this will define how the strategy closes trades.
Interpretation: When applied to a chart, the strategy will plot trend score labels ('A', 'B', 'C' for bullish; 'X', 'Y', 'Z' for bearish), color the background based on relative strength, and color the bars based on volume strength. Backtesting results, including all pyramided trades, will be visible in the "Strategy Tester" panel.
Alerts: The script includes built-in alert conditions for both bullish and bearish trend scores, which can be used to notify you of potential opportunities.
4. Backtesting & Performance
This is a strategy script, and its performance should be thoroughly evaluated in the Strategy Tester. As per TradingView rules, users should use realistic settings for initial capital, commission, and slippage. The default settings are a template; they should be adjusted to reflect the conditions of the market you are testing. Past performance is not indicative of future results.
5. Disclaimer
This strategy is a tool for market analysis and idea validation. It is not financial advice. All trading involves risk, and you should not risk more than you are prepared to lose. This is a closed-source, protected script; its internal calculations are proprietary.

BOCS Channel Scalper Strategy - Automated Mean Reversion System# BOCS Channel Scalper Strategy - Automated Mean Reversion System
## WHAT THIS STRATEGY DOES:
This is an automated mean reversion trading strategy that identifies consolidation channels through volatility analysis and executes scalp trades when price enters entry zones near channel boundaries. Unlike breakout strategies, this system assumes price will revert to the channel mean, taking profits as price bounces back from extremes. Position sizing is fully customizable with three methods: fixed contracts, percentage of equity, or fixed dollar amount. Stop losses are placed just outside channel boundaries with take profits calculated either as fixed points or as a percentage of channel range.
## KEY DIFFERENCE FROM ORIGINAL BOCS:
**This strategy is designed for traders seeking higher trade frequency.** The original BOCS indicator trades breakouts OUTSIDE channels, waiting for price to escape consolidation before entering. This scalper version trades mean reversion INSIDE channels, entering when price reaches channel extremes and betting on a bounce back to center. The result is significantly more trading opportunities:
- **Original BOCS**: 1-3 signals per channel (only on breakout)
- **Scalper Version**: 5-15+ signals per channel (every touch of entry zones)
- **Trade Style**: Mean reversion vs trend following
- **Hold Time**: Seconds to minutes vs minutes to hours
- **Best Markets**: Ranging/choppy conditions vs trending breakouts
This makes the scalper ideal for active day traders who want continuous opportunities within consolidation zones rather than waiting for breakout confirmation. However, increased trade frequency also means higher commission costs and requires tighter risk management.
## TECHNICAL METHODOLOGY:
### Price Normalization Process:
The strategy normalizes price data to create consistent volatility measurements across different instruments and price levels. It calculates the highest high and lowest low over a user-defined lookback period (default 100 bars). Current close price is normalized using: (close - lowest_low) / (highest_high - lowest_low), producing values between 0 and 1 for standardized volatility analysis.
### Volatility Detection:
A 14-period standard deviation is applied to the normalized price series to measure price deviation from the mean. Higher standard deviation values indicate volatility expansion; lower values indicate consolidation. The strategy uses ta.highestbars() and ta.lowestbars() to identify when volatility peaks and troughs occur over the detection period (default 14 bars).
### Channel Formation Logic:
When volatility crosses from a high level to a low level (ta.crossover(upper, lower)), a consolidation phase begins. The strategy tracks the highest and lowest prices during this period, which become the channel boundaries. Minimum duration of 10+ bars is required to filter out brief volatility spikes. Channels are rendered as box objects with defined upper and lower boundaries, with colored zones indicating entry areas.
### Entry Signal Generation:
The strategy uses immediate touch-based entry logic. Entry zones are defined as a percentage from channel edges (default 20%):
- **Long Entry Zone**: Bottom 20% of channel (bottomBound + channelRange × 0.2)
- **Short Entry Zone**: Top 20% of channel (topBound - channelRange × 0.2)
Long signals trigger when candle low touches or enters the long entry zone. Short signals trigger when candle high touches or enters the short entry zone. This captures mean reversion opportunities as price reaches channel extremes.
### Cooldown Filter:
An optional cooldown period (measured in bars) prevents signal spam by enforcing minimum spacing between consecutive signals. If cooldown is set to 3 bars, no new long signal will fire until 3 bars after the previous long signal. Long and short cooldowns are tracked independently, allowing both directions to signal within the same period.
### ATR Volatility Filter:
The strategy includes a multi-timeframe ATR filter to avoid trading during low-volatility conditions. Using request.security(), it fetches ATR values from a specified timeframe (e.g., 1-minute ATR while trading on 5-minute charts). The filter compares current ATR to a user-defined minimum threshold:
- If ATR ≥ threshold: Trading enabled
- If ATR < threshold: No signals fire
This prevents entries during dead zones where mean reversion is unreliable due to insufficient price movement.
### Take Profit Calculation:
Two TP methods are available:
**Fixed Points Mode**:
- Long TP = Entry + (TP_Ticks × syminfo.mintick)
- Short TP = Entry - (TP_Ticks × syminfo.mintick)
**Channel Percentage Mode**:
- Long TP = Entry + (ChannelRange × TP_Percent)
- Short TP = Entry - (ChannelRange × TP_Percent)
Default 50% targets the channel midline, a natural mean reversion target. Larger percentages aim for opposite channel edge.
### Stop Loss Placement:
Stop losses are placed just outside the channel boundary by a user-defined tick offset:
- Long SL = ChannelBottom - (SL_Offset_Ticks × syminfo.mintick)
- Short SL = ChannelTop + (SL_Offset_Ticks × syminfo.mintick)
This logic assumes channel breaks invalidate the mean reversion thesis. If price breaks through, the range is no longer valid and position exits.
### Trade Execution Logic:
When entry conditions are met (price in zone, cooldown satisfied, ATR filter passed, no existing position):
1. Calculate entry price at zone boundary
2. Calculate TP and SL based on selected method
3. Execute strategy.entry() with calculated position size
4. Place strategy.exit() with TP limit and SL stop orders
5. Update info table with active trade details
The strategy enforces one position at a time by checking strategy.position_size == 0 before entry.
### Channel Breakout Management:
Channels are removed when price closes more than 10 ticks outside boundaries. This tolerance prevents premature channel deletion from minor breaks or wicks, allowing the mean reversion setup to persist through small boundary violations.
### Position Sizing System:
Three methods calculate position size:
**Fixed Contracts**:
- Uses exact contract quantity specified in settings
- Best for futures traders (e.g., "trade 2 NQ contracts")
**Percentage of Equity**:
- position_size = (strategy.equity × equity_pct / 100) / close
- Dynamically scales with account growth
**Cash Amount**:
- position_size = cash_amount / close
- Maintains consistent dollar exposure regardless of price
## INPUT PARAMETERS:
### Position Sizing:
- **Position Size Type**: Choose Fixed Contracts, % of Equity, or Cash Amount
- **Number of Contracts**: Fixed quantity per trade (1-1000)
- **% of Equity**: Percentage of account to allocate (1-100%)
- **Cash Amount**: Dollar value per position ($100+)
### Channel Settings:
- **Nested Channels**: Allow multiple overlapping channels vs single channel
- **Normalization Length**: Lookback for high/low calculation (1-500, default 100)
- **Box Detection Length**: Period for volatility detection (1-100, default 14)
### Scalping Settings:
- **Enable Long Scalps**: Toggle long entries on/off
- **Enable Short Scalps**: Toggle short entries on/off
- **Entry Zone % from Edge**: Size of entry zone (5-50%, default 20%)
- **SL Offset (Ticks)**: Distance beyond channel for stop (1+, default 5)
- **Cooldown Period (Bars)**: Minimum spacing between signals (0 = no cooldown)
### ATR Filter:
- **Enable ATR Filter**: Toggle volatility filter on/off
- **ATR Timeframe**: Source timeframe for ATR (1, 5, 15, 60 min, etc.)
- **ATR Length**: Smoothing period (1-100, default 14)
- **Min ATR Value**: Threshold for trade enablement (0.1+, default 10.0)
### Take Profit Settings:
- **TP Method**: Choose Fixed Points or % of Channel
- **TP Fixed (Ticks)**: Static distance in ticks (1+, default 30)
- **TP % of Channel**: Dynamic target as channel percentage (10-100%, default 50%)
### Appearance:
- **Show Entry Zones**: Toggle zone labels on channels
- **Show Info Table**: Display real-time strategy status
- **Table Position**: Corner placement (Top Left/Right, Bottom Left/Right)
- **Color Settings**: Customize long/short/TP/SL colors
## VISUAL INDICATORS:
- **Channel boxes** with semi-transparent fill showing consolidation zones
- **Colored entry zones** labeled "LONG ZONE ▲" and "SHORT ZONE ▼"
- **Entry signal arrows** below/above bars marking long/short entries
- **Active TP/SL lines** with emoji labels (⊕ Entry, 🎯 TP, 🛑 SL)
- **Info table** showing position status, channel state, last signal, entry/TP/SL prices, and ATR status
## HOW TO USE:
### For 1-3 Minute Scalping (NQ/ES):
- ATR Timeframe: "1" (1-minute)
- ATR Min Value: 10.0 (for NQ), adjust per instrument
- Entry Zone %: 20-25%
- TP Method: Fixed Points, 20-40 ticks
- SL Offset: 5-10 ticks
- Cooldown: 2-3 bars
- Position Size: 1-2 contracts
### For 5-15 Minute Day Trading:
- ATR Timeframe: "5" or match chart
- ATR Min Value: Adjust to instrument (test 8-15 for NQ)
- Entry Zone %: 20-30%
- TP Method: % of Channel, 40-60%
- SL Offset: 5-10 ticks
- Cooldown: 3-5 bars
- Position Size: Fixed contracts or 5-10% equity
### For 30-60 Minute Swing Scalping:
- ATR Timeframe: "15" or "30"
- ATR Min Value: Lower threshold for broader market
- Entry Zone %: 25-35%
- TP Method: % of Channel, 50-70%
- SL Offset: 10-15 ticks
- Cooldown: 5+ bars or disable
- Position Size: % of equity recommended
## BACKTEST CONSIDERATIONS:
- Strategy performs best in ranging, mean-reverting markets
- Strong trending markets produce more stop losses as price breaks channels
- ATR filter significantly reduces trade count but improves quality during low volatility
- Cooldown period trades signal quantity for signal quality
- Commission and slippage materially impact sub-5-minute timeframe performance
- Shorter timeframes require tighter entry zones (15-20%) to catch quick reversions
- % of Channel TP adapts better to varying channel sizes than fixed points
- Fixed contract sizing recommended for consistent risk per trade in futures
**Backtesting Parameters Used**: This strategy was developed and tested using realistic commission and slippage values to provide accurate performance expectations. Recommended settings: Commission of $1.40 per side (typical for NQ futures through discount brokers), slippage of 2 ticks to account for execution delays on fast-moving scalp entries. These values reflect real-world trading costs that active scalpers will encounter. Backtest results without proper cost simulation will significantly overstate profitability.
## COMPATIBLE MARKETS:
Works on any instrument with price data including stock indices (NQ, ES, YM, RTY), individual stocks, forex pairs (EUR/USD, GBP/USD), cryptocurrency (BTC, ETH), and commodities. Volume-based features require data feed with volume information but are optional for core functionality.
## KNOWN LIMITATIONS:
- Immediate touch entry can fire multiple times in choppy zones without adequate cooldown
- Channel deletion at 10-tick breaks may be too aggressive or lenient depending on instrument tick size
- ATR filter from lower timeframes requires higher-tier TradingView subscription (request.security limitation)
- Mean reversion logic fails in strong breakout scenarios leading to stop loss hits
- Position sizing via % of equity or cash amount calculates based on close price, may differ from actual fill price
- No partial closing capability - full position exits at TP or SL only
- Strategy does not account for gap openings or overnight holds
## RISK DISCLOSURE:
Trading involves substantial risk of loss. Past performance does not guarantee future results. This strategy is for educational purposes and backtesting only. Mean reversion strategies can experience extended drawdowns during trending markets. Stop losses may not fill at intended levels during extreme volatility or gaps. Thoroughly test on historical data and paper trade before risking real capital. Use appropriate position sizing and never risk more than you can afford to lose. Consider consulting a licensed financial advisor before making trading decisions. Automated trading systems can malfunction - monitor all live positions actively.
## ACKNOWLEDGMENT & CREDITS:
This strategy is built upon the channel detection methodology created by **AlgoAlpha** in the "Smart Money Breakout Channels" indicator. Full credit and appreciation to AlgoAlpha for pioneering the normalized volatility approach to identifying consolidation patterns. The core channel formation logic using normalized price standard deviation is AlgoAlpha's original contribution to the TradingView community.
Enhancements to the original concept include: mean reversion entry logic (vs breakout), immediate touch-based signals, multi-timeframe ATR volatility filtering, flexible position sizing (fixed/percentage/cash), cooldown period filtering, dual TP methods (fixed points vs channel percentage), automated strategy execution with exit management, and real-time position monitoring table.

Nirvana True Duel전략 이름
열반의 진검승부 (영문: Nirvana True Duel)
컨셉과 철학
“열반의 진검승부”는 시장 소음은 무시하고, 확실할 때만 진입하는 전략입니다.
EMA 리본으로 추세 방향을 확인하고, 볼린저 밴드 수축/확장으로 변동성 돌파를 포착하며, OBV로 거래량 확인을 통해 가짜 돌파를 필터링합니다.
전략 로직
매수 조건 (롱)
20EMA > 50EMA (상승 추세)
밴드폭 수축 후 확장 시작
종가가 상단 밴드 돌파
OBV 상승 흐름 유지
매도 조건 (숏)
20EMA < 50EMA (하락 추세)
밴드폭 수축 후 확장 시작
종가가 하단 밴드 이탈
OBV 하락 흐름 유지
진입·청산
손절: ATR × 1.5 배수
익절: 손절폭의 1.5~2배에서 부분 청산
시간 청산: 설정한 최대 보유 봉수 초과 시 강제 청산
장점
✅ 추세·변동성·거래량 3중 필터 → 노이즈 최소화
✅ 백테스트·알람 지원 → 기계적 매매 가능
✅ 5분/15분 차트에 적합 → 단타/스윙 트레이딩 활용 가능
주의점
⚠ 횡보장에서는 신호가 적거나 실패 가능
⚠ 수수료·슬리피지 고려 필요
📜 Nirvana True Duel — Strategy Description (English)
Name:
Nirvana True Duel (a.k.a. Nirvana Cross)
Concept & Philosophy
The “Nirvana True Duel” strategy focuses on trading only meaningful breakouts and avoiding unnecessary noise.
Nirvana: A calm, patient state — waiting for the right opportunity without emotional trading.
True Duel: When the signal appears, enter decisively and let the market reveal the outcome.
In short: “Ignore market noise, trade only high-probability breakouts.”
🧩 Strategy Components
Trend Filter (EMA Ribbon): Stay aligned with the main market trend.
Volatility Squeeze (Bollinger Band): Detect volatility contraction & expansion to catch explosive moves early.
Volume Confirmation (OBV): Filter out false breakouts by confirming with volume flow.
⚔️ Entry & Exit Conditions
Long Setup:
20 EMA > 50 EMA (uptrend)
BB width breaks out from recent squeeze
Close > Upper Bollinger Band
OBV shows positive flow
Short Setup:
20 EMA < 50 EMA (downtrend)
BB width breaks out from recent squeeze
Close < Lower Bollinger Band
OBV shows negative flow
Risk Management:
Stop Loss: ATR × 1.5 below/above entry
Take Profit: 1.5–2× stop distance, partial take-profit allowed
Time Stop: Automatically closes after max bars held (e.g. 8h on 5m chart)
✅ Strengths
Triple Filtering: Trend + Volatility + Volume → fewer false signals
Mechanical & Backtestable: Ideal for objective trading & performance validation
Adaptable: Works well on Bitcoin, Nasdaq futures, and other high-volatility markets (5m/15m)
⚠️ Things to Note
Low signal frequency or higher failure rate in sideways/range markets
Commission & slippage should be factored in, especially on lower timeframes
ATR multiplier and R:R ratio should be optimized per asset

Inakis-BB-Stoch-ATR-ADX StrategyStrategy Description
This advanced trading strategy combines multiple technical indicators to identify high-probability breakout opportunities in trending markets. The system uses a multi-layered filtering approach to ensure only the strongest signals trigger trades.
Key Components:
Primary Signals:
Bollinger Bands Breakout: Identifies price extremes when price breaks below the lower band (buy) or above the upper band (sell)
Stochastic Oscillator: Confirms oversold (<30) and overbought (>70) conditions
ADX Filter: Ensures sufficient trend strength is present (ADX > 20)
ATR Volatility Filter: Trades only during periods of adequate volatility
Advanced Features:
DMI Higher Timeframe Analysis: Incorporates directional movement from higher timeframes (default 1H) to align trades with the dominant trend
Volume Confirmation: Requires above-average volume for signal validation
Cooldown Period: Prevents overtrading by enforcing minimum bars between signals
Visual Feedback: Color-coded background based on higher timeframe trend direction
Risk Management:
Fixed position sizing with customizable contract size
Predefined Stop Loss (default 500 points) and Take Profit (default 1000 points) levels
Clear risk-reward ratio of 1:2
Trading Logic:
Long Entry: Price breaks below BB lower band + Stochastic < 30 + Higher TF bullish trend
Short Entry: Price breaks above BB upper band + Stochastic > 70 + Higher TF bearish trend
All entries require confirmation from ADX, ATR, and volume filters
Customization:
All parameters are fully adjustable through the input panel, allowing traders to optimize the strategy for different markets and timeframes. Each filter can be individually enabled/disabled for testing and optimization purposes.
This strategy is designed for trending markets and performs best on liquid instruments with clear directional moves.

NIFTY_2min_FVG_Buy_StrategySummary
This strategy is designed for scalping Nifty on a 2-minute chart, focusing exclusively on long entries. The script's purpose is to identify and act on specific bullish reversal patterns based on volume analysis and price action.
Concept & Core Logic
The strategy operates on a two-stage confirmation process:
Volume Absorption: The initial condition seeks to identify potential bullish reversals by detecting signs of selling pressure being absorbed by buyers. This suggests that a downward move may be losing momentum.
Fair Value Gap (FVG) Confirmation: After a volume absorption signal, the strategy waits for a Fair Value Gap (FVG) to appear. A long entry signal is generated only after a candle closes above the FVG zone, serving as confirmation of bullish intent.
Risk Management
The strategy employs a fixed take profit and stop loss for each trade, based on the Nifty underlying price:
Take Profit: The exit signal is triggered when a trade reaches a 25-point profit.
Stop Loss: The exit signal is triggered when a trade reaches a 30-point loss.
Intended Use
This tool is intended for traders who:
Utilize mechanical, rule-based systems for intraday trading and scalping.
Are interested in studying a structured approach that combines volume analysis with price action inefficiencies like Fair Value Gaps.
