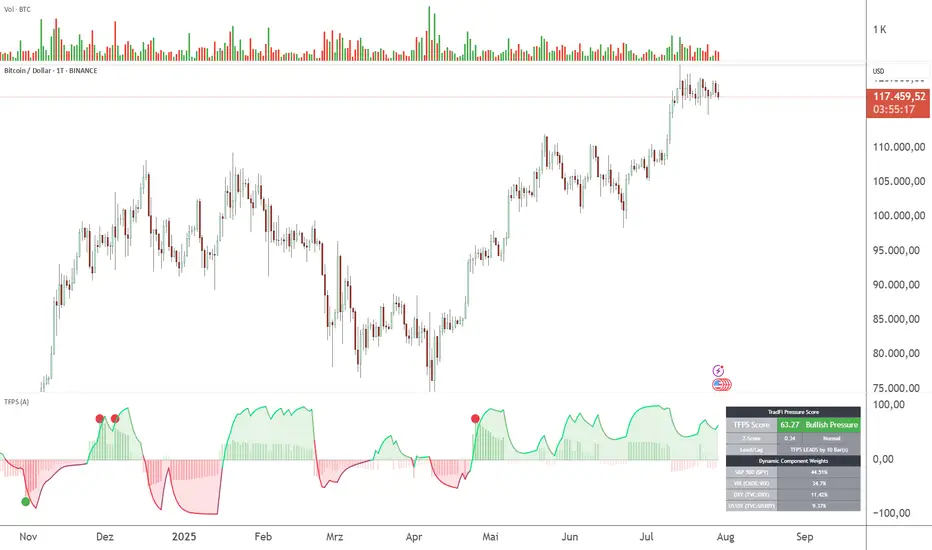
TFPS - TradFi-Pressure-Score (Adaptive)The data-driven answer to an irreversible market reality.
This indicator quantifies the combined pressure from the S&P 500, VIX, DXY, and US10Y, whose correlation to crypto has reached peak values of 0.87. Your decisive macro edge, in real-time.
This indicator is built on a fundamental analysis of market data from the last five years. The analysis proves an irreversible transformation: The crypto market has evolved into a high-beta risk asset, its fate inextricably linked to Traditional Finance (TradFi).
The empirical data is clear:
Bitcoin increasingly behaves like a leveraged version of the S&P 500.
The correlation to stock indices, with peak values of up to 0.87, is statistically highly significant.
The "digital gold" safe-haven narrative is refuted by the data; the correlation to gold (0.04) is virtually non-existent and statistically insignificant.
This means: Standard indicators like RSI or MACD are insufficient for today's market conditions. They only see price, ignoring the powerful external context that now dominates price action.
The TradFi Pressure Score (TFPS) is the answer to this data-driven reality. It's your institutional-grade macro dashboard, aggregating the four most dominant external forces into a single, actionable score:
S&P 500 (SPY): The pulse of global risk appetite. A rising S&P signals a "risk-on" environment, fueling capital flows into crypto.
VIX: The market's "Fear Gauge". A rising VIX signals a "risk-off" flight to safety, draining liquidity from crypto.
DXY (US-Dollar Index): The counter-pole to risk assets. A strong Dollar (rising DXY) tightens global liquidity, creating significant headwinds for Bitcoin.
US 10Y Yield: The opportunity cost of capital. Rising yields make risk-free assets more attractive, pulling capital away from non-yielding assets like crypto.
What makes TFPS truly unique?
Dynamic Weighting (its secret weapon): Which factor matters most today? The DXY or the VIX? TFPS continuously analyzes the correlation of all four factors to your chosen asset (e.g., Bitcoin) and automatically adjusts their weight in real-time. This ensures you're always focused on what's currently driving the market.
Adaptive Engine : What drives a 15-minute chart is different from a daily chart. The TFPS engine automatically adapts its lookback periods and calculations to your chosen timeframe for optimal relevance.
Clear, Actionable Signals Designed for Traders:
Pressure Line (>0 or <0): Instantly see if the world's largest financial forces are providing a tailwind or a headwind for your trade.
Z-Score (Extreme Readings) : Get early warnings of extreme macro "Greed" or "Fear". Readings above +2 or below -2 have historically pinpointed moments of market exhaustion that often precede major trend reversals.
Regime Change : A fundamental shift in the nature of TradFi pressure is visualized with a clear signal, providing unambiguous macro insights.
Lead/Lag Status : Gain a critical edge by knowing who's in the driver's seat. The dashboard tells you if TradFi is LEADING the price action or if crypto is moving independently, allowing you to focus on the right information source.
This is a private beta. I am granting exclusive access to a limited number of traders who understand this new market reality. In exchange for your valuable feedback, you will be among the first to leverage what I believe is the new standard for macro analysis in crypto trading.
Request access to trade with the full context.
ค้นหาในสคริปต์สำหรับ "vix"
Fear Volatility Gate [by Oberlunar]The Fear Volatility Gate by Oberlunar is a filter designed to enhance operational prudence by leveraging volatility-based risk indices. Its architecture is grounded in the empirical observation that sudden shifts in implied volatility often precede instability across financial markets. By dynamically interpreting signals from globally recognized "fear indices", such as the VIX, the indicator aims to identify periods of elevated systemic uncertainty and, accordingly, restrict or flag potential trade entries.
The rationale behind the Fear Volatility Gate is rooted in the understanding that implied volatility represents a forward-looking estimate of market risk. When volatility indices rise sharply, it reflects increased demand for options and a broader perception of uncertainty. In such contexts, price movements can become less predictable, more erratic, and often decoupled from technical structures. Rather than relying on price alone, this filter provides an external perspective—derived from derivative markets—on whether current conditions justify caution.
The indicator operates in two primary modes: single-source and composite . In the single-source configuration, a user-defined volatility index is monitored individually. In composite mode, the filter can synthesize input from multiple indices simultaneously, offering a more comprehensive macro-risk assessment. The filtering logic is adaptable, allowing signals to be combined using inclusive (ANY), strict (ALL), or majority consensus logic. This allows the trader to tailor sensitivity based on the operational context or asset class.
The indices available for selection cover a broad spectrum of market sectors. In the equity domain, the filter supports the CBOE Volatility Index ( CBOE:VIX VIX) for the S&P 500, the Nasdaq-100 Volatility Index ( CBOE:VXN VXN), the Russell 2000 Volatility Index ( CBOEFTSE:RVX RVX), and the Dow Jones Volatility Index ( CBOE:VXD VXD). For commodities, it integrates the Crude Oil Volatility Index ( CBOE:OVX ), the Gold Volatility Index ( CBOE:GVZ ), and the Silver Volatility Index ( CBOE:VXSLV ). From the fixed income perspective, it includes the ICE Bank of America MOVE Index ( OKX:MOVEUSD ), the Volatility Index for the TLT ETF ( CBOE:VXTLT VXTLT), and the 5-Year Treasury Yield Index ( CBOE:FVX.P FVX). Within the cryptocurrency space, it incorporates the Bitcoin Volmex Implied Volatility Index ( VOLMEX:BVIV BVIV), the Ethereum Volmex Implied Volatility Index ( VOLMEX:EVIV EVIV), the Deribit Bitcoin Volatility Index ( DERIBIT:DVOL DVOL), and the Deribit Ethereum Volatility Index ( DERIBIT:ETHDVOL ETHDVOL). Additionally, the user may define a custom instrument for specialized tracking.
To determine whether market conditions are considered high-risk, the indicator supports three modes of evaluation.
The moving average cross mode compares a fast Hull Moving Average to a slower one, triggering a signal when short-term volatility exceeds long-term expectations.
The Z-score mode standardizes current volatility relative to historical mean and standard deviation, identifying significant deviations that may indicate abnormal market stress.
The percentile mode ranks the current value against a historical distribution, providing a relative perspective particularly useful when dealing with non-normal or skewed distributions.
When at least one selected index meets the condition defined by the chosen mode, and if the filtering logic confirms it, the indicator can mark the trading environment as “blocked”. This status is visually highlighted through background color changes and symbolic markers on the chart. An optional tabular interface provides detailed diagnostics, including raw values, fast-slow MA comparison, Z-scores, percentile levels, and binary risk status for each active index.
The Fear Volatility Gate is not a predictive tool in itself but rather a dynamic constraint layer that reinforces discipline under conditions of macro instability. It is particularly valuable when trading systems are exposed to highly leveraged or short-duration strategies, where market noise and sentiment can temporarily override structural price behavior. By synchronizing trading signals with volatility regimes, the filter promotes a more cautious, informed approach to decision-making.
This approach does not assume that all volatility spikes are harmful or that market corrections are imminent. Rather, it acknowledges that periods of elevated implied volatility statistically coincide with increased execution risk, slippage, and spread widening, all of which may erode the profitability of even the most technically accurate setups.
Therefore, the Fear Volatility Gate acts as a protective mechanism.
Oberlunar 👁️⭐

Market Sell-Off GaugeOVERVIEW
The Market Sell‑Off Gauge identifies high‑conviction, risk‑off entry opportunities by detecting broad market sell‑off behavior and rising stablecoin dominance, then confirming risk‑off sentiment via NDX weakness, VIX spikes, and elevated volume. It uses fuzzy logic and sigmoid scaling to convert raw signals into a smooth, bounded metric.
FEATURES
Sell‑Off Detection - calculates percentage drops in the primary asset over a user‑defined lookback.
Stablecoin Dominance Surge - tracks combined USDT/USDC dominance rises as a proxy for on‑chain “flight to safety.”
Macro Confirmation
NDX Weakness (NASDAQ‑100)
VIX Spikes (CBOE Volatility Index)
Elevated Volume on declining bars
Fuzzy Logic & Scaling - component values feed into a fuzzy‑logic membership scor and are passed through a sigmoid compressor (–1 to +1). Weighted aggregation derives the final result of the gauge (or metric).
VISUALISATION
Continuous line plot - Smoothed metric (–1 to +1), colored cold‑to‑warm.
Entry circles - Highlighted when all conditions (fuzzy or crisp) are met after the time offset.
Time‑Offset marker - Vertical line/label showing the user‑specified “start” bar.
Component table - Displays real‑time % changes & volume multiples in the lower right of the indicator.
USAGE
Asset drop % - The threshold percent decline to register a sell‑off.
Stables rise % - The threshold percent increase in stablecoin dominance to qualify as a “flight to safety.”
NDX drop % - The threshold percent decline in the NASDAQ‑100 for macro confirmation.
VIX rise % - The threshold percent increase in VIX. Contributes to risk‑off validation.
Volume Multiplier - Defines how many times above SMA volume must rise to confirm conviction.
Lookback Period - Controls the number of bars over which % changes are measured.
Time Offset - Point in time beyond which bars to “fade” historical signals, enables focus on recent data only.
Fuzzy Logic Settings - Enables fuzzy scoring and set membership threshold & sensitivity.
Weights - allows for adjusting the relative importance of each component (Asset, Stables, NDX, VIX, Volume).
Sigmoid Steepness (k) - Controls curve steepness for compression (0.1 = very flat → 5.0 = very sharp S‑curve).
Chart & settings
Best applied on 4H or Daily BTCUSD (or similar) charts to capture meaningful sell‑off events.
Combine with broader trend filters (e.g., moving averages) for trend‑aligned entries.
Adjust Sigmoid Steepness and Membership Sensitivity to fine‑tune signal crispness vs. smoothness. Refer to tooltips.
Disclaimer
This indicator is intended for educational purposes only. Always perform your own due diligence before making financial decisions.

Market Volatility KeyMarket Volatility Key is a compact dashboard tool designed to help traders quickly assess market conditions related to volatility, trend strength, and asset movement.
This indicator consolidates several key metrics into a color-coded table, providing traders with a real-time overview of the market’s volatility landscape. It is intended to complement existing trading strategies, particularly for trend-following and scalping approaches.
Key Features:
Choppiness Index (CHOP): Measures whether the market is trending or consolidating.
Average True Range (ATR): Customizable by timeframe, helping gauge volatility across different periods.
Volatility Index (VIX): Displays real-time VIX readings, often used as a "fear gauge" for market sentiment.
10-Year US Treasury Bond Yield (10Y): Shows current bond yield to monitor macroeconomic conditions.
Bitcoin (BTC/USD): Tracks price along with directional movement.
Dollar Index (DXY): Displays the strength of the US dollar.
MAG 7 Index: A custom average of Microsoft, Apple, Alphabet, Amazon, Tesla, Meta, and NVIDIA prices.
Visual Enhancements (April 2025 Update):
Directional Arrows: BTC, DXY, MAG7, VIX, and 10Y Bond rows now show ▲ (up), ▼ (down), or → (sideways) based on price movement.
Dynamic Value Colors:
Green for rising prices (BTC, DXY, MAG7, 10Y Bond)
Red for falling prices
For VIX, rising volatility is shown in red and falling volatility in green to better reflect market sentiment.
Customization Options:
Adjustable ATR timeframe
Adjustable table position (top, middle, or bottom right)
Selectable font size (small, medium, large)
Intended Use: This script provides a high-level visual summary of multiple market indicators in one place. It is designed to assist traders in recognizing potential changes in volatility and market sentiment without replacing other forms of technical or fundamental analysis.

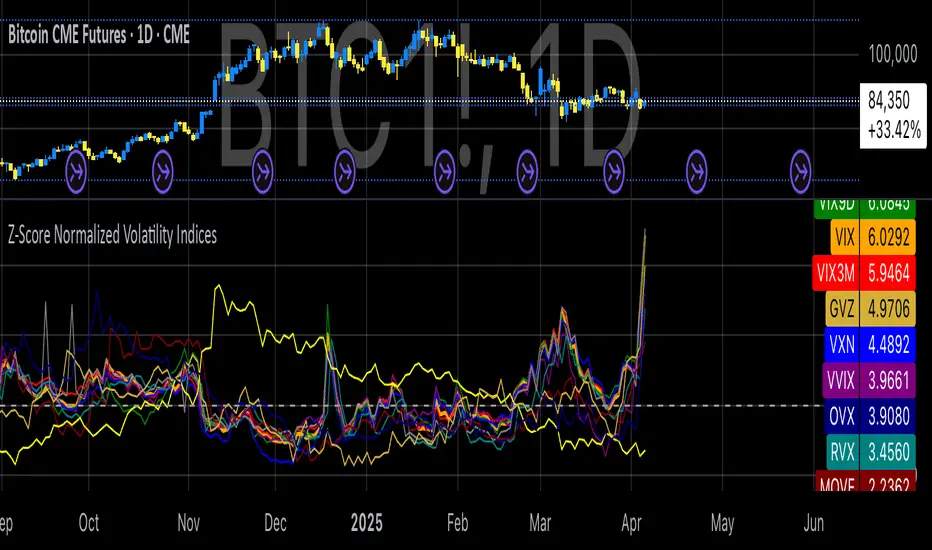
Z-Score Normalized Volatility IndicesVolatility is one of the most important measures in financial markets, reflecting the extent of variation in asset prices over time. It is commonly viewed as a risk indicator, with higher volatility signifying greater uncertainty and potential for price swings, which can affect investment decisions. Understanding volatility and its dynamics is crucial for risk management and forecasting in both traditional and alternative asset classes.
Z-Score Normalization in Volatility Analysis
The Z-score is a statistical tool that quantifies how many standard deviations a given data point is from the mean of the dataset. It is calculated as:
Z = \frac{X - \mu}{\sigma}
Where X is the value of the data point, \mu is the mean of the dataset, and \sigma is the standard deviation of the dataset. In the context of volatility indices, the Z-score allows for the normalization of these values, enabling their comparison regardless of the original scale. This is particularly useful when analyzing volatility across multiple assets or asset classes.
This script utilizes the Z-score to normalize various volatility indices:
1. VIX (CBOE Volatility Index): A widely used indicator that measures the implied volatility of S&P 500 options. It is considered a barometer of market fear and uncertainty (Whaley, 2000).
2. VIX3M: Represents the 3-month implied volatility of the S&P 500 options, providing insight into medium-term volatility expectations.
3. VIX9D: The implied volatility for a 9-day S&P 500 options contract, which reflects short-term volatility expectations.
4. VVIX: The volatility of the VIX itself, which measures the uncertainty in the expectations of future volatility.
5. VXN: The Nasdaq-100 volatility index, representing implied volatility in the Nasdaq-100 options.
6. RVX: The Russell 2000 volatility index, tracking the implied volatility of options on the Russell 2000 Index.
7. VXD: Volatility for the Dow Jones Industrial Average.
8. MOVE: The implied volatility index for U.S. Treasury bonds, offering insight into expectations for interest rate volatility.
9. BVIX: Volatility of Bitcoin options, a useful indicator for understanding the risk in the cryptocurrency market.
10. GVZ: Volatility index for gold futures, reflecting the risk perception of gold prices.
11. OVX: Measures implied volatility for crude oil futures.
Volatility Clustering and Z-Score
The concept of volatility clustering—where high volatility tends to be followed by more high volatility—is well documented in financial literature. This phenomenon is fundamental in volatility modeling and highlights the persistence of periods of heightened market uncertainty (Bollerslev, 1986).
Moreover, studies by Andersen et al. (2012) explore how implied volatility indices, like the VIX, serve as predictors for future realized volatility, underlining the relationship between expected volatility and actual market behavior. The Z-score normalization process helps in making volatility data comparable across different asset classes, enabling more effective decision-making in volatility-based strategies.
Applications in Trading and Risk Management
By using Z-score normalization, traders can more easily assess deviations from the mean in volatility, helping to identify periods when volatility is unusually high or low. This can be used to adjust risk exposure or to implement volatility-based trading strategies, such as mean reversion strategies. Research suggests that volatility mean-reversion is a reliable pattern that can be exploited for profit (Christensen & Prabhala, 1998).
References:
• Andersen, T. G., Bollerslev, T., Diebold, F. X., & Vega, C. (2012). Realized volatility and correlation dynamics: A long-run approach. Journal of Financial Economics, 104(3), 385-406.
• Bollerslev, T. (1986). Generalized autoregressive conditional heteroskedasticity. Journal of Econometrics, 31(3), 307-327.
• Christensen, B. J., & Prabhala, N. R. (1998). The relation between implied and realized volatility. Journal of Financial Economics, 50(2), 125-150.
• Whaley, R. E. (2000). Derivatives on market volatility and the VIX index. Journal of Derivatives, 8(1), 71-84.
Risk MeterRisk Meter Indicator for TradingView
The Risk Meter is a powerful market risk assessment tool designed to help traders evaluate the current risk environment using a simple, data-driven score. By analyzing four critical market factors—VIX (volatility index), market breadth, trailing volatility, and credit spreads—the indicator generates a risk score between 0 and 4. This score empowers traders to make informed decisions about hedging, exiting positions, or re-entering the market, with clear visual cues and alerts for intraday monitoring.
What It Does
Calculates a Risk Score: Assigns a score from 0 to 4, where each point reflects an active risk condition based on four market indicators.
Identifies Risk Levels:
A score of 3 or higher indicates a high-risk environment, suggesting traders consider hedging or reducing exposure.
A score of 2 or lower for at least two consecutive days signals a potential opportunity to re-enter the market.
Provides Visual Feedback: Uses color-coded Columns, threshold markers, and a component table for quick interpretation.
Supports Decision-Making: Offers a structured approach to managing risk and timing trades.
How It Works
The Risk Meter aggregates four key risk conditions, each contributing 1 point to the total score when triggered:
Elevated and Rising VIX (Risk 1)
Condition: The VIX is above 18 and higher than it was 20 days ago.
Purpose: Detects increasing market fear or uncertainty.
Market Breadth Dropping (Risk 2)
Condition: Either:
Fewer than 50% of S&P 500 stocks are above their 200-day moving average and fewer than 70% are above their 50-day moving average, or
The 3-day EMA of the 200-day breadth falls below 80% of its 20-day SMA.
Purpose: Identifies weakening participation across the market.
Trailing Volatility (Risk 3)
Condition: The 30-day annualized volatility of the equal-weight S&P 500 (RSP) exceeds 35%.
Purpose: Highlights periods of heightened price instability.
Credit Spreads (Risk 4)
Condition: The price ratio of high-yield bonds (HYG) to Treasuries (TLT or IEF) is lower than it was 20 days ago, indicating widening credit spreads.
Purpose: Signals potential stress in credit markets.
The total risk score is the sum of these conditions (0 to 4). Additionally, the indicator tracks consecutive days with a score of 2 or lower to generate re-entry signals.
How to Read It Intraday
The Risk Meter is built on daily data but can be monitored intraday for real-time insights. Here’s how traders can interpret it:
Risk Score Plot:
Displayed as a step line ranging from 0 to 4.
Colors:
Red: High risk (score ≥ 3) – caution advised.
Green: Re-entry signal – score ≤ 2 for at least two consecutive days (triggered when the count increments from 1 to 2).
Blue: Neutral or low risk (score < 3 without a re-entry signal).
Threshold Lines:
Dashed Gray Line at 3: Marks the high-risk threshold.
Dotted Gray Line at 2: Indicates the low-risk threshold for re-entry signals.
Risk Component Table:
Located in the top-right corner, it lists:
VIX, Breadth, Volatility, and Credit Spreads.
Status: Shows "" (warning, red) if the risk condition is met, or "✓" (safe, blue) if not.
Helps traders pinpoint which factors are driving the score.
Alerts:
High Risk Alert: Triggers when the score moves from < 3 to ≥ 3.
Re-entry Signal Alert: Triggers when the score ≤ 2 for two consecutive days.
Intraday Usage Tips
Check the indicator throughout the day for early signs of risk shifts, especially if the score is near a threshold (e.g., 2 or 3).
Combine with other intraday tools (e.g., price action, volume) since the Risk Meter updates daily but reflects broader market conditions.
How Traders Can Use It
High-Risk Signal (Score ≥ 3):
Consider hedging positions (e.g., with options) or reducing equity exposure to protect against potential downturns.
Re-entry Signal (Score ≤ 2 for 2+ Days):
Look to re-enter the market or increase exposure, as it suggests stabilizing conditions.
Daily Risk Management:
Use the score and table to assess overall market health and adjust strategies accordingly.
Alert-Driven Trading:
Set up alerts to stay notified of critical risk changes without constant monitoring.
Why Use the Risk Meter?
This indicator offers a systematic, multi-factor approach to risk assessment, blending volatility, breadth, and credit market data into an easy-to-read score. Whether you’re an intraday trader or a longer-term investor, the Risk Meter helps you stay proactive, avoid surprises, and time your trades with greater confidence.
Financial Risk Disclaimer for the Risk Meter Tool
Important Notice: The Risk Meter is a market risk assessment tool designed to provide insights into current market conditions based on historical data and predefined indicators. It is intended for informational and educational purposes only and should not be considered financial advice, a recommendation to buy or sell any securities, or a guarantee of future market performance.
Key Considerations
No Guarantee of Accuracy: While the Risk Meter utilizes reliable data sources and established financial metrics, the creators do not guarantee the accuracy, completeness, or timeliness of the information provided. Financial markets are complex and subject to rapid, unpredictable changes, and the tool’s output may not fully reflect all market dynamics.
Market Risks: Trading and investing in financial markets carry significant risks, including the potential loss of principal. Market volatility, economic shifts, and other factors can lead to unexpected outcomes. Past performance is not a reliable indicator of future results, and the Risk Meter’s assessments are based on historical data, not future predictions.
Not a Substitute for Professional Advice: The Risk Meter is not intended to replace personalized financial guidance. Users are strongly encouraged to consult a qualified financial advisor, perform their own research, and evaluate their personal financial situation, risk tolerance, and investment objectives before making any trading or investment decisions.
Limitation of Liability: The creators of the Risk Meter, including any affiliates, developers, or contributors, are not liable for any direct, indirect, incidental, or consequential losses or damages arising from the use of this tool. This includes, but is not limited to, financial losses, missed opportunities, or decisions based on the tool’s output.
User Responsibility: By using the Risk Meter, you accept full responsibility for your trading and investment decisions. You acknowledge that you use the tool at your own risk and that the creators bear no responsibility for any outcomes resulting from its use.
Final Note
The Risk Meter is a supplementary tool designed to enhance your understanding of market risk. It is not a comprehensive solution for investment management. Approach trading and investing with caution, ensuring your decisions align with your personal financial strategy.

Financial Conditions Composite Z-Score1. Inputs and Data Sources
The script pulls data for the following financial metrics using TradingView's request.security function:
CBOE:VIX (Volatility Index): A measure of market volatility.
MOVE Index: A measure of bond market volatility (or Treasury volatility).
BAMLH0A0HYM2 (High-Yield Spread): The spread between high-yield corporate bonds and Treasury yields.
BAMLC0A0CM (Credit Spread): The spread for investment-grade corporate bonds.
Each of these metrics represents a key aspect of financial conditions:
VIX: Equity market risk.
MOVE: Bond market risk.
High-Yield Spread and Credit Spread: Perception of risk in corporate debt.
2. Z-Score Calculation
A z-score standardizes each metric to show how far it deviates from its average over a specified period (lookback = 160, or 160 days):
Positive z-scores indicate the metric is higher than average.
Negative z-scores indicate the metric is lower than average.
The formula for the z-score:
Z-Score = Metric − Mean
Standard Deviation Z-Score = Standard Deviation Metric−Mean
3. Combined Z-Score
The script combines the four individual z-scores into a single Composite Z-Score, equally weighted across the metrics:
Combined Z-Score = (Z VIX + Z MOVE + Z High-Yield Spread + Z Credit Spread) / 4
This Combined Z-Score provides an overall measure of financial conditions:
Positive combined z-scores indicate tighter or riskier financial conditions.
Negative combined z-scores indicate looser or less risky financial conditions.
4. Visual Elements on the Chart
A. Colorful Lines: Individual Z-Scores
Each of the four metrics is plotted as a separate line:
Red: Z-score of the VIX.
Green: Z-score of the MOVE index.
Orange: Z-score of the high-yield spread.
Purple: Z-score of the credit spread.
These lines show how each metric contributes to the overall financial conditions. For example:
A rising red line means increasing equity market volatility (risk).
A rising green line means increasing bond market volatility (risk).
B. Blue Line: Combined Z-Score
The blue line represents the Combined Z-Score. It aggregates the individual z-scores into a single measure:
A rising blue line suggests financial conditions are tightening (greater risk across markets).
A falling blue line suggests financial conditions are loosening (lower risk across markets).
C. Red and Green Background: Z-Score Regions
Red Background: When the Combined Z-Score is positive (>0), it indicates riskier or tighter financial conditions.
Green Background: When the Combined Z-Score is negative (<0), it indicates less risky or looser financial conditions.
This background coloring helps visually distinguish periods of riskier financial conditions from less risky ones.
5. Purpose of the Visualization
This indicator provides a comprehensive view of financial conditions across multiple asset classes:
Traders can use it to gauge the level of systemic market stress.
Investors can use it to assess when risk is elevated (positive z-scores) or subdued (negative z-scores).
It helps in decision-making for strategies that depend on market volatility or risk appetite.
Summary of What You See:
Colorful Lines (Red, Green, Orange, Purple): Individual z-scores for each metric (VIX, MOVE, high-yield spread, credit spread).
Blue Line: The aggregated Combined Z-Score that summarizes financial conditions.
Red and Green Background:
Red: Tight or risky financial conditions (Combined Z-Score > 0).
Green: Loose or low-risk financial conditions (Combined Z-Score < 0).
This visualization provides a multi-dimensional view of financial conditions at a glance, helping to identify periods of high or low risk in the markets.

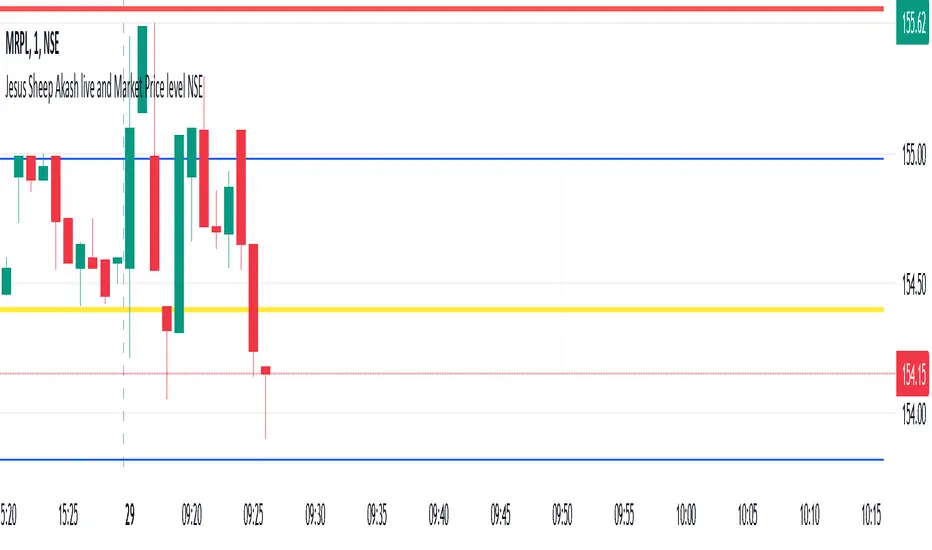
Jesus Sheep Akash live and Market Price level NSEJesus Sheep Akash live and Market Price level NSE
This Pine Script indicator is designed to assist traders by dynamically calculating and displaying key resistance and support levels based on market volatility (using the India VIX) and previous day's closing prices. It combines technical analysis principles with dynamic adjustments to account for changing market conditions.
Key Features:
Ticker Support:
Tracks both the India VIX (NSE:INDIAVIX) and the current market ticker.
Dynamic Resistance and Support Levels:
Calculates resistance and support levels based on the previous day's market close, adjusted dynamically using the VIX.
Includes half-resistance and half-support levels for intermediate targets.
Extends calculations to include additional resistance and support levels (up to four levels above and below).
Market Volatility Factor:
Integrates a volatility adjustment factor based on the 20-day standard deviation of prices, fine-tuning the calculated levels.
Real-Time Visualization:
Draws lines for:
Resistance levels (red lines).
Support levels (green lines).
Half-resistance and half-support (blue lines).
Highlights key price levels with labels on the chart.
Provides a dynamic table showing:
Current and previous day VIX.
Current price, price change, and previous close.
Alerts and Notifications:
Sends alerts when the market price crosses resistance or support levels, signaling potential trading opportunities.
Ease of Analysis:
Automatically updates lines and levels at the start of each trading session.
Provides a clear and structured view of key price points for informed decision-making.
Interactive Labeling:
Displays VIX data and previous day's closing value as a label near the chart for easy reference.
How to Use:
Trading Strategy:
Use the resistance levels as potential selling or shorting points.
Use support levels as potential buying or long entry points.
Monitor alerts for breakouts above resistance or breakdowns below support to identify significant market moves.
Customization:
Adjust daily_count or calculation parameters to match your specific market conditions or trading style.
Overlay Placement:
The indicator is designed to overlay directly on the chart for seamless integration with your technical analysis.
This indicator is ideal for traders looking to blend market sentiment (VIX) with precise price action analysis to identify trading opportunities dynamically.
ADI Market Internals MatrixUsage
This script is designed for use during market hours but is particularly useful in the last trading hour—a period known for increased volatility and volume as traders close positions and make final decisions for the day.
Trend Analysis
The histogram provides a quick visual reference for the market's direction based on USI:ADD and $VOLSPD. A predominance of green bars suggests a bullish trend, while red bars indicate bearish conditions based on the BIAS EMA.
Volatility Assessment
The VIX label gives a quick glance at the user-inputted VIX pivot, aiding in volatility assessment and bias determination.
Features
VIX Label: Changes color (red/green) to indicate a bullish or bearish bias based on the user's input for the VIX pivot.
EMA Calculations: Calculates the EMAs for USI:ADD and $VOLSPD based on custom input, which helps determine the market trend.
Trend Determination: Identifies the close value of USI:ADD and $VOLSPD and whether they are above or below their respective EMAs.
Loopback Period: Calculates how far to look back to determine the trend, adjustable by the user.
Market Hours Control: Includes an input (startTime) for specifying when the histogram should start and end (9:30 AM to 4:00 PM EST).
Histogram Coloring
Green: Indicates a bullish trend (above the specified EMA length).
Red: Indicates a bearish trend (below the specified EMA length).
Gray: Indicates a neutral trend.
Customization
Users can adjust the script's sensitivity by changing the length for the EMAs, vixThreshold, startTime, and loopbackPeriod to fit their trading style or market conditions.
Note
Always use this tool in conjunction with other technical analysis tools and ensure proper risk management strategies are employed.

GKD-B Multi-Ticker Stepped Baseline [Loxx]Giga Kaleidoscope GKD-B Multi-Ticker Stepped Baseline is a Baseline module included in Loxx's "Giga Kaleidoscope Modularized Trading System".
This version of the GKD-B Baseline is designed specifically to support traders who wish to conduct GKD-BT Multi-Ticker Backtests with multiple tickers. This functionality is exclusive to the GKD-BT Multi-Ticker Backtests.
Traders have the capability to apply a filter to the selected moving average, leveraging various volatility metrics to enhance trend identification. This feature is tailored for traders favoring a gradual and consistent approach, enabling them to discern more sustainable trends. The system permits filtering for both the input data and the moving average results, requiring price movements to exceed a specific threshold—defined as multiples of the volatility—before acknowledging a trend change. This mechanism effectively reduces false signals caused by market noise and lateral movements. A distinctive aspect of this tool is its ability to adjust both price and moving average data based on volatility indicators like VIX, EUVIX, BVIV, and EVIV, among others. Understanding the time frame over which a volatility index is measured is crucial; for instance, VIX is measured on an annual basis, whereas BVIV and EVIV are based on a 30-day period. To accurately convert these measurements to a daily scale, users must input the correct "days per year" value: 252 for VIX and 30 for BVIV and EVIV. Future updates will introduce additional functionality to extend analysis across various time frames, but currently, this feature is solely available for daily time frame analysis.
█ GKD-B Multi-Ticker Stepped Baseline includes 65+ different moving averages:
Adaptive Moving Average - AMA
ADXvma - Average Directional Volatility Moving Average
Ahrens Moving Average
Alexander Moving Average - ALXMA
Deviation Scaled Moving Average - DSMA
Donchian
Double Exponential Moving Average - DEMA
Double Smoothed Exponential Moving Average - DSEMA
Double Smoothed FEMA - DSFEMA
Double Smoothed Range Weighted EMA - DSRWEMA
Double Smoothed Wilders EMA - DSWEMA
Double Weighted Moving Average - DWMA
Ehlers Optimal Tracking Filter - EOTF
Exponential Moving Average - EMA
Fast Exponential Moving Average - FEMA
Fractal Adaptive Moving Average - FRAMA
Generalized DEMA - GDEMA
Generalized Double DEMA - GDDEMA
Hull Moving Average (Type 1) - HMA1
Hull Moving Average (Type 2) - HMA2
Hull Moving Average (Type 3) - HMA3
Hull Moving Average (Type 4) - HMA4
IE /2 - Early T3 by Tim Tilson
Integral of Linear Regression Slope - ILRS
Kaufman Adaptive Moving Average - KAMA
Laguerre Filter
Leader Exponential Moving Average
Linear Regression Value - LSMA ( Least Squares Moving Average )
Linear Weighted Moving Average - LWMA
McGinley Dynamic
McNicholl EMA
Non-Lag Moving Average
Ocean NMA Moving Average - ONMAMA
One More Moving Average - OMA
Parabolic Weighted Moving Average
Probability Density Function Moving Average - PDFMA
Quadratic Regression Moving Average - QRMA
Regularized EMA - REMA
Range Weighted EMA - RWEMA
Recursive Moving Trendline
Simple Decycler - SDEC
Simple Jurik Moving Average - SJMA
Simple Moving Average - SMA
Sine Weighted Moving Average
Smoothed LWMA - SLWMA
Smoothed Moving Average - SMMA
Smoother
Super Smoother
T3
Three-pole Ehlers Butterworth
Three-pole Ehlers Smoother
Triangular Moving Average - TMA
Triple Exponential Moving Average - TEMA
Two-pole Ehlers Butterworth
Two-pole Ehlers smoother
Variable Index Dynamic Average - VIDYA
Variable Moving Average - VMA
Volume Weighted EMA - VEMA
Volume Weighted Moving Average - VWMA
Zero-Lag DEMA - Zero Lag Exponential Moving Average
Zero-Lag Moving Average
Zero Lag TEMA - Zero Lag Triple Exponential Moving Average
Geometric Mean Moving Average
Coral
Tether Lines
Range Filter
Triangle Moving Average Generalized
Ultinate Smoother
Adaptive Moving Average - AMA
The Adaptive Moving Average (AMA) is a moving average that changes its sensitivity to price moves depending on the calculated volatility. It becomes more sensitive during periods when the price is moving smoothly in a certain direction and becomes less sensitive when the price is volatile.
ADXvma - Average Directional Volatility Moving Average
Linnsoft's ADXvma formula is a volatility-based moving average, with the volatility being determined by the value of the ADX indicator.
The ADXvma has the SMA in Chande's CMO replaced with an EMA , it then uses a few more layers of EMA smoothing before the "Volatility Index" is calculated.
A side effect is, those additional layers slow down the ADXvma when you compare it to Chande's Variable Index Dynamic Average VIDYA .
The ADXVMA provides support during uptrends and resistance during downtrends and will stay flat for longer, but will create some of the most accurate market signals when it decides to move.
Ahrens Moving Average
Richard D. Ahrens's Moving Average promises "Smoother Data" that isn't influenced by the occasional price spike. It works by using the Open and the Close in his formula so that the only time the Ahrens Moving Average will change is when the candlestick is either making new highs or new lows.
Alexander Moving Average - ALXMA
This Moving Average uses an elaborate smoothing formula and utilizes a 7 period Moving Average. It corresponds to fitting a second-order polynomial to seven consecutive observations. This moving average is rarely used in trading but is interesting as this Moving Average has been applied to diffusion indexes that tend to be very volatile.
Deviation Scaled Moving Average - DSMA
The Deviation-Scaled Moving Average is a data smoothing technique that acts like an exponential moving average with a dynamic smoothing coefficient. The smoothing coefficient is automatically updated based on the magnitude of price changes. In the Deviation-Scaled Moving Average, the standard deviation from the mean is chosen to be the measure of this magnitude. The resulting indicator provides substantial smoothing of the data even when price changes are small while quickly adapting to these changes.
Donchian
Donchian Channels are three lines generated by moving average calculations that comprise an indicator formed by upper and lower bands around a midrange or median band. The upper band marks the highest price of a security over N periods while the lower band marks the lowest price of a security over N periods.
Double Exponential Moving Average - DEMA
The Double Exponential Moving Average ( DEMA ) combines a smoothed EMA and a single EMA to provide a low-lag indicator. It's primary purpose is to reduce the amount of "lagging entry" opportunities, and like all Moving Averages, the DEMA confirms uptrends whenever price crosses on top of it and closes above it, and confirms downtrends when the price crosses under it and closes below it - but with significantly less lag.
Double Smoothed Exponential Moving Average - DSEMA
The Double Smoothed Exponential Moving Average is a lot less laggy compared to a traditional EMA . It's also considered a leading indicator compared to the EMA , and is best utilized whenever smoothness and speed of reaction to market changes are required.
Double Smoothed FEMA - DSFEMA
Same as the Double Exponential Moving Average (DEMA), but uses a faster version of EMA for its calculation.
Double Smoothed Range Weighted EMA - DSRWEMA
Range weighted exponential moving average (EMA) is, unlike the "regular" range weighted average calculated in a different way. Even though the basis - the range weighting - is the same, the way how it is calculated is completely different. By definition this type of EMA is calculated as a ratio of EMA of price*weight / EMA of weight. And the results are very different and the two should be considered as completely different types of averages. The higher than EMA to price changes responsiveness when the ranges increase remains in this EMA too and in those cases this EMA is clearly leading the "regular" EMA. This version includes double smoothing.
Double Smoothed Wilders EMA - DSWEMA
Welles Wilder was frequently using one "special" case of EMA (Exponential Moving Average) that is due to that fact (that he used it) sometimes called Wilder's EMA. This version is adding double smoothing to Wilder's EMA in order to make it "faster" (it is more responsive to market prices than the original) and is still keeping very smooth values.
Double Weighted Moving Average - DWMA
Double weighted moving average is an LWMA (Linear Weighted Moving Average). Instead of doing one cycle for calculating the LWMA, the indicator is made to cycle the loop 2 times. That produces a smoother values than the original LWMA
Ehlers Optimal Tracking Filter - EOTF
The Elher's Optimum Tracking Filter quickly adjusts rapid shifts in the price and yet is relatively smooth when the price has a sideways action. The operation of this filter is similar to Kaufman’s Adaptive Moving
Average
Exponential Moving Average - EMA
The EMA places more significance on recent data points and moves closer to price than the SMA ( Simple Moving Average ). It reacts faster to volatility due to its emphasis on recent data and is known for its ability to give greater weight to recent and more relevant data. The EMA is therefore seen as an enhancement over the SMA .
Fast Exponential Moving Average - FEMA
An Exponential Moving Average with a short look-back period.
Fractal Adaptive Moving Average - FRAMA
The Fractal Adaptive Moving Average by John Ehlers is an intelligent adaptive Moving Average which takes the importance of price changes into account and follows price closely enough to display significant moves whilst remaining flat if price ranges. The FRAMA does this by dynamically adjusting the look-back period based on the market's fractal geometry.
Generalized DEMA - GDEMA
The double exponential moving average (DEMA), was developed by Patrick Mulloy in an attempt to reduce the amount of lag time found in traditional moving averages. It was first introduced in the February 1994 issue of the magazine Technical Analysis of Stocks & Commodities in Mulloy's article "Smoothing Data with Faster Moving Averages.". Instead of using fixed multiplication factor in the final DEMA formula, the generalized version allows you to change it. By varying the "volume factor" form 0 to 1 you apply different multiplications and thus producing DEMA with different "speed" - the higher the volume factor is the "faster" the DEMA will be (but also the slope of it will be less smooth). The volume factor is limited in the calculation to 1 since any volume factor that is larger than 1 is increasing the overshooting to the extent that some volume factors usage makes the indicator unusable.
Generalized Double DEMA - GDDEMA
The double exponential moving average (DEMA), was developed by Patrick Mulloy in an attempt to reduce the amount of lag time found in traditional moving averages. It was first introduced in the February 1994 issue of the magazine Technical Analysis of Stocks & Commodities in Mulloy's article "Smoothing Data with Faster Moving Averages''. This is an extension of the Generalized DEMA using Tim Tillsons (the inventor of T3) idea, and is using GDEMA of GDEMA for calculation (which is the "middle step" of T3 calculation). Since there are no versions showing that middle step, this version covers that too. The result is smoother than Generalized DEMA, but is less smooth than T3 - one has to do some experimenting in order to find the optimal way to use it, but in any case, since it is "faster" than the T3 (Tim Tillson T3) and still smooth, it looks like a good compromise between speed and smoothness.
Hull Moving Average (Type 1) - HMA1
Alan Hull's HMA makes use of weighted moving averages to prioritize recent values and greatly reduce lag whilst maintaining the smoothness of a traditional Moving Average. For this reason, it's seen as a well-suited Moving Average for identifying entry points. This version uses SMA for smoothing.
Hull Moving Average (Type 2) - HMA2
Alan Hull's HMA makes use of weighted moving averages to prioritize recent values and greatly reduce lag whilst maintaining the smoothness of a traditional Moving Average. For this reason, it's seen as a well-suited Moving Average for identifying entry points. This version uses EMA for smoothing.
Hull Moving Average (Type 3) - HMA3
Alan Hull's HMA makes use of weighted moving averages to prioritize recent values and greatly reduce lag whilst maintaining the smoothness of a traditional Moving Average. For this reason, it's seen as a well-suited Moving Average for identifying entry points. This version uses LWMA for smoothing.
Hull Moving Average (Type 4) - HMA4
Alan Hull's HMA makes use of weighted moving averages to prioritize recent values and greatly reduce lag whilst maintaining the smoothness of a traditional Moving Average. For this reason, it's seen as a well-suited Moving Average for identifying entry points. This version uses SMMA for smoothing.
IE /2 - Early T3 by Tim Tilson and T3 new
The T3 moving average is a type of technical indicator used in financial analysis to identify trends in price movements. It is similar to the Exponential Moving Average (EMA) and the Double Exponential Moving Average (DEMA), but uses a different smoothing algorithm.
The T3 moving average is calculated using a series of exponential moving averages that are designed to filter out noise and smooth the data. The resulting smoothed data is then weighted with a non-linear function to produce a final output that is more responsive to changes in trend direction.
The T3 moving average can be customized by adjusting the length of the moving average, as well as the weighting function used to smooth the data. It is commonly used in conjunction with other technical indicators as part of a larger trading strategy.
Integral of Linear Regression Slope - ILRS
A Moving Average where the slope of a linear regression line is simply integrated as it is fitted in a moving window of length N (natural numbers in maths) across the data. The derivative of ILRS is the linear regression slope. ILRS is not the same as a SMA ( Simple Moving Average ) of length N, which is actually the midpoint of the linear regression line as it moves across the data.
Kaufman Adaptive Moving Average - KAMA
Developed by Perry Kaufman, Kaufman's Adaptive Moving Average (KAMA) is a moving average designed to account for market noise or volatility. KAMA will closely follow prices when the price swings are relatively small and the noise is low.
Laguerre Filter
The Laguerre Filter is a smoothing filter which is based on Laguerre polynomials. The filter requires the current price, three prior prices, a user defined factor called Alpha to fill its calculation.
Adjusting the Alpha coefficient is used to increase or decrease its lag and its smoothness.
Leader Exponential Moving Average
The Leader EMA was created by Giorgos E. Siligardos who created a Moving Average which was able to eliminate lag altogether whilst maintaining some smoothness. It was first described during his research paper "MACD Leader" where he applied this to the MACD to improve its signals and remove its lagging issue. This filter uses his leading MACD's "modified EMA" and can be used as a zero lag filter.
Linear Regression Value - LSMA ( Least Squares Moving Average )
LSMA as a Moving Average is based on plotting the end point of the linear regression line. It compares the current value to the prior value and a determination is made of a possible trend, eg. the linear regression line is pointing up or down.
Linear Weighted Moving Average - LWMA
LWMA reacts to price quicker than the SMA and EMA . Although it's similar to the Simple Moving Average , the difference is that a weight coefficient is multiplied to the price which means the most recent price has the highest weighting, and each prior price has progressively less weight. The weights drop in a linear fashion.
McGinley Dynamic
John McGinley created this Moving Average to track prices better than traditional Moving Averages. It does this by incorporating an automatic adjustment factor into its formula, which speeds (or slows) the indicator in trending, or ranging, markets.
McNicholl EMA
Dennis McNicholl developed this Moving Average to use as his center line for his "Better Bollinger Bands" indicator and was successful because it responded better to volatility changes over the standard SMA and managed to avoid common whipsaws.
Non-lag moving average
The Non Lag Moving average follows price closely and gives very quick signals as well as early signals of price change. As a standalone Moving Average, it should not be used on its own, but as an additional confluence tool for early signals.
Ocean NMA Moving Average - ONMAMA
Created by Jim Sloman, the NMA is a moving average that automatically adjusts to volatility without being programmed to do so. For more info, read his guide "Ocean Theory, an Introduction"
One More Moving Average (OMA)
The One More Moving Average (OMA) is a technical indicator that calculates a series of Jurik-style moving averages in order to reduce noise and provide smoother price data. It uses six exponential moving averages to generate the final value, with the length of the moving averages determined by an adaptive algorithm that adjusts to the current market conditions. The algorithm calculates the average period by comparing the signal to noise ratio and using this value to determine the length of the moving averages. The resulting values are used to generate the final value of the OMA, which can be used to identify trends and potential changes in trend direction.
Parabolic Weighted Moving Average
The Parabolic Weighted Moving Average is a variation of the Linear Weighted Moving Average . The Linear Weighted Moving Average calculates the average by assigning different weights to each element in its calculation. The Parabolic Weighted Moving Average is a variation that allows weights to be changed to form a parabolic curve. It is done simply by using the Power parameter of this indicator.
Probability Density Function Moving Average - PDFMA
Probability density function based MA is a sort of weighted moving average that uses probability density function to calculate the weights. By its nature it is similar to a lot of digital filters.
Quadratic Regression Moving Average - QRMA
A quadratic regression is the process of finding the equation of the parabola that best fits a set of data. This moving average is an obscure concept that was posted to Forex forums in around 2008.
Regularized EMA - REMA
The regularized exponential moving average (REMA) by Chris Satchwell is a variation on the EMA (see Exponential Moving Average) designed to be smoother but not introduce too much extra lag.
Range Weighted EMA - RWEMA
This indicator is a variation of the range weighted EMA. The variation comes from a possible need to make that indicator a bit less "noisy" when it comes to slope changes. The method used for calculating this variation is the method described by Lee Leibfarth in his article "Trading With An Adaptive Price Zone".
Recursive Moving Trendline
Dennis Meyers's Recursive Moving Trendline uses a recursive (repeated application of a rule) polynomial fit, a technique that uses a small number of past values estimations of price and today's price to predict tomorrow's price.
Simple Decycler - SDEC
The Ehlers Simple Decycler study is a virtually zero-lag technical indicator proposed by John F. Ehlers. The original idea behind this study (and several others created by John F. Ehlers) is that market data can be considered a continuum of cycle periods with different cycle amplitudes. Thus, trending periods can be considered segments of longer cycles, or, in other words, low-frequency segments. Applying the right filter might help identify these segments.
Simple Loxx Moving Average - SLMA
A three stage moving average combining an adaptive EMA, a Kalman Filter, and a Kauffman adaptive filter.
Simple Moving Average - SMA
The SMA calculates the average of a range of prices by adding recent prices and then dividing that figure by the number of time periods in the calculation average. It is the most basic Moving Average which is seen as a reliable tool for starting off with Moving Average studies. As reliable as it may be, the basic moving average will work better when it's enhanced into an EMA .
Sine Weighted Moving Average
The Sine Weighted Moving Average assigns the most weight at the middle of the data set. It does this by weighting from the first half of a Sine Wave Cycle and the most weighting is given to the data in the middle of that data set. The Sine WMA closely resembles the TMA (Triangular Moving Average).
Smoothed LWMA - SLWMA
A smoothed version of the LWMA
Smoothed Moving Average - SMMA
The Smoothed Moving Average is similar to the Simple Moving Average ( SMA ), but aims to reduce noise rather than reduce lag. SMMA takes all prices into account and uses a long lookback period. Due to this, it's seen as an accurate yet laggy Moving Average.
Smoother
The Smoother filter is a faster-reacting smoothing technique which generates considerably less lag than the SMMA ( Smoothed Moving Average ). It gives earlier signals but can also create false signals due to its earlier reactions. This filter is sometimes wrongly mistaken for the superior Jurik Smoothing algorithm.
Super Smoother
The Super Smoother filter uses John Ehlers’s “Super Smoother” which consists of a Two pole Butterworth filter combined with a 2-bar SMA ( Simple Moving Average ) that suppresses the 22050 Hz Nyquist frequency: A characteristic of a sampler, which converts a continuous function or signal into a discrete sequence.
Three-pole Ehlers Butterworth
The 3 pole Ehlers Butterworth (as well as the Two pole Butterworth) are both superior alternatives to the EMA and SMA . They aim at producing less lag whilst maintaining accuracy. The 2 pole filter will give you a better approximation for price, whereas the 3 pole filter has superior smoothing.
Three-pole Ehlers smoother
The 3 pole Ehlers smoother works almost as close to price as the above mentioned 3 Pole Ehlers Butterworth. It acts as a strong baseline for signals but removes some noise. Side by side, it hardly differs from the Three Pole Ehlers Butterworth but when examined closely, it has better overshoot reduction compared to the 3 pole Ehlers Butterworth.
Triangular Moving Average - TMA
The TMA is similar to the EMA but uses a different weighting scheme. Exponential and weighted Moving Averages will assign weight to the most recent price data. Simple moving averages will assign the weight equally across all the price data. With a TMA (Triangular Moving Average), it is double smoother (averaged twice) so the majority of the weight is assigned to the middle portion of the data.
Triple Exponential Moving Average - TEMA
The TEMA uses multiple EMA calculations as well as subtracting lag to create a tool which can be used for scalping pullbacks. As it follows price closely, its signals are considered very noisy and should only be used in extremely fast-paced trading conditions.
Two-pole Ehlers Butterworth
The 2 pole Ehlers Butterworth (as well as the three pole Butterworth mentioned above) is another filter that cuts out the noise and follows the price closely. The 2 pole is seen as a faster, leading filter over the 3 pole and follows price a bit more closely. Analysts will utilize both a 2 pole and a 3 pole Butterworth on the same chart using the same period, but having both on chart allows its crosses to be traded.
Two-pole Ehlers smoother
A smoother version of the Two pole Ehlers Butterworth. This filter is the faster version out of the 3 pole Ehlers Butterworth. It does a decent job at cutting out market noise whilst emphasizing a closer following to price over the 3 pole Ehlers .
Variable Index Dynamic Average - VIDYA
Variable Index Dynamic Average Technical Indicator ( VIDYA ) was developed by Tushar Chande. It is an original method of calculating the Exponential Moving Average ( EMA ) with the dynamically changing period of averaging.
Variable Moving Average - VMA
The Variable Moving Average (VMA) is a study that uses an Exponential Moving Average being able to automatically adjust its smoothing factor according to the market volatility.
Volume Weighted EMA - VEMA
An EMA that uses a volume and price weighted calculation instead of the standard price input.
Volume Weighted Moving Average - VWMA
A Volume Weighted Moving Average is a moving average where more weight is given to bars with heavy volume than with light volume. Thus the value of the moving average will be closer to where most trading actually happened than it otherwise would be without being volume weighted.
Zero-Lag DEMA - Zero Lag Double Exponential Moving Average
John Ehlers's Zero Lag DEMA's aim is to eliminate the inherent lag associated with all trend following indicators which average a price over time. Because this is a Double Exponential Moving Average with Zero Lag, it has a tendency to overshoot and create a lot of false signals for swing trading. It can however be used for quick scalping or as a secondary indicator for confluence.
Zero-Lag Moving Average
The Zero Lag Moving Average is described by its creator, John Ehlers , as a Moving Average with absolutely no delay. And it's for this reason that this filter will cause a lot of abrupt signals which will not be ideal for medium to long-term traders. This filter is designed to follow price as close as possible whilst de-lagging data instead of basing it on regular data. The way this is done is by attempting to remove the cumulative effect of the Moving Average.
Zero-Lag TEMA - Zero Lag Triple Exponential Moving Average
Just like the Zero Lag DEMA , this filter will give you the fastest signals out of all the Zero Lag Moving Averages. This is useful for scalping but dangerous for medium to long-term traders, especially during market Volatility and news events. Having no lag, this filter also has no smoothing in its signals and can cause some very bizarre behavior when applied to certain indicators.
█ Volatility Goldie Locks Zone
This volatility filter is the standard first pass filter that is used for all NNFX systems despite the additional volatility/volume filter used in step 5. For this filter, price must fall into a range of maximum and minimum values calculated using multiples of volatility. Unlike the standard NNFX systems, this version of volatility filtering is separated from the core Baseline and uses it's own moving average with Loxx's Exotic Source Types.
█ Volatility Types included
The GKD system utilizes volatility-based take profits and stop losses. Each take profit and stop loss is calculated as a multiple of volatility. You can change the values of the multipliers in the settings as well.
This module includes 17 types of volatility:
Close-to-Close
Parkinson
Garman-Klass
Rogers-Satchell
Yang-Zhang
Garman-Klass-Yang-Zhang
Exponential Weighted Moving Average
Standard Deviation of Log Returns
Pseudo GARCH(2,2)
Average True Range
True Range Double
Standard Deviation
Adaptive Deviation
Median Absolute Deviation
Efficiency-Ratio Adaptive ATR
Mean Absolute Deviation
Static Percent
Various volatility estimators and indicators that investors and traders can use to measure the dispersion or volatility of a financial instrument's price. Each estimator has its strengths and weaknesses, and the choice of estimator should depend on the specific needs and circumstances of the user.
Volatility Ticker Selection
Import volatility tickers like VIX, EUVIX, BVIV, and EVIV.
Close-to-Close
Close-to-Close volatility is a classic and widely used volatility measure, sometimes referred to as historical volatility.
Volatility is an indicator of the speed of a stock price change. A stock with high volatility is one where the price changes rapidly and with a larger amplitude. The more volatile a stock is, the riskier it is.
Close-to-close historical volatility is calculated using only a stock's closing prices. It is the simplest volatility estimator. However, in many cases, it is not precise enough. Stock prices could jump significantly during a trading session and return to the opening value at the end. That means that a considerable amount of price information is not taken into account by close-to-close volatility.
Despite its drawbacks, Close-to-Close volatility is still useful in cases where the instrument doesn't have intraday prices. For example, mutual funds calculate their net asset values daily or weekly, and thus their prices are not suitable for more sophisticated volatility estimators.
Parkinson
Parkinson volatility is a volatility measure that uses the stock’s high and low price of the day.
The main difference between regular volatility and Parkinson volatility is that the latter uses high and low prices for a day, rather than only the closing price. This is useful as close-to-close prices could show little difference while large price movements could have occurred during the day. Thus, Parkinson's volatility is considered more precise and requires less data for calculation than close-to-close volatility.
One drawback of this estimator is that it doesn't take into account price movements after the market closes. Hence, it systematically undervalues volatility. This drawback is addressed in the Garman-Klass volatility estimator.
Garman-Klass
Garman-Klass is a volatility estimator that incorporates open, low, high, and close prices of a security.
Garman-Klass volatility extends Parkinson's volatility by taking into account the opening and closing prices. As markets are most active during the opening and closing of a trading session, it makes volatility estimation more accurate.
Garman and Klass also assumed that the process of price change follows a continuous diffusion process (Geometric Brownian motion). However, this assumption has several drawbacks. The method is not robust for opening jumps in price and trend movements.
Despite its drawbacks, the Garman-Klass estimator is still more effective than the basic formula since it takes into account not only the price at the beginning and end of the time interval but also intraday price extremes.
Researchers Rogers and Satchell have proposed a more efficient method for assessing historical volatility that takes into account price trends. See Rogers-Satchell Volatility for more detail.
Rogers-Satchell
Rogers-Satchell is an estimator for measuring the volatility of securities with an average return not equal to zero.
Unlike Parkinson and Garman-Klass estimators, Rogers-Satchell incorporates a drift term (mean return not equal to zero). As a result, it provides better volatility estimation when the underlying is trending.
The main disadvantage of this method is that it does not take into account price movements between trading sessions. This leads to an underestimation of volatility since price jumps periodically occur in the market precisely at the moments between sessions.
A more comprehensive estimator that also considers the gaps between sessions was developed based on the Rogers-Satchel formula in the 2000s by Yang-Zhang. See Yang Zhang Volatility for more detail.
Yang-Zhang
Yang Zhang is a historical volatility estimator that handles both opening jumps and the drift and has a minimum estimation error.
Yang-Zhang volatility can be thought of as a combination of the overnight (close-to-open volatility) and a weighted average of the Rogers-Satchell volatility and the day’s open-to-close volatility. It is considered to be 14 times more efficient than the close-to-close estimator.
Garman-Klass-Yang-Zhang
Garman-Klass-Yang-Zhang (GKYZ) volatility estimator incorporates the returns of open, high, low, and closing prices in its calculation.
GKYZ volatility estimator takes into account overnight jumps but not the trend, i.e., it assumes that the underlying asset follows a Geometric Brownian Motion (GBM) process with zero drift. Therefore, the GKYZ volatility estimator tends to overestimate the volatility when the drift is different from zero. However, for a GBM process, this estimator is eight times more efficient than the close-to-close volatility estimator.
Exponential Weighted Moving Average
The Exponentially Weighted Moving Average (EWMA) is a quantitative or statistical measure used to model or describe a time series. The EWMA is widely used in finance, with the main applications being technical analysis and volatility modeling.
The moving average is designed such that older observations are given lower weights. The weights decrease exponentially as the data point gets older – hence the name exponentially weighted.
The only decision a user of the EWMA must make is the parameter lambda. The parameter decides how important the current observation is in the calculation of the EWMA. The higher the value of lambda, the more closely the EWMA tracks the original time series.
Standard Deviation of Log Returns
This is the simplest calculation of volatility. It's the standard deviation of ln(close/close(1)).
Pseudo GARCH(2,2)
This is calculated using a short- and long-run mean of variance multiplied by ?.
avg(var;M) + (1 ? ?) avg(var;N) = 2?var/(M+1-(M-1)L) + 2(1-?)var/(M+1-(M-1)L)
Solving for ? can be done by minimizing the mean squared error of estimation; that is, regressing L^-1var - avg(var; N) against avg(var; M) - avg(var; N) and using the resulting beta estimate as ?.
Average True Range
The average true range (ATR) is a technical analysis indicator, introduced by market technician J. Welles Wilder Jr. in his book New Concepts in Technical Trading Systems, that measures market volatility by decomposing the entire range of an asset price for that period.
The true range indicator is taken as the greatest of the following: current high less the current low; the absolute value of the current high less the previous close; and the absolute value of the current low less the previous close. The ATR is then a moving average, generally using 14 days, of the true ranges.
True Range Double
A special case of ATR that attempts to correct for volatility skew.
Standard Deviation
Standard deviation is a statistic that measures the dispersion of a dataset relative to its mean and is calculated as the square root of the variance. The standard deviation is calculated as the square root of variance by determining each data point's deviation relative to the mean. If the data points are further from the mean, there is a higher deviation within the data set; thus, the more spread out the data, the higher the standard deviation.
Adaptive Deviation
By definition, the Standard Deviation (STD, also represented by the Greek letter sigma ? or the Latin letter s) is a measure that is used to quantify the amount of variation or dispersion of a set of data values. In technical analysis, we usually use it to measure the level of current volatility.
Standard Deviation is based on Simple Moving Average calculation for mean value. This version of standard deviation uses the properties of EMA to calculate what can be called a new type of deviation, and since it is based on EMA, we can call it EMA deviation. Additionally, Perry Kaufman's efficiency ratio is used to make it adaptive (since all EMA type calculations are nearly perfect for adapting).
The difference when compared to the standard is significant--not just because of EMA usage, but the efficiency ratio makes it a "bit more logical" in very volatile market conditions.
Median Absolute Deviation
The median absolute deviation is a measure of statistical dispersion. Moreover, the MAD is a robust statistic, being more resilient to outliers in a data set than the standard deviation. In the standard deviation, the distances from the mean are squared, so large deviations are weighted more heavily, and thus outliers can heavily influence it. In the MAD, the deviations of a small number of outliers are irrelevant.
Because the MAD is a more robust estimator of scale than the sample variance or standard deviation, it works better with distributions without a mean or variance, such as the Cauchy distribution.
For this indicator, a manual recreation of the quantile function in Pine Script is used. This is so users have a full inside view into how this is calculated.
Efficiency-Ratio Adaptive ATR
Average True Range (ATR) is a widely used indicator for many occasions in technical analysis. It is calculated as the RMA of the true range. This version adds a "twist": it uses Perry Kaufman's Efficiency Ratio to calculate adaptive true range.
Mean Absolute Deviation
The mean absolute deviation (MAD) is a measure of variability that indicates the average distance between observations and their mean. MAD uses the original units of the data, which simplifies interpretation. Larger values signify that the data points spread out further from the average. Conversely, lower values correspond to data points bunching closer to it. The mean absolute deviation is also known as the mean deviation and average absolute deviation.
This definition of the mean absolute deviation sounds similar to the standard deviation (SD). While both measure variability, they have different calculations. In recent years, some proponents of MAD have suggested that it replace the SD as the primary measure because it is a simpler concept that better fits real life.
█ Giga Kaleidoscope Modularized Trading System
Core components of an NNFX algorithmic trading strategy
The NNFX algorithm is built on the principles of trend, momentum, and volatility. There are six core components in the NNFX trading algorithm:
1. Volatility - price volatility; e.g., Average True Range, True Range Double, Close-to-Close, etc.
2. Baseline - a moving average to identify price trend
3. Confirmation 1 - a technical indicator used to identify trends
4. Confirmation 2 - a technical indicator used to identify trends
5. Continuation - a technical indicator used to identify trends
6. Volatility/Volume - a technical indicator used to identify volatility/volume breakouts/breakdown
7. Exit - a technical indicator used to determine when a trend is exhausted
8. Metamorphosis - a technical indicator that produces a compound signal from the combination of other GKD indicators*
*(not part of the NNFX algorithm)
What is Volatility in the NNFX trading system?
In the NNFX (No Nonsense Forex) trading system, ATR (Average True Range) is typically used to measure the volatility of an asset. It is used as a part of the system to help determine the appropriate stop loss and take profit levels for a trade. ATR is calculated by taking the average of the true range values over a specified period.
True range is calculated as the maximum of the following values:
-Current high minus the current low
-Absolute value of the current high minus the previous close
-Absolute value of the current low minus the previous close
ATR is a dynamic indicator that changes with changes in volatility. As volatility increases, the value of ATR increases, and as volatility decreases, the value of ATR decreases. By using ATR in NNFX system, traders can adjust their stop loss and take profit levels according to the volatility of the asset being traded. This helps to ensure that the trade is given enough room to move, while also minimizing potential losses.
Other types of volatility include True Range Double (TRD), Close-to-Close, and Garman-Klass
What is a Baseline indicator?
The baseline is essentially a moving average, and is used to determine the overall direction of the market.
The baseline in the NNFX system is used to filter out trades that are not in line with the long-term trend of the market. The baseline is plotted on the chart along with other indicators, such as the Moving Average (MA), the Relative Strength Index (RSI), and the Average True Range (ATR).
Trades are only taken when the price is in the same direction as the baseline. For example, if the baseline is sloping upwards, only long trades are taken, and if the baseline is sloping downwards, only short trades are taken. This approach helps to ensure that trades are in line with the overall trend of the market, and reduces the risk of entering trades that are likely to fail.
By using a baseline in the NNFX system, traders can have a clear reference point for determining the overall trend of the market, and can make more informed trading decisions. The baseline helps to filter out noise and false signals, and ensures that trades are taken in the direction of the long-term trend.
What is a Confirmation indicator?
Confirmation indicators are technical indicators that are used to confirm the signals generated by primary indicators. Primary indicators are the core indicators used in the NNFX system, such as the Average True Range (ATR), the Moving Average (MA), and the Relative Strength Index (RSI).
The purpose of the confirmation indicators is to reduce false signals and improve the accuracy of the trading system. They are designed to confirm the signals generated by the primary indicators by providing additional information about the strength and direction of the trend.
Some examples of confirmation indicators that may be used in the NNFX system include the Bollinger Bands, the MACD (Moving Average Convergence Divergence), and the MACD Oscillator. These indicators can provide information about the volatility, momentum, and trend strength of the market, and can be used to confirm the signals generated by the primary indicators.
In the NNFX system, confirmation indicators are used in combination with primary indicators and other filters to create a trading system that is robust and reliable. By using multiple indicators to confirm trading signals, the system aims to reduce the risk of false signals and improve the overall profitability of the trades.
What is a Continuation indicator?
In the NNFX (No Nonsense Forex) trading system, a continuation indicator is a technical indicator that is used to confirm a current trend and predict that the trend is likely to continue in the same direction. A continuation indicator is typically used in conjunction with other indicators in the system, such as a baseline indicator, to provide a comprehensive trading strategy.
What is a Volatility/Volume indicator?
Volume indicators, such as the On Balance Volume (OBV), the Chaikin Money Flow (CMF), or the Volume Price Trend (VPT), are used to measure the amount of buying and selling activity in a market. They are based on the trading volume of the market, and can provide information about the strength of the trend. In the NNFX system, volume indicators are used to confirm trading signals generated by the Moving Average and the Relative Strength Index. Volatility indicators include Average Direction Index, Waddah Attar, and Volatility Ratio. In the NNFX trading system, volatility is a proxy for volume and vice versa.
By using volume indicators as confirmation tools, the NNFX trading system aims to reduce the risk of false signals and improve the overall profitability of trades. These indicators can provide additional information about the market that is not captured by the primary indicators, and can help traders to make more informed trading decisions. In addition, volume indicators can be used to identify potential changes in market trends and to confirm the strength of price movements.
What is an Exit indicator?
The exit indicator is used in conjunction with other indicators in the system, such as the Moving Average (MA), the Relative Strength Index (RSI), and the Average True Range (ATR), to provide a comprehensive trading strategy.
The exit indicator in the NNFX system can be any technical indicator that is deemed effective at identifying optimal exit points. Examples of exit indicators that are commonly used include the Parabolic SAR, and the Average Directional Index (ADX).
The purpose of the exit indicator is to identify when a trend is likely to reverse or when the market conditions have changed, signaling the need to exit a trade. By using an exit indicator, traders can manage their risk and prevent significant losses.
In the NNFX system, the exit indicator is used in conjunction with a stop loss and a take profit order to maximize profits and minimize losses. The stop loss order is used to limit the amount of loss that can be incurred if the trade goes against the trader, while the take profit order is used to lock in profits when the trade is moving in the trader's favor.
Overall, the use of an exit indicator in the NNFX trading system is an important component of a comprehensive trading strategy. It allows traders to manage their risk effectively and improve the profitability of their trades by exiting at the right time.
What is an Metamorphosis indicator?
The concept of a metamorphosis indicator involves the integration of two or more GKD indicators to generate a compound signal. This is achieved by evaluating the accuracy of each indicator and selecting the signal from the indicator with the highest accuracy. As an illustration, let's consider a scenario where we calculate the accuracy of 10 indicators and choose the signal from the indicator that demonstrates the highest accuracy.
The resulting output from the metamorphosis indicator can then be utilized in a GKD-BT backtest by occupying a slot that aligns with the purpose of the metamorphosis indicator. The slot can be a GKD-B, GKD-C, or GKD-E slot, depending on the specific requirements and objectives of the indicator. This allows for seamless integration and utilization of the compound signal within the GKD-BT framework.
How does Loxx's GKD (Giga Kaleidoscope Modularized Trading System) implement the NNFX algorithm outlined above?
Loxx's GKD v2.0 system has five types of modules (indicators/strategies). These modules are:
1. GKD-BT - Backtesting module (Volatility, Number 1 in the NNFX algorithm)
2. GKD-B - Baseline module (Baseline and Volatility/Volume, Numbers 1 and 2 in the NNFX algorithm)
3. GKD-C - Confirmation 1/2 and Continuation module (Confirmation 1/2 and Continuation, Numbers 3, 4, and 5 in the NNFX algorithm)
4. GKD-V - Volatility/Volume module (Confirmation 1/2, Number 6 in the NNFX algorithm)
5. GKD-E - Exit module (Exit, Number 7 in the NNFX algorithm)
6. GKD-M - Metamorphosis module (Metamorphosis, Number 8 in the NNFX algorithm, but not part of the NNFX algorithm)
(additional module types will added in future releases)
Each module interacts with every module by passing data to A backtest module wherein the various components of the GKD system are combined to create a trading signal.
That is, the Baseline indicator passes its data to Volatility/Volume. The Volatility/Volume indicator passes its values to the Confirmation 1 indicator. The Confirmation 1 indicator passes its values to the Confirmation 2 indicator. The Confirmation 2 indicator passes its values to the Continuation indicator. The Continuation indicator passes its values to the Exit indicator, and finally, the Exit indicator passes its values to the Backtest strategy.
This chaining of indicators requires that each module conform to Loxx's GKD protocol, therefore allowing for the testing of every possible combination of technical indicators that make up the six components of the NNFX algorithm.
What does the application of the GKD trading system look like?
Example trading system:
Backtest: Multi-Ticker CC Backtest
Baseline: Hull Moving Average
Volatility/Volume: Hurst Exponent
Confirmation 1: Advance Trend Pressure as shown on the chart above
Confirmation 2: uf2018
Continuation: Coppock Curve
Exit: Rex Oscillator
Metamorphosis: Baseline Optimizer
Each GKD indicator is denoted with a module identifier of either: GKD-BT, GKD-B, GKD-C, GKD-V, GKD-M, or GKD-E. This allows traders to understand to which module each indicator belongs and where each indicator fits into the GKD system.
█ Giga Kaleidoscope Modularized Trading System Signals
Standard Entry
1. GKD-C Confirmation gives signal
2. Baseline agrees
3. Price inside Goldie Locks Zone Minimum
4. Price inside Goldie Locks Zone Maximum
5. Confirmation 2 agrees
6. Volatility/Volume agrees
1-Candle Standard Entry
1a. GKD-C Confirmation gives signal
2a. Baseline agrees
3a. Price inside Goldie Locks Zone Minimum
4a. Price inside Goldie Locks Zone Maximum
Next Candle
1b. Price retraced
2b. Baseline agrees
3b. Confirmation 1 agrees
4b. Confirmation 2 agrees
5b. Volatility/Volume agrees
Baseline Entry
1. GKD-B Baseline gives signal
2. Confirmation 1 agrees
3. Price inside Goldie Locks Zone Minimum
4. Price inside Goldie Locks Zone Maximum
5. Confirmation 2 agrees
6. Volatility/Volume agrees
7. Confirmation 1 signal was less than 'Maximum Allowable PSBC Bars Back' prior
1-Candle Baseline Entry
1a. GKD-B Baseline gives signal
2a. Confirmation 1 agrees
3a. Price inside Goldie Locks Zone Minimum
4a. Price inside Goldie Locks Zone Maximum
5a. Confirmation 1 signal was less than 'Maximum Allowable PSBC Bars Back' prior
Next Candle
1b. Price retraced
2b. Baseline agrees
3b. Confirmation 1 agrees
4b. Confirmation 2 agrees
5b. Volatility/Volume agrees
Volatility/Volume Entry
1. GKD-V Volatility/Volume gives signal
2. Confirmation 1 agrees
3. Price inside Goldie Locks Zone Minimum
4. Price inside Goldie Locks Zone Maximum
5. Confirmation 2 agrees
6. Baseline agrees
7. Confirmation 1 signal was less than 7 candles prior
1-Candle Volatility/Volume Entry
1a. GKD-V Volatility/Volume gives signal
2a. Confirmation 1 agrees
3a. Price inside Goldie Locks Zone Minimum
4a. Price inside Goldie Locks Zone Maximum
5a. Confirmation 1 signal was less than 'Maximum Allowable PSVVC Bars Back' prior
Next Candle
1b. Price retraced
2b. Volatility/Volume agrees
3b. Confirmation 1 agrees
4b. Confirmation 2 agrees
5b. Baseline agrees
Confirmation 2 Entry
1. GKD-C Confirmation 2 gives signal
2. Confirmation 1 agrees
3. Price inside Goldie Locks Zone Minimum
4. Price inside Goldie Locks Zone Maximum
5. Volatility/Volume agrees
6. Baseline agrees
7. Confirmation 1 signal was less than 7 candles prior
1-Candle Confirmation 2 Entry
1a. GKD-C Confirmation 2 gives signal
2a. Confirmation 1 agrees
3a. Price inside Goldie Locks Zone Minimum
4a. Price inside Goldie Locks Zone Maximum
5a. Confirmation 1 signal was less than 'Maximum Allowable PSC2C Bars Back' prior
Next Candle
1b. Price retraced
2b. Confirmation 2 agrees
3b. Confirmation 1 agrees
4b. Volatility/Volume agrees
5b. Baseline agrees
PullBack Entry
1a. GKD-B Baseline gives signal
2a. Confirmation 1 agrees
3a. Price is beyond 1.0x Volatility of Baseline
Next Candle
1b. Price inside Goldie Locks Zone Minimum
2b. Price inside Goldie Locks Zone Maximum
3b. Confirmation 1 agrees
4b. Confirmation 2 agrees
5b. Volatility/Volume agrees
Continuation Entry
1. Standard Entry, 1-Candle Standard Entry, Baseline Entry, 1-Candle Baseline Entry, Volatility/Volume Entry, 1-Candle Volatility/Volume Entry, Confirmation 2 Entry, 1-Candle Confirmation 2 Entry, or Pullback entry triggered previously
2. Baseline hasn't crossed since entry signal trigger
4. Confirmation 1 agrees
5. Baseline agrees
6. Confirmation 2 agrees

GKD-V Williams VixFix w/ Softmax [Loxx]The Giga Kaleidoscope GKD-V Williams VixFix w/ Softmax is a Volume/Volatility module included in Loxx's "Giga Kaleidoscope Modularized Trading System."
█ GKD-V Williams VixFix w/ Softmax
The Williams' Vix Fix indicator, a creation aimed at replicating the VIX (Volatility Index) for any asset, marks a significant advancement in volatility measurement, particularly for markets or instruments lacking options data. This indicator is designed to identify periods of extreme market stress or potential reversal points by measuring the distance between the highest past prices and current lows, reflecting panic or fear levels akin to those captured by the traditional VIX for the S&P 500. Enhanced with options for softmax normalization and a threshold-based signaling mechanism, the Vix Fix becomes a highly adaptable tool. Softmax normalization introduces a sophisticated method to normalize volatility signals, improving their interpretability and responsiveness to market changes. The threshold level option, on the other hand, provides a simpler, yet effective way to generate signals based on predefined volatility levels. This innovative approach to volatility analysis enables traders and analysts to leverage a more nuanced understanding of market dynamics, tailoring the indicator to their specific needs and strategies for navigating complex financial landscapes.
█ Giga Kaleidoscope Modularized Trading System
Core components of an NNFX algorithmic trading strategy
The NNFX algorithm is built on the principles of trend, momentum, and volatility. There are six core components in the NNFX trading algorithm:
1. Volatility - price volatility; e.g., Average True Range, True Range Double, Close-to-Close, etc.
2. Baseline - a moving average to identify price trend
3. Confirmation 1 - a technical indicator used to identify trends
4. Confirmation 2 - a technical indicator used to identify trends
5. Continuation - a technical indicator used to identify trends
6. Volatility/Volume - a technical indicator used to identify volatility/volume breakouts/breakdown
7. Exit - a technical indicator used to determine when a trend is exhausted
8. Metamorphosis - a technical indicator that produces a compound signal from the combination of other GKD indicators*
*(not part of the NNFX algorithm)
What is Volatility in the NNFX trading system?
In the NNFX (No Nonsense Forex) trading system, ATR (Average True Range) is typically used to measure the volatility of an asset. It is used as a part of the system to help determine the appropriate stop loss and take profit levels for a trade. ATR is calculated by taking the average of the true range values over a specified period.
True range is calculated as the maximum of the following values:
-Current high minus the current low
-Absolute value of the current high minus the previous close
-Absolute value of the current low minus the previous close
ATR is a dynamic indicator that changes with changes in volatility. As volatility increases, the value of ATR increases, and as volatility decreases, the value of ATR decreases. By using ATR in NNFX system, traders can adjust their stop loss and take profit levels according to the volatility of the asset being traded. This helps to ensure that the trade is given enough room to move, while also minimizing potential losses.
Other types of volatility include True Range Double (TRD), Close-to-Close, and Garman-Klass
What is a Baseline indicator?
The baseline is essentially a moving average, and is used to determine the overall direction of the market.
The baseline in the NNFX system is used to filter out trades that are not in line with the long-term trend of the market. The baseline is plotted on the chart along with other indicators, such as the Moving Average (MA), the Relative Strength Index (RSI), and the Average True Range (ATR).
Trades are only taken when the price is in the same direction as the baseline. For example, if the baseline is sloping upwards, only long trades are taken, and if the baseline is sloping downwards, only short trades are taken. This approach helps to ensure that trades are in line with the overall trend of the market, and reduces the risk of entering trades that are likely to fail.
By using a baseline in the NNFX system, traders can have a clear reference point for determining the overall trend of the market, and can make more informed trading decisions. The baseline helps to filter out noise and false signals, and ensures that trades are taken in the direction of the long-term trend.
What is a Confirmation indicator?
Confirmation indicators are technical indicators that are used to confirm the signals generated by primary indicators. Primary indicators are the core indicators used in the NNFX system, such as the Average True Range (ATR), the Moving Average (MA), and the Relative Strength Index (RSI).
The purpose of the confirmation indicators is to reduce false signals and improve the accuracy of the trading system. They are designed to confirm the signals generated by the primary indicators by providing additional information about the strength and direction of the trend.
Some examples of confirmation indicators that may be used in the NNFX system include the Bollinger Bands, the MACD (Moving Average Convergence Divergence), and the MACD Oscillator. These indicators can provide information about the volatility, momentum, and trend strength of the market, and can be used to confirm the signals generated by the primary indicators.
In the NNFX system, confirmation indicators are used in combination with primary indicators and other filters to create a trading system that is robust and reliable. By using multiple indicators to confirm trading signals, the system aims to reduce the risk of false signals and improve the overall profitability of the trades.
What is a Continuation indicator?
In the NNFX (No Nonsense Forex) trading system, a continuation indicator is a technical indicator that is used to confirm a current trend and predict that the trend is likely to continue in the same direction. A continuation indicator is typically used in conjunction with other indicators in the system, such as a baseline indicator, to provide a comprehensive trading strategy.
What is a Volatility/Volume indicator?
Volume indicators, such as the On Balance Volume (OBV), the Chaikin Money Flow (CMF), or the Volume Price Trend (VPT), are used to measure the amount of buying and selling activity in a market. They are based on the trading volume of the market, and can provide information about the strength of the trend. In the NNFX system, volume indicators are used to confirm trading signals generated by the Moving Average and the Relative Strength Index. Volatility indicators include Average Direction Index, Waddah Attar, and Volatility Ratio. In the NNFX trading system, volatility is a proxy for volume and vice versa.
By using volume indicators as confirmation tools, the NNFX trading system aims to reduce the risk of false signals and improve the overall profitability of trades. These indicators can provide additional information about the market that is not captured by the primary indicators, and can help traders to make more informed trading decisions. In addition, volume indicators can be used to identify potential changes in market trends and to confirm the strength of price movements.
What is an Exit indicator?
The exit indicator is used in conjunction with other indicators in the system, such as the Moving Average (MA), the Relative Strength Index (RSI), and the Average True Range (ATR), to provide a comprehensive trading strategy.
The exit indicator in the NNFX system can be any technical indicator that is deemed effective at identifying optimal exit points. Examples of exit indicators that are commonly used include the Parabolic SAR, and the Average Directional Index (ADX).
The purpose of the exit indicator is to identify when a trend is likely to reverse or when the market conditions have changed, signaling the need to exit a trade. By using an exit indicator, traders can manage their risk and prevent significant losses.
In the NNFX system, the exit indicator is used in conjunction with a stop loss and a take profit order to maximize profits and minimize losses. The stop loss order is used to limit the amount of loss that can be incurred if the trade goes against the trader, while the take profit order is used to lock in profits when the trade is moving in the trader's favor.
Overall, the use of an exit indicator in the NNFX trading system is an important component of a comprehensive trading strategy. It allows traders to manage their risk effectively and improve the profitability of their trades by exiting at the right time.
What is an Metamorphosis indicator?
The concept of a metamorphosis indicator involves the integration of two or more GKD indicators to generate a compound signal. This is achieved by evaluating the accuracy of each indicator and selecting the signal from the indicator with the highest accuracy. As an illustration, let's consider a scenario where we calculate the accuracy of 10 indicators and choose the signal from the indicator that demonstrates the highest accuracy.
The resulting output from the metamorphosis indicator can then be utilized in a GKD-BT backtest by occupying a slot that aligns with the purpose of the metamorphosis indicator. The slot can be a GKD-B, GKD-C, or GKD-E slot, depending on the specific requirements and objectives of the indicator. This allows for seamless integration and utilization of the compound signal within the GKD-BT framework.
How does Loxx's GKD (Giga Kaleidoscope Modularized Trading System) implement the NNFX algorithm outlined above?
Loxx's GKD v2.0 system has five types of modules (indicators/strategies). These modules are:
1. GKD-BT - Backtesting module (Volatility, Number 1 in the NNFX algorithm)
2. GKD-B - Baseline module (Baseline and Volatility/Volume, Numbers 1 and 2 in the NNFX algorithm)
3. GKD-C - Confirmation 1/2 and Continuation module (Confirmation 1/2 and Continuation, Numbers 3, 4, and 5 in the NNFX algorithm)
4. GKD-V - Volatility/Volume module (Confirmation 1/2, Number 6 in the NNFX algorithm)
5. GKD-E - Exit module (Exit, Number 7 in the NNFX algorithm)
6. GKD-M - Metamorphosis module (Metamorphosis, Number 8 in the NNFX algorithm, but not part of the NNFX algorithm)
(additional module types will added in future releases)
Each module interacts with every module by passing data to A backtest module wherein the various components of the GKD system are combined to create a trading signal.
That is, the Baseline indicator passes its data to Volatility/Volume. The Volatility/Volume indicator passes its values to the Confirmation 1 indicator. The Confirmation 1 indicator passes its values to the Confirmation 2 indicator. The Confirmation 2 indicator passes its values to the Continuation indicator. The Continuation indicator passes its values to the Exit indicator, and finally, the Exit indicator passes its values to the Backtest strategy.
This chaining of indicators requires that each module conform to Loxx's GKD protocol, therefore allowing for the testing of every possible combination of technical indicators that make up the six components of the NNFX algorithm.
What does the application of the GKD trading system look like?
Example trading system:
Backtest: Multi-Ticker CC Backtest
Baseline: Hull Moving Average
Volatility/Volume: Hurst Exponent
Confirmation 1: Advance Trend Pressure as shown on the chart above
Confirmation 2: uf2018
Continuation: Coppock Curve
Exit: Rex Oscillator
Metamorphosis: Baseline Optimizer
Each GKD indicator is denoted with a module identifier of either: GKD-BT, GKD-B, GKD-C, GKD-V, GKD-M, or GKD-E. This allows traders to understand to which module each indicator belongs and where each indicator fits into the GKD system.
█ Giga Kaleidoscope Modularized Trading System Signals
Standard Entry
1. GKD-C Confirmation gives signal
2. Baseline agrees
3. Price inside Goldie Locks Zone Minimum
4. Price inside Goldie Locks Zone Maximum
5. Confirmation 2 agrees
6. Volatility/Volume agrees
1-Candle Standard Entry
1a. GKD-C Confirmation gives signal
2a. Baseline agrees
3a. Price inside Goldie Locks Zone Minimum
4a. Price inside Goldie Locks Zone Maximum
Next Candle
1b. Price retraced
2b. Baseline agrees
3b. Confirmation 1 agrees
4b. Confirmation 2 agrees
5b. Volatility/Volume agrees
Baseline Entry
1. GKD-B Baseline gives signal
2. Confirmation 1 agrees
3. Price inside Goldie Locks Zone Minimum
4. Price inside Goldie Locks Zone Maximum
5. Confirmation 2 agrees
6. Volatility/Volume agrees
7. Confirmation 1 signal was less than 'Maximum Allowable PSBC Bars Back' prior
1-Candle Baseline Entry
1a. GKD-B Baseline gives signal
2a. Confirmation 1 agrees
3a. Price inside Goldie Locks Zone Minimum
4a. Price inside Goldie Locks Zone Maximum
5a. Confirmation 1 signal was less than 'Maximum Allowable PSBC Bars Back' prior
Next Candle
1b. Price retraced
2b. Baseline agrees
3b. Confirmation 1 agrees
4b. Confirmation 2 agrees
5b. Volatility/Volume agrees
Volatility/Volume Entry
1. GKD-V Volatility/Volume gives signal
2. Confirmation 1 agrees
3. Price inside Goldie Locks Zone Minimum
4. Price inside Goldie Locks Zone Maximum
5. Confirmation 2 agrees
6. Baseline agrees
7. Confirmation 1 signal was less than 7 candles prior
1-Candle Volatility/Volume Entry
1a. GKD-V Volatility/Volume gives signal
2a. Confirmation 1 agrees
3a. Price inside Goldie Locks Zone Minimum
4a. Price inside Goldie Locks Zone Maximum
5a. Confirmation 1 signal was less than 'Maximum Allowable PSVVC Bars Back' prior
Next Candle
1b. Price retraced
2b. Volatility/Volume agrees
3b. Confirmation 1 agrees
4b. Confirmation 2 agrees
5b. Baseline agrees
Confirmation 2 Entry
1. GKD-C Confirmation 2 gives signal
2. Confirmation 1 agrees
3. Price inside Goldie Locks Zone Minimum
4. Price inside Goldie Locks Zone Maximum
5. Volatility/Volume agrees
6. Baseline agrees
7. Confirmation 1 signal was less than 7 candles prior
1-Candle Confirmation 2 Entry
1a. GKD-C Confirmation 2 gives signal
2a. Confirmation 1 agrees
3a. Price inside Goldie Locks Zone Minimum
4a. Price inside Goldie Locks Zone Maximum
5a. Confirmation 1 signal was less than 'Maximum Allowable PSC2C Bars Back' prior
Next Candle
1b. Price retraced
2b. Confirmation 2 agrees
3b. Confirmation 1 agrees
4b. Volatility/Volume agrees
5b. Baseline agrees
PullBack Entry
1a. GKD-B Baseline gives signal
2a. Confirmation 1 agrees
3a. Price is beyond 1.0x Volatility of Baseline
Next Candle
1b. Price inside Goldie Locks Zone Minimum
2b. Price inside Goldie Locks Zone Maximum
3b. Confirmation 1 agrees
4b. Confirmation 2 agrees
5b. Volatility/Volume agrees
Continuation Entry
1. Standard Entry, 1-Candle Standard Entry, Baseline Entry, 1-Candle Baseline Entry, Volatility/Volume Entry, 1-Candle Volatility/Volume Entry, Confirmation 2 Entry, 1-Candle Confirmation 2 Entry, or Pullback entry triggered previously
2. Baseline hasn't crossed since entry signal trigger
4. Confirmation 1 agrees
5. Baseline agrees
6. Confirmation 2 agrees
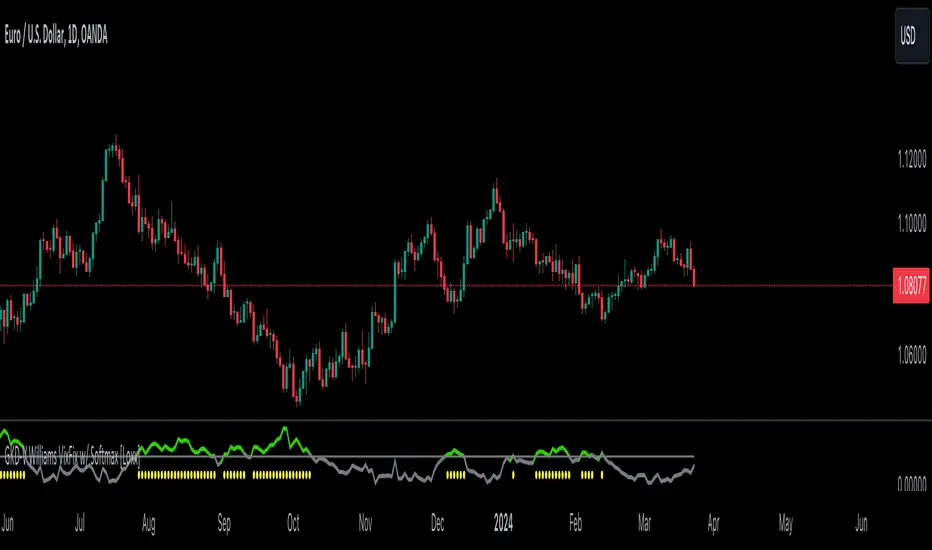
Gorb WallIntroduction:
Gorb Wall is a trading tool that offers a unique approach to market trend analysis. It extends the capabilities of the Gorb Algo indicator by presenting a multi-ticker, multi-timeframe dashboard, enabling traders to capture crucial market movements across various financial instruments without flipping through charts.
Overview:
Multi-Ticker Analysis: Monitor and analyze multiple financial instruments simultaneously.
Customizable Timeframes: Tailor the script to various timeframes to suit your trading strategy.
Gorb Algo Market Trend: An algorithm that adapts to market conditions, providing insights into trend changes.
User-Friendly Dashboard: Easily configure and customize the dashboard placement on your chart.
Color-Coded Trend Indicators: Visual cues to quickly assess bullish or bearish trends.
Optimized for Performance: Efficiently coded to ensure smooth running on TradingView without overloading resources.
How Gorb Wall Works:
The script utilizes Gorb Algo's market trend algorithm to process price and volume data across selected tickers and timeframes.
It applies a complex calculation to identify trends, using a combination of volatility analysis, momentum measurements, and trend strength indicators.
The output is a simplified visual representation on the dashboard, where colored circles indicate the trend direction, providing an at-a-glance market overview.
Unique Features:
Proprietary Algorithm: The heart of Gorb Wall lies in its unique Gorb Algo Market Trend algorithm. Unlike standard trend-following indicators, this proprietary algorithm integrates multiple technical analysis concepts (e.g., moving averages, volume data, price action, and oscillators) to provide a more comprehensive market trend analysis.
Multi-Dimensional Analysis: The script analyzes market trends by simultaneously processing data across multiple tickers and timeframes, offering a broader view of market movements than traditional single-ticker indicators.
We recommend exploring & choosing which tickers/timeframes best suits your needs and style of trading, and use that to combine with our suite of indicators.
Settings:
All skill-level friendly presets, easy to enable features with one-click
Dashboard Placement: Choose from top/bottom left/right for dashboard positioning.
Trend Speed Mode: Select the algorithm speed - Fast, Medium, Slow, Slowest.
Bullish/Bearish Trend Colors: Customize colors for trend indicators.
Additional Tickers: Input options for monitoring multiple financial instruments.
Timeframe Selection: Choose from a range of timeframes for each ticker.
How to Use
In the image below, we can see a basic example of how this indicator functions.
The dashboard displays up to three different tickers per the user's choice, with 4 different timeframes the user can choose. It that runs the algorithm line on the specified ticker & timeframe and plots a colored circle that identifies that tickers trend on the specified timeframes.
There are two colors, white for bullish trend and purple for bearish trend. These are the two consistent colors across our suit of indicators to help simplify trading by using simple color matching for confluence. Below is a continued breakdown on using this indicator:
Dynamic Trend Visualization in Real-Time Updates
The dashboard dynamically updates trend colors (white for bullish, purple for bearish) based on real-time market data, offering immediate insights into market sentiment. The next three images below these the live change in data as price action begins developing over multiple timeframes.
In the image above, we are on the 5min AAPL chart, we have SPY, QQQ, and VIX as our tickers on the dashboard with 1min, 2min, 3min, and 10min timeframes chosen. We begin to see VIX flip bullish, which can usually mean down side for indices.
We then see as AAPL's price begins to slow and reverse, we see SPY's trend following on the smaller timeframes first with VIX still leading the way indicating possible bearish change.
In the image above, we can see that price dips down and SPY & QQQ market trends have flipped bearish on all timeframes, while VIX continues to be bullish(validating the downwards price action)
Customizable Settings
Users can adjust settings such as dashboard placement, trend speed mode, and color themes to suit individual trading styles.
In the image below, we can see the dashboard placement setting offers four different locations the user can move the dashboard. Just like in Gorb Algo , the user can choose which trendline speed they want to use to best fit their trading strategy.
In the image below, we can see the "bullish trend" & "bearish trend" colors setting. These colors by default match the rest of our suite of indicators, white is bullish and purple is bearish. Users can change these color settings to meet their preferences.
In the image below, we can see there are three market ticker options that the user can change. This allows users to monitor their favorite tickers across or easily flip through multiple tickers in order to gauge their current market trends without having to change their chart
In the image below, we can see the 4 timeframes that are on the dashboard. The user has the ability to change each of those four, to whatever timeframe best suits their trading needs. There are 12 different timeframe options to choose from.
Quick Dashboard Review
Using color-coded trend detection, this quickly gauges market trends and provides a visual to easily identify these changes in real-time across multiple timeframes. When a circle changes color, this means that price has flipped that direction, causing a change in the Gorb Algo market trendline. As stated above, white is for bullish trend and purple is for bearish trend, but these colors can be changed to fit the users trading strategy and style. Each timeframe the user chooses will be updated in real-time, including the higher time frames like the daily & weekly. They have been modified to pull data a same speed the lower timeframes are.
This helps provide quick visual identification of real market trend changes as price action develops. It is best used in conjunction with other forms of technical analysis for a holistic trading approach.
Conclusion:
This indicator is designed to streamline market trend analysis, offering traders an innovative, efficient, and easy-to-use tool for making informed trading decisions. This tool complements our suite of indicators, providing unique market insights that are not typically available in traditional open-source scripts.
How to get access:
You can see the Author's instructions to get access to this indicator
RISK DISCLAIMER
All content, tools, scripts & education provided by Gorb Algo are for informational & educational purposes only. Trading is risky and most lose their money, past performance does not guarantee future results.
Ultimate Correlation CoefficientIt contains the Correlations for SP:SPX , TVC:DXY , CURRENCYCOM:GOLD , TVC:US10Y and TVC:VIX and is intended for INDEX:BTCUSD , but works fine for most other charts as well.
Don't worry about the colored mess, what you want is to export your chart ->
TradingView: How can I export chart data?
and then use the last line in the csv file to copy your values into a correlation table.
Order is:
SPX
DXY
GOLD
US10Y
VIX
Your last exported line should look like this:
2023-05-25T02:00:00+02:00 26329.56 26389.12 25873.34 26184.07 0 0.255895534 -0.177543633 0.011944815 0.613678565 0.387705043 0.696003298 0.566425278 0.877838156 0.721872645 0 -0.593674719 -0.839538073 -0.662553817 -0.873684242 -0.695764534 -0.682759656 -0.54393749 -0.858188808 -0.498548691 0 0.416552489 0.424444345 0.387084882 0.887054782 0.869918437 0.88455388 0.694720993 0.192263269 -0.138439783 0 -0.39773255 -0.679121698 -0.429927048 -0.780313396 -0.661460134 -0.346525721 -0.270364046 -0.877208139 -0.367313687 0 -0.615415111 -0.226501775 -0.094827955 -0.475553396 -0.408924242 -0.521943234 -0.426649404 -0.266035908 -0.424316191
The zeros are thought as a demarcation for ease of application :
2023-05-25T02:00:00+02:00 26329.56 26389.12 25873.34 26184.07 0 -> unused
// 15D 30D 60D 90D 120D 180D 360D 600D 1000D
0.255895534 -0.177543633 0.011944815 0.613678565 0.387705043 0.696003298 0.566425278 0.877838156 0.721872645 -> SPX
0
-0.593674719 -0.839538073 -0.662553817 -0.873684242 -0.695764534 -0.682759656 -0.54393749 -0.858188808 -0.498548691 -> DXY
0
0.416552489 0.424444345 0.387084882 0.887054782 0.869918437 0.88455388 0.694720993 0.192263269 -0.138439783 -> GOLD
0
-0.39773255 -0.679121698 -0.429927048 -0.780313396 -0.661460134 -0.346525721 -0.270364046 -0.877208139 -0.367313687 -> US10Y
0
-0.615415111 -0.226501775 -0.094827955 -0.475553396 -0.408924242 -0.521943234 -0.426649404 -0.266035908 -0.424316191 -> VIX

TradeWithAB Signal IndicatorThis indicator specifically designed for Momentum trading by an Intraday trader on index( Nifty , BankNifty ) and Equity stocks. This indicator works with DMI and PRICE ACTIONS which gives automated Buy and Sell signals along with Stop loss and Trailing Stop loss when certain criteria are met. It is not a Holy Grail system that gives you continuous profits and it has some limited downfalls also which can be controlled by proper risk Management and position sizing. This is a premium invite only indicator which can be use after given access to you by us. There are some guidelines on how to use this indicator which are given below and you have to follow these guidelines very strictly to get the maximum results.
Guidelines :-
1. Timeframe - 5 min
2. Period should be changed on daily basis(if required) for index trading.
3. Period value would be basically derived from IND VIX value (closest integer) divided by 2.
Ex 1. If the VIX value is 23.56, then it will be consider as 24. So the period value will be 24/2= 12.
Ex 2. If the VIX value is 23.10, then it will be considered as 24. So the period value will be 24/2= 12.
Ex 3. If the VIX value is 22.88, then it will be considered as 22. So the period value will be 22/2= 11.
4. Period value should be fixed at 20 for equity stocks.
5. DO NOT take any SWING or POSITIONAL trade with this indicator.
6. You have to take almost all the trade generated by this indicator on a particular stock/index for better results.
7. Signal confirmation is required for enter the trade as it will give you maximum profits.
8. GREEN TRIANGLE is represented as BUY Signal whereas RED TRIANGLE is represented as SELL Signal.
9. GREEN ARROW is considered as BUY TRAILING STOP LOSS as well as BUY RE-ENTRY for some scenarios.
10. RED ARROW is considered as SELL TRAILING STOP LOSS and SELL RE-ENTRY for some scenarios.
11. You have to avoid entering a trade on a round level zone. Eg- Banknifty 37000,35500,40000 etc etc.
BUY Trade Management :-
1. Trade should be initiated if and only if there is a buy signal(Green Triangle) is generated with confirmation of its respective indices (Recent candle of respective index should be similar to the signal candle).
*in case of BankNifty , Nifty will be its respective index and vice-versa.
2. You should only enter the trade at the CLOSE of the signal generated candle.
3. Your Stop loss should be placed at the LOW of the signal generated candle.
4. There is a trailing Stop loss signal (Green Arrow) after the buying signal is generated.
5. You should trail your Stop loss at the LOW of the trailing Stop loss signal generated candle.
6. You should trail your Stop loss repeatedly until your trailing Stop loss got hit and hence Exit your buy trade.
7. After Exiting the trade you have always option to re-enter at the next trailing Stop loss signal(green arrow) generated candle CLOSE and put your Stop loss at LOW of that candle and repeat the same trailing stop loss procedures.
SELL Trade Management :-
1. Trade should be initiated if and only if there is a sell signal(Red Triangle) is generated with confirmation of its respective indices (Recent candle of respective index should be similar to the signal candle).
*in case of BankNifty , Nifty will be its respective index and vice-versa.
2. You should only enter the trade at the CLOSE of the signal generated candle.
3. Your Stop loss should be placed at the HIGH of the signal generated candle.
4. There is a trailing Stop loss signal (Red Arrow) after the selling signal is generated.
5. You should trail your Stop loss at the HIGH of the trailing Stop loss signal generated candle.
6. You should trail your Stop loss repeatedly until your trailing Stop loss got hit and hence Exit your sell trade.
7. After Exiting the trade you have always option to re-enter at the next trailing Stop loss signal(red arrow) generated candle CLOSE and put your Stop loss at HIGH of that candle and repeat the same trailing stop loss procedures.
Disclaimer :-
*I am not a SEBI Registered Analyst and shall not be liable for any profit, loss or liability resulting, directly or indirectly from the use and results of the indicator. This is not a Holy Grail setup, sometimes the traders hit Stop loss and sometimes it gives amazing results as well.
Instructions to access to this invite-only script:-
*Send us a message if you wish to gain access to this indicator. The subscribers will get benefits of any future development or updates in the current script without any extra charges. Other trading style like swing and positional trading will also available in future updates.

SPY Ninja
SPY Ninja correlates the true strength index exponential moving averages of SPY and VIX together. In doing so we can determine the start of trend shifts via SPY / VIX convergence in addition to crossover, with potential market entries and exits represented by the LONG and SELL signals.
SMMA 50,100, and 200 have been added to chart due to the historic SPY market reactivity to these moving averages. They often act as natural support and resistance levels with SPY, and when coinciding LONG and SHORT signals appear touching any of these levels, it adds an extra layer of confidence for traders' decisions. Also, by highlighting the areas on our SPY chart (red background areas) that represent a VIX threshold higher than 25, we can bring attention to areas with potentially higher volatility immediately so that traders know to proceed with caution.
SPY Ninja works harmoniously with the SPY Ninja Oscillator; Ninja provides the signals highlighting risky VIX areas of concern, while the Ninja Oscillator adds an additional 3 levels of potential confirmation for your trade decisions.
RSI and market strength with alerts By combining the true strength of the Nasdaq (NDX) and S&P500 ( SPY ) we can then compare that against the volatility /fear index ( VIX ). The true strength of the Volatility Index ( VIX ) is shown by the red area and the Nasdaq (NDX) and S&P500 ( SPY ) by the silver /teal areas.
The yellow EMA area shows the average difference between the VIX and the NDX/ SPY indexes. When the yellow area crosses above the zero line and is climbing it means that the NDX/ SPY are strengthening. When the yellow area is decreasing or crosses under the zero line it means the fear/volatility index ( VIX ) is becoming stronger and NDX/ SPY are weakening. The RSI is overlaid as a white line to show the correlation of the instrument strength compared to the market.
When looking at charts of companies/components listed on the Nasdaq and/or S&P 500 you will notice a frequent correlation between the movement of the yellow area depicting index health and the RSI of the chart you are viewing. It’s a very quick and effective method of seeing the strength and fear within the market indexes and how they are effecting your chart.
The background color changes when the market strength combined with the active symbol RSI and higher timeframe MACD signals are aligned. Green is a buy zone, Red is a sell zone.
There are also red and green indicator x’s at the top/bottom of the indicator. They show a drastic change in Relative strength within a short period. This often indicates a buy or sell opportunity.
It is tested and works well on all timeframes with Stocks listed on NASDAQ & S&P500 .
Buy, Sell, Exit Buy and Exit Sell alerts are included.
There are also red and green indicator x’s at the top/bottom of the indicator. They show a drastic change in Relative strength within a short period. This often indicates a buy or sell opportunity.

Market Index Strength by Keiron RichieBy combining the true strength of the Nasdaq (NDX) and S&P500 (SPY) we can then compare that against the volatility /fear index (VIX). The true strength of the Volatility Index (VIX) is shown by the red area and the Nasdaq (NDX) and S&P500 (SPY) by the silver/teal areas.
The yellow EMA line shows the average difference between the VIX and the NDX/SPY indexes. When the yellow line crosses above the zero line and is climbing it means that the NDX/SPY are strengthening. When the yellow line is decreasing or crosses under the zero line it means the fear (VIX) is becoming stronger and NDX/SPY are weakening.
When looking at charts of companies/components listed on the Nasdaq and/or S&P 500 you will notice a frequent correlation between the movement of the yellow line depicting index health and the strength of the chart you are viewing. It’s a very quick and effective method of seeing the strength and fear within the market indexes and how they are effecting your chart.
The background color changes based on the market strength combined with the active symbol true strength. Green is a buy zone, Red is a sell zone.
It is tested and works well on all timeframes with Stocks listed on NASDAQ & S&P500. It does not include buy/sell alerts.

CM_Williams_Vix_Fix_V3_Ultimate_Filtered_AlertsNew Williams Vix Fix - Major Update - Filtered Entries - Additional Alerts - And Much More...
***01-05-2015 Major Updates Include:
***ALL Features Available To Turn On/Off On The INPUTS Tab!!!
FILTERED ENTRIES -- Plus AGGRESSIVE FILTERED ENTRIES - HIGHLIGHT BARS AND ALERTS
*Alerts Enabled for 4 Different Criteria
*Ability To Plot Alerts True/False Conditions on top of the WVF Histogram
*Ability To Turn Off the Histogram and just see True/False Alerts Conditions.
*Ability to Turn All Price Bars Gray, and Color the Price Bars to Match the WVF Colors Exactly, Including All 3 Entry Types.
*Added Inputs To Adjust the 3 Numerical Inputs That Define The PRICE ACTION FILTER! Explained in Video.
*Main Video is 34 Minutes…However, the New Features Are Extensive and I Go Thru All Features In Depth.
*I Recommend Using the VSTOP Indicator. I Go Through How To Customize It In Video.
Videos:
Video: The Evolution of the Williams Vix Fix - 12 Minutes.
vimeopro.com
Video: Williams Vix Fix V3 - Major Update - Additional Alerts and Filtered Entries - 34 Minutes.
***Video Covers In Detail How To Use The Multiple Alerts And Plot Styles Available.
vimeopro.com
Posts To Reference…
New Video on How to Create Alerts W/ Any Custom Indicator.
www.tradingview.com
Great Confirming Indicator for the Williams Vix Fix
CM_WILLIAMS_VIX_FIX FINDS MARKET BOTTOMS

ActivTrades US Market Pulse – Ion JaureguiActivTrades US Market Pulse Indicator – Detailed Description
The ActivTrades US Market Pulse Indicator is a market analysis tool designed to assess overall risk sentiment in U.S. financial markets. Rather than generating trade signals, it provides a snapshot of the prevailing market environment, helping traders and analysts understand whether conditions favor risk-taking or caution.
How it Works:
The indicator combines three key market metrics:
1. Sector Momentum:
o Compares the performance of cyclical sectors (e.g., technology, consumer discretionary, industrials) with defensive sectors (e.g., utilities, consumer staples, healthcare) relative to their 50-day moving averages.
o Stronger cyclical sector performance indicates higher market risk tolerance, while stronger defensive sector performance suggests increased risk aversion.
2. Volatility Measure – VIX Index:
o Incorporates the CBOE Volatility Index (VIX), a widely used gauge of market fear.
o Higher VIX levels indicate elevated uncertainty and a risk-off environment, whereas lower levels suggest calmer markets and greater investor confidence.
3. Interest Rate Spread:
o Monitors the yield difference between the 10-year and 2-year U.S. Treasury bonds.
o A wider spread typically reflects economic optimism and greater risk appetite, while a narrower or inverted spread signals caution.
Risk Sentiment Index:
• Each metric is assigned points based on its level, which are then combined to create an index representing overall market sentiment.
• The index oscillates between Risk-On (high risk appetite) and Risk-Off (heightened caution), with a neutral zone for balanced conditions.
Visual Output:
• The results are displayed as a colored histogram, making it easy to interpret market sentiment at a glance.
• Labeled zones include:
o Extreme Risk-On: Indicates a strong risk-taking environment.
o Extreme Risk-Off: Reflects heightened fear or uncertainty.
o Neutral Zone: Suggests a balanced or mixed market sentiment.
Purpose and Use:
• Helps traders, analysts, and investors gauge the prevailing mood of the market.
• Provides context for risk management and strategic positioning without offering explicit trade recommendations.
*******************************************************************************************
The information provided does not constitute investment research. The material has not been prepared in accordance with the legal requirements designed to promote the independence of investment research and such should be considered a marketing communication.
All information has been prepared by ActivTrades ("AT"). The information does not contain a record of AT's prices, or an offer of or solicitation for a transaction in any financial instrument. No representation or warranty is given as to the accuracy or completeness of this information.
Any material provided does not have regard to the specific investment objective and financial situation of any person who may receive it. Past performance and forecasting are not a synonym of a reliable indicator of future performance. AT provides an execution-only service. Consequently, any person acting on the information provided does so at their own risk. Political risk is unpredictable. Central bank actions can vary. Platform tools do not guarantee success.
INDICATORS RISK ADVICE: The information and publications are not meant to be, and do not constitute, financial, investment, trading, or other types of advice or recommendations supplied or endorsed by ActivTrades. This script intends to help follow the trend and filter out market noise. This script is meant for the use of international users. This script is not meant for the use of Spain users.
Big Mo’s Glaskugel — Macro Drawdown Risk (v1.1.2)What it does / what you see
An at-a-glance drawdown-risk oscillator that blends several macro US signals.
• A smooth, color-blended line (green→orange→red) shows the scaled risk score (0–100).
• Subtle shading marks “re-steepen warning windows” (starts when the yield curve re-steepens after an inversion; ends on normalization/cool-down).
• A compact status table summarizes: overall risk level, Yield Curve (10y–3m), Credit Stress (Baa–10y), Economy (LEI), and Valuation (CAPE).
Data used & why
Yield Curve (10y–3m) — FRED:T10Y3M. Inversions and subsequent re-steepens often precede recessions/equity drawdowns.
Credit Stress — FRED:BAA10Y vs its 1-year average (deviation in bps). Widening credit spreads flag tightening financial conditions.
Economy (LEI) — ECONOMICS:USLEI. 6-month annualized growth below a cutoff highlights macro deterioration.
Valuation (CAPE) — SHILLER_PE_RATIO_MONTH. Elevated valuations can amplify downside risk.
VIX spikes — optional boost that recognizes sudden risk repricings.
Important disclaimer
This is not a reliable or predictive indicator in all regimes. No guarantees or warranties of any kind are provided. It is not financial advice. Signals can be early, late, or wrong.
That said, it leans on well-studied warning factors (yield-curve dynamics, credit spreads, LEI weakness, valuation extremes) that have flagged major market downturns in the past.
Key customization / tweaks
Weights for each component (Yield, Credit, LEI, VIX, CAPE).
Thresholds: yield inversion months, re-steepen lookback, credit-stress bps, LEI cutoff, CAPE level, VIX spike levels.
Re-steepen boost: enable/disable, base points, half-life decay.
Shading behavior: cool-down bars to “unwarn,” max warning duration, only shade when risk ≠ green.
Scaling & smoothing: dynamic rolling max, EMA length, yellow/red thresholds.
Status table: position, and a snapshot mode to view values at a chosen historical time.

Volatility Strategy 01a quantitative volatility strategy (especially effective in trend direction on the 15min chart on the s&p-index)
the strategy is a rule-based setup, which dynamically adapts to the implied volatility structure (vx1!–vx2!)
context-dependent mean reversion strategy based on multiple timeframes in the vix index
a signal is provided under following conditions:
1. the vvix/vix spread has deviated significantly beyond one standard deviation
2. the vix is positioned above or below 3 moving averages on 3 minor timeframes
3. the trade direction is derived from the projected volatility regime, measured via vx1! and vx2! (cboe)

SHYY TFC SPX Sectors list This script provides a clean, configurable table displaying real-time data for the major SPX sectors, key indices, and market sentiment indicators such as VIX and the 10-year yield (US10Y).
It includes 16 columns with two rows:
* The top row shows the sector/asset symbol.
* The bottom row shows the most recent daily close price.
Each price cell is dynamically color-coded based on:
* Direction (green/red) during regular trading hours
* Separate colors during extended hours (pre-market or post-market)
* VIX values greater than 30 trigger a distinct background highlight
Users can fully control the position of the table on the chart via input settings. This flexibility allows traders to place the table in any screen corner or center without overlapping key price action.
The script is designed for:
* Monitoring broad market health at a glance
* Understanding sector performance in real-time
* Spotting risk-on/risk-off behavior (via SPY, QQQ, VIX, US10Y)
Unlike traditional watchlists, this table visually encodes directional movement and trading session context (regular vs. extended hours), making it highly actionable for intraday, swing, or macro-level analysis.
All data is pulled using `request.security()` on daily candles and uses pure Pine logic without external dependencies.
To use:
1. Add the indicator to your chart.
2. Adjust the table position via the input dropdown.
3. Read sector strength or weakness directly from the table.

ES OHLC BASED ON 9:301. RTH Price Levels
YC (Yesterday's Close): Previous day's RTH closing price at 4:00 PM ET
0DTE-O (Today's Open): Current day's RTH opening price at 9:30 AM ET
T-E-M (Today's Europe-Asia Midpoint): Midpoint of overnight session high/low
T-E-R (Today's Europe-Asia Resistance): Overnight session high
T-E-S (Today's Europe-Asia Support): Overnight session low
Y-T-M (Yesterday-Today Midpoint): Midpoint between YC and 0DTE-O
2. Previous Bar Percentage Levels
Displays 50% retracement level for all bars
Shows 70% level for bullish bars (close > open)
Shows 30% level for bearish bars (close < open)
Lines automatically update with each new bar
3. Custom Support/Resistance Lines
Up to 4 customizable horizontal levels (2 resistance, 2 support)
Useful for marking key psychological levels or pivot points
4. VIX-Based Options Strategy Suggestions
Real-time VIX value display
Time Zone Handling
The indicator is configured for Central Time (CT) as Pine Script's default:
RTH Open: 8:30 AM CT (9:30 AM ET)
RTH Close: 3:00 PM CT (4:00 PM ET)
Overnight session: 7:00 PM CT to 8:30 AM CT next day
Usage Notes
Chart Requirement: This indicator only works on 5-minute timeframe charts
Auto-refresh: All lines and labels automatically refresh at each new trading day's RTH open
24-hour Market: Designed for ES futures which trade nearly 24 hours
Visual Clarity: Different line styles and colors for easy identification
Ideal For
Day traders focusing on ES futures
0DTE options traders needing key reference levels
Traders using overnight gaps and previous day's levels
Those incorporating VIX-based strategies in their trading
