Egg vs Tennis Ball — Drop/Rebound StrengthEgg vs Tennis Ball — Drop/Rebound Meter
What it does
Classifies selloffs as either:
Eggs — dead‑cat, no bounce
Tennis Balls — fast, decisive rebound
Core features
Detects swing drops from a Pivot High (PH) to a Pivot Low (PL)
Requires drops to be meaningful (volatility‑aware, ATR‑scaled)
Draws a bounce threshold line and a deadline
Decides outcome based on speed and extent of rebound
Tracks scores and win rates across multiple lookback windows
Includes a color‑coded meter and current streak display
Visuals at a glance
Gray diagonal — drop from PH to PL
Teal dotted horizontal — bounce threshold, from PH to the deadline
Solid green — Tennis Ball (bounce line broken before the deadline)
Solid red — Egg (deadline expired before the bounce)
Optional PH / PL labels for clarity
How the decision is made
1) Find pivots — symmetric pivots using Pivot Left / Right; PL confirms after Right bars.
2) Qualify the drop — Drop Size = PH − PL; must be ≥ (Drop Threshold × ATR at PL).
3) Define the bounce line — PL + (Bounce Multiple × Drop Size). 1.00× = full retrace to PH; up to 2.00× for overshoot.
4) Set the deadline — Drop Bars = PL index − PH index; Deadline = Drop Bars × Recovery Factor; timer starts from PH or PL.
5) Resolve — Tennis Ball if price hits the bounce line before the deadline; Egg if the deadline passes first.
Scoring system (−100 to +100)
+100 = perfect Tennis Ball (fastest possible + full overshoot)
−100 = perfect Egg (no recovery)
In between: scored by rebound speed and extent, shaped by your weight settings
Meter Table
Columns (toggle on/off)
All (off by default)
Last N1 (default 5)
Last N2 (default 10)
Last N3 (default 20)
Rows
Tennis / Eggs — counts
% Tennis — win rate
Avg Score — normalized quality from −100 to +100
Streak — overall (not windowed), e.g., +3 = 3 Tennis Balls in a row, −4 = 4 Eggs in a row
Alerts
Tennis Ball – Fast Rebound — triggers when the bounce line is broken in time
Egg – Window Expired — triggers when the deadline passes without a bounce
Inputs
① Drop Detection
Pivot Left / Right
ATR Length
Drop Threshold × ATR
② Bounce Requirement
Bounce Multiple × Drop Size (0.10–2.00×)
③ Timing
Timer Start — PH or PL
Recovery Factor × Drop Bars
Break Trigger — Close or High
④ Display
Show Pivot/Outcome Labels
Line Width
Table Position (corner)
⑤ Meter Columns
Show All (off by default)
Show N1 / N2 / N3 (5, 10, 20 by default)
⑥ Scoring Weights
Tennis — Base, Speed, Extent
Egg — Base, Strength
How to use it
Pick strictness — start with Drop Threshold = 2.0 ATR, Bounce Multiple = 1.0×, Recovery Factor = 3.0×; adjust to timeframe and volatility.
Watch the dotted line — it ends at the deadline; turns solid green (Tennis) if broken in time, solid red (Egg) if it expires.
Read the meter — short windows (5–10) show current behavior; Avg Score captures quality; Streak shows momentum.
Blend with your system — combine with trend filters, volume, or regime detection.
Tips
Close vs High trigger: Close is stricter; High is more responsive.
PH vs PL timer start: PH measures round‑trip; PL measures recovery only.
Increase pivot strength for fewer, more reliable signals.
Higher timeframes generally produce cleaner patterns.
Defaults
Pivot L/R: 5 / 5
ATR Length: 14
Drop Threshold: 2.0× ATR
Bounce Multiple: 1.00×
Recovery Factor: 3.0×
Break Trigger: Close
Windows: Last 5, 10, 20 (All off)
Interpreting results
Tennis‑y: Avg Score +30 to +70, %Tennis > 55%
Mixed: Avg Score near 0
Egg‑y: Avg Score −30 to −80, %Tennis < 45%
ค้นหาในสคริปต์สำหรับ "trigger"
Rifle UnifiedThis script is designed for use on 30-second charts of Dow Jones-related symbols (YM, MYM, US30). It provides automated buy and sell signals using a combination of price action, RSI (Relative Strength Index), and volume analysis. The script is intended for both live trading signals and backtesting, with configurable risk management and debugging features.
Core Functionality
1. Signal Generation Logic
Trigger: The algorithm looks for a sharp price move (drop or rise) of a user-defined threshold (default: 80 points) within a specified lookback window (default: 20 minutes).
Levels: It monitors for price drops below specific numerical levels ending in 23, 43, or 73 (e.g., 42223, 42273).
RSI Condition: When price falls below one of these levels and the RSI is below 30, the setup is considered active.
Buy Signal: A buy is triggered if, after setup:
Price rises back above the level,
The RSI rate of change (ROC) indicates exhaustion of the drop,
The current bar shows positive momentum.
2. Trade Management
Stop Loss & Take Profit: Configurable fixed or trailing stop loss and take profit levels are plotted and managed automatically.
Exit Signals: The script signals exit based on price action relative to these risk management levels.
3. Filters & Enhancements
Parabolic Move Filter: Prevents entries during extreme price moves.
Dead Cat Bounce Filter: Avoids false signals after sharp reversals.
Volume Filter: Optionally requires volume conditions for trade entries (especially for shorts).
Multiple Confirmation Layers : Includes checks for 5-minute RSI, momentum, and price retracement.
User Inputs & Customization
Trade Direction: Toggle between LONG and SHORT signal generation.
Trigger Settings: Adjust thresholds for price moves, lookback windows, RSI ROC, and volume requirements.
Trade Settings: Set take profit, stop loss, and trailing stop behavior.
Debug & Visualization: Enable or disable various plots, labels, and debug tables for in-depth analysis.
Backtesting: Integrated backtester with summary and detailed statistics tables.
Technical Features
Uses External Libraries: Relies on RifleShooterLib for core logic and BackTestLib for backtesting and statistics.
Multi-timeframe Analysis: Incorporates both 30-second and 5-minute RSI calculations.
Chart Annotations: Plots entry/exit points, risk levels, and debug information directly on the chart.
Alert Conditions: Built-in alert triggers for key events (initial move, stall, entry).
Intended Use
Markets: Dow Jones symbols (YM, MYM, US30, or US30 CFD).
Timeframe: 30-second chart.
Purpose: Automated signal generation for discretionary or algorithmic trading, with robust risk management and backtesting support.
Notable Customization & Extension Points
Momentum Calculation: Plans to replace the current momentum measure with "sqz momentum".
Displacement Logic: Future update to use "FVG concept" for displacement.
High-Contrast RSI: Optional visual enhancements for RSI extremes.
Time-based Stop: Consideration for adding a time-based stop mechanism.
This script is highly modular, with extensive user controls, and is suitable for both live trading and historical analysis of Dow Jones index movements

Volume Spike Alert & Overlay"Volume Spike Alert & Overlay" highlights unusually high trading volume on a chart. It calculates whether the current volume exceeds a user-defined percentage above the historical average and triggers an alert if it does. The information is also displayed in a customizable on-screen table.
What It Does
Monitors volume for each bar and compares it to an average over a user-defined lookback period.
Supports multiple smoothing methods (SMA, EMA, WMA, RMA) for calculating the average volume.
Triggers an alert when current volume exceeds the threshold percentage above the average.
Displays a table on the chart with:
Current Volume
Average Volume
Threshold Percentage
Optional empty row for spacing/formatting
How It Works
User Inputs:
lookbackPeriods: Number of bars used to calculate the average volume.
thresholdPercent: % above the average that triggers a volume spike alert.
smoothingType: Type of moving average used for volume calculation.
textColor, bgColor: Formatting for the display table.
tablePositionInput: Where the table appears on the chart (e.g., Bottom Right).
Toggles for showing/hiding parts of the table.
Volume Calculations:
Calculates current bar's volume.
Calculates average volume using the selected smoothing method.
Computes the threshold: avgVol * (1 + thresholdPercent / 100).
Compares current volume to threshold.
Table Display:
Dynamically creates a table with volume stats.
Adds rows based on user preferences.
Alerts:
alertcondition fires when currentVol crosses above the calculated threshold.
Message: "Volume Threshold Exceeded"
Usage Examples
Example 1: Spotting High Activity
Apply the script to a stock like AAPL on a 5-minute chart.
Set lookbackPeriods to 20 and thresholdPercent to 30.
Use EMA for more reactive volume tracking.
When volume spikes more than 30% above the 20-period EMA, an alert triggers.
Example 2: Day Trading Filter
For scalpers, apply it to a 1-minute crypto chart (e.g., BTC/USDT).
Set thresholdPercent to 50 to catch only strong surges.
Position the table at the top left and reduce visible info for a clean layout.
Example 3: Long-Term Context
On a daily chart, use SMA and set lookbackPeriods to 50.
Helps identify breakout moves supported by strong volume.
How this is different from Trading View's Volume indicator:
The standard volume plot from trading view allows users to set a alert when the average line is crossed, but it does not allow you to set a custom percentage at which to trigger an alert. This indicator will allow you to set any percentage you wish to monitor and above that percentage threshold will trigger your alert.
===== ORIGINAL DESCRIPTION =====
Volume Spike Alert & Overlay
This indicator will display the following as an overlay on your chart:
Current volume
Average Volume
Threshold for Alert
Description:
This indicator will display the current bar volume based on the chart time frame,
display the average volume based on selected conditions,
allow user selectable threshold over the average volume to trigger an alert.
Options:
Average lookback period
Smoothing type
Alert Threshold %
Enable / Disable Each Value
Change Text Color
Change Background Color
Change Table location
Add/Remove extra row for placement in top corner
Usage Example:
I use this indicator to alert when the current volume exceeds the average volume by a specified percentage to alert to volume spikes.
Set the threshold to 25% in the settings
Create an alert by clicking on the 3 dots on the right of the indicator title on the chart
When the threshold is exceeded the alert will trigger

REVELATIONS (VoVix - PoC) REVELATIONS (VoVix - POC): True Regime Detection Before the Move
Let’s not sugarcoat it: Most strategies on TradingView are recycled—RSI, MACD, OBV, CCI, Stochastics. They all lag. No matter how many overlays you stack, every one of these “standard” indicators fires after the move is underway. The retail crowd almost always gets in late. That’s never been enough for my team, for DAFE, or for anyone who’s traded enough to know the real edge vanishes by the time the masses react.
How is this different?
REVELATIONS (VoVix - POC) was engineered from raw principle, structured to detect pre-move regime change—before standard technicals even light up. We built, tested, and refined VoVix to answer one hard question:
What if you could see the spike before the trend?
Here’s what sets this system apart, line-by-line:
o True volatility-of-volatility mathematics: It’s not just "ATR of ATR" or noise smoothing. VoVix uses normalized, multi-timeframe v-vol spikes, instantly detecting orderbook stress and "outlier" market events—before the chart shows them as trends.
o Purist regime clustering: Every trade is enabled only during coordinated, multi-filter regime stress. No more signals in meaningless chop.
o Nonlinear entry logic: No trade is ever sent just for a “good enough” condition. Every entry fires only if every requirement is aligned—local extremes, super-spike threshold, regime index, higher timeframe, all must trigger in sync.
o Adaptive position size: Your contracts scale up with event strength. Tiny size during nominal moves, max leverage during true regime breaks—never guesswork, never static exposure.
o All exits governed by regime decay logic: Trades are closed not just on price targets but at the precise moment the market regime exhausts—the hardest part of systemic trading, now solved.
How this destroys the lag:
Standard indicators (RSI, MACD, OBV, CCI, and even most “momentum” overlays) simply tell you what already happened. VoVix triggers as price structure transitions—anyone running these generic scripts will trade behind the move while VoVix gets in as stress emerges. Real alpha comes from anticipation, not confirmation.
The visuals only show what matters:
Top right, you get a live, live quant dashboard—regime index, current position size, real-time performance (Sharpe, Sortino, win rate, and wins). Bottom right: a VoVix "engine bar" that adapts live with regime stress. Everything you see is a direct function of logic driving this edge—no cosmetics, no fake momentum.
Inputs/Signals—explained carefully for clarity:
o ATR Fast Length & ATR Slow Length:
These are the heart of VoVix’s regime sensing. Fast ATR reacts to sharp volatility; Slow ATR is stability baseline. Lower Fast = reacts to every twitch; higher Slow = requires more persistent, “real” regime shifts.
Tip: If you want more signals or faster markets, lower ATR Fast. To eliminate noise, raise ATR Slow.
o ATR StdDev Window: Smoothing for volatility-of-volatility normalization. Lower = more jumpy, higher = only the cleanest spikes trigger.
Tip: Shorten for “jumpy” assets, raise for indices/futures.
o Base Spike Threshold: Think of this as your “minimum event strength.” If the current move isn’t volatile enough (normalized), no signal.
Tip: Higher = only biggest moves matter. Lower for more signals but more potential noise.
o Super Spike Multiplier: The “are you sure?” test—entry only when the current spike is this multiple above local average.
Tip: Raise for ultra-selective/swing-trading; lower for more active style.
Regime & MultiTF:
o Regime Window (Bars):
How many bars to scan for regime cluster “events.” Short for turbo markets, long for big swings/trends only.
o Regime Event Count: Only trade when this many spikes occur within the Regime Window—filters for real stress, not isolated ticks.
Tip: Raise to only ever trade during true breakouts/crashes.
o Local Window for Extremes:
How many bars to check that a spike is a local max.
Tip: Raise to demand only true, “clearest” local regime events; lower for early triggers.
o HTF Confirm:
Higher timeframe regime confirmation (like 45m on an intraday chart). Ensures any event you act on is visible in the broader context.
Tip: Use higher timeframes for only major moves; lower for scalping or fast regimes.
Adaptive Sizing:
o Max Contracts (Adaptive): The largest size your system will ever scale to, even on extreme event.
Tip: Lower for small accounts/conservative risk; raise on big accounts or when you're willing to go big only on outlier events.
o Min Contracts (Adaptive): The “toe-in-the-water.” Smallest possible trade.
Tip: Set as low as your broker/exchange allows for safety, or higher if you want to always have meaningful skin in the game.
Trade Management:
o Stop %: Tightness of your stop-loss relative to entry. Lower for tighter/safer, higher for more breathing room at cost of greater drawdown.
o Take Profit %: How much you'll hold out for on a win. Lower = more scalps. Higher = only run with the best.
o Decay Exit Sensitivity Buffer: Regime index must dip this far below the trading threshold before you exit for “regime decay.”
Tip: 0 = exit as soon as stress fails, higher = exits only on stronger confirmation regime is over.
o Bars Decay Must Persist to Exit: How long must decay be present before system closes—set higher to avoid quick fades and whipsaws.
Backtest Settings
Initial capital: $10,000
Commission: Conservative, realistic roundtrip cost:
15–20 per contract (including slippage per side) I set this to $25
Slippage: 3 ticks per trade
Symbol: CME_MINI:NQ1!
Timeframe: 1 min (but works on all timeframes)
Order size: Adaptive, 1–3 contracts
No pyramiding, no hidden DCA
Why these settings?
These settings are intentionally strict and realistic, reflecting the true costs and risks of live trading. The 10,000 account size is accessible for most retail traders. 25/contract including 3 ticks of slippage are on the high side for NQ, ensuring the strategy is not curve-fit to perfect fills. If it works here, it will work in real conditions.
Tip: Set to 1 for instant regime exit; raise for extra confirmation (less whipsaw risk, exits held longer).
________________________________________
Bottom line: Tune the sensitivity, selectivity, and risk of REVELATIONS by these inputs. Raise thresholds and windows for only the best, most powerful signals (institutional style); lower for activity (scalpers, fast cryptos, signals in constant motion). Sizing is always adaptive—never static or martingale. Exits are always based on both price and regime health. Every input is there for your control, not to sell “complexity.” Use with discipline, and make it your own.
This strategy is not just a technical achievement: It’s a statement about trading smarter, not just more.
* I went back through the code to make sure no the strategy would not suffer from repainting, forward looking, or any frowned upon loopholes.
Disclaimer:
Trading is risky and carries the risk of substantial loss. Do not use funds you aren’t prepared to lose. This is for research and informational purposes only, not financial advice. Backtest, paper trade, and know your risk before going live. Past performance is not a guarantee of future results.
Expect more: We’ll keep pushing the standard, keep evolving the bar until “quant” actually means something in the public code space.
Use with clarity, use with discipline, and always trade your edge.
— Dskyz , for DAFE Trading Systems

Parsifal.Swing.TrendScoreThe Parsifal.Swing.TrendScore indicator is a module within the Parsifal Swing Suite, which includes a set of swing indicators such as:
• Parsifal Swing TrendScore
• Parsifal Swing Composite
• Parsifal Swing RSI
• Parsifal Swing Flow
Each module serves as an indicator facilitating judgment of the current swing state in the underlying market.
________________________________________
Background
Market movements typically follow a time-varying trend channel within which prices oscillate. These oscillations—or swings—within the trend are inherently tradable.
They can be approached:
• One-sidedly, aligning with the trend (generally safer), or
• Two-sidedly, aiming to profit from mean reversions as well.
Note: Mean reversions in strong trends often manifest as sideways consolidations, making one-sided trades more stable.
________________________________________
The Parsifal Swing Suite
The modules aim to provide additional insights into the swing state within a trend and offer various trigger points to assist with entry decisions.
All modules in the suite act as weak oscillators, meaning they fluctuate within a range but are not bounded like true oscillators (e.g., RSI, which is constrained between 0% and 100%).
________________________________________
The Parsifal.Swing.TrendScore – Specifics
The Parsifal.Swing.TrendScore module combines short-term trend data with information about the current swing state, derived from raw price data and classical technical indicators. It provides an indication of how well the short-term trend aligns with the prevailing swing, based on recent market behavior.
________________________________________
How Swing.TrendScore Works
The Swing.TrendScore calculates a swing score by collecting data within a bin (i.e., a single candle or time bucket) that signals an upside or downside swing. These signals are then aggregated together with insights from classical swing indicators.
Additionally, it calculates a short-term trend score using core technical signals, including:
• The Z-score of the price's distance from various EMAs
• The slope of EMAs
• Other trend-strength signals from additional technical indicators
These two components—the swing score and the trend score—are then combined to form the Swing.TrendScore indicator, which evaluates the short-term trend in context with swing behavior.
________________________________________
How to Interpret Swing.TrendScore
The trend component enhances Swing.TrendScore’s ability to provide stronger signals when the short-term trend and swing state align.
It can also override the swing score; for example, even if a mean reversion appears to be forming, a dominant short-term trend may still control the market behavior.
This makes Swing.TrendScore particularly valuable for:
• Short-term trend-following strategies
• Medium-term swing trading
Unlike typical swing indicators, Swing.TrendScore is designed to respond more to medium-term swings rather than short-lived fluctuations.
________________________________________
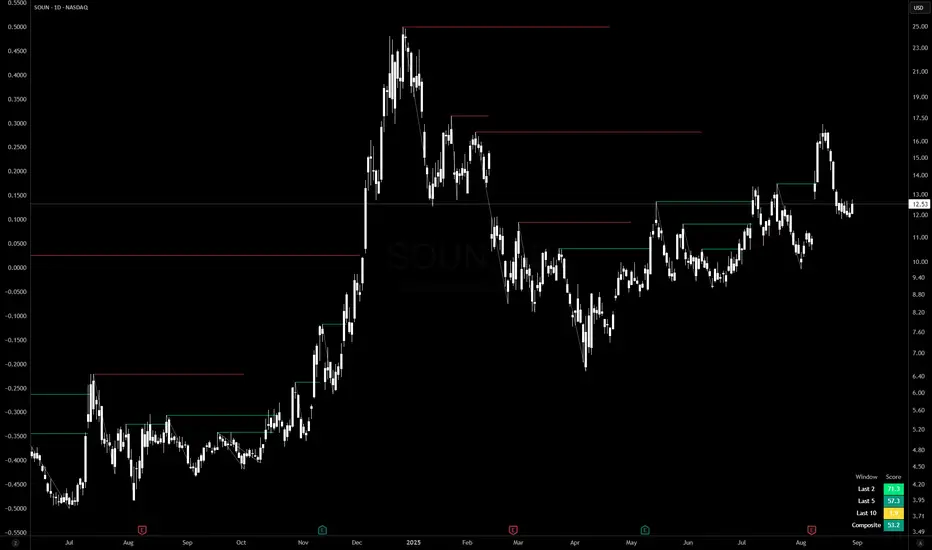
Behavior and Chart Representation
The Swing.TrendScore indicator fluctuates within a range, as most of its components are range-bound (though Z-score components may technically extend beyond).
• Historically high or low values may suggest overbought or oversold conditions
• The chart displays:
o A fast curve (orange)
o A slow curve (white)
o A shaded background representing the market state
• Extreme values followed by curve reversals may signal a developing mean reversion
________________________________________
TrendScore Background Value
The Background Value reflects the combined state of the short-term trend and swing:
• > 0 (shaded green) → Bullish mode: swing and short-term trend both upward
• < 0 (shaded red) → Bearish mode: swing and short-term trend both downward
• The absolute value represents the confidence level in the market mode
Notably, the Background Value can remain positive during short downswings if the short-term trend remains bullish—and vice versa.
________________________________________
How to Use the Parsifal.Swing.TrendScore
Several change points can act as entry triggers or aids:
• Fast Trigger: change in slope of the fast signal curve
• Trigger: fast line crosses slow line or the slope of the slow signal changes
• Slow Trigger: change in sign of the Background Value
Examples of these trigger points are illustrated in the accompanying chart.
Additionally, market highs and lows aligning with the swing indicator values may serve as pivot points in the evolving price process.
________________________________________
As always, this indicator should be used in conjunction with other tools and market context in live trading.
While it provides valuable insight and potential entry points, it does not predict future price action.
Instead, it reflects recent tendencies and should be used judiciously.
________________________________________
Extensions
The aggregation of information—whether derived from bins or technical indicators—is currently performed via simple averaging. However, this can be modified using alternative weighting schemes, based on:
• Historical performance
• Relevance of the data
• Specific market conditions
Smoothing periods used in calculations are also modifiable. In general, the EMAs applied for smoothing can be extended to reflect expectations based on relevance-weighted probability measures.
Since EMAs inherently give more weight to recent data, this allows for adaptive smoothing.
Additionally, EMAs may be further extended to incorporate negative weights, akin to wavelet transform techniques.

Gap Absorption StrategyLike the nature, markets don't like the void, and this is something we can take advantage of by trading gaps on some markets.
This technique is well known, so I wanted to write a tiny script based on this strategy to get a bit more comfortable with it.
IMPORTANT: Default parameters wont give you good trades on every markets, you need to modify these parameters to see which proportions correspond to the stock you're trading.
This script triggers signals on predefined variation of a stock price after a gap, and allows its user to configure TP and SL prices corresponding to a specific percentage of this gap movement.
Note: We can observe that opening gaps are often the most interesting.
Options
Trigger: the price variation you want to trigger on (in % of the price)
Stop Loss : in % of the gap
Take profit : in % of the gap
A small table is displayed in the top right corner of the chart to give you TP/SL/Signal prices for each opportunity
SL (red line) and TP (green line) are also displayed on the chart when a signal is triggered
Information concerning the current opportunity is given at the bottom of the chart
Note: This script is based on the Gap-Size-Indicator that I published a few weeks ago.

Alert(), alertcondition() or strategy alerts?Variety of possibilities offered by PineScript, especially thanks to recent additions, created some confusion. Especially one question repeats quite often - which method to use to trigger alerts?
I'm posting this to clarify and give some syntax examples. I'll discuss these 3 methods in chronological order, meaning - in the order they were introduced to PineScript.
ALERTCONDITION() - it is a function call, which can be used only in study-type script. Since years ago, you could create 2 types of a script: strategy and study. First one enables creating a backtest of a strategy. Second was to develop scripts which didn't require backtesting and could trigger alerts. alertcondition() calls in strategy-type scripts were rejected by Pine compiler. On the other hand compiling study-type scripts rejected all strategy...() calls. That created difficulties, because once you had a nice and backtested strategy, you had to rip it off from all strategy...() function calls to convert your script to study-type so you could produce alerts. Maintenance of two versions of each script was necessary and it was painful.
"STRATEGY ALERTS" were introduced because of alertcondition() pains. To create strategy alert, you need to click "Add alert" button inside Strategy Tester (backtester) and only there. Alerts set-up this way are bound with the backtester - whenever backtester triggers an order, which is visible on the chart, alert is also fired. And you can customize alert message using some placeholders like {{strategy.order.contracts}} or {{ticker}}.
ALERT() was added last. This is an alerts-triggering function call, which can be run from strategy-type script. Finally it is doable! You can connect it to any event coded in PineScript and generate any alert message you want, thanks to concatenation of strings and wrapping variables into tostring() function.
Out of these three alertcondition() is obviously archaic and probably will be discontinued. There is a chance this makes strategy/study distinction not making sense anymore, so I wouldn't be surprised if "studies" are deprecated at some point.
But what are the differences between "Strategy alerts" and alert()? "Strategy alerts" seem easier to set-up with just a few clicks and probably easier to understand and verify, because they go in sync with the backtester and on-chart trade markers. It is especially important to understand how they work if you're building strategy based on pending orders (stop and limit) - events in your code might trigger placing pending order, but alert will be triggered only (and when) such order is executed.
But "Strategy Alerts" have some limitations - not every variable you'd like to include in alert message is available from PineScript. And maybe you don't need the alert fired when the trade hit a stop-loss or take-profit, because you have already forwarded info about closing conditions in entry alert to your broker/exchange.
Alert() was added to PineScript to fill all these gaps. Is allows concatenating any alert message you want, with any variable you want inside it and you can attach alert() function at any event in your PineScript code. For example - when placing orders, crossing variables, exiting trades, but not explicitly at pending orders execution.
The Verdict
"Strategy Alerts" might seem a better fit - easier to set-up and verify, flexible and they fire only when a trade really happens, not producing unnecessary mess when each pending order is placed. But these advantages are illusionary, because they don't give you the full-control which is needed when trading with real money. Especially when using pending orders. If an alert is fired when price actually hit a stop-order or limit-order level, and even if you are executing such alert within 1 second thanks to a tool like TradingConnector, you might already be late and you are making entry at a market price. Slippage will play a great role here. You need to send ordering alert when logical conditions are met - then it will be executed at the price you want. Even if you need to cancel all the pending orders which were not executed. Because of that I strongly recommend sticking to ALERT() when building your alerts system.
Below is an example strategy, showing syntax to manage placing the orders and cancelling them. Yes, this is another spin-off from my TradingView Alerts to MT4 MT5 . As usual, please don't pay attention to backtest results, as this is educational script only.
P.S. For the last time - farewell alertcondition(). You served us well.

Backtesting & Trading Engine [PineCoders]The PineCoders Backtesting and Trading Engine is a sophisticated framework with hybrid code that can run as a study to generate alerts for automated or discretionary trading while simultaneously providing backtest results. It can also easily be converted to a TradingView strategy in order to run TV backtesting. The Engine comes with many built-in strats for entries, filters, stops and exits, but you can also add you own.
If, like any self-respecting strategy modeler should, you spend a reasonable amount of time constantly researching new strategies and tinkering, our hope is that the Engine will become your inseparable go-to tool to test the validity of your creations, as once your tests are conclusive, you will be able to run this code as a study to generate the alerts required to put it in real-world use, whether for discretionary trading or to interface with an execution bot/app. You may also find the backtesting results the Engine produces in study mode enough for your needs and spend most of your time there, only occasionally converting to strategy mode in order to backtest using TV backtesting.
As you will quickly grasp when you bring up this script’s Settings, this is a complex tool. While you will be able to see results very quickly by just putting it on a chart and using its built-in strategies, in order to reap the full benefits of the PineCoders Engine, you will need to invest the time required to understand the subtleties involved in putting all its potential into play.
Disclaimer: use the Engine at your own risk.
Before we delve in more detail, here’s a bird’s eye view of the Engine’s features:
More than 40 built-in strategies,
Customizable components,
Coupling with your own external indicator,
Simple conversion from Study to Strategy modes,
Post-Exit analysis to search for alternate trade outcomes,
Use of the Data Window to show detailed bar by bar trade information and global statistics, including some not provided by TV backtesting,
Plotting of reminders and generation of alerts on in-trade events.
By combining your own strats to the built-in strats supplied with the Engine, and then tuning the numerous options and parameters in the Inputs dialog box, you will be able to play what-if scenarios from an infinite number of permutations.
USE CASES
You have written an indicator that provides an entry strat but it’s missing other components like a filter and a stop strategy. You add a plot in your indicator that respects the Engine’s External Signal Protocol, connect it to the Engine by simply selecting your indicator’s plot name in the Engine’s Settings/Inputs and then run tests on different combinations of entry stops, in-trade stops and profit taking strats to find out which one produces the best results with your entry strat.
You are building a complex strategy that you will want to run as an indicator generating alerts to be sent to a third-party execution bot. You insert your code in the Engine’s modules and leverage its trade management code to quickly move your strategy into production.
You have many different filters and want to explore results using them separately or in combination. Integrate the filter code in the Engine and run through different permutations or hook up your filtering through the external input and control your filter combos from your indicator.
You are tweaking the parameters of your entry, filter or stop strat. You integrate it in the Engine and evaluate its performance using the Engine’s statistics.
You always wondered what results a random entry strat would yield on your markets. You use the Engine’s built-in random entry strat and test it using different combinations of filters, stop and exit strats.
You want to evaluate the impact of fees and slippage on your strategy. You use the Engine’s inputs to play with different values and get immediate feedback in the detailed numbers provided in the Data Window.
You just want to inspect the individual trades your strategy generates. You include it in the Engine and then inspect trades visually on your charts, looking at the numbers in the Data Window as you move your cursor around.
You have never written a production-grade strategy and you want to learn how. Inspect the code in the Engine; you will find essential components typical of what is being used in actual trading systems.
You have run your system for a while and have compiled actual slippage information and your broker/exchange has updated his fees schedule. You enter the information in the Engine and run it on your markets to see the impact this has on your results.
FEATURES
Before going into the detail of the Inputs and the Data Window numbers, here’s a more detailed overview of the Engine’s features.
Built-in strats
The engine comes with more than 40 pre-coded strategies for the following standard system components:
Entries,
Filters,
Entry stops,
2 stage in-trade stops with kick-in rules,
Pyramiding rules,
Hard exits.
While some of the filter and stop strats provided may be useful in production-quality systems, you will not devise crazy profit-generating systems using only the entry strats supplied; that part is still up to you, as will be finding the elusive combination of components that makes winning systems. The Engine will, however, provide you with a solid foundation where all the trade management nitty-gritty is handled for you. By binding your custom strats to the Engine, you will be able to build reliable systems of the best quality currently allowed on the TV platform.
On-chart trade information
As you move over the bars in a trade, you will see trade numbers in the Data Window change at each bar. The engine calculates the P&L at every bar, including slippage and fees that would be incurred were the trade exited at that bar’s close. If the trade includes pyramided entries, those will be taken into account as well, although for those, final fees and slippage are only calculated at the trade’s exit.
You can also see on-chart markers for the entry level, stop positions, in-trade special events and entries/exits (you will want to disable these when using the Engine in strategy mode to see TV backtesting results).
Customization
You can couple your own strats to the Engine in two ways:
1. By inserting your own code in the Engine’s different modules. The modular design should enable you to do so with minimal effort by following the instructions in the code.
2. By linking an external indicator to the engine. After making the proper selections in the engine’s Settings and providing values respecting the engine’s protocol, your external indicator can, when the Engine is used in Indicator mode only:
Tell the engine when to enter long or short trades, but let the engine’s in-trade stop and exit strats manage the exits,
Signal both entries and exits,
Provide an entry stop along with your entry signal,
Filter other entry signals generated by any of the engine’s entry strats.
Conversion from strategy to study
TradingView strategies are required to backtest using the TradingView backtesting feature, but if you want to generate alerts with your script, whether for automated trading or just to trigger alerts that you will use in discretionary trading, your code has to run as a study since, for the time being, strategies can’t generate alerts. From hereon we will use indicator as a synonym for study.
Unless you want to maintain two code bases, you will need hybrid code that easily flips between strategy and indicator modes, and your code will need to restrict its use of strategy() calls and their arguments if it’s going to be able to run both as an indicator and a strategy using the same trade logic. That’s one of the benefits of using this Engine. Once you will have entered your own strats in the Engine, it will be a matter of commenting/uncommenting only four lines of code to flip between indicator and strategy modes in a matter of seconds.
Additionally, even when running in Indicator mode, the Engine will still provide you with precious numbers on your individual trades and global results, some of which are not available with normal TradingView backtesting.
Post-Exit Analysis for alternate outcomes (PEA)
While typical backtesting shows results of trade outcomes, PEA focuses on what could have happened after the exit. The intention is to help traders get an idea of the opportunity/risk in the bars following the trade in order to evaluate if their exit strategies are too aggressive or conservative.
After a trade is exited, the Engine’s PEA module continues analyzing outcomes for a user-defined quantity of bars. It identifies the maximum opportunity and risk available in that space, and calculates the drawdown required to reach the highest opportunity level post-exit, while recording the number of bars to that point.
Typically, if you can’t find opportunity greater than 1X past your trade using a few different reasonable lengths of PEA, your strategy is doing pretty good at capturing opportunity. Remember that 100% of opportunity is never capturable. If, however, PEA was finding post-trade maximum opportunity of 3 or 4X with average drawdowns of 0.3 to those areas, this could be a clue revealing your system is exiting trades prematurely. To analyze PEA numbers, you can uncomment complete sets of plots in the Plot module to reveal detailed global and individual PEA numbers.
Statistics
The Engine provides stats on your trades that TV backtesting does not provide, such as:
Average Profitability Per Trade (APPT), aka statistical expectancy, a crucial value.
APPT per bar,
Average stop size,
Traded volume .
It also shows you on a trade-by-trade basis, on-going individual trade results and data.
In-trade events
In-trade events can plot reminders and trigger alerts when they occur. The built-in events are:
Price approaching stop,
Possible tops/bottoms,
Large stop movement (for discretionary trading where stop is moved manually),
Large price movements.
Slippage and Fees
Even when running in indicator mode, the Engine allows for slippage and fees to be included in the logic and test results.
Alerts
The alert creation mechanism allows you to configure alerts on any combination of the normal or pyramided entries, exits and in-trade events.
Backtesting results
A few words on the numbers calculated in the Engine. Priority is given to numbers not shown in TV backtesting, as you can readily convert the script to a strategy if you need them.
We have chosen to focus on numbers expressing results relative to X (the trade’s risk) rather than in absolute currency numbers or in other more conventional but less useful ways. For example, most of the individual trade results are not shown in percentages, as this unit of measure is often less meaningful than those expressed in units of risk (X). A trade that closes with a +25% result, for example, is a poor outcome if it was entered with a -50% stop. Expressed in X, this trade’s P&L becomes 0.5, which provides much better insight into the trade’s outcome. A trade that closes with a P&L of +2X has earned twice the risk incurred upon entry, which would represent a pre-trade risk:reward ratio of 2.
The way to go about it when you think in X’s and that you adopt the sound risk management policy to risk a fixed percentage of your account on each trade is to equate a currency value to a unit of X. E.g. your account is 10K USD and you decide you will risk a maximum of 1% of it on each trade. That means your unit of X for each trade is worth 100 USD. If your APPT is 2X, this means every time you risk 100 USD in a trade, you can expect to make, on average, 200 USD.
By presenting results this way, we hope that the Engine’s statistics will appeal to those cognisant of sound risk management strategies, while gently leading traders who aren’t, towards them.
We trade to turn in tangible profits of course, so at some point currency must come into play. Accordingly, some values such as equity, P&L, slippage and fees are expressed in currency.
Many of the usual numbers shown in TV backtests are nonetheless available, but they have been commented out in the Engine’s Plot module.
Position sizing and risk management
All good system designers understand that optimal risk management is at the very heart of all winning strategies. The risk in a trade is defined by the fraction of current equity represented by the amplitude of the stop, so in order to manage risk optimally on each trade, position size should adjust to the stop’s amplitude. Systems that enter trades with a fixed stop amplitude can get away with calculating position size as a fixed percentage of current equity. In the context of a test run where equity varies, what represents a fixed amount of risk translates into different currency values.
Dynamically adjusting position size throughout a system’s life is optimal in many ways. First, as position sizing will vary with current equity, it reproduces a behavioral pattern common to experienced traders, who will dial down risk when confronted to poor performance and increase it when performance improves. Second, limiting risk confers more predictability to statistical test results. Third, position sizing isn’t just about managing risk, it’s also about maximizing opportunity. By using the maximum leverage (no reference to trading on margin here) into the trade that your risk management strategy allows, a dynamic position size allows you to capture maximal opportunity.
To calculate position sizes using the fixed risk method, we use the following formula: Position = Account * MaxRisk% / Stop% [, which calculates a position size taking into account the trade’s entry stop so that if the trade is stopped out, 100 USD will be lost. For someone who manages risk this way, common instructions to invest a certain percentage of your account in a position are simply worthless, as they do not take into account the risk incurred in the trade.
The Engine lets you select either the fixed risk or fixed percentage of equity position sizing methods. The closest thing to dynamic position sizing that can currently be done with alerts is to use a bot that allows syntax to specify position size as a percentage of equity which, while being dynamic in the sense that it will adapt to current equity when the trade is entered, does not allow us to modulate position size using the stop’s amplitude. Changes to alerts are on the way which should solve this problem.
In order for you to simulate performance with the constraint of fixed position sizing, the Engine also offers a third, less preferable option, where position size is defined as a fixed percentage of initial capital so that it is constant throughout the test and will thus represent a varying proportion of current equity.
Let’s recap. The three position sizing methods the Engine offers are:
1. By specifying the maximum percentage of risk to incur on your remaining equity, so the Engine will dynamically adjust position size for each trade so that, combining the stop’s amplitude with position size will yield a fixed percentage of risk incurred on current equity,
2. By specifying a fixed percentage of remaining equity. Note that unless your system has a fixed stop at entry, this method will not provide maximal risk control, as risk will vary with the amplitude of the stop for every trade. This method, as the first, does however have the advantage of automatically adjusting position size to equity. It is the Engine’s default method because it has an equivalent in TV backtesting, so when flipping between indicator and strategy mode, test results will more or less correspond.
3. By specifying a fixed percentage of the Initial Capital. While this is the least preferable method, it nonetheless reflects the reality confronted by most system designers on TradingView today. In this case, risk varies both because the fixed position size in initial capital currency represents a varying percentage of remaining equity, and because the trade’s stop amplitude may vary, adding another variability vector to risk.
Note that the Engine cannot display equity results for strategies entering trades for a fixed amount of shares/contracts at a variable price.
SETTINGS/INPUTS
Because the initial text first published with a script cannot be edited later and because there are just too many options, the Engine’s Inputs will not be covered in minute detail, as they will most certainly evolve. We will go over them with broad strokes; you should be able to figure the rest out. If you have questions, just ask them here or in the PineCoders Telegram group.
Display
The display header’s checkbox does nothing.
For the moment, only one exit strategy uses a take profit level, so only that one will show information when checking “Show Take Profit Level”.
Entries
You can activate two simultaneous entry strats, each selected from the same set of strats contained in the Engine. If you select two and they fire simultaneously, the main strat’s signal will be used.
The random strat in each list uses a different seed, so you will get different results from each.
The “Filter transitions” and “Filter states” strats delegate signal generation to the selected filter(s). “Filter transitions” signals will only fire when the filter transitions into bull/bear state, so after a trade is stopped out, the next entry may take some time to trigger if the filter’s state does not change quickly. When you choose “Filter states”, then a new trade will be entered immediately after an exit in the direction the filter allows.
If you select “External Indicator”, your indicator will need to generate a +2/-2 (or a positive/negative stop value) to enter a long/short position, providing the selected filters allow for it. If you wish to use the Engine’s capacity to also derive the entry stop level from your indicator’s signal, then you must explicitly choose this option in the Entry Stops section.
Filters
You can activate as many filters as you wish; they are additive. The “Maximum stop allowed on entry” is an important component of proper risk management. If your system has an average 3% stop size and you need to trade using fixed position sizes because of alert/execution bot limitations, you must use this filter because if your system was to enter a trade with a 15% stop, that trade would incur 5 times the normal risk, and its result would account for an abnormally high proportion in your system’s performance.
Remember that any filter can also be used as an entry signal, either when it changes states, or whenever no trade is active and the filter is in a bull or bear mode.
Entry Stops
An entry stop must be selected in the Engine, as it requires a stop level before the in-trade stop is calculated. Until the selected in-trade stop strat generates a stop that comes closer to price than the entry stop (or respects another one of the in-trade stops kick in strats), the entry stop level is used.
It is here that you must select “External Indicator” if your indicator supplies a +price/-price value to be used as the entry stop. A +price is expected for a long entry and a -price value will enter a short with a stop at price. Note that the price is the absolute price, not an offset to the current price level.
In-Trade Stops
The Engine comes with many built-in in-trade stop strats. Note that some of them share the “Length” and “Multiple” field, so when you swap between them, be sure that the length and multiple in use correspond to what you want for that stop strat. Suggested defaults appear with the name of each strat in the dropdown.
In addition to the strat you wish to use, you must also determine when it kicks in to replace the initial entry’s stop, which is determined using different strats. For strats where you can define a positive or negative multiple of X, percentage or fixed value for a kick-in strat, a positive value is above the trade’s entry fill and a negative one below. A value of zero represents breakeven.
Pyramiding
What you specify in this section are the rules that allow pyramiding to happen. By themselves, these rules will not generate pyramiding entries. For those to happen, entry signals must be issued by one of the active entry strats, and conform to the pyramiding rules which act as a filter for them. The “Filter must allow entry” selection must be chosen if you want the usual system’s filters to act as additional filtering criteria for your pyramided entries.
Hard Exits
You can choose from a variety of hard exit strats. Hard exits are exit strategies which signal trade exits on specific events, as opposed to price breaching a stop level in In-Trade Stops strategies. They are self-explanatory. The last one labelled When Take Profit Level (multiple of X) is reached is the only one that uses a level, but contrary to stops, it is above price and while it is relative because it is expressed as a multiple of X, it does not move during the trade. This is the level called Take Profit that is show when the “Show Take Profit Level” checkbox is checked in the Display section.
While stops focus on managing risk, hard exit strategies try to put the emphasis on capturing opportunity.
Slippage
You can define it as a percentage or a fixed value, with different settings for entries and exits. The entry and exit markers on the chart show the impact of slippage on the entry price (the fill).
Fees
Fees, whether expressed as a percentage of position size in and out of the trade or as a fixed value per in and out, are in the same units of currency as the capital defined in the Position Sizing section. Fees being deducted from your Capital, they do not have an impact on the chart marker positions.
In-Trade Events
These events will only trigger during trades. They can be helpful to act as reminders for traders using the Engine as assistance to discretionary trading.
Post-Exit Analysis
It is normally on. Some of its results will show in the Global Numbers section of the Data Window. Only a few of the statistics generated are shown; many more are available, but commented out in the Plot module.
Date Range Filtering
Note that you don’t have to change the dates to enable/diable filtering. When you are done with a specific date range, just uncheck “Date Range Filtering” to disable date filtering.
Alert Triggers
Each selection corresponds to one condition. Conditions can be combined into a single alert as you please. Just be sure you have selected the ones you want to trigger the alert before you create the alert. For example, if you trade in both directions and you want a single alert to trigger on both types of exits, you must select both “Long Exit” and “Short Exit” before creating your alert.
Once the alert is triggered, these settings no longer have relevance as they have been saved with the alert.
When viewing charts where an alert has just triggered, if your alert triggers on more than one condition, you will need the appropriate markers active on your chart to figure out which condition triggered the alert, since plotting of markers is independent of alert management.
Position sizing
You have 3 options to determine position size:
1. Proportional to Stop -> Variable, with a cap on size.
2. Percentage of equity -> Variable.
3. Percentage of Initial Capital -> Fixed.
External Indicator
This is where you connect your indicator’s plot that will generate the signals the Engine will act upon. Remember this only works in Indicator mode.
DATA WINDOW INFORMATION
The top part of the window contains global numbers while the individual trade information appears in the bottom part. The different types of units used to express values are:
curr: denotes the currency used in the Position Sizing section of Inputs for the Initial Capital value.
quote: denotes quote currency, i.e. the value the instrument is expressed in, or the right side of the market pair (USD in EURUSD ).
X: the stop’s amplitude, itself expressed in quote currency, which we use to express a trade’s P&L, so that a trade with P&L=2X has made twice the stop’s amplitude in profit. This is sometimes referred to as R, since it represents one unit of risk. It is also the unit of measure used in the APPT, which denotes expected reward per unit of risk.
X%: is also the stop’s amplitude, but expressed as a percentage of the Entry Fill.
The numbers appearing in the Data Window are all prefixed:
“ALL:” the number is the average for all first entries and pyramided entries.
”1ST:” the number is for first entries only.
”PYR:” the number is for pyramided entries only.
”PEA:” the number is for Post-Exit Analyses
Global Numbers
Numbers in this section represent the results of all trades up to the cursor on the chart.
Average Profitability Per Trade (X): This value is the most important gauge of your strat’s worthiness. It represents the returns that can be expected from your strat for each unit of risk incurred. E.g.: your APPT is 2.0, thus for every unit of currency you invest in a trade, you can on average expect to obtain 2 after the trade. APPT is also referred to as “statistical expectancy”. If it is negative, your strategy is losing, even if your win rate is very good (it means your winning trades aren’t winning enough, or your losing trades lose too much, or both). Its counterpart in currency is also shown, as is the APPT/bar, which can be a useful gauge in deciding between rivalling systems.
Profit Factor: Gross of winning trades/Gross of losing trades. Strategy is profitable when >1. Not as useful as the APPT because it doesn’t take into account the win rate and the average win/loss per trade. It is calculated from the total winning/losing results of this particular backtest and has less predictive value than the APPT. A good profit factor together with a poor APPT means you just found a chart where your system outperformed. Relying too much on the profit factor is a bit like a poker player who would think going all in with two’s against aces is optimal because he just won a hand that way.
Win Rate: Percentage of winning trades out of all trades. Taken alone, it doesn’t have much to do with strategy profitability. You can have a win rate of 99% but if that one trade in 100 ruins you because of poor risk management, 99% doesn’t look so good anymore. This number speaks more of the system’s profile than its worthiness. Still, it can be useful to gauge if the system fits your personality. It can also be useful to traders intending to sell their systems, as low win rate systems are more difficult to sell and require more handholding of worried customers.
Equity (curr): This the sum of initial capital and the P&L of your system’s trades, including fees and slippage.
Return on Capital is the equivalent of TV’s Net Profit figure, i.e. the variation on your initial capital.
Maximum drawdown is the maximal drawdown from the highest equity point until the drop . There is also a close to close (meaning it doesn’t take into account in-trade variations) maximum drawdown value commented out in the code.
The next values are self-explanatory, until:
PYR: Avg Profitability Per Entry (X): this is the APPT for all pyramided entries.
PEA: Avg Max Opp . Available (X): the average maximal opportunity found in the Post-Exit Analyses.
PEA: Avg Drawdown to Max Opp . (X): this represents the maximum drawdown (incurred from the close at the beginning of the PEA analysis) required to reach the maximal opportunity point.
Trade Information
Numbers in this section concern only the current trade under the cursor. Most of them are self-explanatory. Use the description’s prefix to determine what the values applies to.
PYR: Avg Profitability Per Entry (X): While this value includes the impact of all current pyramided entries (and only those) and updates when you move your cursor around, P&L only reflects fees at the trade’s last bar.
PEA: Max Opp . Available (X): It’s the most profitable close reached post-trade, measured from the trade’s Exit Fill, expressed in the X value of the trade the PEA follows.
PEA: Drawdown to Max Opp . (X): This is the maximum drawdown from the trade’s Exit Fill that needs to be sustained in order to reach the maximum opportunity point, also expressed in X. Note that PEA numbers do not include slippage and fees.
EXTERNAL SIGNAL PROTOCOL
Only one external indicator can be connected to a script; in order to leverage its use to the fullest, the engine provides options to use it as either an entry signal, an entry/exit signal or a filter. When used as an entry signal, you can also use the signal to provide the entry’s stop. Here’s how this works:
For filter state: supply +1 for bull (long entries allowed), -1 for bear (short entries allowed).
For entry signals: supply +2 for long, -2 for short.
For exit signals: supply +3 for exit from long, -3 for exit from short.
To send an entry stop level with an entry signal: Send positive stop level for long entry (e.g. 103.33 to enter a long with a stop at 103.33), negative stop level for short entry (e.g. -103.33 to enter a short with a stop at 103.33). If you use this feature, your indicator will have to check for exact stop levels of 1.0, 2.0 or 3.0 and their negative counterparts, and fudge them with a tick in order to avoid confusion with other signals in the protocol.
Remember that mere generation of the values by your indicator will have no effect until you explicitly allow their use in the appropriate sections of the Engine’s Settings/Inputs.
An example of a script issuing a signal for the Engine is published by PineCoders.
RECOMMENDATIONS TO ASPIRING SYSTEM DESIGNERS
Stick to higher timeframes. On progressively lower timeframes, margins decrease and fees and slippage take a proportionally larger portion of profits, to the point where they can very easily turn a profitable strategy into a losing one. Additionally, your margin for error shrinks as the equilibrium of your system’s profitability becomes more fragile with the tight numbers involved in the shorter time frames. Avoid <1H time frames.
Know and calculate fees and slippage. To avoid market shock, backtest using conservative fees and slippage parameters. Systems rarely show unexpectedly good returns when they are confronted to the markets, so put all chances on your side by being outrageously conservative—or a the very least, realistic. Test results that do not include fees and slippage are worthless. Slippage is there for a reason, and that’s because our interventions in the market change the market. It is easier to find alpha in illiquid markets such as cryptos because not many large players participate in them. If your backtesting results are based on moving large positions and you don’t also add the inevitable slippage that will occur when you enter/exit thin markets, your backtesting will produce unrealistic results. Even if you do include large slippage in your settings, the Engine can only do so much as it will not let slippage push fills past the high or low of the entry bar, but the gap may be much larger in illiquid markets.
Never test and optimize your system on the same dataset , as that is the perfect recipe for overfitting or data dredging, which is trying to find one precise set of rules/parameters that works only on one dataset. These setups are the most fragile and often get destroyed when they meet the real world.
Try to find datasets yielding more than 100 trades. Less than that and results are not as reliable.
Consider all backtesting results with suspicion. If you never entertained sceptic tendencies, now is the time to begin. If your backtest results look really good, assume they are flawed, either because of your methodology, the data you’re using or the software doing the testing. Always assume the worse and learn proper backtesting techniques such as monte carlo simulations and walk forward analysis to avoid the traps and biases that unchecked greed will set for you. If you are not familiar with concepts such as survivor bias, lookahead bias and confirmation bias, learn about them.
Stick to simple bars or candles when designing systems. Other types of bars often do not yield reliable results, whether by design (Heikin Ashi) or because of the way they are implemented on TV (Renko bars).
Know that you don’t know and use that knowledge to learn more about systems and how to properly test them, about your biases, and about yourself.
Manage risk first , then capture opportunity.
Respect the inherent uncertainty of the future. Cleanse yourself of the sad arrogance and unchecked greed common to newcomers to trading. Strive for rationality. Respect the fact that while backtest results may look promising, there is no guarantee they will repeat in the future (there is actually a high probability they won’t!), because the future is fundamentally unknowable. If you develop a system that looks promising, don’t oversell it to others whose greed may lead them to entertain unreasonable expectations.
Have a plan. Understand what king of trading system you are trying to build. Have a clear picture or where entries, exits and other important levels will be in the sort of trade you are trying to create with your system. This stated direction will help you discard more efficiently many of the inevitably useless ideas that will pop up during system design.
Be wary of complexity. Experienced systems engineers understand how rapidly complexity builds when you assemble components together—however simple each one may be. The more complex your system, the more difficult it will be to manage.
Play! . Allow yourself time to play around when you design your systems. While much comes about from working with a purpose, great ideas sometimes come out of just trying things with no set goal, when you are stuck and don’t know how to move ahead. Have fun!
@LucF
NOTES
While the engine’s code can supply multiple consecutive entries of longs or shorts in order to scale positions (pyramid), all exits currently assume the execution bot will exit the totality of the position. No partial exits are currently possible with the Engine.
Because the Engine is literally crippled by the limitations on the number of plots a script can output on TV; it can only show a fraction of all the information it calculates in the Data Window. You will find in the Plot Module vast amounts of commented out lines that you can activate if you also disable an equivalent number of other plots. This may be useful to explore certain characteristics of your system in more detail.
When backtesting using the TV backtesting feature, you will need to provide the strategy parameters you wish to use through either Settings/Properties or by changing the default values in the code’s header. These values are defined in variables and used not only in the strategy() statement, but also as defaults in the Engine’s relevant Inputs.
If you want to test using pyramiding, then both the strategy’s Setting/Properties and the Engine’s Settings/Inputs need to allow pyramiding.
If you find any bugs in the Engine, please let us know.
THANKS
To @glaz for allowing the use of his unpublished MA Squize in the filters.
To @everget for his Chandelier stop code, which is also used as a filter in the Engine.
To @RicardoSantos for his pseudo-random generator, and because it’s from him that I first read in the Pine chat about the idea of using an external indicator as input into another. In the PineCoders group, @theheirophant then mentioned the idea of using it as a buy/sell signal and @simpelyfe showed a piece of code implementing the idea. That’s the tortuous story behind the use of the external indicator in the Engine.
To @admin for the Volatility stop’s original code and for the donchian function lifted from Ichimoku .
To @BobHoward21 for the v3 version of Volatility Stop .
To @scarf and @midtownsk8rguy for the color tuning.
To many other scripters who provided encouragement and suggestions for improvement during the long process of writing and testing this piece of code.
To J. Welles Wilder Jr. for ATR, used extensively throughout the Engine.
To TradingView for graciously making an account available to PineCoders.
And finally, to all fellow PineCoders for the constant intellectual stimulation; it is a privilege to share ideas with you all. The Engine is for all TradingView PineCoders, of course—but especially for you.
Look first. Then leap.

Trend Break Targets [MarkitTick]Trend Break Targets
Trend Break Targets is a technical analysis tool designed to assist traders in identifying trendline breakouts and projecting potential price targets based on market geometry. Unlike fully automated indicators that guess trendlines, this tool provides you with precise control by allowing you to manually Pivot Point the trendline to specific points in time, while automating the complex math of target projection and structure mapping.
Theoretical Basis & Concepts
This indicator is grounded in classic technical analysis principles found in foundational trading literature. It automates the following methodology:
Drawing a trend line between two key points to represent dynamic support or resistance.
Identifying a breakout when the price closes above or below this line, potentially signaling a change in trend.
Calculating a price target by measuring the vertical distance between the breakout line and the last high/low (pivot), then projecting that same distance in the direction of the breakout.
This concept is based on methods and "Measured Move" theories explained in classic books such as "Technical Analysis of Stock Trends" by Edwards & Magee, "Technical Analysis of the Financial Markets" by John Murphy, and in Thomas Bulkowski's Price Pattern Studies.
How It Works
Pivot Pointed Trendline Construction The script draws a trendline between two user-defined points in time (Start Date and End Date). It calculates the slope between these points and extends the line infinitely to the right, allowing you to define the exact structure (e.g., a resistance trendline on a wedge).
Breakout Detection The script monitors the "Price Source" (High, Low, or Close) relative to the extended trendline.
A Bullish Breakout (BC) occurs when the Close crosses above a bearish trendline.
A Bearish Breakout (BC) occurs when the Close crosses below a bullish trendline.
Dynamic Target Projection (The Math) Upon a confirmed breakout, the script automatically calculates three distinct targets by identifying the most significant "Swing Point" (Pivot) prior to the breakout.
Distance (D): The vertical distance between the Trendline and the Pivot Price at the specific bar where the pivot occurred.
Target 1 (T1): The Breakout Price +/- (Distance × 1.0). This represents a classic 1:1 measured move.
Target 2 (T2): The Breakout Price +/- (Distance × 1.618). Based on the Golden Ratio extension.
Target 3 (T3): The Breakout Price +/- (Distance × 2.618).
Market Structure (CHOCH) The script includes an optional Change of Character (CHOCH) module. This runs independently of the trendline logic, identifying local Swing Highs and Swing Lows based on the "Swing Detection Length." It plots dashed lines and labels to visualize immediate shifts in market structure.
How to Use This Tool
This is an interactive tool that requires user input to define the setup.
Identify a Setup: Locate a clear trend, wedge, or flag pattern on your chart.
Set Pivot Points: Go to the Indicator Settings. Input the exact Start Date and End Date corresponding to the two main touches of your trendline.
Monitor for Breakout: The script will extend the line. Wait for a "BC" label to appear.
Trade Management: Once "BC" prints, the T1, T2, and T3 lines will instantly render. These can be used as potential take-profit zones or areas to tighten stop-losses.
Settings & Configuration
Indicator Settings
Start/End Date: The timestamp Pivot Points for your trendline.
Price Source: Determines what price (High or Low) Pivot Points the line and triggers the breakout.
Pivot Left/Right: Adjusts the sensitivity for finding the "Pivot Before Break" used for target calculations.
Extend Target Line: How far forward the target lines are drawn.
Visual Style
Colors: Fully customizable colors for the Trendline, Breakout Labels, and each Target level (T1, T2, T3).
Gold Bullish Reversal
This analysis dissects a confirmed bullish reversal on Gold using a custom Trend Break system. The setup identifies a transition from a bearish corrective phase to bullish momentum, validated by a structural break and a geometric target projection.
Trend Identification (The Pivot Points) The descending white trendline serves as the primary dynamic resistance, defining the bearish correction.
Pivot Points: The line is drawn connecting two significant swing highs, marked by Label 1 and Label 2.
Logic: These points represent the "lower highs" characteristic of the previous downtrend. As long as price remained below this trajectory, the bearish bias was intact.
The Trigger: Breakout & Confirmation The transition occurs at the candle marked BC (Breakout Candle).
Breakout Criteria: The indicator logic dictates that a signal is only valid when the bar closes above the trendline. This filters out intraday wicks and ensures genuine buyer commitment.
CHOCH Confluence: Immediately following the breakout, a CHOCH (Change of Character) label appears. This signals a shift in market structure, indicating that the internal lower-high/lower-low sequence has been violated, adding probability to the reversal.
Target Projection: The Measured Move The vertical green lines (T1, T2) represent profit objectives derived from the depth of the prior move. The logic calculates the distance between the breakout line and the lowest pivot prior to the break.
T1 (Standard Target): This is a 1:1 projection of the pre-breakout volatility. We see price action initially stalling near this level, confirming it as a zone of interest.
T2 (Golden Ratio Extension): The second target is calculated as the initial distance multiplied by 1.618 (Fibonacci Golden Ratio). The chart shows the price rallying aggressively through T1 to tap the T2 zone, often considered an exhaustion or major take-profit level in harmonic extensions.
Conclusion Gold has successfully invalidated the 4-hour bearish trendline. The confluence of a confirmed close above resistance (BC) and a structural shift (CHOCH) provided a high-probability long setup. The price has now fulfilled the T2 (1.618) extension, suggesting traders should watch for consolidation or a reaction at this key Fibonacci resistance level.
Bearish Trendline Breakdown
The image displays a Bearish Trendline Breakdown on the Gold (XAUUSD) 4-hour chart. The indicator is actually functioning in "Low" mode here (connecting swing lows to form support), which triggers the bearish logic found in the code. Here is the step-by-step breakdown:
The Setup: Pivot Points & Trendline
Visual: The Blue Labels "1" and "2" connected by a white diagonal line.
Code Logic: These are the user-defined start and end points.
Pivot Point 1 (startDate): The starting pivot of the trendline.
Pivot Point 2 (endDate): The ending pivot.
Trendline: The code draws a line between these two points and extends it to the right (extend.right). In this specific image, the line acts as a Support Trendline.
The Trigger: Break Candle (BC)
Visual: The Red Label "BC" appearing just below the white trendline.
Code Logic: This is the execution signal. The code detects a "Down Break" (dnBreak) because the Price Source was likely set to "Low" and the candle's Close was lower than the Trendline Price at that specific bar (close < currLinePrice). This confirms the support level has been breached.
The Projection: Targets (T1 & T2)
Visual: The Green Labels "T1" and "T2" with dotted horizontal lines projected downward.
Code Logic: These are profit targets based on a "Measured Move."
Pivot Calculation: The script looks back for a recent "Pivot High" (the peak before the crash) to calculate the volatility/distance (dist) between that peak and the trendline.
T1 (Conservative): The price is projected downward by 1x that distance (currLinePrice - dist).
T2 (Extended): The price is projected downward by 1.618x that distance (Golden Ratio extension).
Market Context: CHOCH
Visual: The small Red/Orange "CHOCH" labels appearing above the price action.
Code Logic: This is a secondary confirmation system running independently of the trendline. It detects a Change of Character (structural shift). The red labels indicate a "Bearish CHOCH," meaning the price broke below a significant prior swing low (last_swing_low). This supports the bearish bias of the trendline break.
Disclaimer This tool is for educational and technical analysis purposes only. Breakouts can fail (fake-outs), and past geometric patterns do not guarantee future price action. Always manage risk and use this tool in conjunction with other forms of analysis.

APEX TREND: Macro & Hard Stop SystemAPEX TREND: Macro & Hard Stop System
The APEX TREND System is a composite trend-following strategy engineered to solve the "Whipsaw" problem inherent in standard breakout systems. It orchestrates four distinct technical theories—Macro Trend Filtering, Volatility Squeeze, Momentum, and Volatility Stop-Loss—into a single, hierarchical decision-making engine.
This script is not merely a collection of indicators; it is a rules-based trading system designed for Swing Traders (Day/Week timeframes) who aim to capture major trend extensions while strictly managing downside risk through a "Hard Stop" mechanism.
🧠 Underlying Concepts & Originality
Many trend indicators fail because they treat all price movements equally. The APEX TREND differentiates itself by applying an "Institutional Filter" logic derived from classic Dow Theory and Modern Volatility Analysis.
1. The Macro Hard Stop (The 200 EMA Logic)
Origin: Based on the institutional mandate that “Nothing good happens below the 200-day moving average.”
Function: Unlike standard super trends that flip constantly in sideways markets, this system integrates a 200-period Exponential Moving Average (EMA) as a non-negotiable "Hard Stop."
Synergy: This acts as the primary gatekeeper. Even if the volatility engine signals a "Buy," the system suppresses the signal if the price is below the Macro Baseline, effectively filtering out counter-trend traps.
2. The Volatility Engine (Squeeze Theory)
Origin: Derived from John Carter’s TTM Squeeze concept.
Function: The script identifies periods where Bollinger Bands (Standard Deviation) contract inside Keltner Channels (ATR). This indicates a period of potential energy build-up.
Synergy: The system only triggers an entry when this energy is released (Breakout) AND coincides with Linear Regression Momentum, ensuring the breakout is genuine.
3. Anti-Chop Filter (ADX Integration)
Origin: J. Welles Wilder’s Directional Movement Theory.
Function: A common failure point for trend systems is low-volatility chop. This script utilizes the Average Directional Index (ADX).
Synergy: If the ADX is below the threshold (Default: 20), the market is deemed "Choppy." The script visually represents this by painting candles GRAY, signaling a "No-Trade Zone" regardless of price action.
4. The "Run Trend" Stop Loss (Factor 4.0 ATR)
Origin: Adapted from the Turtle Trading rules regarding volatility-based stops.
Function: Standard Trailing Stops (usually Factor 3.0) are too tight for crypto or volatile equities on daily timeframes.
Optimization: This system employs a wider ATR Multiplier of 4.0. This allows the asset to fluctuate naturally within a trend without triggering a premature exit, maximizing the "Run Trend" potential.
🛠 How It Works (The Algorithm)
The script processes data in a specific order to generate a signal:
Check Macro Trend: Is Price > EMA 200? (If No, Longs are disabled).
Check Volatility: Is ADX > 20? (If No, all signals are disabled).
Check Volume: Is Current Volume > 1.2x Average Volume? (Confirmation of institutional participation).
Trigger: Has a Volatility Breakout occurred in the direction of the Macro Trend?
Execution: If ALL above are true -> Generate Signal.
🎯 Strategy Guide
1. Long Setup (Bullish)
Signal: Look for the Green "APEX LONG" Label.
Condition: The price must be ABOVE the White Line (EMA 200).
Execution: Enter at the close of the signal candle.
Stop Loss: Initial stop at the Green Trailing Line.
2. Short Setup (Bearish)
Signal: Look for the Red "APEX SHORT" Label.
Condition: The price must be BELOW the White Line (EMA 200).
Execution: Enter at the close of the signal candle.
Stop Loss: Initial stop at the Red Trailing Line.
3. Exit Rules (Crucial)
This system employs a Dual-Exit Mechanism:
Soft Exit (Profit Taking): Close the position if the price crosses the Trailing Stop Line (Green/Red line). This locks in profits during a trend reversal.
Hard Exit (Emergency): Close the position IMMEDIATELY if the price crosses the White EMA 200 Line against your trade. This prevents holding a position during a major market regime change.
⚙️ Settings
Momentum Engine: Adjust Bollinger Band/Keltner Channel lengths to tune breakout sensitivity.
Apex Filters: Toggle the EMA 200 or ADX filters on/off to adapt to different asset classes.
Risk Management: The ATR Multiplier (Default 4.0) controls the width of the trailing stop. Lower values = Tighter stops (Scalping); Higher values = Looser stops (Swing).
Disclaimer: This script is designed for trend-following on higher timeframes (4H, 1D, 1W). Please backtest on your specific asset before live trading.

chart Pattern & Candle sticks Strategy# **XAUUSD Pattern & Candle Strategy - Complete Description**
## **Overview**
This Pine Script indicator is a comprehensive multi-factor trading system specifically designed for **XAUUSD (Gold) scalping and swing trading**. It combines classical technical analysis methods including candlestick patterns, chart patterns, moving averages, and volume analysis to generate high-probability buy/sell signals with automatic stop-loss and take-profit levels.
***
## **Core Components**
### **1. Moving Average System (Triple MA)**
**Purpose:** Identifies trend direction and momentum
- **Fast MA (20-period)** - Short-term price action
- **Medium MA (50-period)** - Intermediate trend
- **Slow MA (200-period)** - Long-term trend direction
**How it works:**
- **Bullish alignment**: MA20 > MA50 > MA200 (all pointing up)
- **Bearish alignment**: MA20 < MA50 < MA200 (all pointing down)
- **Crossover signals**: When Fast MA crosses Medium MA, it triggers buy/sell signals
- **Choice of SMA or EMA**: Adjustable based on preference
**Visual indicators:**
- Blue line = Fast MA
- Orange line = Medium MA
- Light red line = Slow MA
- Green background tint = Bullish trend
- Red background tint = Bearish trend
---
### **2. Candlestick Pattern Recognition (13 Patterns)**
**Purpose:** Identifies reversal and continuation signals based on price action
#### **Bullish Patterns (Signal potential upward moves):**
1. **Hammer** 🔨
- Long lower wick (2x body size)
- Small body at top
- Indicates rejection of lower prices (buyers stepping in)
- Best at support levels
2. **Inverted Hammer**
- Long upper wick
- Small body at bottom
- Shows buying pressure despite initial selling
3. **Bullish Engulfing** 📈
- Green candle completely engulfs previous red candle
- Strong reversal signal
- Body must be 1.2x larger than previous
4. **Morning Star** ⭐
- 3-candle pattern
- Red candle → Small indecision candle → Large green candle
- Powerful reversal at bottoms
5. **Piercing Line** ⚡
- Green candle closes above 50% of previous red candle
- Indicates strong buying interest
6. **Bullish Marubozu**
- Almost no wicks (95% body)
- Very strong bullish momentum
- Body must be 1.3x average size
#### **Bearish Patterns (Signal potential downward moves):**
7. **Shooting Star** 💫
- Long upper wick
- Small body at bottom
- Indicates rejection of higher prices (sellers in control)
- Best at resistance levels
8. **Hanging Man**
- Similar to hammer but appears at top
- Warning of potential reversal down
9. **Bearish Engulfing** 📉
- Red candle completely engulfs previous green candle
- Strong reversal signal
10. **Evening Star** 🌙
- 3-candle pattern (opposite of Morning Star)
- Green → Small → Large red candle
- Powerful top reversal
11. **Dark Cloud Cover** ☁️
- Red candle closes below 50% of previous green candle
- Indicates strong selling pressure
12. **Bearish Marubozu**
- Almost no wicks, pure red body
- Very strong bearish momentum
#### **Neutral Pattern:**
13. **Doji**
- Open and close nearly equal (tiny body)
- Indicates indecision
- Often precedes major moves
**Detection Logic:**
- Compares body size, wick ratios, and position relative to previous candles
- Uses 14-period average body size as reference
- All patterns validated against volume confirmation
***
### **3. Chart Pattern Recognition**
**Purpose:** Identifies major support/resistance and reversal patterns
#### **Patterns Detected:**
**Double Bottom** 📊 (Bullish)
- Two lows at approximately same level
- Indicates strong support
- Breakout above neckline triggers buy signal
- Most reliable at major support zones
**Double Top** 📊 (Bearish)
- Two highs at approximately same level
- Indicates strong resistance
- Breakdown below neckline triggers sell signal
- Most reliable at major resistance zones
**Support & Resistance Levels**
- Automatically plots recent pivot highs (resistance)
- Automatically plots recent pivot lows (support)
- Uses 3-bar strength for validation
- Levels shown as dashed horizontal lines
**Price Action Patterns**
- **Uptrend detection**: Higher highs + higher lows
- **Downtrend detection**: Lower highs + lower lows
- Confirms overall market structure
***
### **4. Volume Analysis**
**Purpose:** Confirms signal strength and filters false signals
**Metrics tracked:**
- **Volume MA (20-period)**: Baseline average volume
- **High volume threshold**: 1.5x the volume average
- **Volume increase**: Current volume > previous 2 bars
**How it's used:**
- All buy/sell signals **require volume confirmation**
- High volume = institutional participation
- Low volume signals are filtered out
- Prevents whipsaw trades during quiet periods
**Visual indicator:**
- Dashboard shows "High" volume in orange when active
- "Normal" shown in gray during low volume
***
### **5. Signal Generation Logic**
**BUY SIGNALS triggered when ANY of these occur:**
1. **Candlestick + Volume**
- Bullish candle pattern detected
- High volume confirmation
- Price above Fast MA
2. **MA Crossover + Volume**
- Fast MA crosses above Medium MA
- High volume confirmation
3. **Double Bottom Breakout**
- Price breaks above support level
- Volume confirmation present
4. **Trend Continuation**
- Uptrend structure intact (higher highs/lows)
- All MAs in bullish alignment
- Price above Fast MA
- Volume confirmation
**SELL SIGNALS triggered when ANY of these occur:**
1. **Candlestick + Volume**
- Bearish candle pattern detected
- High volume confirmation
- Price below Fast MA
2. **MA Crossunder + Volume**
- Fast MA crosses below Medium MA
- High volume confirmation
3. **Double Top Breakdown**
- Price breaks below resistance level
- Volume confirmation present
4. **Trend Continuation**
- Downtrend structure intact (lower highs/lows)
- All MAs in bearish alignment
- Price below Fast MA
- Volume confirmation
***
### **6. Risk Management System**
**Automatic Stop Loss Calculation:**
- Based on ATR (Average True Range) - 14 periods
- **Formula**: Entry price ± (ATR × SL Multiplier)
- **Default multiplier**: 1.5 (adjustable)
- Adapts to market volatility automatically
**Automatic Take Profit Calculation:**
- **Formula**: Entry price ± (ATR × TP Multiplier)
- **Default multiplier**: 2.5 (adjustable)
- **Default Risk:Reward ratio**: 1:1.67
- Higher TP multiplier = more aggressive targets
**Position Management:**
- Tracks ONE position at a time (no pyramiding)
- Automatically closes position when:
- Stop loss is hit
- Take profit is reached
- Opposite MA crossover occurs
- Prevents revenge trading and over-leveraging
**Visual Representation:**
- **Red horizontal line** = Stop Loss level
- **Green horizontal line** = Take Profit level
- Lines remain on chart while position is active
- Automatically disappear when position closes
***
### **7. Visual Elements**
**On-Chart Displays:**
1. **Moving Average Lines**
- Fast MA (Blue, thick)
- Medium MA (Orange, thick)
- Slow MA (Red, thin)
2. **Support/Resistance**
- Green crosses = Support levels
- Red crosses = Resistance levels
3. **Buy/Sell Arrows**
- Large GREEN "BUY" label below bars
- Large RED "SELL" label above bars
4. **Pattern Labels** (Small markers)
- "Hammer", "Bull Engulf", "Morning Star" (green, below bars)
- "Shooting Star", "Bear Engulf", "Evening Star" (red, above bars)
- "Double Bottom" / "Double Top" (blue/orange)
5. **Signal Detail Labels** (Medium size)
- Shows signal reason (e.g., "Bullish Candle", "MA Cross Up")
- Displays Entry, SL, and TP prices
- Color-coded (green for long, red for short)
6. **Background Coloring**
- Light green tint = Bullish MA alignment
- Light red tint = Bearish MA alignment
***
### **8. Information Dashboard**
**Top-right corner table showing:**
| Metric | Description |
|--------|-------------|
| **Position** | Current trade status (LONG/SHORT/None) |
| **MA Trend** | Overall trend direction (Bullish/Bearish/Neutral) |
| **Volume** | Current volume status (High/Normal) |
| **Pattern** | Last detected candlestick pattern |
| **ATR** | Current volatility measurement |
**Purpose:**
- Quick at-a-glance market assessment
- Real-time position tracking
- No need to check multiple indicators
***
### **9. Alert System**
**Complete alert coverage for:**
✅ **Entry Alerts**
- "Buy Signal" - Triggers when buy conditions met
- "Sell Signal" - Triggers when sell conditions met
✅ **Exit Alerts**
- "Long TP Hit" - Take profit reached on long position
- "Long SL Hit" - Stop loss triggered on long position
- "Short TP Hit" - Take profit reached on short position
- "Short SL Hit" - Stop loss triggered on short position
**How to use:**
1. Click "Create Alert" button
2. Select desired alert from dropdown
3. Set notification method (popup, email, SMS, webhook)
4. Never miss a trade opportunity
***
## **Recommended Settings**
### **For Scalping (Quick trades):**
- **Timeframe**: 5-minute
- **Fast MA**: 9
- **Medium MA**: 21
- **Slow MA**: 50
- **SL Multiplier**: 1.0
- **TP Multiplier**: 2.0
- **Volume Threshold**: 1.5x
### **For Swing Trading (Longer holds):**
- **Timeframe**: 1-hour or 4-hour
- **Fast MA**: 20
- **Medium MA**: 50
- **Slow MA**: 200
- **SL Multiplier**: 2.0
- **TP Multiplier**: 3.0
- **Volume Threshold**: 1.3x
### **Best Trading Hours for XAUUSD:**
- **Asian Session**: 00:00 - 08:00 GMT (lower volatility)
- **London Session**: 08:00 - 16:00 GMT (high volatility) ⭐
- **New York Session**: 13:00 - 21:00 GMT (highest volume) ⭐
- **London-NY Overlap**: 13:00 - 16:00 GMT (BEST for scalping) 🔥
***
## **How to Use This Strategy**
### **Step 1: Setup**
1. Open TradingView
2. Load XAUUSD chart
3. Select timeframe (5m, 15m, 1H, or 4H)
4. Add indicator from Pine Editor
5. Adjust settings based on your trading style
### **Step 2: Wait for Signals**
- Watch for GREEN "BUY" or RED "SELL" labels
- Check the signal reason in the detail label
- Verify dashboard shows favorable conditions
- Confirm volume is "High" (not required but preferred)
### **Step 3: Enter Trade**
- Enter at market or limit order near signal price
- Note the displayed Entry, SL, and TP prices
- Set your broker's SL/TP to match indicator levels
### **Step 4: Manage Position**
- Watch for SL/TP lines on chart
- Monitor dashboard for trend changes
- Exit manually if opposite MA crossover occurs
- Let SL/TP do their job (don't move them!)
### **Step 5: Review & Learn**
- Track win rate over 20+ trades
- Adjust multipliers if needed
- Note which patterns work best for you
- Refine entry timing
***
## **Key Advantages**
✅ **Multi-confirmation approach** - Reduces false signals significantly
✅ **Automatic risk management** - No manual calculation needed
✅ **Adapts to volatility** - ATR-based SL/TP adjusts to market conditions
✅ **Volume filtered** - Ensures institutional participation
✅ **Visual clarity** - Easy to understand at a glance
✅ **Complete alert system** - Never miss opportunities
✅ **Pattern education** - Learn patterns as they appear
✅ **Works on all timeframes** - Scalping to swing trading
***
## **Limitations & Considerations**
⚠️ **Not a holy grail** - No strategy wins 100% of trades
⚠️ **Requires practice** - Demo trade first to understand signals
⚠️ **Market conditions matter** - Works best in trending or volatile markets
⚠️ **News events** - Avoid trading during major economic releases
⚠️ **Slippage on 5m** - Fast markets may have execution delays
⚠️ **Pattern subjectivity** - Some patterns may trigger differently than expected
***
## **Risk Management Rules**
1. **Never risk more than 1-2% per trade**
2. **Maximum 3 positions per day** (avoid overtrading)
3. **Don't trade during major news** (NFP, FOMC, etc.)
4. **Use proper position sizing** (0.01 lot per $100 for micro accounts)
5. **Keep trade journal** (track patterns, win rate, mistakes)
6. **Stop trading after 3 consecutive losses** (psychological reset)
7. **Don't move stop loss further away** (accept losses)
8. **Take partial profits** at 1:1 R:R if desired
***
## **Expected Performance**
**Realistic expectations:**
- **Win rate**: 50-65% (depending on market conditions and timeframe)
- **Risk:Reward**: 1:1.67 default (adjustable to 1:2 or 1:3)
- **Signals per day**: 3-8 on 5m, 1-3 on 1H
- **Best months**: High volatility periods (news events, economic uncertainty)
- **Drawdowns**: Expect 3-5 losing trades in a row occasionally
***
## **Customization Options**
All inputs are adjustable in settings panel:
**Moving Averages:**
- Type (SMA or EMA)
- All three period lengths
**Volume:**
- Volume MA length
- High volume multiplier threshold
**Chart Patterns:**
- Pattern strength (bars for pivot detection)
- Show/hide pattern labels
**Risk Management:**
- ATR period
- Stop loss multiplier
- Take profit multiplier
**Display:**
- Toggle pattern labels
- Customize colors (in code)
***
## **Conclusion**
This is a **professional-grade, multi-factor trading system** that combines the best of classical technical analysis with modern risk management. It's designed to give clear, actionable signals while automatically handling the complex calculations of stop loss and take profit levels.
**Best suited for traders who:**
- Understand basic technical analysis
- Can follow rules consistently
- Prefer systematic approach over gut feeling
- Want visual confirmation before entering trades
- Value proper risk management
**Start with demo trading** for at least 20-30 trades to understand how the signals work in different market conditions. Once comfortable and profitable on demo, transition to live trading with minimal risk per trade.
Happy trading! 📈🎯

Strategy Builder With IndicatorsThis strategy script is designed for traders who enjoy building systems using multiple indicators.
Please note: This script does not include any built-in indicators. Instead, it works by referencing the plot outputs of the indicators you’ve already added to your chart.
For example, if you add a MACD and an ATR indicator to your chart, you can assign their plot values as inputs in the settings panel of this strategy.
• MACD as a trigger
• ATR as a filter
How Filters Work
Filters check whether certain conditions are met before a trade can be opened. For instance, if you set a filter like ATR > 30, then no trade will be executed unless that condition is true — even if the trigger fires.
All filters are linked, meaning every active filter must be satisfied for a trade to occur.
How Triggers Work
Triggers are what actually fire a trade signal — such as a moving average crossover or RSI breaking above a specific level. Unlike filters, triggers are independent. Only one active trigger needs to be true for the trade to execute.
Thanks to its modular structure, this strategy can be used with any indicator of your choice.
⸻
Risk Management Features
In the settings, you’ll find flexible options for:
• Stop Loss (SL)
• Trailing Stop Loss (TSL)
• Multi Take-Profit (TP)
These features enhance trade safety and let you tailor your risk management.
SL types available:
• Tick-based SL
• Percent-based SL
• ATR-based SL
Once you select your preferred SL type, you can fine-tune its distance using the offset field.
Trailing SL allows your stop to follow price as it moves in your favor — helping to lock in profits.
Multi-TP lets you take profits at two different levels, helping you secure gains while leaving room for extended moves.
Breakeven option is also available to automatically move your SL to entry after reaching a profit threshold.
⸻
How to Build a Solid Strategy
Let’s break down a good setup into three key components:
1. Trend Filter
Avoid trading against the trend — that’s like swimming against the current.
Use a filter like:
• Supertrend
• Momentum indicators
• Candlestick bias, etc.
Example: In this case, I used Supertrend and filtered for trades only if the price is above the uptrend line.
2. Trigger Condition
Once we confirm the trend is on our side, we need a trigger to execute at the right moment. This can be:
• RSI cross
• Candlestick patterns
• Trendline breaks
• Moving average crossovers, etc.
Example: I used RSI crossing above 50 as the entry trigger.
3. Risk Management
Even in the right trend at the right time — anything can happen. That’s why you should always define Stop Loss and Take Profit levels.
⸻
And there you have it! Your strategy is ready to backtest, refine, and deploy with alerts for live trading.
Questions or suggestions? Feel free to reach out

Grid Bot Parabolic [xxattaxx]🟩 The Grid Bot Parabolic, a continuation of the Grid Bot Simulator Series , enhances traditional gridbot theory by employing a dynamic parabolic curve to visualize potential support and resistance levels. This adaptability is particularly useful in volatile or trending markets, enabling traders to explore grid-based strategies and gain deeper market insights. The grids are divided into customizable trade zones that trigger signals as prices move into new zones, empowering traders to gain deeper insights into market dynamics and potential turning points.
While traditional grid bots excel in ranging markets, the Grid Bot Parabolic’s introduction of acceleration and curvature adds new dimensions, enabling its use in trending markets as well. It can function as a traditional grid bot with horizontal lines, a tilted grid bot with linear slopes, or a fully parabolic grid with curves. This dynamic nature allows the indicator to adapt to various market conditions, providing traders with a versatile tool for visualizing dynamic support and resistance levels.
🔑 KEY FEATURES 🔑
Adaptable Grid Structures (Horizontal, Linear, Curved)
Buy and Sell Signals with Multiple Trigger/Confirmation Conditions
Secondary Buy and Secondary Sell Signals
Projected Grid Lines
Customizable Grid Spacing and Zones
Acceleration and Curvature Control
Sensitivity Adjustments
📐 GRID STRUCTURES 📐
Beyond its core parabolic functionality, the Parabolic Grid Bot offers a range of grid configurations to suit different market conditions and trading preferences. By adjusting the "Acceleration" and "Curvature" parameters, you can transform the grid's structure:
Parabolic Grids
Setting both acceleration and curvature to non-zero values results in a parabolic grid.This configuration can be particularly useful for visualizing potential turning points and trend reversals. Example: Accel = 10, Curve = -10)
Linear Grids
With a non-zero acceleration and zero curvature, the grid tilts to represent a linear trend, aiding in identifying potential support and resistance levels during trending phases. Example: Accel =1.75, Curve = 0
Horizontal Grids
When both acceleration and curvature are set to zero, the indicator reverts to a traditional grid bot with horizontal lines, suitable for ranging markets. Example: Accel=0, Curve=0
⚙️ INITIAL SETUP ⚙️
1.Adding the Indicator to Your Chart
Locate a Starting Point: To begin, visually identify a price point on your chart where you want the grid to start.This point will anchor your grid.
2. Setting Up the Grid
Add the Grid Bot Parabolic Indicator to your chart. A “Start Time/Price” dialog will appear
CLICK on the chart at your chosen start point. This will anchor the start point and open a "Confirm Inputs" dialog box.
3. Configure Settings. In the dialog box, you can set the following:
Acceleration: Adjust how quickly the grid reacts to price changes.
Curve: Define the shape of the parabola.
Intervals: Determine the distance between grid levels.
If you choose to keep the default settings, with acceleration set to 0 and curve set to 0, the grid will display as traditional horizontal lines. The grid will align with your selected price point, and you can adjust the settings at any time through the indicator’s settings panel.
⚙️ CONFIGURATION AND SETTINGS ⚙️
Grid Settings
Accel (Acceleration): Controls how quickly the price reacts to changes over time.
Curve (Curvature): Defines the overall shape of the parabola.
Intervals (Grid Spacing): Determines the vertical spacing between the grid lines.
Sensitivity: Fine tunes the magnitude of Acceleration and Curve.
Buy Zones & Sell Zones: Define the number of grid levels used for potential buy and sell signals.
* Each zone is represented on the chart with different colors:
* Green: Buy Zones
* Red: Sell Zones
* Yellow: Overlap (Buy and Sell Zones intersect)
* Gray: Neutral areas
Trigger: Chooses which part of the candlestick is used to trigger a signal.
* `Wick`: Uses the high or low of the candlestick
* `Close`: Uses the closing price of the candlestick
* `Midpoint`: Uses the middle point between the high and low of the candlestick
* `SWMA`: Uses the Symmetrical Weighted Moving Average
Confirm: Specifies how a signal is confirmed.
* `Reverse`: The signal is confirmed if the price moves in the opposite direction of the initial trigger
* `Touch`: The signal is confirmed when the price touches the specified level or zone
Sentiment: Determines the market sentiment, which can influence signal generation.
* `Slope`: Sentiment is based on the direction of the curve, reflecting the current trend
* `Long`: Sentiment is bullish, favoring buy signals
* `Short`: Sentiment is bearish, favoring sell signals
* `Neutral`: Sentiment is neutral. No secondary signals will be generated
Show Signals: Toggles the display of buy and sell signals on the chart
Chart Settings
Grid Colors: These colors define the visual appearance of the grid lines
Projected: These colors define the visual appearance of the projected lines
Parabola/SWMA: Adjust colors as needed. These are disabled by default.
Time/Price
Start Time & Start Price: These set the starting point for the parabolic curve.
* These fields are automatically populated when you add the indicator to the chart and click on an initial location
* These can be adjusted manually in the settings panel, but he easiest way to change these is by directly interacting with the start point on the chart
Please note: Time and Price must be adjusted for each chart when switching assets. For example, a Start Price on BTCUSD of $60,000 will not work on an ETHUSD chart.
🤖 ALGORITHM AND CALCULATION 🤖
The Parabolic Function
At the core of the Parabolic Grid Bot lies the parabolic function, which calculates a dynamic curve that adapts to price action over time. This curve serves as the foundation for visualizing potential support and resistance levels.
The shape and behavior of the parabola are influenced by three key user-defined parameters:
Acceleration: This parameter controls the rate of change of the curve's slope, influencing its tilt or steepness. A higher acceleration value results in a more pronounced tilt, while a lower value leads to a gentler slope. This applies to both curved and linear grid configurations.
Curvature: This parameter introduces and controls the curvature or bend of the grid. A higher curvature value results in a more pronounced parabolic shape, while a lower value leads to a flatter curve or even a straight line (when set to zero).
Sensitivity: This setting fine-tunes the overall responsiveness of the grid, influencing how strongly the Acceleration and Curvature parameters affect its shape. Increasing sensitivity amplifies the impact of these parameters, making the grid more adaptable to price changes but potentially leading to more frequent adjustments. Decreasing sensitivity reduces their impact, resulting in a more stable grid structure with fewer adjustments. It may be necessary to adjust Sensitivity when switching between different assets or timeframes to ensure optimal scaling and responsiveness.
The parabolic function combines these parameters to generate a curve that visually represents the potential path of price movement. By understanding how these inputs influence the parabola's shape and behavior, traders can gain valuable insights into potential support and resistance areas, aiding in their decision-making process.
Sentiment
The Parabolic Grid Bot incorporates sentiment to enhance signal generation. The "Sentiment" input allows you to either:
Manually specify the market sentiment: Choose between 'Long' (bullish), 'Short' (bearish), or 'Neutral'.
Let the script determine sentiment based on the slope of the parabolic curve: If 'Slope' is selected, the sentiment will be considered 'Long' when the curve is sloping upwards, 'Short' when it's sloping downwards, and 'Neutral' when it's flat.
Buy and Sell Signals
The Parabolic Grid Bot generates buy and sell signals based on the interaction between the price and the grid levels.
Trigger: The "Trigger" input determines which part of the candlestick is used to trigger a signal (wick, close, midpoint, or SWMA).
Confirmation: The "Confirm" input specifies how a signal is confirmed ('Reverse' or 'Touch').
Zones: The number of "Buy Zones" and "Sell Zones" determines the areas on the grid where buy and sell signals can be generated.
When the trigger condition is met within a buy zone and the confirmation criteria are satisfied, a buy signal is generated. Similarly, a sell signal is generated when the trigger and confirmation occur within a sell zone.
Secondary Signals
Secondary signals are generated when a regular buy or sell signal contradicts the prevailing sentiment. For example:
A buy signal in a bearish market (Sentiment = 'Short') would be considered a "secondary buy" signal.
A sell signal in a bullish market (Sentiment = 'Long') would be considered a "secondary sell" signal.
These secondary signals are visually represented on the chart using hollow triangles, differentiating them from regular signals (filled triangles).
While they can be interpreted as potential contrarian trade opportunities, secondary signals can also serve other purposes within a grid trading strategy:
Exit Signals: A secondary signal can suggest a potential shift in market sentiment or a weakening trend. This could be a cue to consider exiting an existing position, even if it's currently profitable, to lock in gains before a potential reversal
Risk Management: In a strong trend, secondary signals might offer opportunities for cautious counter-trend trades with controlled risk. These trades could utilize smaller position sizes or tighter stop-losses to manage potential downside if the main trend continues
Dollar-Cost Averaging (DCA): During a prolonged trend, the parabolic curve might generate multiple secondary signals in the opposite direction. These signals could be used to implement a DCA strategy, gradually accumulating a position at potentially favorable prices as the market retraces or consolidates within the larger trend
Secondary signals should be interpreted with caution and considered in conjunction with other technical indicators and market context. They provide additional insights into potential market reversals or consolidation phases within a broader trend, aiding in adapting your grid trading strategy to the evolving market dynamics.
Examples
Trigger=Wick, Confirm=Touch. Signals are generated when the wick touches the next gridline.
Trigger=Close, Confirm=Touch. Signals require the close to touch the next gridline.
Trigger=SWMA, Confirm=Reverse. Signals are triggered when the Symmetrically Weighted Moving Average reverse crosses the next gridline.
🧠THEORY AND RATIONALE 🧠
The innovative approach of the Parabolic Grid Bot can be better understood by first examining the limitations of traditional grid trading strategies and exploring how this indicator addresses them by incorporating principles of market cycles and dynamic price behavior
Traditional Grid Bots: One-Dimensional and Static
Traditional grid bots operate on a simple premise: they divide the price chart into a series of equally spaced horizontal lines, creating a grid of trading zones. These bots excel in ranging markets where prices oscillate within a defined range. Buy and sell orders are placed at these grid levels, aiming to profit from mean reversion as prices bounce between the support and resistance zones.
However, traditional grid bots face challenges in trending markets. As the market moves in one direction, the bot continues to place orders in that direction, leading to a stacking of positions. If the market eventually reverses, these stacked trades can be profitable, amplifying gains. But the risk lies in the potential for the market to continue trending, leaving the trader with a series of losing trades on the wrong side of the market
The Parabolic Grid Bot: Adding Dimensions
The Parabolic Grid Bot addresses the limitations of traditional grid bots by introducing two additional dimensions:
Acceleration (Second Dimension): This parameter introduces a second dimension to the grid, allowing it to tilt upwards or downwards to align with the prevailing market trend. A positive acceleration creates an upward-sloping grid, suitable for uptrends, while a negative acceleration results in a downward-sloping grid, ideal for downtrends. The magnitude of acceleration controls the steepness of the tilt, enabling you to fine-tune the grid's responsiveness to the trend's strength
Curvature (Third Dimension): This parameter adds a third dimension to the grid by introducing a parabolic curve. The curve's shape, ranging from gentle bends to sharp turns, is controlled by the curvature value. This flexibility allows the grid to closely mirror the market's evolving structure, potentially identifying turning points and trend reversals.
Mean Reversion in Trending Markets
Even in trending markets, the Parabolic Grid Bot can help identify opportunities for mean reversion strategies. While the grid may be tilted to reflect the trend, the buy and sell zones can capture short-term price oscillations or consolidations within the broader trend. This allows traders to potentially pinpoint entry and exit points based on temporary pullbacks or reversals.
Visualize and Adapt
The Parabolic Grid Bot acts as a visual aid, enhancing your understanding of market dynamics. It allows you to "see the curve" by adapting the grid to the market's patterns. If the market shows a parabolic shape, like an upward curve followed by a peak and a downward turn (similar to a head and shoulders pattern), adjust the Accel and Curve to match. This highlights potential areas of interest for further analysis.
Beyond Straight Lines: Visualizing Market Cycle
Traditional technical analysis often employs straight lines, such as trend lines and support/resistance levels, to interpret market movements. However, many analysts, including Brian Millard, contend that these lines can be misleading. They propose that what might appear as a straight line could represent just a small part of a larger curve or cycle that's not fully visible on the chart.
Markets are inherently cyclical, marked by phases of expansion, contraction, and reversal. The Parabolic Grid Bot acknowledges this cyclical behavior by offering a dynamic, curved grid that adapts to these shifts. This approach helps traders move beyond the limitations of straight lines and visualize potential support and resistance levels in a way that better reflects the market's true nature
By capturing these cyclical patterns, whether subtle or pronounced, the Parabolic Grid Bot offers a nuanced understanding of market dynamics, potentially leading to more accurate interpretations of price action and informed trading decisions.
⚠️ DISCLAIMER⚠️
This indicator utilizes a parabolic curve fitting approach to visualize potential support and resistance levels. The mathematical formulas employed have been designed with adaptability and scalability in mind, aiming to accommodate various assets and price ranges. While the resulting curves may visually resemble parabolas, it's important to note that they might not strictly adhere to the precise mathematical definition of a parabola.
The indicator's calculations have been tested and generally produce reliable results. However, no guarantees are made regarding their absolute mathematical accuracy. Traders are encouraged to use this tool as part of their broader analysis and decision-making process, combining it with other technical indicators and market context.
Please remember that trading involves inherent risks, and past performance is not indicative of future results. It is always advisable to conduct your own research and exercise prudent risk management before making any trading decisions.
🧠 BEYOND THE CODE 🧠
The Parabolic Grid Bot, like the other grid bots in this series, is designed with education and community collaboration in mind. Its open-source nature encourages exploration, experimentation, and the development of new grid trading strategies. We hope this indicator serves as a framework and a starting point for future innovations in the field of grid trading.
Your comments, suggestions, and discussions are invaluable in shaping the future of this project. We welcome your feedback and look forward to seeing how you utilize and enhance the Parabolic Grid Bot.

SPY Daily Gamma Levels [Manual Input With Alerts]Overview This indicator plots key options-based support and resistance levels (Gamma Exposure / GEX) directly on your chart. Unlike standard technical analysis, these levels (Call Wall, Gamma Flip, Put Support, and Volatility Trigger) represent where Market Makers are positioned, often acting as "magnets" or "repellents" for price action.
Important Note: TradingView Pine Script cannot currently access external options open interest data natively. Therefore, this is a Manual Input Indicator. You must update the four price levels in the settings each morning before the market opens.
Key Features:
4 Key Levels: Plots the Call Wall, Gamma Flip (Zero Gamma), Put Support, and Volatility Trigger.
Auto-Cleaning: Automatically deletes yesterday's lines to keep your chart clean; lines only show for the current session.
Alerts Included: Built-in alert conditions allow you to set notifications when price crosses the Gamma Flip or breaks the Vol Trigger.
Customization: Fully customizable colors and line styles.
Best Practices:
Timeframe: Works best on 15-minute charts for trend identification and 5-minute charts for entry execution.
Strategy:
Above Gamma Flip: Market generally stabilizes; dealers buy dips.
Below Gamma Flip: Volatility expands; dealers sell rips.
Below Vol Trigger: "Danger Zone" – expect accelerated selling pressure.
How to Get the Data (The AI Workflow)
Since these numbers change daily, I use Google Gemini to fetch the data and remind me every morning. Here is how you can set up the same automated workflow:
1. The Prompt You can ask Gemini (or your preferred AI) the following prompt manually each morning:
"Find the daily SPY Call Wall, Gamma Flip, Put Support, and Vol Trigger levels for today to input into my TradingView indicator."
2. Automating the Routine I have set up a scheduled daily reminder with Gemini. To do this yourself, simply ask Gemini:
"Can you schedule a daily task to search for these SPY Gamma levels and send them to me every morning at 8:00 AM?"
3. Updating the Chart
Receive the notification from the AI.
Open the Indicator Settings in TradingView.
Type in the new numbers.
The chart updates instantly.
Disclaimer: This tool is for educational purposes only. Gamma levels are estimates based on Open Interest and Dealer Gamma exposure models. Always manage your risk.

MVRVZ BTCMVRVZ BTC (Market Value to Realized Value Z-Score)
Description:
The MVRVZ BTC indicator provides insights into the relationship between the market value and realized value of Bitcoin, using the Market Value to Realized Value (MVRV) ratio, which is then adjusted using a Z-Score. This indicator highlights potential market extremes and helps in identifying overbought or oversold conditions, offering a unique perspective on Bitcoin's valuation.
How It Works:
MVRVZ is calculated by taking the difference between Bitcoin's Market Capitalization (MC) and Realized Capitalization (MCR), then dividing that by the Standard Deviation (Stdev) of the price over a specified period (usually 104 weeks).
The resulting value is plotted as the MVRVZ line, representing how far the market price deviates from its realized value.
Z-Score is then applied to the MVRVZ line, with the Z-Score bounded between +2 and -2, which allows it to be used within a consistent evaluation framework, regardless of how high or low the MVRVZ line goes. The Z-Score will reflect overbought or oversold conditions:
A Z-Score above +2 indicates the market is likely overbought (possible market top).
A Z-Score below -2 indicates the market is likely oversold (possible market bottom).
Values between -2 and +2 indicate more neutral market conditions.
How to Read the Indicator:
MVRVZ Line:
The MVRVZ line shows the relationship between market cap and realized cap. A higher value indicates the market is overvalued relative to the actual capital realized by holders.
The MVRVZ line can move above or below the top and bottom lines you define, which are adjustable according to your preferences. These lines act as trigger levels.
Top and Bottom Trigger Lines:
You can customize the Top Line and Bottom Line values to your preference.
When the MVRVZ line crosses the Top Line, the market might be considered overbought.
When the MVRVZ line crosses the Bottom Line, the market might be considered oversold.
SCDA Z-Score:
The Z-Score is displayed alongside the MVRVZ line and is bounded between -2 and +2. It scales proportionally based on the MVRVZ line's position relative to the top and bottom trigger lines.
The Z-Score ensures that even if the MVRVZ line moves beyond the trigger lines, the Z-Score will stay within the limits of -2 to +2, making it ideal for your custom evaluation system (SCDA).
Background Highlighting:
The background color changes when the MVRVZ line crosses key levels:
When the MVRVZ line exceeds the Top Trigger, the background turns red, indicating overbought conditions.
When the MVRVZ line falls below the Bottom Trigger, the background turns green, indicating oversold conditions.
Data Sources:
The data for the MVRVZ indicator is sourced from Glassnode and Coinmetrics, which provide the necessary values for:
BTC Market Cap (MC) – The total market capitalization of Bitcoin.
BTC Realized Market Cap (MCR) – The capitalization based on the price at which Bitcoin was last moved on the blockchain (realized value).
How to Use the Indicator:
Market Extremes:
Use the MVRVZ and Z-Score to spot potential market tops or bottoms.
A high Z-Score (above +2) suggests the market is overbought, while a low Z-Score (below -2) suggests the market is oversold.
Adjusting the Triggers:
Customize the Top and Bottom Trigger Lines to suit your trading strategy. These lines can act as dynamic reference points for when to take action based on the Z-Score or MVRVZ line crossing these levels.
Market Evaluation (SCDA Framework):
The bounded Z-Score (from -2 to +2) is tailored for your SCDA evaluation system, allowing you to assess market conditions based on consistent criteria, no matter how volatile the MVRVZ line becomes.
Conclusion:
The MVRVZ BTC indicator is a powerful tool for assessing the relative valuation of Bitcoin based on its market and realized capitalization. By combining it with the Z-Score, you get an easy-to-read, bounded evaluation system that highlights potential market extremes and helps you make informed decisions about Bitcoin's price behavior.

Heikinisi Candle (With MA + Smoothing + Buy/Sell with Cooldown)This custom Heikinisi Candle (With MA + Smoothing + Buy/Sell with Cooldown) indicator combines the advantages of Heikin-Ashi candles with the flexibility of multiple moving averages and smoothing options. The built-in buy/sell signals with cooldown functionality help traders avoid overtrading while capturing trend reversals and momentum shifts. Whether you're a day trader, swing trader, or long-term investor, this indicator offers powerful tools for analyzing price action and making informed trading decisions.
Note: Disable the regular candle to get better visualization.
Key Features:
Custom Heikin-Ashi Candles:
The core feature of this script is the Heikin-Ashi candles, which are known for smoothing price action and helping traders identify market trends more clearly.
Unlike traditional Heikin-Ashi, this version adjusts the Heikin-Ashi close based on specific price action patterns, including rejection signals and engulfing patterns.
The custom Heikin-Ashi open also incorporates momentum, adjusting dynamically based on recent price changes.
Price Action Measurements:
The indicator measures key price action components, including:
Body: The absolute difference between the open and close.
Candle Range: The total range from high to low.
Upper Wick: The distance from the highest price to the maximum of open or close.
Lower Wick: The distance from the lowest price to the minimum of open or close.
These measurements help detect bullish and bearish conditions, as well as price rejection signals.
Buy/Sell Signal Logic:
Buy Signal: Triggered when the Heikin-Ashi close is above the chosen moving average (MA1), with a cooldown period to avoid too frequent signals.
Sell Signal: Triggered when the Heikin-Ashi close falls below the MA1 after a buy signal has already been issued.
The cooldown period ensures that buy and sell signals are spaced apart by a specific number of bars, preventing excessive signal generation during periods of price consolidation.
Multiple Moving Averages (MA):
This script supports up to three customizable moving averages (MA1, MA2, MA3), each of which can be set to different types and lengths, including:
Simple Moving Average (SMA)
Exponential Moving Average (EMA)
Weighted Moving Average (WMA)
Volume Weighted Moving Average (VWMA)
Volume Weighted Moving Price (VWMP)
Least Squares Moving Average (LSMA)
Hull Moving Average (HMA)
Double Exponential Moving Average (DEMA)
Triple Exponential Moving Average (TEMA)
Users can adjust the length and type of each MA for tailored analysis.
Smoothing Options for MAs:
Users can smooth the output of MAs using various types of smoothing algorithms (SMA, EMA, LSMA, WMA, Gaussian) and a customizable length. This helps to reduce noise in the moving average lines and provides clearer signals.
Gaussian Filter (Advanced Smoothing):
A Gaussian Filter is available as a smoothing option for MAs. This filter reduces noise and makes the moving averages smoother, which can be particularly helpful in volatile or choppy markets.
Alerts and Visualization:
The script allows users to plot buy and sell signals on the chart with distinctive markers. A Buy Signal is shown below the bar with a lime green marker and text "Buy," while a Sell Signal is shown above the bar with a red marker and text "Sell."
Traders can also set up alerts based on the buy/sell signals to get notified in real time.
Indicator Configuration:
Heikin-Ashi Candle Configuration:
Automatically adjusts Heikin-Ashi candles based on rejection signals, engulfing patterns, and momentum. It uses custom formulas for the Heikin-Ashi open and close, making it more sensitive to price action than standard Heikin-Ashi candles.
Moving Averages (MA) Configuration:
You can select from multiple moving average types and lengths (MA1, MA2, MA3) for trend-following analysis.
Choose between SMA, EMA, WMA, VWMA, VWMP, LSMA, HMA, DEMA, and TEMA.
Smoothing Options:
Enable or disable smoothing for the moving averages.
Select from different smoothing types, including SMA, EMA, RMA, WMA, LSMA, and Gaussian.
Cooldown Period:
Control the number of bars that must pass before a new buy/sell signal is triggered. This cooldown period helps prevent excessive trading signals in quick succession.
How to Use:
Analyze Price Action with Heikin-Ashi Candles:
The custom Heikin-Ashi candles are ideal for spotting market trends, reversals, and price rejection. Use the candle patterns to gauge the market sentiment.
Use MAs for Trend Confirmation:
The moving averages (MA1, MA2, MA3) can help identify the prevailing trend. A price above a rising MA indicates an uptrend, while a price below a falling MA suggests a downtrend.
Trigger Buy and Sell Signals:
When the Heikin-Ashi close crosses above MA1, a buy signal is triggered.
When the Heikin-Ashi close crosses below MA1 after a buy signal, a sell signal is triggered.
The cooldown period ensures that signals are spaced out, preventing overtrading.
Use Smoothing for Clearer Signals:
If you are trading in a volatile market, you can use the smoothing options to make the MAs smoother and reduce noise.

Risk MeterRisk Meter Indicator for TradingView
The Risk Meter is a powerful market risk assessment tool designed to help traders evaluate the current risk environment using a simple, data-driven score. By analyzing four critical market factors—VIX (volatility index), market breadth, trailing volatility, and credit spreads—the indicator generates a risk score between 0 and 4. This score empowers traders to make informed decisions about hedging, exiting positions, or re-entering the market, with clear visual cues and alerts for intraday monitoring.
What It Does
Calculates a Risk Score: Assigns a score from 0 to 4, where each point reflects an active risk condition based on four market indicators.
Identifies Risk Levels:
A score of 3 or higher indicates a high-risk environment, suggesting traders consider hedging or reducing exposure.
A score of 2 or lower for at least two consecutive days signals a potential opportunity to re-enter the market.
Provides Visual Feedback: Uses color-coded Columns, threshold markers, and a component table for quick interpretation.
Supports Decision-Making: Offers a structured approach to managing risk and timing trades.
How It Works
The Risk Meter aggregates four key risk conditions, each contributing 1 point to the total score when triggered:
Elevated and Rising VIX (Risk 1)
Condition: The VIX is above 18 and higher than it was 20 days ago.
Purpose: Detects increasing market fear or uncertainty.
Market Breadth Dropping (Risk 2)
Condition: Either:
Fewer than 50% of S&P 500 stocks are above their 200-day moving average and fewer than 70% are above their 50-day moving average, or
The 3-day EMA of the 200-day breadth falls below 80% of its 20-day SMA.
Purpose: Identifies weakening participation across the market.
Trailing Volatility (Risk 3)
Condition: The 30-day annualized volatility of the equal-weight S&P 500 (RSP) exceeds 35%.
Purpose: Highlights periods of heightened price instability.
Credit Spreads (Risk 4)
Condition: The price ratio of high-yield bonds (HYG) to Treasuries (TLT or IEF) is lower than it was 20 days ago, indicating widening credit spreads.
Purpose: Signals potential stress in credit markets.
The total risk score is the sum of these conditions (0 to 4). Additionally, the indicator tracks consecutive days with a score of 2 or lower to generate re-entry signals.
How to Read It Intraday
The Risk Meter is built on daily data but can be monitored intraday for real-time insights. Here’s how traders can interpret it:
Risk Score Plot:
Displayed as a step line ranging from 0 to 4.
Colors:
Red: High risk (score ≥ 3) – caution advised.
Green: Re-entry signal – score ≤ 2 for at least two consecutive days (triggered when the count increments from 1 to 2).
Blue: Neutral or low risk (score < 3 without a re-entry signal).
Threshold Lines:
Dashed Gray Line at 3: Marks the high-risk threshold.
Dotted Gray Line at 2: Indicates the low-risk threshold for re-entry signals.
Risk Component Table:
Located in the top-right corner, it lists:
VIX, Breadth, Volatility, and Credit Spreads.
Status: Shows "" (warning, red) if the risk condition is met, or "✓" (safe, blue) if not.
Helps traders pinpoint which factors are driving the score.
Alerts:
High Risk Alert: Triggers when the score moves from < 3 to ≥ 3.
Re-entry Signal Alert: Triggers when the score ≤ 2 for two consecutive days.
Intraday Usage Tips
Check the indicator throughout the day for early signs of risk shifts, especially if the score is near a threshold (e.g., 2 or 3).
Combine with other intraday tools (e.g., price action, volume) since the Risk Meter updates daily but reflects broader market conditions.
How Traders Can Use It
High-Risk Signal (Score ≥ 3):
Consider hedging positions (e.g., with options) or reducing equity exposure to protect against potential downturns.
Re-entry Signal (Score ≤ 2 for 2+ Days):
Look to re-enter the market or increase exposure, as it suggests stabilizing conditions.
Daily Risk Management:
Use the score and table to assess overall market health and adjust strategies accordingly.
Alert-Driven Trading:
Set up alerts to stay notified of critical risk changes without constant monitoring.
Why Use the Risk Meter?
This indicator offers a systematic, multi-factor approach to risk assessment, blending volatility, breadth, and credit market data into an easy-to-read score. Whether you’re an intraday trader or a longer-term investor, the Risk Meter helps you stay proactive, avoid surprises, and time your trades with greater confidence.
Financial Risk Disclaimer for the Risk Meter Tool
Important Notice: The Risk Meter is a market risk assessment tool designed to provide insights into current market conditions based on historical data and predefined indicators. It is intended for informational and educational purposes only and should not be considered financial advice, a recommendation to buy or sell any securities, or a guarantee of future market performance.
Key Considerations
No Guarantee of Accuracy: While the Risk Meter utilizes reliable data sources and established financial metrics, the creators do not guarantee the accuracy, completeness, or timeliness of the information provided. Financial markets are complex and subject to rapid, unpredictable changes, and the tool’s output may not fully reflect all market dynamics.
Market Risks: Trading and investing in financial markets carry significant risks, including the potential loss of principal. Market volatility, economic shifts, and other factors can lead to unexpected outcomes. Past performance is not a reliable indicator of future results, and the Risk Meter’s assessments are based on historical data, not future predictions.
Not a Substitute for Professional Advice: The Risk Meter is not intended to replace personalized financial guidance. Users are strongly encouraged to consult a qualified financial advisor, perform their own research, and evaluate their personal financial situation, risk tolerance, and investment objectives before making any trading or investment decisions.
Limitation of Liability: The creators of the Risk Meter, including any affiliates, developers, or contributors, are not liable for any direct, indirect, incidental, or consequential losses or damages arising from the use of this tool. This includes, but is not limited to, financial losses, missed opportunities, or decisions based on the tool’s output.
User Responsibility: By using the Risk Meter, you accept full responsibility for your trading and investment decisions. You acknowledge that you use the tool at your own risk and that the creators bear no responsibility for any outcomes resulting from its use.
Final Note
The Risk Meter is a supplementary tool designed to enhance your understanding of market risk. It is not a comprehensive solution for investment management. Approach trading and investing with caution, ensuring your decisions align with your personal financial strategy.

Multi-Timeframe Stochastic Alert [tradeviZion]# Multi-Timeframe Stochastic Alert : Complete User Guide
## 1. Introduction
### What is the Multi-Timeframe Stochastic Alert?
The Multi-Timeframe Stochastic Alert is an advanced technical analysis tool that helps traders identify potential trading opportunities by analyzing momentum across multiple timeframes. It combines the power of the stochastic oscillator with multi-timeframe analysis to provide more reliable trading signals.
### Key Features and Benefits
- Simultaneous analysis of 6 different timeframes
- Advanced alert system with customizable conditions
- Real-time visual feedback with color-coded signals
- Comprehensive data table with instant market insights
- Motivational trading messages for psychological support
- Flexible theme support for comfortable viewing
### How it Can Help Your Trading
- Identify stronger trends by confirming momentum across multiple timeframes
- Reduce false signals through multi-timeframe confirmation
- Stay informed of market changes with customizable alerts
- Make more informed decisions with comprehensive market data
- Maintain trading discipline with clear visual signals
## 2. Understanding the Display
### The Stochastic Chart
The main chart displays three key components:
1. ** K-Line (Fast) **: The primary stochastic line (default color: green)
2. ** D-Line (Slow) **: The signal line (default color: red)
3. ** Reference Lines **:
- Overbought Level (80): Upper dashed line
- Middle Line (50): Center dashed line
- Oversold Level (20): Lower dashed line
### The Information Table
The table provides a comprehensive view of stochastic readings across all timeframes. Here's what each column means:
#### Column Explanations:
1. ** Timeframe **
- Shows the time period for each row
- Example: "5" = 5 minutes, "15" = 15 minutes, etc.
2. ** K Value **
- The fast stochastic line value (0-100)
- Higher values indicate stronger upward momentum
- Lower values indicate stronger downward momentum
3. ** D Value **
- The slow stochastic line value (0-100)
- Helps confirm momentum direction
- Crossovers with K-line can signal potential trades
4. ** Status **
- Shows current momentum with symbols:
- ▲ = Increasing (bullish)
- ▼ = Decreasing (bearish)
- Color matches the trend direction
5. ** Trend **
- Shows the current market condition:
- "Overbought" (above 80)
- "Bullish" (above 50)
- "Bearish" (below 50)
- "Oversold" (below 20)
#### Row Explanations:
1. ** Title Row **
- Shows "🎯 Multi-Timeframe Stochastic"
- Indicates the indicator is active
2. ** Header Row **
- Contains column titles
- Dark blue background for easy reading
3. ** Timeframe Rows **
- Six rows showing different timeframe analyses
- Each row updates independently
- Color-coded for easy trend identification
4. **Message Row**
- Shows rotating motivational messages
- Updates every 5 bars
- Helps maintain trading discipline
### Visual Indicators and Colors
- ** Green Background **: Indicates bullish conditions
- ** Red Background **: Indicates bearish conditions
- ** Color Intensity **: Shows strength of the signal
- ** Background Highlights **: Appear when alert conditions are met
## 3. Core Settings Groups
### Stochastic Settings
These settings control the core calculation of the stochastic oscillator.
1. ** Length (Default: 14) **
- What it does: Determines the lookback period for calculations
- Higher values (e.g., 21): More stable, fewer signals
- Lower values (e.g., 8): More sensitive, more signals
- Recommended:
* Day Trading: 8-14
* Swing Trading: 14-21
* Position Trading: 21-30
2. ** Smooth K (Default: 3) **
- What it does: Smooths the main stochastic line
- Higher values: Smoother line, fewer false signals
- Lower values: More responsive, but more noise
- Recommended:
* Day Trading: 2-3
* Swing Trading: 3-5
* Position Trading: 5-7
3. ** Smooth D (Default: 3) **
- What it does: Smooths the signal line
- Works in conjunction with Smooth K
- Usually kept equal to or slightly higher than Smooth K
- Recommended: Keep same as Smooth K for consistency
4. ** Source (Default: Close) **
- What it does: Determines price data for calculations
- Options: Close, Open, High, Low, HL2, HLC3, OHLC4
- Recommended: Stick with Close for most reliable signals
### Timeframe Settings
Controls the multiple timeframes analyzed by the indicator.
1. ** Main Timeframes (TF1-TF6) **
- TF1 (Default: 10): Shortest timeframe for quick signals
- TF2 (Default: 15): Short-term trend confirmation
- TF3 (Default: 30): Medium-term trend analysis
- TF4 (Default: 30): Additional medium-term confirmation
- TF5 (Default: 60): Longer-term trend analysis
- TF6 (Default: 240): Major trend confirmation
Recommended Combinations:
* Scalping: 1, 3, 5, 15, 30, 60
* Day Trading: 5, 15, 30, 60, 240, D
* Swing Trading: 15, 60, 240, D, W, M
2. ** Wait for Bar Close (Default: true) **
- What it does: Controls when calculations update
- True: More reliable but slightly delayed signals
- False: Faster signals but may change before bar closes
- Recommended: Keep True for more reliable signals
### Alert Settings
#### Main Alert Settings
1. ** Enable Alerts (Default: true) **
- Master switch for all alert notifications
- Toggle this off when you don't want any alerts
- Useful during testing or when you want to focus on visual signals only
2. ** Alert Condition (Options) **
- "Above Middle": Bullish momentum alerts only
- "Below Middle": Bearish momentum alerts only
- "Both": Alerts for both directions
- Recommended:
* Trending Markets: Choose direction matching the trend
* Ranging Markets: Use "Both" to catch reversals
* New Traders: Start with "Both" until you develop a specific strategy
3. ** Alert Frequency **
- "Once Per Bar": Immediate alerts during the bar
- "Once Per Bar Close": Alerts only after bar closes
- Recommended:
* Day Trading: "Once Per Bar" for quick reactions
* Swing Trading: "Once Per Bar Close" for confirmed signals
* Beginners: "Once Per Bar Close" to reduce false signals
#### Timeframe Check Settings
1. ** First Check (TF1) **
- Purpose: Confirms basic trend direction
- Alert Triggers When:
* For Bullish: Stochastic is above middle line (50)
* For Bearish: Stochastic is below middle line (50)
* For Both: Triggers in either direction based on position relative to middle line
- Settings:
* Enable/Disable: Turn first check on/off
* Timeframe: Default 5 minutes
- Best Used For:
* Quick trend confirmation
* Entry timing
* Scalping setups
2. ** Second Check (TF2) **
- Purpose: Confirms both position and momentum
- Alert Triggers When:
* For Bullish: Stochastic is above middle line AND both K&D lines are increasing
* For Bearish: Stochastic is below middle line AND both K&D lines are decreasing
* For Both: Triggers based on position and direction matching current condition
- Settings:
* Enable/Disable: Turn second check on/off
* Timeframe: Default 15 minutes
- Best Used For:
* Trend strength confirmation
* Avoiding false breakouts
* Day trading setups
3. ** Third Check (TF3) **
- Purpose: Confirms overall momentum direction
- Alert Triggers When:
* For Bullish: Both K&D lines are increasing (momentum confirmation)
* For Bearish: Both K&D lines are decreasing (momentum confirmation)
* For Both: Triggers based on matching momentum direction
- Settings:
* Enable/Disable: Turn third check on/off
* Timeframe: Default 30 minutes
- Best Used For:
* Major trend confirmation
* Swing trading setups
* Avoiding trades against the main trend
Note: All three conditions must be met simultaneously for the alert to trigger. This multi-timeframe confirmation helps reduce false signals and provides stronger trade setups.
#### Alert Combinations Examples
1. ** Conservative Setup **
- Enable all three checks
- Use "Once Per Bar Close"
- Timeframe Selection Example:
* First Check: 15 minutes
* Second Check: 1 hour (60 minutes)
* Third Check: 4 hours (240 minutes)
- Wider gaps between timeframes reduce noise and false signals
- Best for: Swing trading, beginners
2. ** Aggressive Setup **
- Enable first two checks only
- Use "Once Per Bar"
- Timeframe Selection Example:
* First Check: 5 minutes
* Second Check: 15 minutes
- Closer timeframes for quicker signals
- Best for: Day trading, experienced traders
3. ** Balanced Setup **
- Enable all checks
- Use "Once Per Bar"
- Timeframe Selection Example:
* First Check: 5 minutes
* Second Check: 15 minutes
* Third Check: 1 hour (60 minutes)
- Balanced spacing between timeframes
- Best for: All-around trading
### Visual Settings
#### Alert Visual Settings
1. ** Show Background Color (Default: true) **
- What it does: Highlights chart background when alerts trigger
- Benefits:
* Makes signals more visible
* Helps spot opportunities quickly
* Provides visual confirmation of alerts
- When to disable:
* If using multiple indicators
* When preferring a cleaner chart
* During manual backtesting
2. ** Background Transparency (Default: 90) **
- Range: 0 (solid) to 100 (invisible)
- Recommended Settings:
* Clean Charts: 90-95
* Multiple Indicators: 85-90
* Single Indicator: 80-85
- Tip: Adjust based on your chart's overall visibility
3. ** Background Colors **
- Bullish Background:
* Default: Green
* Indicates upward momentum
* Customizable to match your theme
- Bearish Background:
* Default: Red
* Indicates downward momentum
* Customizable to match your theme
#### Level Settings
1. ** Oversold Level (Default: 20) **
- Traditional Setting: 20
- Adjustable Range: 0-100
- Usage:
* Lower values (e.g., 10): More conservative
* Higher values (e.g., 30): More aggressive
- Trading Applications:
* Potential bullish reversal zone
* Support level in uptrends
* Entry point for long positions
2. ** Overbought Level (Default: 80) **
- Traditional Setting: 80
- Adjustable Range: 0-100
- Usage:
* Lower values (e.g., 70): More aggressive
* Higher values (e.g., 90): More conservative
- Trading Applications:
* Potential bearish reversal zone
* Resistance level in downtrends
* Exit point for long positions
3. ** Middle Line (Default: 50) **
- Purpose: Trend direction separator
- Applications:
* Above 50: Bullish territory
* Below 50: Bearish territory
* Crossing 50: Potential trend change
- Trading Uses:
* Trend confirmation
* Entry/exit trigger
* Risk management level
#### Color Settings
1. ** Bullish Color (Default: Green) **
- Used for:
* K-Line (Main stochastic line)
* Status symbols when trending up
* Trend labels for bullish conditions
- Customization:
* Choose colors that stand out
* Match your trading platform theme
* Consider color blindness accessibility
2. ** Bearish Color (Default: Red) **
- Used for:
* D-Line (Signal line)
* Status symbols when trending down
* Trend labels for bearish conditions
- Customization:
* Choose contrasting colors
* Ensure visibility on your chart
* Consider monitor settings
3. ** Neutral Color (Default: Gray) **
- Used for:
* Middle line (50 level)
- Customization:
* Should be less prominent
* Easy on the eyes
* Good background contrast
### Theme Settings
1. **Color Theme Options**
- Dark Theme (Default):
* Dark background with white text
* Optimized for dark chart backgrounds
* Reduces eye strain in low light
- Light Theme:
* Light background with black text
* Better visibility in bright conditions
- Custom Theme:
* Use your own color preferences
2. ** Available Theme Colors **
- Table Background
- Table Text
- Table Headers
Note: The theme affects only the table display colors. The stochastic lines and alert backgrounds use their own color settings.
### Table Settings
#### Position and Size
1. ** Table Position **
- Options:
* Top Right (Default)
* Middle Right
* Bottom Right
* Top Left
* Middle Left
* Bottom Left
- Considerations:
* Chart space utilization
* Personal preference
* Multiple monitor setups
2. ** Text Sizes **
- Title Size Options:
* Tiny: Minimal space usage
* Small: Compact but readable
* Normal (Default): Standard visibility
* Large: Enhanced readability
* Huge: Maximum visibility
- Data Size Options:
* Recommended: One size smaller than title
* Adjust based on screen resolution
* Consider viewing distance
3. ** Empowering Messages **
- Purpose:
* Maintain trading discipline
* Provide psychological support
* Remind of best practices
- Rotation:
* Changes every 5 bars
* Categories include:
- Market Wisdom
- Strategy & Discipline
- Mindset & Growth
- Technical Mastery
- Market Philosophy
## 4. Setting Up for Different Trading Styles
### Day Trading Setup
1. **Timeframes**
- Primary: 5, 15, 30 minutes
- Secondary: 1H, 4H
- Alert Settings: "Once Per Bar"
2. ** Stochastic Settings **
- Length: 8-14
- Smooth K/D: 2-3
- Alert Condition: Match market trend
3. ** Visual Settings **
- Background: Enabled
- Transparency: 85-90
- Theme: Based on trading hours
### Swing Trading Setup
1. ** Timeframes **
- Primary: 1H, 4H, Daily
- Secondary: Weekly
- Alert Settings: "Once Per Bar Close"
2. ** Stochastic Settings **
- Length: 14-21
- Smooth K/D: 3-5
- Alert Condition: "Both"
3. ** Visual Settings **
- Background: Optional
- Transparency: 90-95
- Theme: Personal preference
### Position Trading Setup
1. ** Timeframes **
- Primary: Daily, Weekly
- Secondary: Monthly
- Alert Settings: "Once Per Bar Close"
2. ** Stochastic Settings **
- Length: 21-30
- Smooth K/D: 5-7
- Alert Condition: "Both"
3. ** Visual Settings **
- Background: Disabled
- Focus on table data
- Theme: High contrast
## 5. Troubleshooting Guide
### Common Issues and Solutions
1. ** Too Many Alerts **
- Cause: Settings too sensitive
- Solutions:
* Increase timeframe intervals
* Use "Once Per Bar Close"
* Enable fewer timeframe checks
* Adjust stochastic length higher
2. ** Missed Signals **
- Cause: Settings too conservative
- Solutions:
* Decrease timeframe intervals
* Use "Once Per Bar"
* Enable more timeframe checks
* Adjust stochastic length lower
3. ** False Signals **
- Cause: Insufficient confirmation
- Solutions:
* Enable all three timeframe checks
* Use larger timeframe gaps
* Wait for bar close
* Confirm with price action
4. ** Visual Clarity Issues **
- Cause: Poor contrast or overlap
- Solutions:
* Adjust transparency
* Change theme settings
* Reposition table
* Modify color scheme
### Best Practices
1. ** Getting Started **
- Start with default settings
- Use "Both" alert condition
- Enable all timeframe checks
- Wait for bar close
- Monitor for a few days
2. ** Fine-Tuning **
- Adjust one setting at a time
- Document changes and results
- Test in different market conditions
- Find your optimal timeframe combination
- Balance sensitivity with reliability
3. ** Risk Management **
- Don't trade against major trends
- Confirm signals with price action
- Use appropriate position sizing
- Set clear stop losses
- Follow your trading plan
4. ** Regular Maintenance **
- Review settings weekly
- Adjust for market conditions
- Update color scheme for visibility
- Clean up chart regularly
- Maintain trading journal
## 6. Tips for Success
1. ** Entry Strategies **
- Wait for all timeframes to align
- Confirm with price action
- Use proper position sizing
- Consider market conditions
2. ** Exit Strategies **
- Trail stops using indicator levels
- Take partial profits at targets
- Honor your stop losses
- Don't fight the trend
3. ** Psychology **
- Stay disciplined with settings
- Don't override system signals
- Keep emotions in check
- Learn from each trade
4. ** Continuous Improvement **
- Record your trades
- Review performance regularly
- Adjust settings gradually
- Stay educated on markets

Uptrick: DPO Signal & Zone Indicator
## **Uptrick: DPO Signal & Zone Indicator**
### **Introduction:**
The **Uptrick: DPO Signal & Zone Indicator** is a sophisticated technical analysis tool tailored to provide insights into market momentum, identify potential trading signals, and recognize extreme market conditions. It leverages the Detrended Price Oscillator (DPO) to strip out long-term trends from price movements, allowing traders to focus on short-term fluctuations and cyclical behavior. The indicator integrates multiple components, including a Detrended Price Oscillator, a Signal Line, a Histogram, and customizable alert levels, to deliver a robust framework for market analysis and trading decision-making.
### **Detailed Breakdown:**
#### **1. Detrended Price Oscillator (DPO):**
- **Purpose and Functionality:**
- The DPO is designed to filter out long-term trends from the price data, isolating short-term price movements. This helps in understanding the cyclical patterns and momentum of an asset, allowing traders to detect periods of acceleration or deceleration that might be overlooked when focusing solely on long-term trends.
- **Calculation:**
- **Formula:** `dpo = close - ta.sma(close, smaLength)`
- **`close`:** The asset’s closing price for each period in the dataset.
- **`ta.sma(close, smaLength)`:** The Simple Moving Average (SMA) of the closing prices over a period defined by `smaLength`.
- The DPO is derived by subtracting the SMA value from the current closing price. This calculation reveals how much the current price deviates from the moving average, effectively detrending the price data.
- **Interpretation:**
- **Positive DPO Values:** Indicate that the current price is higher than the moving average, suggesting bullish market conditions and a potential upward trend.
- **Negative DPO Values:** Indicate that the current price is lower than the moving average, suggesting bearish market conditions and a potential downward trend.
- **Magnitude of DPO:** Reflects the strength of momentum. Larger positive or negative values suggest stronger momentum in the respective direction.
#### **2. Signal Line:**
- **Purpose and Functionality:**
- The Signal Line is a smoothed average of the DPO, intended to act as a reference point for generating trading signals. It helps to filter out short-term fluctuations and provides a clearer perspective on the prevailing trend.
- **Calculation:**
- **Formula:** `signalLine = ta.sma(dpo, signalLength)`
- **`ta.sma(dpo, signalLength)`:** The SMA of the DPO values over a period defined by `signalLength`.
- The Signal Line is calculated by applying a moving average to the DPO values. This smoothing process reduces noise and highlights the underlying trend direction.
- **Interpretation:**
- **DPO Crossing Above Signal Line:** Generates a buy signal, suggesting that short-term momentum is turning bullish relative to the longer-term trend.
- **DPO Crossing Below Signal Line:** Generates a sell signal, suggesting that short-term momentum is turning bearish relative to the longer-term trend.
- **Signal Line’s Role:** Provides a benchmark for assessing the strength of the DPO. The interaction between the DPO and the Signal Line offers actionable insights into potential entry or exit points.
#### **3. Histogram:**
- **Purpose and Functionality:**
- The Histogram visualizes the difference between the DPO and the Signal Line. It provides a graphical representation of momentum strength and direction, allowing traders to quickly gauge market conditions.
- **Calculation:**
- **Formula:** `histogram = dpo - signalLine`
- The Histogram is computed by subtracting the Signal Line value from the DPO value. Positive values indicate that the DPO is above the Signal Line, while negative values indicate that the DPO is below the Signal Line.
- **Interpretation:**
- **Color Coding:**
- **Green Bars:** Represent positive values, indicating bullish momentum.
- **Red Bars:** Represent negative values, indicating bearish momentum.
- **Width of Bars:** Indicates the strength of momentum. Wider bars signify stronger momentum, while narrower bars suggest weaker momentum.
- **Zero Line:** A horizontal gray line that separates positive and negative histogram values. Crosses of the histogram through this zero line can signal shifts in momentum direction.
#### **4. Alert Levels:**
- **Purpose and Functionality:**
- Alert levels define specific thresholds to identify extreme market conditions, such as overbought and oversold states. These levels help traders recognize potential reversal points and extreme market conditions.
- **Inputs:**
- **`alertLevel1`:** Defines the upper threshold for identifying overbought conditions.
- **Default Value:** 0.5
- **`alertLevel2`:** Defines the lower threshold for identifying oversold conditions.
- **Default Value:** -0.5
- **Interpretation:**
- **Overbought Condition:** When the DPO exceeds `alertLevel1`, indicating that the market may be overbought. This condition suggests that the asset could be due for a correction or reversal.
- **Oversold Condition:** When the DPO falls below `alertLevel2`, indicating that the market may be oversold. This condition suggests that the asset could be poised for a rebound or reversal.
#### **5. Visual Elements:**
- **DPO and Signal Line Plots:**
- **DPO Plot:**
- **Color:** Blue
- **Width:** 2 pixels
- **Purpose:** To visually represent the deviation of the current price from the moving average.
- **Signal Line Plot:**
- **Color:** Red
- **Width:** 1 pixel
- **Purpose:** To provide a smoothed reference for the DPO and generate trading signals.
- **Histogram Plot:**
- **Color Coding:**
- **Green:** For positive values, signaling bullish momentum.
- **Red:** For negative values, signaling bearish momentum.
- **Style:** Histogram bars are displayed with varying width to represent the strength of momentum.
- **Zero Line:** A gray horizontal line separating positive and negative histogram values.
- **Overbought/Oversold Zones:**
- **Background Colors:**
- **Green Shading:** Applied when the DPO exceeds `alertLevel1`, indicating an overbought condition.
- **Red Shading:** Applied when the DPO falls below `alertLevel2`, indicating an oversold condition.
- **Horizontal Lines:**
- **Dotted Green Line:** At `alertLevel1`, marking the upper alert threshold.
- **Dotted Red Line:** At `alertLevel2`, marking the lower alert threshold.
- **Purpose:** To provide clear visual cues for extreme market conditions, aiding in the identification of potential reversal points.
#### **6. Trading Signals and Alerts:**
- **Buy Signal:**
- **Trigger:** When the DPO crosses above the Signal Line.
- **Visual Representation:** A "BUY" label appears below the price bar in the specified buy color.
- **Purpose:** Indicates a potential buying opportunity as short-term momentum turns bullish.
- **Sell Signal:**
- **Trigger:** When the DPO crosses below the Signal Line.
- **Visual Representation:** A "SELL" label appears above the price bar in the specified sell color.
- **Purpose:** Indicates a potential selling opportunity as short-term momentum turns bearish.
- **Overbought/Oversold Alerts:**
- **Overbought Alert:** Triggered when the DPO crosses below `alertLevel1`.
- **Oversold Alert:** Triggered when the DPO crosses above `alertLevel2`.
- **Visual Representation:** Labels "OVERBOUGHT" and "OVERSOLD" appear with distinctive colors and sizes to highlight extreme conditions.
- **Purpose:** To signal potential reversal points and extreme market conditions that may lead to price corrections or trend reversals.
- **Alert Conditions:**
- **DPO Cross Above Signal Line:** Alerts traders when the DPO crosses above the Signal Line, generating a buy signal.
- **DPO Cross Below Signal Line:** Alerts traders when the DPO crosses below the Signal Line, generating a sell signal.
- **DPO Above Upper Alert Level:** Alerts when the DPO is above `alertLevel1`, indicating an overbought condition.
- **DPO Below Lower Alert Level:** Alerts when the DPO is below `alertLevel2`, indicating an oversold condition.
- **Purpose:** To provide real-time notifications of significant market events, enabling traders to make informed decisions promptly.
### **Practical Applications:**
#### **1. Trend Following Strategies:**
- **Objective:**
- To capture and ride the prevailing market trends by entering trades that align with the direction of the momentum.
- **How to Use:**
- Monitor buy and sell signals generated by the DPO crossing the Signal Line. A buy signal suggests a bullish trend and a potential long trade, while a sell signal suggests a bearish trend and a potential short trade.
- Use the Histogram to confirm the strength of the trend. Expanding green bars indicate strong bullish momentum, while expanding red bars indicate strong bearish momentum.
- **Advantages:**
- Helps traders stay aligned with the market trend, increasing the likelihood of capturing substantial price moves.
#### **2. Reversal Trading:**
- **Objective:**
- To identify potential market reversals
by detecting overbought and oversold conditions.
- **How to Use:**
- Look for overbought and oversold signals based on the DPO crossing `alertLevel1` and `alertLevel2`. These conditions suggest that the market may be due for a reversal.
- Confirm reversal signals with the Histogram. A decrease in histogram bars (from green to red or vice versa) may support the reversal hypothesis.
- **Advantages:**
- Provides early warnings of potential market reversals, allowing traders to position themselves before significant price changes occur.
#### **3. Momentum Analysis:**
- **Objective:**
- To gauge the strength and direction of market momentum for making informed trading decisions.
- **How to Use:**
- Analyze the Histogram to assess momentum strength. Positive and expanding histogram bars indicate increasing bullish momentum, while negative and expanding bars suggest increasing bearish momentum.
- Use momentum insights to validate or question existing trading positions and strategies.
- **Advantages:**
- Offers valuable information about the market's momentum, helping traders confirm the validity of trends and trading signals.
### **Customization and Flexibility:**
The **Uptrick: DPO Signal & Zone Indicator** offers extensive customization options to accommodate diverse trading preferences and market conditions:
- **SMA Length and Signal Line Length:**
- Adjust the `smaLength` and `signalLength` parameters to control the sensitivity and responsiveness of the DPO and Signal Line. Shorter lengths make the indicator more responsive to price changes, while longer lengths provide smoother, less volatile signals.
- **Alert Levels:**
- Modify `alertLevel1` and `alertLevel2` to fit varying market conditions and volatility. Setting these levels appropriately helps tailor the indicator to different asset classes and trading strategies.
- **Color and Shape Customization:**
- Customize the colors and sizes of buy/sell signals, histogram bars, and alert levels to enhance visual clarity and align with personal preferences. This customization helps ensure that the indicator integrates seamlessly with a trader's charting setup.
### **Conclusion:**
The **Uptrick: DPO Signal & Zone Indicator** is a multifaceted analytical tool that combines the power of the Detrended Price Oscillator with customizable visual elements and alert levels to deliver a comprehensive approach to market analysis. By offering insights into momentum strength, trend direction, and potential reversal points, this indicator equips traders with valuable information to make informed decisions and enhance their trading strategies. Its flexibility and customization options ensure that it can be adapted to various trading styles and market conditions, making it a versatile addition to any trader's toolkit.

ZS Game Changer Pump & Dump DetectorZS GAME CHANGER PUMP AND DUMP DETECTOR - TOP 2 MOMENTUM TRACKER
Created by Zakaria Safri
An intelligent indicator specifically designed to identify and highlight the two most significant pump and dump candles within your selected lookback period. Perfect for traders who want to focus on the game-changing moves that truly matter in volatile markets like cryptocurrency, stocks, and forex.
CORE FEATURES
AUTOMATIC GAME CHANGER DETECTION
The indicator continuously scans your specified lookback period and automatically identifies the top 2 strongest pump candles and top 2 strongest dump candles. These game-changing candles are highlighted with distinctive gold labels and horizontal reference lines, making them instantly visible on your chart. Unlike other indicators that show every small move, this focuses exclusively on the market-moving moments that define trends and create opportunities.
INTELLIGENT PUMP AND DUMP CLASSIFICATION
Uses advanced percentage-based calculations to classify candles as pumps when price surges significantly upward and dumps when price plunges sharply downward. The detection system accounts for candle body size, wick proportions, and volume confirmation to ensure only legitimate momentum moves trigger signals. Customizable thresholds allow adaptation to any market volatility profile from calm stocks to wild altcoins.
ADVANCED WICK EXCLUSION FILTER
Eliminates false signals caused by candles with large wicks and small bodies. This filter focuses analysis exclusively on candles with substantial body sizes that indicate genuine directional conviction rather than temporary spikes followed by rejection. The body to candle ratio is fully adjustable to match your preferred signal quality standards.
VOLUME CONFIRMATION SYSTEM
Optional volume filter ensures detected pumps and dumps are backed by real market participation. The indicator compares current volume against a moving average and only triggers signals when volume exceeds your specified multiplier threshold. This eliminates low-volume noise and focuses on moves supported by institutional or crowd participation.
RALLY SEQUENCE DETECTION
Identifies and highlights consecutive sequences of pump or dump candles with colored background overlays. Green background indicates sustained buying pressure across multiple candles while red background shows sustained selling pressure. The rally detection system includes an optional one-miss allowance that prevents the sequence from breaking due to a single neutral candle.
HORIZONTAL REFERENCE LINES
Draws dashed lines from each game changer candle extending to the current bar, providing constant visual reference to the most significant support and resistance levels created by extreme momentum. The top game changer gets a thick dashed line while the second gets a dotted line for easy differentiation. Labels on the right side display the exact percentage move.
COMPREHENSIVE STATISTICS DASHBOARD
Real-time information panel showing current market status as pumping, dumping, or neutral along with the current candle percentage change. Displays the exact percentage values for top pump number 1, top pump number 2, top dump number 1, and top dump number 2. Shows running totals of all pumps and dumps detected since chart load. Tracks consecutive candle counts during active rally sequences.
TESTING AND VERIFICATION MODE
Built-in debug mode displays percentage change directly on each qualifying pump and dump candle, allowing instant verification that calculations are accurate. Shows which filters are currently active with a simple code in the dashboard. Helps traders understand exactly why certain candles qualified as game changers.
HOW THE GAME CHANGER DETECTION WORKS
SCANNING ALGORITHM
Every bar close, the indicator scans backward through your specified lookback period examining every candle's percentage change from its previous close. For bullish moves, it identifies the two candles with the largest positive percentage change that meet your threshold requirements. For bearish moves, it identifies the two candles with the largest negative percentage change meeting threshold requirements.
RANKING SYSTEM
Candles are ranked purely by their percentage move magnitude. The number 1 game changer is always the single strongest move in the lookback period. The number 2 game changer is the second strongest move. Rankings update dynamically as new candles form and old candles exit the lookback window.
VISUAL IDENTIFICATION
Game changer number 1 for both pumps and dumps receives a large gold label reading GAME CHANGER NUMBER 1 with zero transparency for maximum visibility. Game changer number 2 receives a slightly smaller gold label with partial transparency. The candle bars themselves are colored in gold instead of the standard green or red. Horizontal lines extend from the game changer price level to current bar.
FILTER APPLICATION
Only candles that pass your configured filters qualify for game changer consideration. If wick exclusion is enabled, candles with large wicks and small bodies are ignored. If volume confirmation is enabled, only candles with above-average volume qualify. This ensures game changers represent legitimate market moves rather than aberrations.
PRACTICAL APPLICATIONS
FOR CRYPTOCURRENCY TRADERS
Crypto markets experience extreme volatility with occasional massive pump and dump candles that define entire trends. This indicator instantly identifies which candles represent true market structure shifts versus normal noise. Use the game changer levels as key support and resistance for entries, exits, and stop placement. The top pump often marks the local high to watch for breakouts while the top dump marks the local low for reversal trades.
FOR DAY TRADERS
Intraday charts contain hundreds of candles but only a few truly matter for the session outcome. Game changer detection filters out 98 percent of candles to show you the 2 percent that drove the actual price movement. Enter trades on the side of the strongest recent game changer. Use game changer levels as magnet prices where algorithmic trading often returns.
FOR SWING TRADERS
On daily and four-hour timeframes, game changers represent major institutional activity or news-driven moves. The top dump often marks capitulation selling that creates reversal opportunities. The top pump often marks FOMO buying that creates resistance levels. Swing traders can build positions knowing these levels will be defended or tested multiple times.
FOR VOLATILITY ANALYSIS
Understanding which candles created the most volatility helps assess market risk. Multiple game changers clustered together indicate unstable choppy conditions. Game changers separated by many neutral candles indicate trending stable conditions. Use this context to adjust position sizing and stop distances appropriately.
FOR SUPPORT AND RESISTANCE TRADING
Game changer candles create the strongest support and resistance levels because they represent prices where massive volume transacted in short time periods. These levels have higher probability of holding on retest compared to arbitrary moving averages or pivot points. Trade bounces off game changer levels or breakouts through them.
RECOMMENDED SETTINGS BY MARKET
CRYPTOCURRENCY 15-MINUTE TO 1-HOUR CHARTS
Candle Size Threshold: 2.0 percent
Body to Candle Ratio: 0.5
Volume Multiplier: 1.5 times average
Game Changer Lookback: 100 bars
Extreme Threshold: 3.5 percent
Enable Wick Filter: Yes
Enable Volume Confirmation: Yes
Minimum Rally Candles: 3
STOCKS DAILY CHARTS
Candle Size Threshold: 1.0 percent
Body to Candle Ratio: 0.6
Volume Multiplier: 2.0 times average
Game Changer Lookback: 50 bars
Extreme Threshold: 2.5 percent
Enable Wick Filter: Yes
Enable Volume Confirmation: Yes
Minimum Rally Candles: 2
FOREX 1-HOUR TO 4-HOUR CHARTS
Candle Size Threshold: 0.5 percent
Body to Candle Ratio: 0.5
Volume Multiplier: Not applicable
Game Changer Lookback: 80 bars
Extreme Threshold: 1.0 percent
Enable Wick Filter: Yes
Enable Volume Confirmation: No
Minimum Rally Candles: 3
SCALPING 1-MINUTE TO 5-MINUTE CHARTS
Candle Size Threshold: 0.8 percent
Body to Candle Ratio: 0.4
Volume Multiplier: 1.2 times average
Game Changer Lookback: 50 bars
Extreme Threshold: 1.5 percent
Enable Wick Filter: No
Enable Volume Confirmation: Yes
Minimum Rally Candles: 2
WHAT IS INCLUDED
Automatic identification of top 2 pump candles
Automatic identification of top 2 dump candles
Gold colored game changer labels with size differentiation
Gold colored candle bars for game changers
Horizontal reference lines from game changers to current price
Regular pump and dump detection with green and red candles
Rally sequence detection with background highlighting
Extreme move detection and labeling system
Real-time statistics dashboard with all key metrics
Percentage change debug mode for verification
Volume confirmation filter with adjustable multiplier
Wick exclusion filter with adjustable body ratio
Customizable lookback period from 20 to 500 bars
Consecutive candle counter for rally tracking
Alert system for game changers, pumps, dumps, and rallies
Works on all timeframes from 1 minute to monthly
Compatible with stocks, forex, cryptocurrency, and futures
UNDERSTANDING GAME CHANGERS
WHAT MAKES A CANDLE A GAME CHANGER
A game changer is not just a large move but the largest move within context. In a volatile crypto market, a 5 percent pump might not rank in the top 2. In a stable stock, a 2 percent pump could be the number 1 game changer. The indicator adapts to your specific instrument and timeframe to find what truly matters in that context.
WHY FOCUS ON TOP 2 ONLY
Markets are driven by a small number of significant moves rather than the average of all moves. By focusing exclusively on the top 2 in each direction, traders can ignore noise and concentrate on the price levels that actually matter for support, resistance, and momentum. This creates clarity in decision making.
GAME CHANGERS AS MARKET STRUCTURE
The top pump often marks the recent high that bulls must break to continue uptrend. The top dump often marks the recent low that bears must break to continue downtrend. These become the key levels around which all other price action rotates. Understanding this structure is essential for profitable trading.
GAME CHANGERS AS SENTIMENT INDICATORS
Consecutive pump game changers signal strong bullish sentiment and FOMO conditions. Consecutive dump game changers signal fear and capitulation. Alternating pump and dump game changers signal indecision and range conditions. Read the pattern of game changers to gauge market psychology.
VERIFICATION AND TESTING
HOW TO VERIFY ACCURACY
Enable Show Debug Info on Chart in the Testing and Debug settings group. This displays the percentage change calculation directly on every qualifying pump and dump candle. Manually verify by calculating open minus close divided by close multiplied by 100. The debug percentage should match your manual calculation exactly.
HOW TO TEST FILTERS
Toggle wick exclusion filter on and off while watching how many candles qualify. With filter on, candles with long wicks and small bodies should disappear. Toggle volume confirmation on and off to see how low-volume candles get excluded. Adjust the thresholds and watch the real-time impact on signal count.
HOW TO VERIFY GAME CHANGERS
Look at your chart and visually identify which candle had the biggest green body in the lookback period. The game changer number 1 pump label should be on that exact candle. Repeat for the biggest red candle to verify game changer number 1 dump. The rankings should match your visual assessment.
LOOKBACK PERIOD EFFECTS
Decrease the lookback period to 20 bars and watch game changers update to only recent moves. Increase to 500 bars and watch game changers potentially change to older historic moves. The optimal lookback balances recency with significance. Too short misses important levels, too long includes irrelevant history.
DASHBOARD INFORMATION GUIDE
STATUS ROW
Shows PUMPING when current candle qualifies as a pump, DUMPING when current candle qualifies as a dump, or NEUTRAL when current candle does not meet threshold requirements. This updates in real-time on every bar close.
CURRENT CHANGE ROW
Displays the percentage change of the current candle from its previous close. Positive percentages indicate bullish candle, negative indicate bearish candle. This number may or may not meet your threshold to qualify as pump or dump.
TOP PUMP NUMBER 1
The highest positive percentage change found in your lookback period. This candle is marked with the large gold GAME CHANGER NUMBER 1 label below it. Shows N/A if no pumps exist in the lookback period.
TOP PUMP NUMBER 2
The second highest positive percentage change found in your lookback period. Marked with smaller gold GAME CHANGER NUMBER 2 label. Shows N/A if only one or zero pumps exist.
TOP DUMP NUMBER 1
The highest negative percentage change magnitude found in your lookback period. This candle is marked with the large gold GAME CHANGER NUMBER 1 label above it. Shows N/A if no dumps exist.
TOP DUMP NUMBER 2
The second highest negative percentage change magnitude found in your lookback period. Marked with smaller gold GAME CHANGER NUMBER 2 label. Shows N/A if only one or zero dumps exist.
TOTAL PUMPS
Running count of all pump candles detected since you loaded the indicator on this chart. This number continuously increases as new qualifying pumps form. Resets when you reload the chart.
TOTAL DUMPS
Running count of all dump candles detected since chart load. Increases as new qualifying dumps form and resets on chart reload.
CONSECUTIVE
Shows the current count of consecutive pump or dump candles during an active rally. Displays 3 UP during a 3-candle pump rally or 5 DN during a 5-candle dump rally. Shows 0 when no rally is active.
ALERT SYSTEM
GAME CHANGER DETECTED ALERT
Triggers whenever the current candle becomes one of the top 2 pumps or top 2 dumps. This is the highest priority alert indicating a market-moving event just occurred. Use this alert for immediate notification of significant opportunities.
PUMP DETECTED ALERT
Triggers on every candle that qualifies as a pump according to your threshold and filter settings. This includes regular pumps and extreme pumps but excludes game changers which have their separate alert. Use for general upward momentum monitoring.
DUMP DETECTED ALERT
Triggers on every candle that qualifies as a dump according to your settings. Includes regular and extreme dumps but excludes game changers. Use for general downward momentum monitoring.
PUMP RALLY STARTED ALERT
Triggers when consecutive pump candles reach your minimum rally threshold. Indicates the beginning of a sustained upward movement sequence. Use to catch trends early.
DUMP RALLY STARTED ALERT
Triggers when consecutive dump candles reach your minimum rally threshold. Indicates the beginning of a sustained downward movement sequence. Use for trend following or reversal timing.
ALERT MESSAGE FORMAT
All alerts include the ticker symbol and current price using TradingView placeholders. Messages are descriptive and specify which type of signal triggered. Alerts work with TradingView notification system including email, SMS, webhook, and app notifications.
TECHNICAL SPECIFICATIONS
CALCULATION METHODOLOGY
Percentage change calculated as current close minus previous close divided by previous close multiplied by 100. Body ratio calculated as absolute value of close minus open divided by high minus low. Volume elevation calculated as current volume divided by 20-period simple moving average of volume. Game changer ranking uses absolute value comparison across entire lookback array.
PERFORMANCE CHARACTERISTICS
Lightweight calculations optimized for speed on all timeframes. No repainting of signals ensuring all triggers are final on bar close. Variables properly scoped with var keyword for memory efficiency. Maximum bars back set to 500 to prevent excessive historical loading. Updates in real-time on every bar close without lag.
COMPATIBILITY
Works on all TradingView plans including free, pro, and premium. Compatible with stocks, forex, cryptocurrency, futures, indices, and commodities. Functions correctly on all timeframes from 1 second to monthly. No external data requests ensuring fast loading. Overlay true setting places directly on price chart.
RISK DISCLAIMER
This indicator is a technical analysis tool for identifying momentum and should not be used as the sole basis for trading decisions. Game changer levels can be broken during strong trends and are not guaranteed support or resistance. Pump and dump detection does not predict future price direction. Always use proper risk management with stop losses on every trade. Combine this indicator with other forms of analysis including fundamentals, market context, and risk assessment. Practice on demo accounts before live trading. Past performance of game changer signals does not guarantee future results. Trading carries substantial risk of loss and is not suitable for all investors. The creator is not responsible for trading losses incurred while using this tool.
SUPPORT AND UPDATES
Regular updates based on user feedback and market evolution. Built following PineCoders industry standards and best practices for code quality. Clean well-documented code structure for transparency and auditability. Optimized performance across all timeframes and instruments. Active development with continuous improvements and feature additions.
WHY CHOOSE ZS GAME CHANGER PUMP AND DUMP DETECTOR
Focuses on what matters by highlighting only the top 2 moves in each direction instead of cluttering your chart with every small fluctuation. Saves time by automatically identifying the most significant candles rather than requiring manual scanning. Provides clarity through visual gold labels and reference lines that make game changers unmistakable. Adapts to any market with customizable thresholds for volatility and volume. Eliminates noise with advanced wick and volume filters ensuring signal quality. Offers verification through debug mode proving calculations are accurate and trustworthy. Includes comprehensive statistics showing exact percentages and counts. Works everywhere across all markets, timeframes, and instruments without modification.
Transform your chart analysis by focusing exclusively on the game-changing moments that define trends and create opportunities.
Version 1.1 | Created by Zakaria Safri | Pine Script Version 5 | PineCoders Compliant

Session-Conditioned Regime ATRWhy this exists
Classic ATR is great—until the open. The first few bars often inherit overnight gaps and 24-hour noise that have nothing to do with the intraday regime you actually trade. That inflates early ATR, scrambles thresholds, and invites hyper-recency bias (“today is crazy!”) when it’s just the open being the open.
This tool was built to:
Separate session reality from 24h noise. Measure volatility only inside your defined session (e.g., NYSE 09:30–16:00 ET).
Judge candles against the current regime, not the last 2–3 bars. A rolling statistic from the last N completed sessions defines what “typical” means right now.
Label “large” and “small” objectively. Bars are colored only when True Range meaningfully departs from the session regime—no gut feel, no open-bar distortion (gap inclusion optional).
Overview
Purpose: objectively identify unusually big or small candles within the active trading session, compared to the recent session regime.
Use cases: volatility filters, entry/exit confirmation, session bias detection, adaptive sizing.
This indicator replaces generic ATR with a session-conditioned, regime-aware measure. It colors candles only when their True Range (TR) is abnormally large/small versus the last N completed sessions of the same session window.
How it works
Session gating: Only bars inside the selected session are evaluated (presets for NYSE, CME RTH, FX NY; custom supported).
Per-bar TR: TR = max(high, prevRef) − min(low, prevRef).
prevRef is the prior close for in-session bars.
First bar of the session can include the overnight gap (optional; default off).
Regime statistic: For any bar in session k, aggregate all in-session TRs from the previous N completed sessions (k−N … k−1), then compute Median (default) or Mean.
Today’s anchor: Running statistic from today’s session start → current bar (for context and the on-chart ratio).
Color logic:
Big if TR ≥ bigMult × RegimeStat
Small if TR ≤ smallMult × RegimeStat
Colored states: big bull, big bear, small bull, small bear.
Non-triggering bars retain the chart’s native colors.
Panel (top-right by default)
Regime ATR (Nd): session-conditioned statistic over the past N completed sessions.
Today ATR (anchored): running statistic for the current session.
Ratio (Today/Regime): intraday volatility vs regime.
Sample size n: number of bars used in the regime calculation.
Inputs
Session Preset: NYSE (09:30–16:00 ET), CME RTH (08:30–15:00 CT), FX NY (08:00–17:00 ET), Custom (session + IANA timezone).
Regime Window: number of completed sessions (default 5).
Statistic: Median (robust) or Mean.
Include Open Gap: include overnight gap in the first in-session bar’s TR (default off).
Big/Small thresholds: multipliers relative to RegimeStat (defaults: Big=1.5×, Small=0.67×).
Colors: four independent colors for big/small × bull/bear.
Panel position & text size.
Hidden outputs: expose RegimeStat, TodayStat, Ratio, and Z-score to other scripts.
Alerts
RegimeATR: BIG bar — triggers when a bar meets the “Big” condition.
RegimeATR: SMALL bar — triggers when a bar meets the “Small” condition.
Hidden outputs (for strategies/screeners)
RegimeATR_stat, TodayATR_stat, Today_vs_Regime_Ratio, BarTR_Zscore.
Notes & limitations
No look-ahead: calculations only use information available up to that bar. Historical colors reflect what would have been known then.
Warm-up: colors begin once there are at least N completed sessions; before that, regime is undefined by design.
Changing inputs (session window, multipliers, median/mean, gap toggle) recomputes the full series using the same rolling regime logic per bar.
Designed for standard candles. Styling respects existing chart colors when no condition triggers.
Practical tips
For a broader or tighter notion of “unusual,” adjust Big/Small multipliers.
Prefer Median in markets prone to outliers; use Mean if you want Z-score alignment with the panel’s regime mean/std.
Use the Ratio readout to spot compression/expansion days quickly (e.g., <0.7× = compressed session, >1.3× = expanded).
Roadmap
More session presets:
24h continuous (crypto, index CFDs).
23h/Globex futures (CME ETH with a 60-minute maintenance break).
Regional equities (LSE, Xetra, TSE), Asia/Europe/NY overlaps for FX.
Half-day/holiday templates and dynamic calendars.
Multi-regime comparison: track multiple overlapping regimes (e.g., RTH vs ETH for futures) and show separate stats/ratios.
Robust stats options: trimmed mean, MAD/Huber alternatives; optional percentile thresholds instead of fixed multipliers.
Subpanel visuals: rolling TodayATR and Ratio plots; optional Z-score ribbon.
Screener/strategy hooks: export boolean series for BIG/SMALL, plus a lightweight strategy template for backtesting entries/exits conditioned on regime volatility.
Performance/QOL: per-symbol presets, smarter warm-up, and finer control over sample caps for ultra-low TF charts.
Changelog
v0.9b (Beta)
Session presets (NYSE/CME RTH/FX NY/Custom) with timezone handling.
Panel enhancements: ratio + sample size n.
Four-state bar coloring (big/small × bull/bear).
Alerts for BIG/SMALL bars.
Hidden Z-score stream for downstream use.
Gap-in-TR toggle for the first in-session bar.
Disclaimer
For educational purposes only. Not investment advice. Validate thresholds and session settings across symbols/timeframes before live use.

LANZ Strategy 5.0🔷 LANZ Strategy 5.0 — Intraday BUY Signals, Dynamic Lot Size per Account, Real-Time Dashboard and Smart Execution
LANZ Strategy 5.0 is a powerful intraday tool designed for traders who need a visual-first, data-backed BUY system, enhanced with risk-aware lot size calculation and a real-time performance dashboard. This indicator intelligently detects strong momentum setups and provides visual and statistical clarity throughout the session.
📌 This is an indicator, not a strategy — It does not place trades automatically but provides precise conditions, alerts, and visual guides to support execution.
🧠 Core Logic & Features
BUY Entry Conditions (Signal Engine)
A BUY signal is triggered when:
The current price is above the EMA200 (trend filter)
The last 3 candles are bullish (candle body close > open)
You are within the defined session window (NY time)
When all conditions are met and you haven’t reached the daily trade limit, a signal appears on the chart and an optional alert is triggered.
Operational Hours Filter (NY Time)
You define:
Start time (e.g., 01:15 NY)
End time (e.g., 16:00 NY)
The system only evaluates and executes signals within this period. If a BUY setup occurs outside the window, it’s ignored. The chart is also highlighted with a transparent teal background to visually show active trading hours.
Lot Size Panel with Per-Account Risk Management
Designed for traders managing multiple accounts or capital sources. You can enable up to 5 accounts, each with:
Its own capital
Its own risk percentage per trade
The system uses the defined SL in pips, plus the instrument’s pip value, to calculate the lot size per account. All values are shown in a dedicated panel at the bottom-right, automatically updating with each new trade.
The emojis (🐣🦊🦁🐲🐳) distinguish each account visually.
Trade Visualization with Customizable Lines
When a signal is triggered:
An Entry Point (EP) line is drawn at the candle’s close.
A Stop Loss (SL) line is placed X pips below the entry.
A Take Profit (TP) line is placed Y pips above the entry.
All three lines are fully customizable in style, color, and thickness. You define how many bars the lines should extend.
Outcome Tracking & Real-Time Dashboard
Each trade outcome is measured:
SL hit = –1.00%
TP hit = +3.00%
Manual close = calculated dynamically based on price at close time
Each result is labeled on the chart near its level, and stored.
The top-right dashboard updates in real time:
✅ Number of trades
📈 Cumulative % gain/loss of the day (color-coded)
Alerts You Can Trust:
You’ll get a Buy Alert when a valid signal is formed
You’ll get a Trade Executed Alert when the visual operation is plotted
You’ll get a SL/TP Hit Alert with price and result
You’ll get a Manual Close Alert if the configured time is reached and the trade is still active
⚙️ Step-by-Step Execution Flow
At every bar, the system checks:
Are we within the session time window?
Is price above EMA?
Are the last 3 candles bullish?
✅ If yes:
A BUY signal is plotted
Entry/SL/TP lines are drawn
Lot sizes are calculated and displayed
Trade is added to the daily count
🕐 At the configured Manual Close time (e.g., 16:00 NY):
If the trade is still open, it's closed
A label is added with the exact result in %
💡 Ideal For:
Intraday traders who operate within fixed time sessions
Traders managing multiple accounts or capital pools
Anyone who wants full visual clarity of every decision point
Traders who appreciate dynamic lot size calculation and clean execution tracking
👨💻 Credits:
💡 Developed by: LANZ
🧠 Strategy concept & execution model: LANZ
🧪 Tested on: 1H charts with visual-only execution
📈 Designed for: Clarity, adaptability, and full intraday control
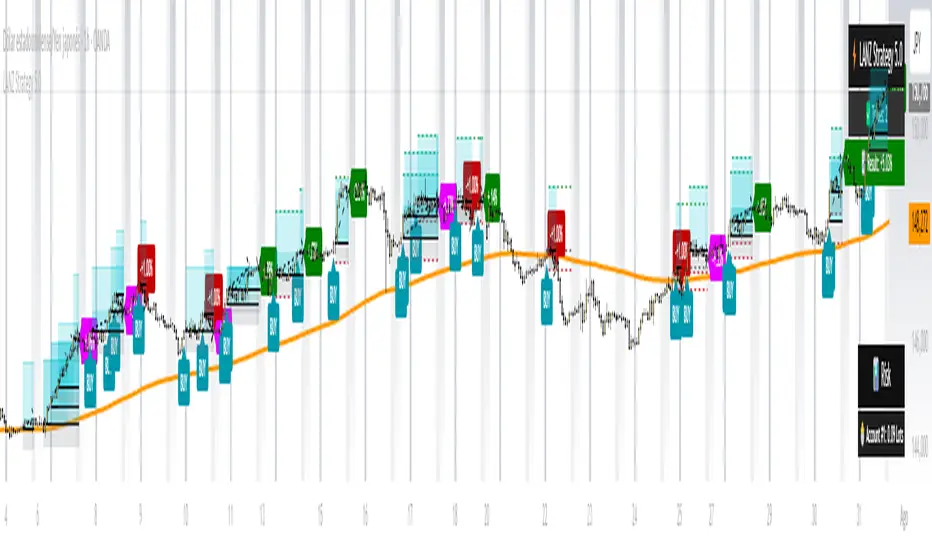
Uptrick: Fisher Eclipse1. Name and Purpose
Uptrick: Fisher Eclipse is a Pine version 6 extension of the basic Fisher Transform indicator that focuses on highlighting potential turning points in price data. Its purpose is to allow traders to spot shifts in momentum, detect divergence, and adapt signals to different market environments. By combining a core Fisher Transform with additional signal processing, divergence detection, and customizable aggressiveness settings, this script aims to help users see when a price move might be losing momentum or gaining strength.
2. Overview
This script uses a Fisher Transform calculation on the average of each bar’s high and low (hl2). The Fisher Transform is designed to amplify price extremes by mapping data into a different scale, making potential reversals more visible than they might be with standard oscillators. Uptrick: Fisher Eclipse takes this concept further by integrating a signal line, divergence detection, bar coloring for momentum intensity, and optional thresholds to reduce unwanted noise.
3. Why Use the Fisher Transform
The Fisher Transform is known for converting relatively smoothed price data into a more pronounced scale. This transformation highlights where markets may be overextended. In many cases, standard oscillators move gently, and traders can miss subtle hints that a reversal might be approaching. The Fisher Transform’s mathematical approach tightens the range of values and sharpens the highs and lows. This behavior can allow traders to see clearer peaks and troughs in momentum. Because it is often quite responsive, it can help anticipate areas where price might change direction, especially when compared to simpler moving averages or traditional oscillators. The result is a more evident signal of possible overbought or oversold conditions.
4. How This Extension Improves on the Basic Fisher Transform
Uptrick: Fisher Eclipse adds multiple features to the classic Fisher framework in order to address different trading styles and market behaviors:
a) Divergence Detection
The script can detect bullish or bearish divergences between price and the oscillator over a chosen lookback period, helping traders anticipate shifts in market direction.
b) Bar Coloring
When momentum exceeds a certain threshold (default 3), bars can be colored to highlight surges of buying or selling pressure. This quick visual reference can assist in spotting periods of heightened activity. After a bar color like this, usually, there is a quick correction as seen in the image below.
c) Signal Aggressiveness Levels
Users can choose between conservative, moderate, or aggressive signal thresholds. This allows them to tune how quickly the indicator flags potential entries or exits. Aggressive settings might suit scalpers who need rapid signals, while conservative settings may benefit swing traders preferring fewer, more robust indications.
d) Minimum Movement Filter
A configurable filter can be set to ensure that the Fisher line and its signal have a sufficient gap before triggering a buy or sell signal. This step is useful for traders seeking to minimize signals during choppy or sideways markets. This can be used to eliminate noise as well.
By combining all these elements into one package, the indicator attempts to offer a comprehensive toolkit for those who appreciate the Fisher Transform’s clarity but also desire more versatility.
5. Core Components
a) Fisher Transform
The script calculates a Fisher value using normalized price over a configurable length, highlighting potential peaks and troughs.
b) Signal Line
The Fisher line is smoothed using a short Simple Moving Average. Crossovers and crossunders are one of the key ways this indicator attempts to confirm momentum shifts.
c) Divergence Logic
The script looks back over a set number of bars to compare current highs and lows of both price and the Fisher oscillator. When price and the oscillator move in opposing directions, a divergence may occur, suggesting a possible upcoming reversal or weakening trend.
d) Thresholds for Overbought and Oversold
Horizontal lines are drawn at user-chosen overbought and oversold levels. These lines help traders see when momentum readings reach particular extremes, which can be especially relevant when combined with crossovers in that region.
e) Intensity Filter and Bar Coloring
If the magnitude of the change in the Fisher Transform meets or exceeds a specified threshold, bars are recolored. This provides a visual cue for significant momentum changes.
6. User Inputs
a) length
Defines how many bars the script looks back to compute the highest high and lowest low for the Fisher Transform. A smaller length reacts more quickly but can be noisier, while a larger length smooths out the indicator at the cost of responsiveness.
b) signal aggressiveness
Adjusts the buy and sell thresholds for conservative, moderate, and aggressive trading styles. This can be key in matching the indicator to personal risk preferences or varying market conditions. Conservative will give you less signals and aggressive will give you more signals.
c) minimum movement filter
Specifies how far apart the Fisher line and its signal line must be before generating a valid crossover signal.
d) divergence lookback
Controls how many bars are examined when determining if price and the oscillator are diverging. A larger setting might generate fewer signals, while a smaller one can provide more frequent alerts.
e) intensity threshold
Determines how large a change in the Fisher value must be for the indicator to recolor bars. Strong momentum surges become more noticeable.
f) overbought level and oversold level
Lets users define where they consider market conditions to be stretched on the upside or downside.
7. Calculation Process
a) Price Input
The script uses the midpoint of each bar’s high and low, sometimes referred to as hl2.
hl2 = (high + low) / 2
b) Range Normalization
Determine the maximum (maxHigh) and minimum (minLow) values over a user-defined lookback period (length).
Scale the hl2 value so it roughly fits between -1 and +1:
value = 2 * ((hl2 - minLow) / (maxHigh - minLow) - 0.5)
This step highlights the bar’s current position relative to its recent highs and lows.
c) Fisher Calculation
Convert the normalized value into the Fisher Transform:
fisher = 0.5 * ln( (1 + value) / (1 - value) ) + 0.5 * fisher_previous
fisher_previous is simply the Fisher value from the previous bar. Averaging half of the new transform with half of the old value smooths the result slightly and can prevent erratic jumps.
ln is the natural logarithm function, which compresses or expands values so that market turns often become more obvious.
d) Signal Smoothing
Once the Fisher value is computed, a short Simple Moving Average (SMA) is applied to produce a signal line. In code form, this often looks like:
signal = sma(fisher, 3)
Crossovers of the fisher line versus the signal line can be used to hint at changes in momentum:
• A crossover occurs when fisher moves from below to above the signal.
• A crossunder occurs when fisher moves from above to below the signal.
e) Threshold Checking
Users typically define oversold and overbought levels (often -1 and +1).
Depending on aggressiveness settings (conservative, moderate, aggressive), these thresholds are slightly shifted to filter out or include more signals.
For example, an oversold threshold of -1 might be used in a moderate setting, whereas -1.5 could be used in a conservative setting to require a deeper dip before triggering.
f) Divergence Checks
The script looks back a specified number of bars (divergenceLookback). For both price and the fisher line, it identifies:
• priceHigh = the highest hl2 within the lookback
• priceLow = the lowest hl2 within the lookback
• fisherHigh = the highest fisher value within the lookback
• fisherLow = the lowest fisher value within the lookback
If price forms a lower low while fisher forms a higher low, it can signal a bullish divergence. Conversely, if price forms a higher high while fisher forms a lower high, a bearish divergence might be indicated.
g) Bar Coloring
The script monitors the absolute change in Fisher values from one bar to the next (sometimes called fisherChange):
fisherChange = abs(fisher - fisher )
If fisherChange exceeds a user-defined intensityThreshold, bars are recolored to highlight a surge of momentum. Aqua might indicate a strong bullish surge, while purple might indicate a strong bearish surge.
This color-coding provides a quick visual cue for traders looking to spot large momentum swings without constantly monitoring indicator values.
8. Signal Generation and Filtering
Buy and sell signals occur when the Fisher line crosses the signal line in regions defined as oversold or overbought. The optional minimum movement filter prevents triggering if Fisher and its signal line are too close, reducing the chance of small, inconsequential price fluctuations creating frequent signals. Divergences that appear in oversold or overbought regions can serve as additional evidence that momentum might soon shift.
9. Visualization on the Chart
Uptrick: Fisher Eclipse plots two lines: the Fisher line in one color and the signal line in a contrasting shade. The chart displays horizontal dashed lines where the overbought and oversold levels lie. When the Fisher Transform experiences a sharp jump or drop above the intensity threshold, the corresponding price bars may change color, signaling that momentum has undergone a noticeable shift. If the indicator detects bullish or bearish divergence, dotted lines are drawn on the oscillator portion to connect the relevant points.
10. Market Adaptability
Because of the different aggressiveness levels and the optional minimum movement filter, Uptrick: Fisher Eclipse can be tailored to multiple trading styles. For instance, a short-term scalper might select a smaller length and more aggressive thresholds, while a swing trader might choose a longer length for smoother readings, along with conservative thresholds to ensure fewer but potentially stronger signals. During strongly trending markets, users might rely more on divergences or large intensity changes, whereas in a range-bound market, oversold or overbought conditions may be more frequent.
11. Risk Management Considerations
Indicators alone do not ensure favorable outcomes, and relying solely on any one signal can be risky. Using a stop-loss or other protections is often suggested, especially in fast-moving or unpredictable markets. Divergence can appear before a market reversal actually starts. Similarly, a Fisher Transform can remain in an overbought or oversold region for extended periods, especially if the trend is strong. Cautious interpretation and confirmation with additional methods or chart analysis can help refine entry and exit decisions.
12. Combining with Other Tools
Traders can potentially strengthen signals from Uptrick: Fisher Eclipse by checking them against other methods. If a moving average cross or a price pattern aligns with a Fisher crossover, the combined evidence might provide more certainty. Volume analysis may confirm whether a shift in market direction has participation from a broad set of traders. Support and resistance zones could reinforce overbought or oversold signals, particularly if price reaches a historical boundary at the same time the oscillator indicates a possible reversal.
13. Parameter Customization and Examples
Some short-term traders run a 15-minute chart, with a shorter length setting, aggressively tight oversold and overbought thresholds, and a smaller divergence lookback. This approach produces more frequent signals, which may appeal to those who enjoy fast-paced trading. More conservative traders might apply the indicator to a daily chart, using a larger length, moderate threshold levels, and a bigger divergence lookback to focus on broader market swings. Results can differ, so it may be helpful to conduct thorough historical testing to see which combination of parameters aligns best with specific goals.
14. Realistic Expectations
While the Fisher Transform can reveal potential turning points, no mathematical tool can predict future price behavior with full certainty. Markets can behave erratically, and a period of strong trending may see the oscillator pinned in an extreme zone without a significant reversal. Divergence signals sometimes appear well before an actual trend change occurs. Recognizing these limitations helps traders manage risk and avoids overreliance on any one aspect of the script’s output.
15. Theoretical Background
The Fisher Transform uses a logarithmic formula to map a normalized input, typically ranging between -1 and +1, into a scale that can fluctuate around values like -3 to +3. Because the transformation exaggerates higher and lower readings, it becomes easier to spot when the market might have stretched too far, too fast. Uptrick: Fisher Eclipse builds on that foundation by adding a series of practical tools that help confirm or refine those signals.
16. Originality and Uniqueness
Uptrick: Fisher Eclipse is not simply a duplicate of the basic Fisher Transform. It enhances the original design in several ways, including built-in divergence detection, bar-color triggers for momentum surges, thresholds for overbought and oversold levels, and customizable signal aggressiveness. By unifying these concepts, the script seeks to reduce noise and highlight meaningful shifts in market direction. It also places greater emphasis on helping traders adapt the indicator to their specific style—whether that involves frequent intraday signals or fewer, more robust alerts over longer timeframes.
17. Summary
Uptrick: Fisher Eclipse is an expanded take on the original Fisher Transform oscillator, including divergence detection, bar coloring based on momentum strength, and flexible signal thresholds. By adjusting parameters like length, aggressiveness, and intensity thresholds, traders can configure the script for day-trading, swing trading, or position trading. The indicator endeavors to highlight where price might be shifting direction, but it should still be combined with robust risk management and other analytical methods. Doing so can lead to a more comprehensive view of market conditions.
18. Disclaimer
No indicator or script can guarantee profitable outcomes in trading. Past performance does not necessarily suggest future results. Uptrick: Fisher Eclipse is provided for educational and informational purposes. Users should apply their own judgment and may want to confirm signals with other tools and methods. Deciding to open or close a position remains a personal choice based on each individual’s circumstances and risk tolerance.
