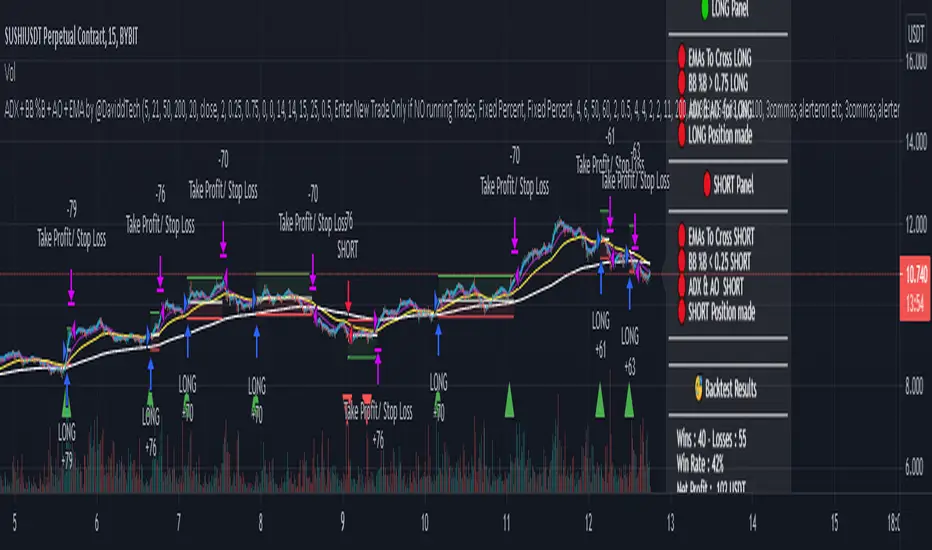
ADX + BB %B + AO + EMA by @DaviddTechThis trading strategy combines different indicators:
1) ADX , Average Directional Movement to make sure we are in a trend.
2) BB %B Bollinger Band %B: to spots relative price position to Bollinger Bands
3) AO Awesome Oscillator for momentum - you will need to configure this to fit the pair.
4) EMA 5, EMA 21, EMA 50, EMA 200: crossovers to get our entry short or long & trend direction
This script was inspired by TraderPro - Crazy 78% Win Rate Proven Trading Strategy Revealed - ADX + BB %B + AO + EMA
My settings are pretty much as default.
- I have added a 10,000 USD default
- 7% of portfolio is used to create the results.
You can of course optimize all of this in the settings.
WARNING:
- For purpose educate only
- Plots EMAs and other values on chart.
- This script to change bars colors.
ค้นหาในสคริปต์สำหรับ "trend"
Stock trending strategy This is a long only strategy designed maily for stock markets and futures. In general it works best with 1h, however it can be optimized with other timeframes as well.
Components:
VWAP
MACD histogram
EMA 9
Rules for entry
Long :
For VWAP: close is above the vwap daily
EMA: close is above the moving average
MACD histogram is above 0
Short:
For VWAP: close is belowthe vwap daily
EMA: close is below the moving average
MACD histogram is below 0
Rules for exit
This strategy does not have any risk management inside. Instead it exits whenver it receives an opposite signal form the original one used for entry.
If you have any questions let me know !

Ichimoku with MACD/ CMF/ TSIThis is a very powerful trend strategy designed for markets such as stocks market , stock index and crypto.
For time frames I found out that 1h seems to do the trick.
Components:
Ichimoku full pack
MACD histogram
CMF oscillator
TSI oscillator
Rules for entry
Long :
For Ichimoku:Tenkan part of cloud is bigger than kijun, Chikou is above 0 , close of a candle is above the Senkou
MACD histogram is above 0
CMF oscillator is positive and bigger than 0.1
TSI oscillator is above 0
Short:
For Ichimoku:Tenkan part of cloud is smaller than kijun, Chikou is below 0 , close of a candle is belowthe Senkou
MACD histogram is below 0
CMF oscillator is negative and below -0.1
TSI oscillator is below 0
Rules for exit
This strategy does not have any risk management inside. Instead it exits whenver it receives an opposite signal form the original one used for entry.
If you have any questions let me know !

Random Entries Work!" tHe MaRkEtS aRe RaNdOm ", say moron academics.
The purpose of this study is to show that most markets are NOT random! Most markets show a clear bias where we can make such easy money, that a random number generator can do it.
=== HOW THE INDICATOR WORKS ===
The study will randomly enter the market
The study will randomly exit the market if in a trade
You can choose a Long Only, Short Only, or Bidirectional strategy
=== DEFAULT VALUES AND THEIR LOGIC ===
Percent Chance to Enter Per Bar: 10%
Percent Chance to Exit Per Bar: 3%
Direction: Long Only
Commission: 0
Each bar has a 10% chance to enter the market. Each bar has a 3% to exit the market . It will only enter long.
I included zero commission for simplification. It's a good exercise to include a commission/slippage to see just how much trading fees take from you.
=== TIPS ===
Increasing "Percent Chance to Exit" will shorten the time in a trade. You can see the "Avg # Bars In Trade" go down as you increase. If "Percent Chance to Exit" is too high, the study won't be in the market long enough to catch any movement, possibly exiting on the same bar most of the time.
If you're getting the red screen, that means the strategy lost so much money it went broke. Try reducing the percent equity on the Properties tab.
Switch the start year to avoid/minimize black swan events like the covid drop in 2020.
=== FINDINGS ===
Most markets lose money with a "Random" direction strategy.
Most markets lose ALL money with a "Short Only" strategy.
Most markets make money with a "Long Only" strategy.
Try this strategy on: Bitcoin (BTCUSD) and the NASDAQ (QQQ).
There are two popular memes right now: "Bitcoin to the moon" and "Stocks only go up". Both are seemingly true. Bitcoin was the best performing asset of the 2010's, gaining several billion percent in gains. The stock market is on a 100 year long uptrend. Why? BECAUSE FIAT CURRENCIES ALWAYS GO DOWN! This is inflation. If we measure the market in terms of others assets instead of fiat, the Long Only strategy doesn't work anymore (or works less well).
Try this strategy on: Bitcoin/GLD (BTCUSD/GLD), the Eurodollar (EURUSD), and the S&P 500 measured in gold (SPY/GLD).
Bitcoin measured in gold (BTCUSD/GLD) still works with a Long Only strategy because Bitcoin increased in value over both USD and gold.
The Eurodollar (EURUSD) generally loses money no matter what, especially if you add any commission. This makes sense as they are both fiat currencies with similar inflation schedules.
Gold and the S&P 500 have gained roughly the same amount since ~2000. Some years will show better results for a long strategy, while others will favor a short strategy. Now look at just SPY or GLD (which are both measured in USD by default!) and you'll see the same trend again: a Long Only strategy crushes even when entering and exiting randomly.
=== " JUST TELL ME WHAT TO DO, YOU NERD! " ===
Bulls always win and Bears always lose because fiat currencies go to zero.
You're not underperforming a random number generator, are you?

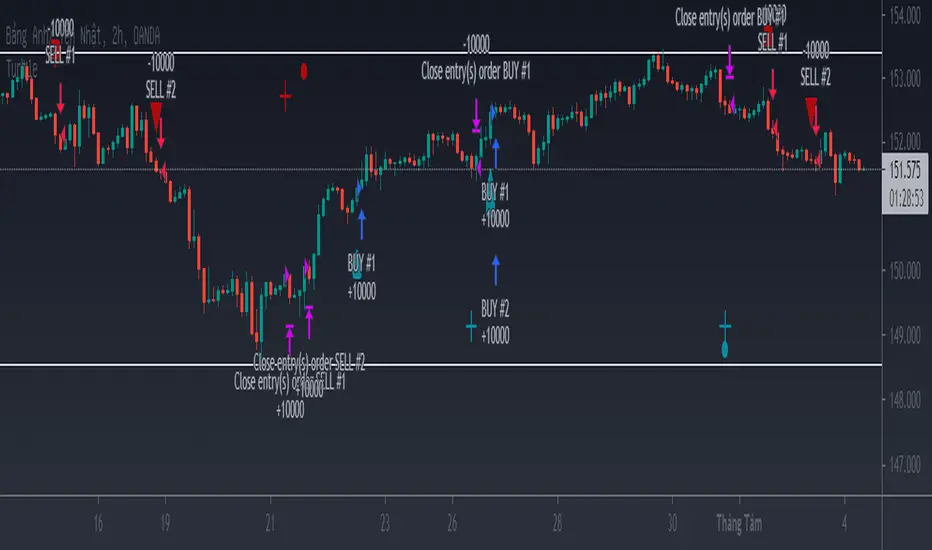
Turtle StrategyThe strategy uses the breakout method to enter an order. Look for areas of price compression to wait for a breakout. Use trailing stoploss to keep the order until the end of the trend.
Example using 10000 contract size with GBPJPY , slippage is 3 and commission per order is 0.3$, with actual capital of 10000$, you can adjust other contract size for other pairs to consistent with reality.
[Advanced] Hilega-Milega IndicatorThis Indicator Name is Hilega Milega, and the original Idea given by Nitish Kumar, I just coded it and add some signals for backtesting.
it works on RSI + WMA and EMA plotted.
Default Values Used :
RSI = 9
WMA = 21
EMA = 3
But i added some extra, now everyone can change the Type of WMA and EMA, also SMA for trend confirmation,
How it works ??
Buy : When RSI crossover WMA or any Type of Moving Average you choose,
Sell : When RSI crossunder WMA or any Type of Moving Average you choose,
also:
Buy : When EMA crossover WMA or any Type of Moving Average you choose,
Sell : When EMA crossunder WMA or any Type of Moving Average you choose,
also:
Buy : When RSI + EMA crossover WMA or any Type of Moving Average you choose at the Same time,
Sell : When RSI + EMA crossunder WMA or any Type of Moving Average you choose at the Same time,
and Much More...! hope so you like it,

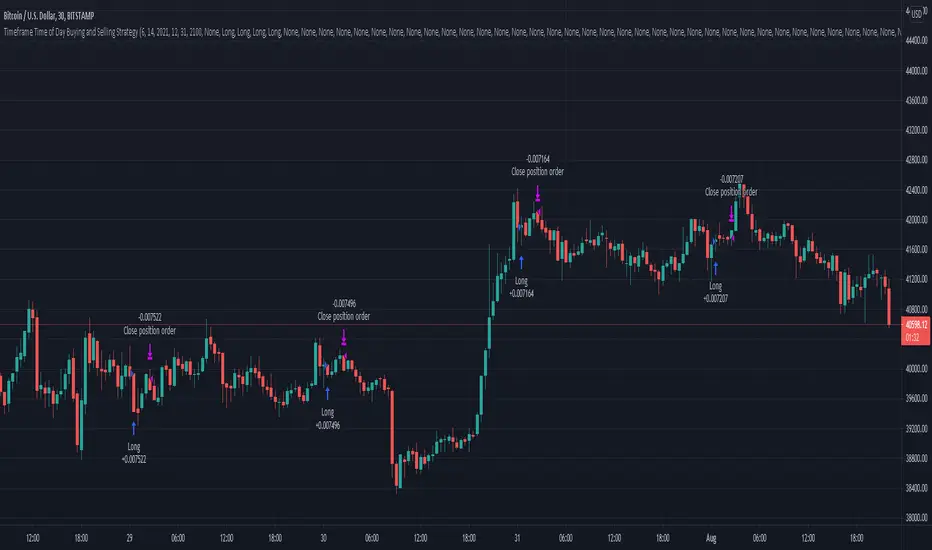
Timeframe Time of Day Buying and Selling StrategyThis strategy allows you to back test longing or shorting or do nothing during time increments of 30 minutes. The price trends in one direction every 30 minutes and this strategy allows you to test various 30 minute time frames across a range of dates to capitalize on this.
Make sure you are in the 30 minute time frame while viewing the performance and trade history.
EMA crossover (daily TF)This strategy is only applicable for daily timeframe only. EMAs have been smoothened out to make sure to include volatility glitches that may occur. I have used following conditions:
>EMA crossover of two frames already occurred
> Significant volume in the candle
> Candles are properly bullish or bearish not doji
> price is near EMA crossover
> trading stoploss to reduce risk as price follows the trend
Positive feedbacks are welcome for incorporation.
NSE:SRF

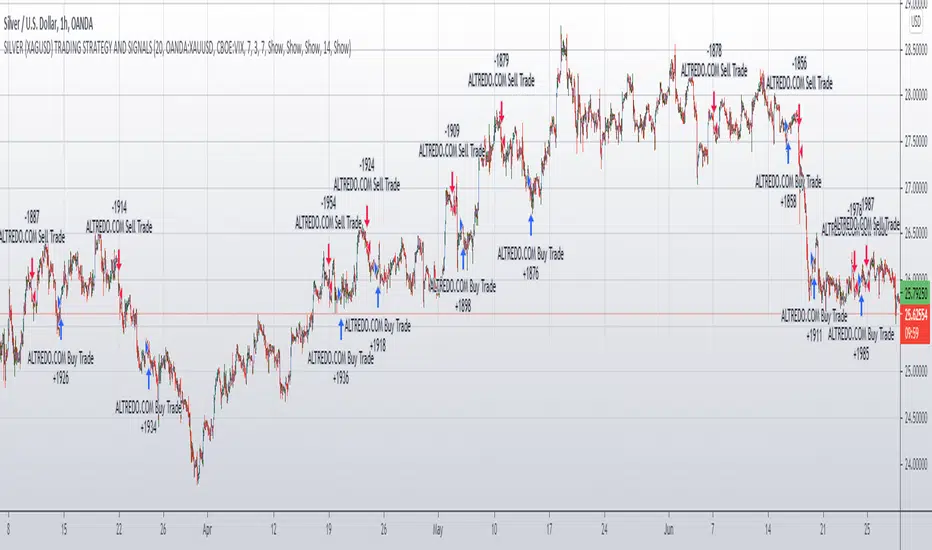
SILVER (XAGUSD) TRADING STRATEGY AND SIGNALSSILVER (XAGUSD) TRADING STRATEGY AND SIGNALS
This strategy is designed for Silver OANDA:XAGUSD traders and investors.
This strategy is trend following, taking into account the movement of major stock indices such as the Volatility Index.
This strategy also takes into account the direction of movement of the Gold asset,
in particular, the direction of movement of Gold and changes in the volatility of Gold, as well as the current price of Gold.
This, in combination with the main trading indicators (Moving Average, MACD, RSI),
strengthens our Silver Trading Strategy and increases its efficiency and the percentage of successful trades.
The Silver Trading Strategy is offered for use on the 1 Hour (H1) timeframe and is suitable for active traders with the Silver OANDA:XAGUSD asset.
The Silver Trading Strategy FOREXCOM:XAGUSD is suitable as a complement to your trading system and can help increase the efficiency of your Silver trading.
Bob Volman Price Action StrategyPrice action trading strategy combined with 21 period moving average.
Use the 21 period moving average and filter along with price action to identify the main trend then look for pullback signals that match the filter to enter.
The stops, entry points and trends are depicted on the chart.
Example using 100 contract size with crude oil, slippage is 3 and commission per order is 3$ with actual capital of 10000$, you can adjust other contract size for other pairs to consistent with reality.

MY_VISIONThe MY_VISION strategy is designed to work with any tool (cryptocurrency, stocks, forex) on any TF.
The signal formation is based on the Donchan channel with the author's revision of the conditions for fixing the price above or below the trend line.
Setup is set up by adjusting the period and multiplier, which are standard for the Donetsk channel.
Also, the strategy has the ability to display additional signals that may occur in the area of the main signal (LONG/SHORT) after confirming the formed pivot (pivot point/rebound) and subject to the closing of the previous transaction.
You can choose several types of takes:
1. ATR-takes, which depend on the price volatility and the width of the Donetsk channel.
2. FIX-takes that you set manually in % of the price.
3. TRIGGER-takes that are formed according to the triggers found by the script on the chart. Triggers are certain price points that appear on the chart when testing the support or resistance level, in the future, the price in 90% of cases returns to these levels and breaks through them. The MY_VISION strategy finds these points on any TF, takes into account those already worked out/overlapped by the price and uses these values as takes.
You can use from 1 to 3 takes to choose from; the desired take is marked with a check mark in the settings.
You can also use several types of stop lines:
The ATR value of the stop line is formed on the basis of the volatility along the ATR line and has a tuning multiplier that allows you to bring the stop line closer or further away from the price.
1. FIX - a fixed value of the stop line as a % of the entry price of the position.
2. TREND - the value of the stop line is carried out along the base trend line of the Donetsk channel.
3. PIVOT - the value of the stop line is set at the nearest pivot (pivot/rebound point) and is shifted if a new one is formed.
You have the opportunity to activate the stop-line lift under the following conditions:
1. Lift at tp1 to breakeven.
2. Lift at tp2 to breakeven.
3. Lifting the stop line to the specified level in % of the entry point when the price reaches the specified profit. (This is especially convenient if you do not use fixed takings or they are of great importance).
Also, the strategy has the ability to display a table with a list of triggers (the price at which a breakout is expected) at the top and bottom of the current price up to 10 pcs. on each side.
It is possible to display the trend line, the current state of the strategy (position, take values, stop line value), the background illumination of the trading zone (LONG/SHORT). As well as displaying a compact display in the indicator settings table, for the convenience of saving your settings using the PrintScreen function.
You can sign the strategy in the Notes field - this is convenient if you place several versions of the MY_VISION strategy on the chart with different settings (for different pairs or for different TF).
>> In the strategy settings, each field has hints, to do this, hover the cursor over the sign ⓘ
-------------------------------------
The MY_VISION strategy is closed! You can get test access to it for 48 hours.
In order to get access or ask questions, write to me in private messages or by the contacts specified in my signature.
-------------------------------------
Стратегия MY_VISION предназначена для работы с любым инструментом (криптовалюта, акции, форекс) на любом ТФ.
В основе формирования сигналов лежит канал Дончана с авторской доработкой условий закрепления цены выше или ниже трендовой линии.
Настройка сетапа производится с помощью регулировки периода и множителя, стандартных для канала Дончан.
Также в стратегии есть возможность отображения дополнительных сигналов, которые могут возникать в зоне действия основного сигнала (LONG/SHORT) после подтверждения сформировавшегося пивота (точки разворота/отскока) и при условии закрытия предыдущей сделки.
Вы можете выбрать несколько типов тейков:
1. ATR - тейки, которые зависят от волатильности цены и ширины канала Дончан.
2. FIX - тейки, которые Вы задаёте вручную в % от цены.
3. TRIGGER - тейки, которые формируются по найденным скриптом триггерам на графике. Триггеры - это определенные ценовые точки, которые появляются на графике при тестировании уровня поддержки или сопротивления, в дальнейшем цена в 90% случаев возвращается к этим уровням и пробивает их. Стратегия MY_VISION находит эти точки на любом ТФ, учитывает уже отработанные/перекрытые ценой и использует эти значения в качестве тейков.
Вы можете использовать от 1 до 3 тейков на выбор; нужный тейк отмечается в настройках галочкой.
Также Вы можете использовать несколько видов стоп-линий:
1. ATR - значение стоп-линии формируется на базе волатильности по линии ATR и имеет подстроечный множитель, который позволяет приблизить или отдалить стоп-линию от цены.
2. FIX - фиксированное значение стоп-линии в % от цены входа в позицию.
3. TREND - значение стоп-линии ведётся по базовой трендовой линии канала Дончан.
4. PIVOT - значение стоп-линии выставляется по ближайшему пивоту (точке разворота/отскока) и смещается, если формируется новый.
У Вас есть возможность активировать подтяжку стоп-линии при следующих условиях:
1. Подтяжка при tp1 в безубыток.
2. Подтяжка при tp2 в безубыток.
3. Подтяжка стоп-линии на заданный уровень в % от точки входа при достижении ценой заданного профита. (Это особенно удобно, если Вы не используете фиксированные тейки или они имеют большое значение).
Также в стратегии есть возможность отобразить таблицу со списком триггеров (цена, по которой ожидается пробитие) сверху и снизу от текущей цены до 10 шт. с каждой стороны.
Есть возможность отображать трендовую линию, текущее состояние стратегии (позиция, значения тейков, значение стоп-линии), фоновая подсветка торговой зоны (LONG/SHORT). А также отображение компактное отображение в таблице настроек индикатора, для удобства сохранения своих настроек с помощью функции PrintScreen.
Вы можете подписать стратегию в поле Notes - это удобно, если Вы размещаете на графике несколько версий стратегии MY_VISION с разными настройками (для разных пар или для разных ТФ).
>> В настройках стратегии у каждого поля есть подсказки, для этого наведите курсор на знак ⓘ
-------------------------------------
Стратегия MY_VISION является закрытой! Вы можете получить к ней тестовый доступ на 48 часов.
Для того, чтобы получить доступ или задать вопросы пишите мне в личные сообщения или по контактам, указанным в моей подписи.
-------------------------------------

Nick Rypock Trailing Reverse (by everget)Hello.
Research (NRTR) from the author (Evergrt) made into strategy.
The idea of the indicator is similar to the Chandelier Exit , but doesn't involve ATR component and uses a percentage instead.
A dynamic price channel is used to calculate the NRTR. The calculations involve only those prices that are included in the current trend and exclude the extremes related to the previous trend. The indicator is always at the same distance (in percent) from the extremes reached by prices (below the maximum peak for the current uptrend, above the minimum bottom for the current downtrend)
I also added filter output, rsi /% output, and backtesting to the strategy. Below in order:
1) Logic entry:
% - distance as a percentage of extreme values
2)Filter settings
If the checkbox is checked, the rsi/wma filter will be used. If at the moment of triggering a buy signal in a long line, the rsi line is under the lower line, then a buy will be made, and if not, ignored. With the short position, on the contrary, the upper line border is responsible for it.
3)Exit settings
-exit by rsi, if the conditions are triggered, but the position is in the red, then there will be no exit.
- percentage output
If there is a tick on the rsi and%, then the position will be closed, which will be the first.
4)Darta range
backtesting for any period of time

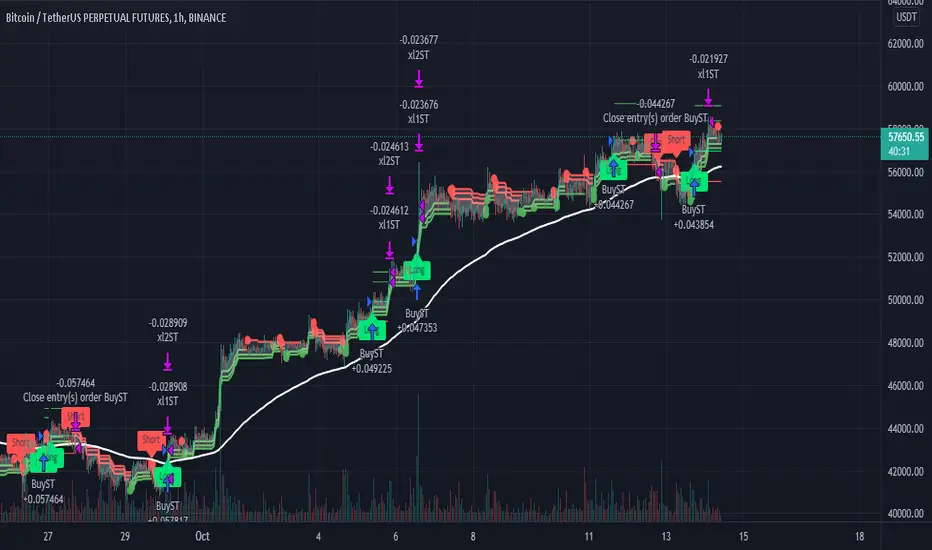
mark strategy2 divergence bot v0.5 for xbtusdHi first of all thanks for read this.
This is my second strategy for make trading, I optimized it for xbtusd with 30 min charts.
You can personalize some setting for reach a better result then me, these are the setting:
this script is only for long trade, so bearish divergence don't work
1)ema1
U can change this value for use another ema and use a faster or slower trend
2)ema2
U can change this value for use another ema and use a faster or slower trend
3)pivot right
U can change this value for watch a number of bar on your right
4)pivot left
U can change this value for watch a number of bar on your left
5)high range
U can change this value for watch a max number of bar
6)low range
U can change this value for watch a min number of bar
7)bullish
U can change this value for enable signal with bullish divergence
8)hidden bullish
U can change this value for enable signal with hidden bullish divergence
9)bearish
U can change this value for enable signal with bearish divergence
10)hidden bearish
U can change this value for enable signal with hidden bearish divergence
11)profit 1 %
U can change this value for the first take profit target
12)profit 2 %
U can change this value for the second take profit target
13)qty target 1 %
U can change this value for close a % of your trade at target 1
14)loss %
U can change this value for close the trade at a % of loss
Have nice day and send me a message if u will earn with my strategy.
If u want my code send me a message
for info send me a message

Super Rev StrategyThis is a strategy version of the super Rev Study, its a buy sell indicator that uses a combination of 3 super trend lines , EMA , Williams %R, the squeeze momentum indicator and the MK oscillator
The super trend lines and ema are utilised to locate the trend.
The williams %R has been incorporated to determine overbought/oversold conditions.
The MK oscillator is used to filter out trades
The buy and sell flags are generated based on the following conditions:
The location of the price in relation to the super trend lines
if the price is above or below the EMA .
If the Williams %R is oversold/overbought
Mk oscillator over or under
The squeeze momentum indicator can be added as a filter to only allows trade in certain conditions i.e bullish and above the 0 line or avoid trades if bearish and above the 0 line for example.
All the indicators involved can be customised to created a unique indicator
we strongly recommend testing this strategy in bar replay mode to highlight repaint conditions, increasing the candle confirmation on the Mk oscillator settings can be used to minimise these situations
The strategy results in the image, have used the following inputs to generate the results
Starting equity - 10,000
% of equity - 10%
Commission - 0.0075
Slippage - 10 pips
Created by manomanomano, Developed by @badshah_e_alam
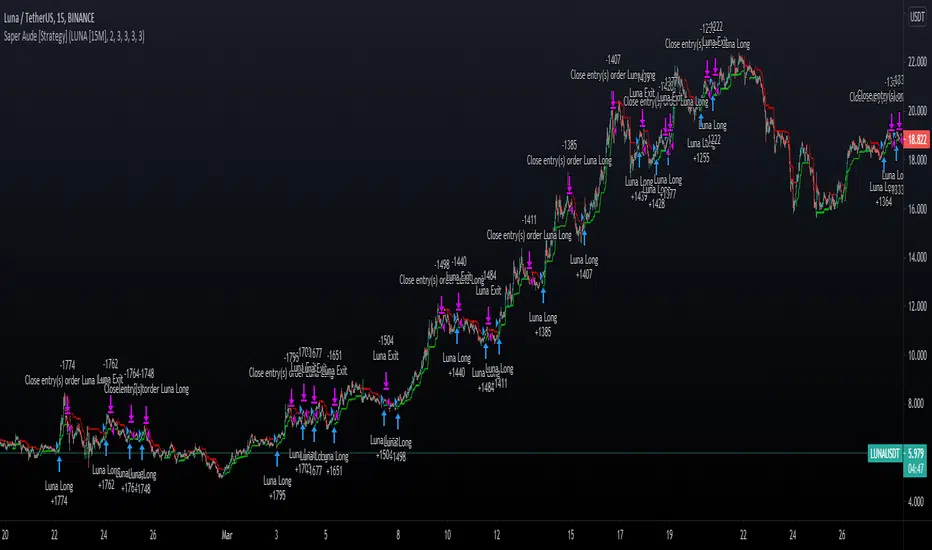
Saper Aude [Strategy]Sapere Aude Strategy
Trend based scalping strategy, to work on lower timeframes (15Minute - 1 Hour)
Calculations on ATR, strategy uses extra conditions to help filter out bad trades.
How to use the strategy?
Simple as when green line shows below, that can be either a good entry point or a signal to start building limit orders on the plot.
I use the ATR as a trailing stop loss for exit.
vica versa for entering shorts. The strategy is only set up to take long positions though.
This is a great scalping strategy for bots in Ranging or up trending markets.
This scripts has 5 variations built within it which are fitted for certain coins & their timeframes
The coins included are
BTC/USDT 1 Hour
ETH/USDT 1 Hour
ADA/USDT 30 Minutes
DOGE/USDT 15 Minutes
LUNA/USDT/15 Minutes
The Strategy backtest results includes Fess and there is NO Repaint! The script is written in Version 4
There is an option in the settings cog to choose from the 5 coins and their timeframes where they have been optimised
There is also an option to change the backtesting range
The stop Losses are also adjustable and listed under the settings
The strategy performs best on the Binance listings
TEMA Cross +HTF BacktestThis is a follow up to a previous script release called " TEMA Cross Backtest ".
This new strategy uses two TEMA crosses, one for trend direction, one for entry and exit. The entry and exit parameters are the same as the previous script. The trend direction is based on a user configurable higher timeframe TEMA cross which determines when to take longs or shorts. When the indicator is purple, it is looking for shorts, and when it is yellow, it is looking for longs. The background of the chart is colored accordingly to see the trend direction at a glance.
The default settings are the ones I have found produce the highest backtest results. The backtest is set by default to use a $500 account, and use $500 for every entry and exit, no matter the direction or overall profit/loss.
Parts of script borrowed from other public scripts.

MA-SS ( EMA SSL ) Indicator StrategyThis is the strategy script relating to the already-published MA-SS Indicator Study.
Backtest properties for the strategy tester results shown below are;
- 10k initial capital
- 50% of equity
- 0.0075% commission
- zero values on everything else
The MA-SS Indicator is a simple yet effective indicator using a combination of EMAs and SSL channel, utilising higher time frame data to help confirm trend/ price direction.
How does it work?
The Indicator consists of;
- 3 x EMAs – The 3rd EMA being a filter EMA
- Multi Time Frame EMA (This is an additional filter EMA which can be switched on and off)
- Multi Time Frame SSL Channel (This acts as a filter and can also be switched on and off)
The concept initially began as a simple EMA crossing indicator, but adding an MTF EMA plus a MTF SSL channel for additional filtering, helped to give a better indication of trend and ultimately filter out several bad trades.
- EXAMPLE: If price is …
o below the MTF EMA filter
o The MTF SSL Channel is red
o White and blue EMAs cross below the yellow (filter) EMA in the red SSL channel
> …a short is fired!
- (Opposite scenario for longs)
- Your stop loss would ideally be the top/ bottom of the SSL channel (either the MTF SSL channel or a standard SSL channel added manually to the chart), or, go for a clear pivot point or support/ resistance level.
- Take profit is yours to decide but I opt for a 1:1.5 risk/reward ratio. You could also use the MTF SSL channel to gauge when you should exit your trade (i.e. if you're in a long, wait for the SSL channel to flip red).
Any questions please fire away in the comments

SMT V11 BY Stock_InshotsHello , i Combined 3 Indicators to generate buy /sell signal
1) Super Trend
2) Simple Moving Average
3) Williams Fractal Indicator.
I thank Trading View to keep all these indicators source code open so i was able to combine and customized as per requirement.
In settings one may change use different period of super trend as well Sma
This works best on 10 min chart.
Buy Setup : after buy signal one can wait for fractal confirmation below the candle and place order above High of that candle with buffer of 0.01% in LTP
or one can place order near to Sma 50 as after Signal as it will come to retest . Reversal Strategy for good Risk Reward Ratio
Sell Setup : After Sell Signal one can wait for fractal Confirmation below the candle and place the order below the low of the candle with buffer of 0.01% in LTP
Note : It may not give good results on Forex better do your on research with different Periods on different time frames
I am not SEBi Registered to advice on your investment. Consult your Financial Advisor before investing on any idea
Please give feedback for Modification/ Suggestions are most welcome.
Thank you trading view a great platform. i am publishing this in protected mode as some ,copy and start selling these type of indicator by invite-only links. i wish to help retailers.
Refer chart for understanding of buy/sell setup
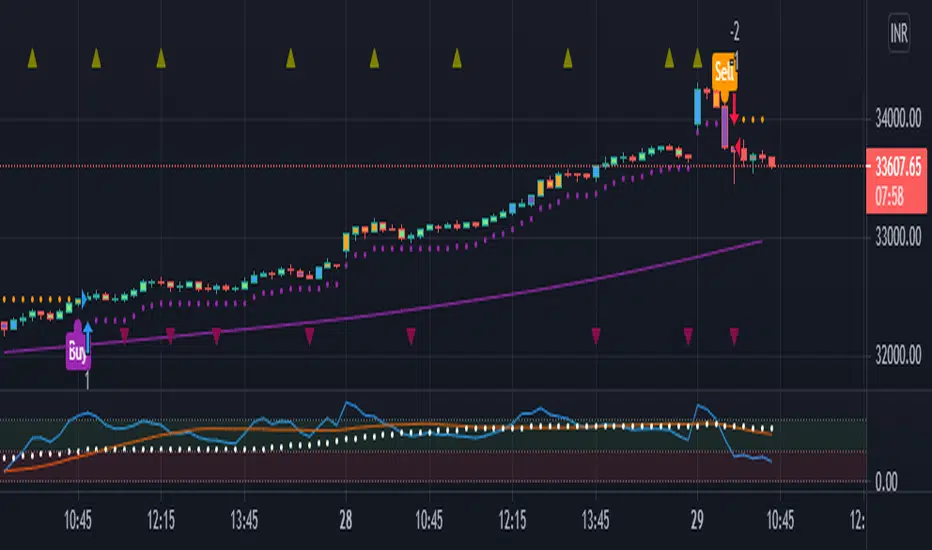
iGTR_Official StrategyThis alert indicator is pair of strategy using crossover of multiple Moving Averages for entry in Buy/Sell side & Pivots/Fibonacci zones for booking/trailing gains. Also added pair of moving averages which corresponds with the crossovers to hint potential trend reversal on breach. Green line gives trend reversal indication for Long trades, Red line gives SL indication for Short trades.
Also one may add indicator like MACD/ADX/CCI/RSI for more conformation/rejection/follow-up of trend post entry of signals.
Trend tracking strategy indicators through trend analysis.
Through 18 years of trading experience, I have developed this strategy indicator for Tradingview that enables stable and high returns.
This is the one I am currently using for real trading.
Correct timeframe is key to success. 5-15 min for Intraday, 45-60 min for Swing Positional trades.
The research process is very important as you can see beforehand how well the alerts for this Study would perform.
For detailed backtesting, a backtesting period can be set.
*Note: Backtesting results do not guarantee future results.
This premium indicator is free & not chargeable.
Do not try to outsmart the strategy
Leave your emotion out of trading! If you trust the strategy, you will have way better returns than if you try to outsmart it. Follow each signal you receive even if it doesn't seem logical at the moment.
Become a machine that executes.
Don't look at fundamentals. Follow the trend! Trust the strategy!
Any form of trading has large potential rewards but also large potential risks. The user must be aware of those risks and be willing to accept them. Don't trade with money that you, the user, cannot afford to lose. No representation is being made that you are guaranteed positive results.
The past performance of any trading methodology is not necessarily indicative of future results. Trading involves high risks.
I hope you enjoy it!

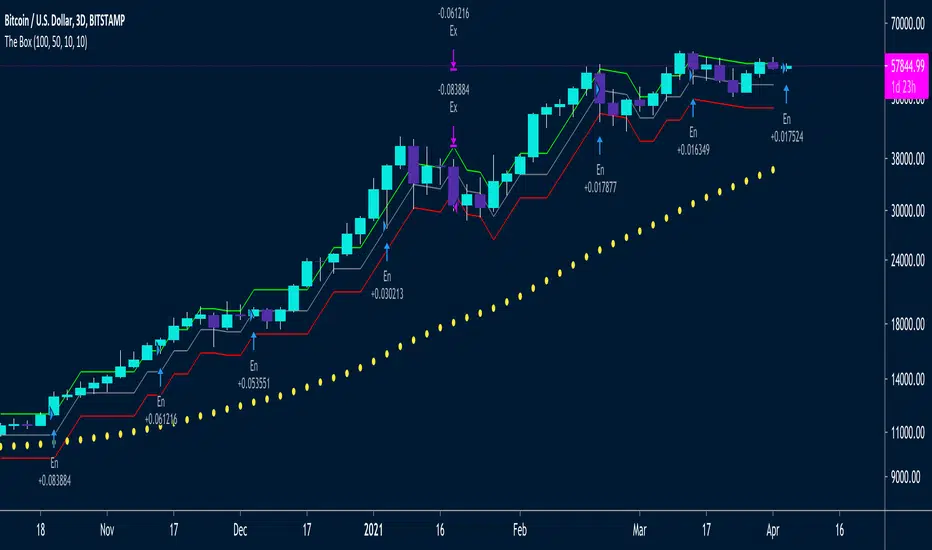
The Box Percent StratHi guys,
Version Zero (more work needed) of an idea I've been meaning to out into a strategy for a while. 🤯
This uses percent boxes🤔 instead of traditional indicators like RSI, MACD etc. 🤫
Takes the first close price of the series and creates a Top Band 10% up, buys if price reaches that level, and puts a stop on a Bot Band, 10% down
When the first trade is in profit by another 10%, it enters another trade and moves the stop of the first trade to breakeven ~ this way it only has one unit of risk at a time
/// Designed for LONG only on Daily, 2D or 3D Charts👌🏻
/// Uses fixed investment risk amount, meaning you're willing to lose that amount per trade
/// Limit buy to not overpay on entries
/// Idea Based on the Darvas system:
/// System only enters trades on strength, when prices equals of exceeds the green line
/// It ads onto the trades, but only *IF* the previous trade is in profit by the UpBoxSize percent size
/// The trailing stop loss is moved up, with the red line
/// A key idea is to only take one unit of risk at a time, meaning for a new add on trade to be taken, the previous trade should be in profit by the same box size as the new new trade's stop loss
/// This will keep adding trades again and again, and they will stop out at the same stop loss
/// Yellow Circles is an MA that filters out choppy areas -- this system only does really well on trending linear markets like: TQQQ, SSO, SPX, SPY
/// Base setting is 10% UpBox Size and 10% DnBox Size: 15% & 15% will be more accurate but fewer signals. 13% profit and 10% stop loss will give a higher risk to reward ratio
Point of possible Reversal (PPR): forex Strategypoint of possible Reversal, PPR :
in this strategy I have tried to find out the possible Reversal points in the forex pairs. It’s the most resisted levels from where the trend takes up a particular direction. These PPR can lead the price in any direction depending upon the time zone its happening in.
In this strategy once the code finds a PPR it then checks for suitable time zone then it checks for the RSI confirmation, it checks for the Parkinson Volatility, it checks for internal Bar Strength (refer below for more information)
The following setting details will help you in the understanding the strategy and indicator used:
This indicator contains the following setting:
1.Fixed trading sessions for Long and Short
i. Fixed trading session for long trades (long position can be taken in that period of time only)
ii. Fixed trading session for short trades (Short position can be taken in that period of time only)
The concept behind restricting the time to go long or short is because in forex the particular pair move in a particular direction depending upon the currency and time zones.
This strategy works on different forex pairs, you need to find the best settings. I will be providing the best settings which works for this strategy and different pairs.
2.Setting for back test selection date range you can check the beck test of a particular time range.
3.You can check Long and Short positions performance separately, by unchecking the “ Go_long ” option it will remove all long positions from back test. Vice versa for “ Go_short "option
4.Internal Bar Strength
IBS is simply an indicator where you buy on weakness and sell on strength, the cornerstone of any mean-reverting strategy.
It oscillates from zero to one and measures the relative position of the closing price relative to the High and Low.
IBS = (Close – Low) / (High – Low)
In the input setting the you can disable enable the IBS option from the strategy.
5. Parkinson volatility
Parkinson volatility is a volatility measure that uses the stock’s high and low price of the day (can be changed in the setting, instead of day it can be set to any bar length)
The main difference between regular volatility and Parkinson volatility is that the latter uses high and low prices for a day, rather than only the closing price.
In the setting you have three option
1. Enter Volatility Threshold
If the Parkinson volatility value is greater than the the threshold value then it lets the trade happen.
2.Set the high/low bar time frame for calculating Parkinson volatility. ( Set 60m by default)
Formula used as below:
high_=security(syminfo.ticker, input("60"), high)
low_=security(syminfo.ticker, input("60"), low)
hourlyRangeSquared = pow((log(high_) - log(low_)), 2)
dailyParkinsonVol = sqrt(sum(hourlyRangeSquared, 24) / (4 * log(2)))
6. "Enter no of contract size"
This setting helps you to set the contract size , by default it is set to 100000.
7.This setting is for the PPR, in this you can change the search of PPR in another time frame, you can add higher timeframe PPR in the chart, by default the PPR is set to search for current time frame PPR.
8.Futrther confirmation of trade is done through the RSI criteria . In this I have provided four kind of RSI confirmation you can test all by selecting any one of the four.
1. filter trade on the basis of BB of RSI (as shown in the image)
2. filter trade on the basis of RSI Levels (RSI>50 for long, vice versa for short)
3. filter trade by rsi>basis of BB of RSI(for long) & rsi<50(for short)
4. filter trade by rsi>50(long) & rsi< basis of BB of RSI(short)
SELECT ONLY ONE OF THE ABOVE IN SETTING.
9.For Exiting the trade I have used the trailing SL you can change it in setting.
You can exit the trade using two targets (two take profit) using different size for editing the trade.
If you want to take only on target then you have to make QANTITY of shares for 1st Exit as 100. Then you will exit all your position in the first target achieved.
A big thanks to kodify.net there articles are very helpful kodify.net
Thanks to stack overflow community for clearing the doubts.
Thanks to Mickey for providing assistance.
Trading view official documentation on V4 of pine script also helped me.

ELIA MULTI INDICATORS STRATEGYExperimental multi indicators strategy, to catch right entry and avoid noise.
Each indicator included in the strategy, assume a value based on its status and because is a trend-follow strategy, some indicator value are higher then the other
Backtested on ETHUSDTPERP
BINANCE:ETHUSDTPERP

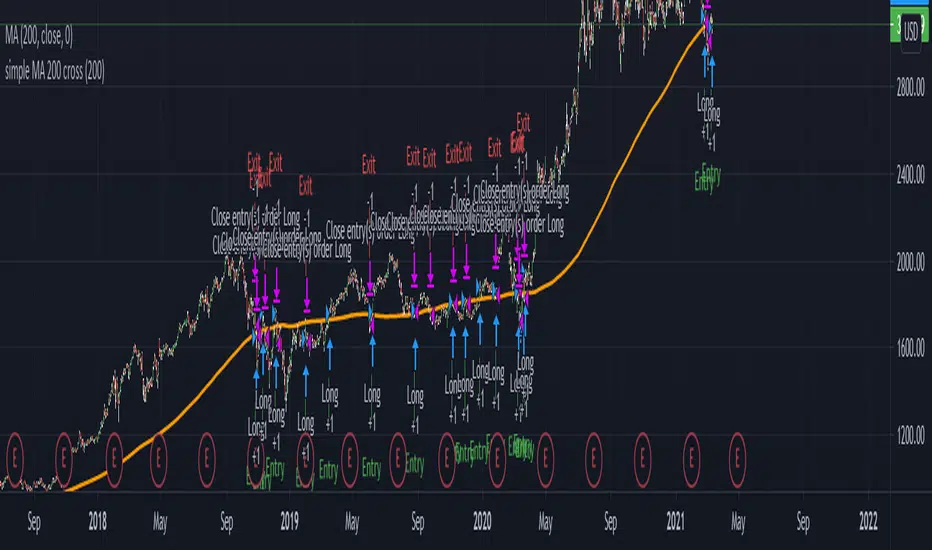
Basic SMA 200 StrategyThe SMA 200 basic strategy will be more than familiar to most traders.
This strategy is to stay with the programming language so to say the "Hello World" of trading.
The SMA 200 basic strategy is also one of the simplest strategies in trading. All that is required is the price and a 200 period moving average. Usually the strategy is used in the daily chart.
The rules are as follows:
Entry: A position is opened when the price crosses the moving average 200 from the bottom to the top.
Exit: The position is closed when the price crosses the moving average from top to bottom.
This is a trend following system and was originally used for trading stocks.
In my opinion, trading with the strategy is recommended to every beginner. There are strategies with better performance, but they are much more complicated to implement. And that's where the big advantage of the strategy can be seen.
Beginners are more than overwhelmed at the beginning of their trading career. Often beginners trade in the 5 min chart with 6 different indicators some signals that they have seen in a Youtube video.
Comparable to a beginner driver who immediately gets into a Porsche as his first car.
Beginners should follow simple rules and avoid intraday charts. Above all, you should do the actual work of a trader.A trader does not just press the mouse twenty times a day and then has easily earned 2000 $. A trader tests systems down to the smallest detail, optimizes and tests again, until he has found an almost " waterproof " trading system. The 200 SMA basic strategy is excellent for gaining experience, learning to follow the rules of a system and not to burn your money right away.
With this script you can test how successful the "simplest strategy in the world" would have been in the past.
Small tip: Do not trade Forex with it it will never work. The strategy is made for long trends and you can find them for example in the stock market.
Have fun with it! About a positive feedback I would be very happy of course.