OMIDThis strategy detects whether the price is ranging or moving on a trend.
When the price is between the lines it means it is ranging, when it is above two lines it means we are in an uptrend, and when the price is below two lines it means we are in an uptrend.
The signals also suggest trading opportunities.
ค้นหาในสคริปต์สำหรับ "trend"


AW N BTC PROFITMix of ATR and other statistic indicators to find trends at early stage.
Long signal -> open long position
Short signal -> open short position

Adam's killer cloudThis script displays a cloud that will change in size and also in color. The size of the cloud will show Momentum and the color (red/green) will show whether the price action is in a uptrend or a downtrend.
There will also be long and short signals pop up when the trend changes.
Use these signals to trade the direction.

Super cloud [Backtest]This is a valid strategy for Bitcoin.
Judge up and down trends.
In addition, the cloud can form a short-term trend can be judged.
In addition to the basic longs and shorts, you can test intermediate clearing, reentry points, and additional entry points using the cloud.
However, basic long and short are considered the most effective.
You can set the variables F, duration, and leverage that determine the backtest duration and cloud cover width.
* * *
비트코인에 유효한 전략입니다.
상승과 하락 추세를 판단합니다.
추가적으로 구름대를 형성하여 단기적인 추세 또한 판단해볼 수 있습니다.
기본적인 롱, 숏 외에 구름대를 활용한 중간 청산, 재진입 지점, 추가 진입 지점을 테스트해볼 수 있습니다.
단, 기본적인 롱, 숏이 가장 효과적인 것으로 판단됩니다.
백테스트 기간과 구름대의 폭을 결정하는 변수 F, 기간, 레버리지를 설정해볼 수 있습니다.

AlphaDeep Conservative v1.0What's AlphaDeep?
AlphaDeep is an expert trading system that advises customers with buy and sell entries, protective stops, and profit targets. With every trade you will know the precise entry level, whether you are going long or short, and the possible profit target.
AlphaDeep Features
An incredibly easy and reliable way to identify the start and finish of market trends.
Buy & Sell Signal Entries: When these signals are generated, they alert us to a market ready to possibly explode to new highs or lows.
Logical Stop, Forget Using Arbitrary Stops! The stop placement techniques put your stops where the "big money" has theirs. Their protective stops are seldom filled because they know the optimal possible placement level in order to maximize their profitability.
Target On Trades That Go Our Way: This target tells you exactly where the next possible market swing will likely be after our initial entry.
Long Only or Short Only Entry Options: Some traders prefer to only go long or short depending upon their market perspective. The system has inputs to enable long or short entries or both.

Bitcoin iWin Indicator & StrategyWelcome to the IWIN LS!
This is a trend identification indicator.
Setup:
Chart Historical Price must be set to "bars"
Time Range: 12hr
How to use:
Long = buy
Close Long = sell
* this is a tool not intended to be used as financial advice or to make any investment decisions.
* invest at your own risk

inwCoin MACD Cross Zero Risk% Strategy.=========================
English
=========================
Just simple MACD line cross zero strategy
Cross up = buy
Cross down = sell
easy as that
==========================
Thai
==========================
นั่งทำ backtest strategy มา 10 ตัว
แล้วก็มานั่งนึกๆ ว่า เออ เรายังไม่ได้ลองทำ MACD เลยนี่หว่า เลยลองทำขึ้นมาขำๆ ดู
กลายเป็นว่า.... กลายเป็น strategy trend following ที่โคตรๆ จะได้กำไรงาม และดีที่สุดแล้ว ตั้งแต่ ทำ backtest มา
ใน Timeframe Daily นี่แบบว่า ชัดมาก บอกให้เข้าตอน 3600 ( เหมือนตอนลุงโหลกบอกเด๊ะ )
โถ่ถัง 5555
หลักการคือ ให้เส้น MACD ตัด 0 ขึ้นมา ก็ buy
ตัด 0 ลงไปก็ sell
แค่นี้เอง.. ง่ายโคตรๆ แต่ทำกำไรได้อย่างงามอ่ะ บ้าบอดีมะ 5555

Hull Trend & Kahlman Strategy Backtesthere is a description of the script. this is a test and it's not my script.


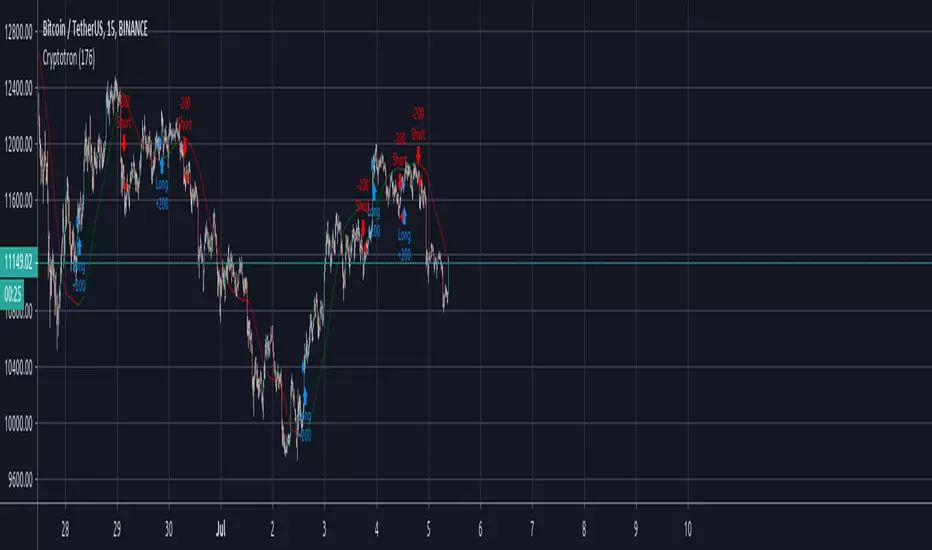
CryptotronCryptotron is a more aggressive form of Kalia Strategy. It is only to be used with huge momentum and high volatility to get trend analysis... It doesn't repaint at all.
Advised use :
Trades highly volatile Crypto currencies, stocks as well as Gold.
For python API code do not hesitate to reach out.
Alnami_Quantum_blocks v.4The (Al Nami Quantum Blocks v.4) script is based on Renko chart that is based on % move of the selected symbol. This is different from the traditional or ATR based Renko charts..
box size = user selected percentage x current price
Alnami Quantum Blocks Channel is composed of 5 levels that are calculated based on the box size:
1- Base
2- Green Box High (GBH) = Base + box size
3- Next Green Box trigger (GBN) = base + (box size x 2)
4- Red Box Low (RBL) = Base - box size
5- Next Red Box trigger (RBN) = base - (box size x 2)
Those levels will appear in the chart with the following order:
------GBN-------
------GBH-------
------BASE------
------RBL-------
------RBN-------
Usually when prices are trending up, the price will stay above the base for most of the time,, when it trending downwards, price stays below base most of the time..
Now how to time your entries based on the channel? This system is equipped with 4 strategies:
1) New Green Box:
When the channel draw a new green box, place a buy order
When the channel draw a new red box after a green box, place a sell order
2) Retracement:
The user have to select one of the above 5 levels to serve as a retracement level, namely, GBN-GBH-Base-RBL-RBN
When the current box is green and low price crosses below the selected level, place a limit buy order at the selected level
When the channel draw a new red box after a green box, place a sell order
3) Auto-Trailing System:
This strategy draws two levels based on a proprietary quantitative algorithm.
If the price is above both lines, place a buy order
If the price is below the lower line, place a sell order

Kalia StrategyKalia Strategy is only to be used with huge momentum and high volatility to get trend analysis... It doesn't repaint at all.

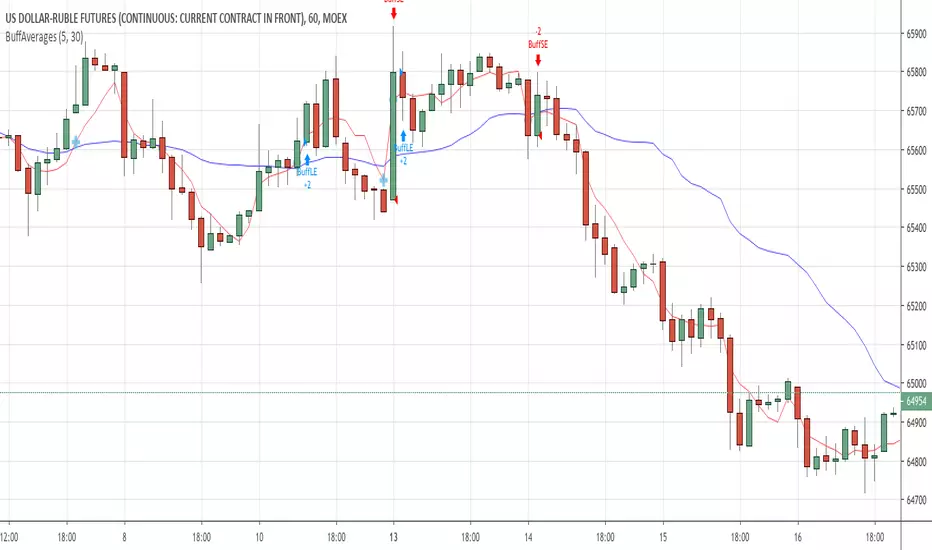
TradeTrailStop close gt open MMarkets:::
Gold::: weekly or monthly
NasdaqComp:::monthly
Nasdaq100::: monthly
DowJones::: monthly
Bitcoin::: dayly or Weekly
Only IndexTrading,
Not for StocksTrading
Winnings or Losses are reinvested
...try it out
...simple fast trending Strategy

Inverting trend momemtumUp~Down: you still winning!
Let me know how are your results, trade on options with a Heikin Ashi!

[KICK] WT-ADX BTC 1H StrategyA robust strategy that primarily uses Wave Trend and ADX indicators for entry and numerous trend change indicators for exits. Designed to use both hard stops (%based, closes as soon as hit) and soft stops (ATR based, only if candle closes beyond). It has been tuned and tested for BTC on the 1 hour chart. Other instruments and timeframes are unlikely to be as profitable.

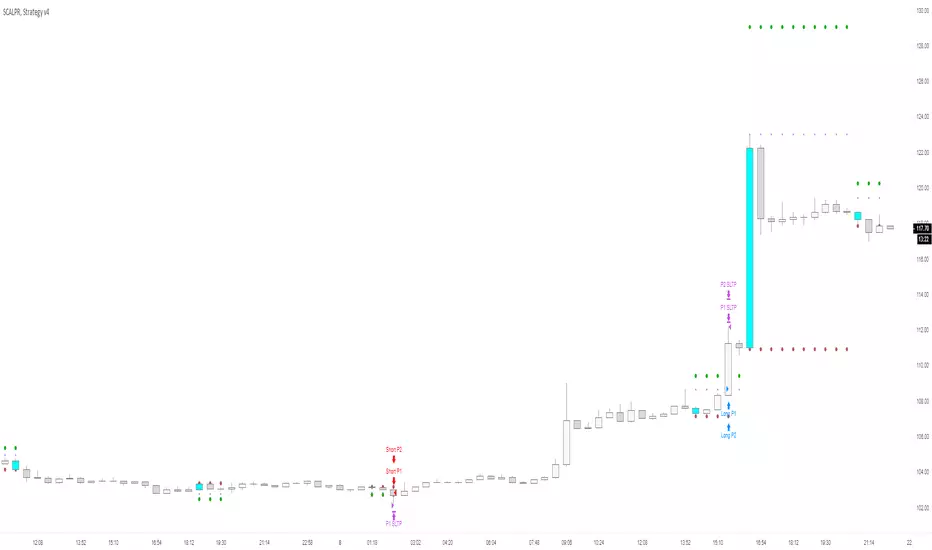
SCALPR, Strategy v41. Strategy for scalping based on the existing trend
2. Plots setup, entry, stoploss, and take profit zones
3. Customizable options to determine the "trend"
- Custom EMA/SMA crossovers
- Above/below key MAs
- Filter to also factor in data from the Ichimoku Cloud
4. Multiple Take Profit options
- In proportion to risk (.5R, 1R, etc.)
- Trailing stoploss x number of candles back
- Trailing stoploss using an EMA value of your choice
5. DOES NOT REPAINT
6. INVITE ONLY

ramzes with strategyThe script is a strategy version of standart ramzes script.
That scripts has next way to use:
1.Determine trend direction, by cheking direction of EMA233 (optionally). If it grows - bullish , if falling - bearish trend .
2.Then use BUY signal to long and SHORT signal to sell. Everything is simple
Ribbed Bars showes stoploss level

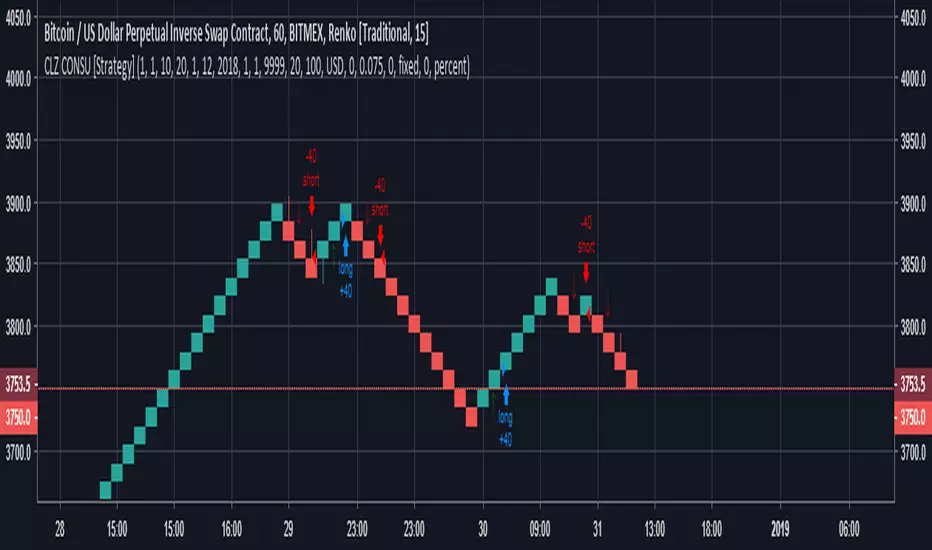
Colorize Consequential [Strategy]This script allows the user to find the best entry-point based on the trend using Renko with any time-frame.
With the ability to analyze in a date-range allow you to have a better view of the backtesting result.
Profits_Block_renkoThis indicator generates buy and sell signals based on price action patterns.
If the red dot moved to 1, then buy
If the red dot moved to 0, then sell
This is applicable for any asset with price less then $3
The indicator is trend following that may not work efficiently in choppy market conditions
Happy trading!
ANAS
