AC- MY SCRIPT1My Ac- My Scrpt1 that the BUY and SELL signals (trend reversals) for many coins defined different tickers in Tradingview charts
Terminology explanation:
Confirmed Reversal: Oxford T reversal that happened in the last bar and cannot be repainted.
Potential Reversal: Oxford T reversal that might happen in the current bar but can also not happen depending upon the timeframe closing price.
Downtrend: Tickers that are currently in the sell zone
Uptrend: Tickers that are currently in the buy zone
List and show has also got a built in Oxford T indicator which users can confirm the reversals on graphs.
Screener explores the 40 tickers in current graph's time frame and also in desired parameters of the OTT indicator.
Also you can optimize the parameters manually with the built in STRATEGY version.
Built in Moving Average type defaultly set as VAR but users can choose from 8 different Moving Average types like:
SMA : Simple Moving Average
EMA : Exponential Movin Average
WMA : Weighted Moving Average
TMA : Triangular Moving Average
VAR : Variable Index Dynamic Moving Average aka VIDYA
WWMA : Welles Wilder's Moving Average
ZLEMA : Zero Lag Exponential Moving Average
TSF : True Strength Force
Tip: In sideways VAR would be a good choice
You can use OxforfT default alarms and Buy Sell signals like:
1-
BUY when Prices are above OxfordT
SELL when Prices are below OxfordT
2-
BUY when OxfordT support Line crosses over OoxfordT line.
SELL when OxfordT support Line crosses under OxfordT line.
3-
BUY when OxfordT line is Green and makes higher highs.
SELL when OxfordT line is Red and makes lower lows.
IMPORTANT: SCREENER ONLY EXPLORES AND SCREENS FOR THE 2nd SIGNAL TYPE:
BUY when OxfordT support Line crosses over OxfordT line.
SELL when OxfordT support Line crosses under OxfordT line.
ค้นหาในสคริปต์สำหรับ "trend"
Mini-Pullbacks SupertrendThis WOP script is trying to check the pullbacks in a trend and open a position when the pullback is finishing
ZenBlockChain BTC long-only strategyThis BTC long-only strategy massively outperform buy and hold BTC for the same time period, not just for cumulative return but also sortine ratio and maximum drawdown. ZenBlockChain BTC long-only strategy using multiple trend-following indicators to trade BTC. This strategy is most effective on 12h and 24h window. However, the winning odds for this strategy is below 50%, but winning trades are way better than losing trades. So this strategy makes a killing.
---------------------------------------------------------------------------------------------------------------------------------------------------------------------
此只做多的BTC 策略大幅勝過買進持有BTC的策略。不僅在總報酬上面有優異的表現,在sortine ratio and maximum drawdown 也都比買進持有表現優異許多。ZenBlockChain BTC 只做多的策略採用數個趨勢交易指標作為買賣基礎。其中以K棒12小時表現最好,其次是24小時的K棒也能有好的表現。然而此策略的缺點在於勝率低於五成,不過因為大賺小賠,因此整體能有超額的表現。
robotrading body-limitThis is a very simple and universal strategy. Good for crypto. For BTC/USD, shitcoin/BTC .
Strategy
Long positions only. If the candle is falling and the candle body is 3 or more times the average candle body, then open a long position by limit order.
If the candle is rising, we should close a long position.
Short positions are not used.
This is a counter-trend strategy.
The average body of a candlestick is the arithmetic average of the bodies of the previous 100 bodies.
Parameters
The multiplier is the number of times the candlestick body should be bigger than the average candlestick body to get a signal to open a long position.
Recommended
- A timeframe of 4 hours to 1 day
- Cryptocurrencies with large market capitalization
- you can use coin/USD, coin/USDT, coin/BTC , coin/ETH, etc

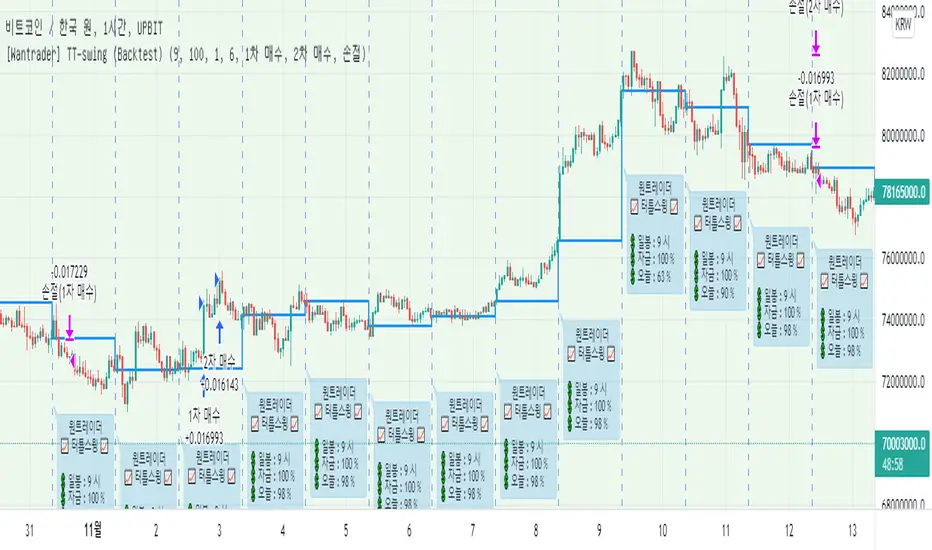
[Wantrader] Turtle Swing Strategy (Backtest)This is the Wantrader's turtle swing strategy.
It's a transformation of Richard Danis' Turtle Trading.
It's the best strategy for and
Please choose 1H time frame
If the date is the future than today, only show you until yesterday
No repaint
"It's a mid-term trend swing strategy."
- Enter a specific standard of reporting price and liquidate it at a new low price.
- It's a long-only strategy without short trade.
- It has high market adaptability in response to market volatility.
- We have minimized over-optimization factors so that they can work well in the future
"The efficiency has been increased by delicate control of entry volume."
- Control losses by managing funds in line with market changes
- Calculate the leverage on the day automatically
- It goes in more when it's advantageous and less when it's disadvantageous
- It's a welfare strategy that works against assets
"We further lowered the risk by cutting off and buying in installments"
- If you deviate from the trend of mid-term price indicators, you will escape.
- It was purchased in installments twice, increasing the confidence of entry
======================================================================
리처드 대니스의 터틀트레이딩을 변형한
원트레이더 터틀 스윙 전략 입니다.
비트코인, 이더리움 에 가장 잘 맞는 전략이며
1H 타임프레임으로 선택해주세요
백테스트 버전은 전일까지만 확인 가능합니다. (당일 진입 확인 불가)
리페인트는 발생하지 않습니다.
"중기 추세 스윙 전략입니다."
- 특정기준의 신고가에 진입, 신저가에 청산합니다.
- 숏은 없는 롱 온리 전략입니다.
- 시장 변동성에 따라 대응하여 시장 적응력이 높습니다.
- 과최적화 요소를 최소화 하여 미래에도 잘 작동 할 수 있도록 만들었습니다.
"섬세한 진입 물량 제어로 효율을 높였습니다."
- 시장 변화에 맞춰 자금관리를 하여 손실을 제어합니다.
- 당일 레버리지를 매일 자동으로 계산합니다.
- 유리할때 더 들어가고, 불리할때 적게 들어갑니다.
- 자산대비로 작동하는 복리 전략입니다.
"손절과 분할매수로 리스크를 더욱 낮췄습니다."
- 중기 가격지표 추세 (모멘텀에 가까움)를 이탈 시 탈출합니다.
- 2회에 걸쳐서 분할매수 하여, 진입 확신도를 높였습니다.
robotrading bodyThis is a very simple and universal strategy. Good for crypto. For BTC/USD, shitcoin/BTC.
Strategy
Long positions only. If the candle is falling and the candle body is 3 or more times the average candle body, then open a long position.
If the candle is rising, we should close a long position.
Short positions are not used.
This is a counter-trend strategy.
The average body of a candlestick is the arithmetic average of the bodies of the previous 100 bodies.
Parameters
The multiplier is the number of times the candlestick body should be bigger than the average candlestick body to get a signal to open a long position.
Recommended
- A timeframe of 4 hours to 1 day
- Cryptocurrencies with large market capitalization
- you can use coin/USD, coin/USDT, coin/BTC, coin/ETH, etc

Know Sure Thing + EMA by @DaviddTechFor this strategy I used 2 indicators
* Know Sure Thing
* EMA for Trend Direction.
Long :
* EMA is below Price
* When the Know Sure Thing line crosses above the signal line
* Both KST and signal lines are below 0
Short :
* EMA is above Price
* When the Know Sure Thing line crosses below the signal line
* Both KST and signal lines are above 0
WARNING:
- For purpose educate only - My mission is to debunk fake strategies with code to find THE ONE.
- Plots EMAs and other values on chart.
- This script to change bars colors.

Ichimoku & SupertrendThis indicator is a combination of Ichimoku and Super trend, while to have a clearer chart, it does not plot on the price chart. Buy and Sell signals are derived from Ichimoku: price closes above the Conversion line, and both are above Komo cloud, there will be a Buy signal. Sell signal appears where the exact opposite has occurred. Since there are more volatility and sharper movements in the cryptocurrency market, it is recommended to use the indicator on Crypto pairs rather than Forex pairs or the Stock market. For this purpose, I tried to optimize the inputs of Ichimoku and assign new inputs as the default values of the indicator. I came up with "8" as the input of the Conversion Line and "53" as the input of the Lagging Span. Although, since the indicator takes advantage of a flexible setting, you may change the values according to the timeframe and market you wish to trade.
There is also a Super trend indicator to give a better insight into the market condition and assist you in executing more profitable trades. The super trend is derived from several simple calculations consisting of the Average True Range and a multiplier (all of which are adjustable). The super trend says the direction of the current market and whether the market is Bullish or Bearish. Where leveling in the slope of the Super trend shows that the market is in a range state.
It is worth mentioning if you entered a position, you should not be waiting for the next signal to appear to close your current position. As my own experiences in Crypto pairs suggest, a Risk-reward ratio of 1.3 would be the best for your positions. For example: If the indicator has shown a "Buy" and you have just entered a long position, it is better to set your Stop-loss just below the previous low (pivot point) and your Take-profit in a way that your Risk-reward be equal to 1.3.
Please do not use this indicator in the "Range" market conditions.
Bottom line, It would be best to consider that this indicator assists you in your trades. It would help if you had made sufficient analysis and managed your risk before you execute any trade.


Nifty IndicatorThis Nifty Indicator that finds selling opportunity on Nifty on Intraday level. Now a single BUY signal will be given here.
---This Indicator works only on Nifty and only 3m Timeframe. (No other time frame , no other stock).
---When a red coloured background starts , that means Downtrend in Nifty has also started and downtrend continues in whole red zone. (Note- the 3m candle which confirms the start of a red zone is included in red zone but the 3m candle that confirms the end of the red zone is excluded from red zone.)
---A unique trend identifying concept is used here. When trend is UP, whole candle during that trend turns GREEN else RED.
How to Trade :
---When Price is inside red zone and inside red zone red candle is formed , then you should trade there till a green candle comes or red zone ends.
----OR you can just ignore the red/green candles , just sell when red zone starts and buy when it ends.
---OR just follow the Sell/buy signals given by indicator. The signals given by indicator is sorted by time, i.e. it give trades only during 09:15-10:30 and 12:30-14:55. And all trades exits at 15:09.

OBV Pyrthe pyramide strategy based on coinrule script
the strategy is based on OBV scalper that i publish in past
seems very proftible for btc but the question is if this is because it bullish now
if i remove the filter then it will lose but the filter make it very profitable
wish all members best new year
this script work best for 1-5 min chart

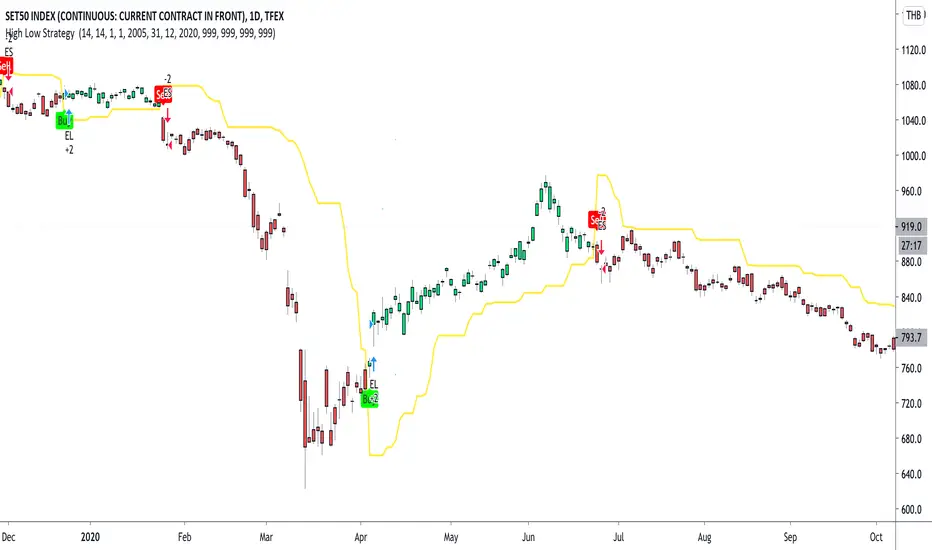
High Low Strategy with signal lineTFEX:S501!
Create Signal-line from Highest and lowest price of previous bar in defined range .
Buy signal : IF high of current bar is cross over highest High of bar in range you choose
Sell signal : IF low of current bar is cross under lowest low of bar in range you choose
after entry the position, the model will hold the position until there're opposite trend direction signals occurred. Its can easily seen by the barcolor "Buy the first green hold until its red"
backtest date and also Tp, Stoploss can be set (credit : kodify.net)
(beware of bias ...... optimum period for each asset and timeframe is different ..... you have to find your own period in put )
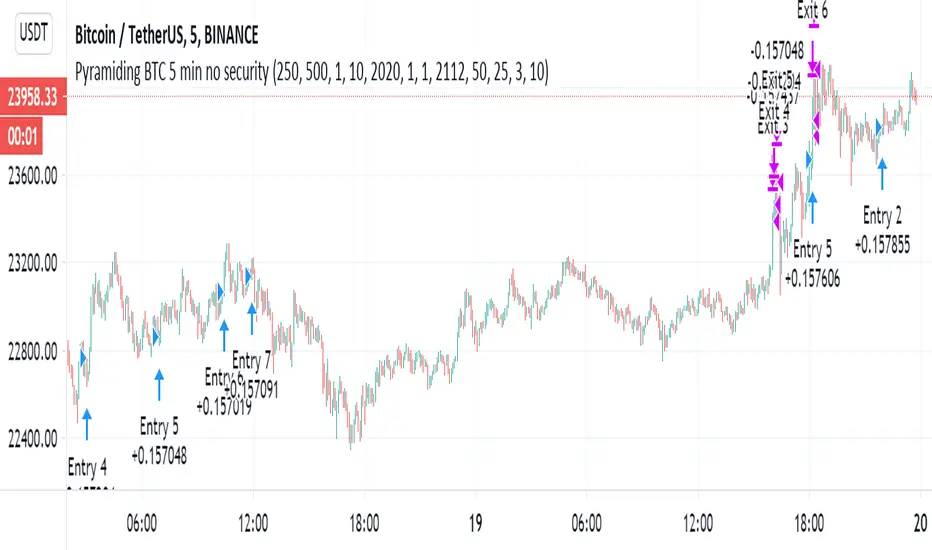
Pyramiding BTC 5 min no securitySince some say that the script with the security is repaint and the results too preety
i decided to run the same script without it. still the best is when security set to 1 min but without the difference not so much.
it just to show the concept of the strategy that based on linear regression cross hull as buy signal
and the the take profit target. so maybe now its also repaint?:)
based
Pyramiding BTC 5 minThe pyramide based on this script with his concent
the strategy is the same as BTC 15 script (look at my open scripts) there it without pyramide
you can use the filter if you wish
one trick if you want it to be more accurate (not mean more profit is to reverse the long and short in the filter ' just it will lose less)
about the strategy of pyrimde you can read in detail from the script of Coinrule
i modify only to have 5 step in the pyramide scheme on 20% of equity (seems more logical)
so let me me know what you think:)

BTC 15 minThis strategy try to catch the uptrend mainly (seems to work on BTC 15 less on others)
the aim is to get 2% in uptrend which is more easy to do then to search only for lowest
since it buy in uptrend it can risky if market change direction
there are two take profit (1% and 2% ) , you take out 50% of equity after the first 1% gain
the stop loss and re buy set 5%
so you exit after 5 % loss and re buy it again at lower price
the aim here is to do leverage trades so you can calculate your risk or lot and the leverage power you want
now set on 100% lot leverage X1
you can try any combination you want but when you do leverage trading you need to do things that the back tester of TV cannot do so well
for example if you put 100X leverage you will be liquidated at 1%
50=2%
20=5%
10=10%
5=20%
you need that your stop loss will be above the liquidation level
stop loss are shit in margin trades as they can kick you out very fast and you will lose many good trades
so I prefer 5X max 10 X trade (this bot can work by himself but i prefer to do it manually for this kind of trades.
all u need to do is to choose what risk you want to have (3% of lot? 5%, 10% or higher )
so this tool try to give you upward buy strategy that aim to get longs at upward trends (short targets that are more easy to get )
and to use leverage as way to make more profit (now bot set to no leverage )
be wise with your money :)
the bot not suppose to repaint but if you find repaint issue then let me know
buy system is based on cross of linear over modified non repainted HMA that set to 1 min (so it buy the uptrend only+ filter based on ema that try not to start cycle of buy in down traade
sell is not so important is mainly cased on percentage channel seen
trend color on Chanel not related to the buy and sell system
BTC botI made good money on this bot in last few month so i decided to donate it to community (its from my private bot collection) design for BTC mainly . it a great bot for longs , shity for shorts :)
no security in this bot so no repaint
the key issue in any bot design is to find good low , after you just exit by take profit
the exit strategy here is based on pivot system
entry is based on Low finder script (that i put as open script )
the Take profit system is based on Adolgov script
in reality main problem now is that bot cannot utilize signal from alerts .but we are working to fix this issue with a good that will come soon
this script is to show how to create a smart non repainting strategy using take profit and finding low as the key for it success
this strategy very good for bullish assets. may not work as well when we are on bearish trend so keep this in mind if you use it

ASHISH_Momentum Finder"Momentum finder" finds pre momentum signal as per multi time frame analysis..
when indicator makes top it shows trending move is about to come.. it can also verified by breaking of recent range.
1. when indicator goes top to bottom it is trending period.
2. when indicator goes bottom to top it is range bound period..
NOTE:
THIS INDICATOR TO BE USED ON OR BELOW 45 MINUTES TIME FRAME ONLY..
DISCLAIMER:
THIS IS FOR EDUCATIONAL PURPOSE ONLY..
TAKE TRADE AS PER YOUR AUTHORIZED ADVISOR..

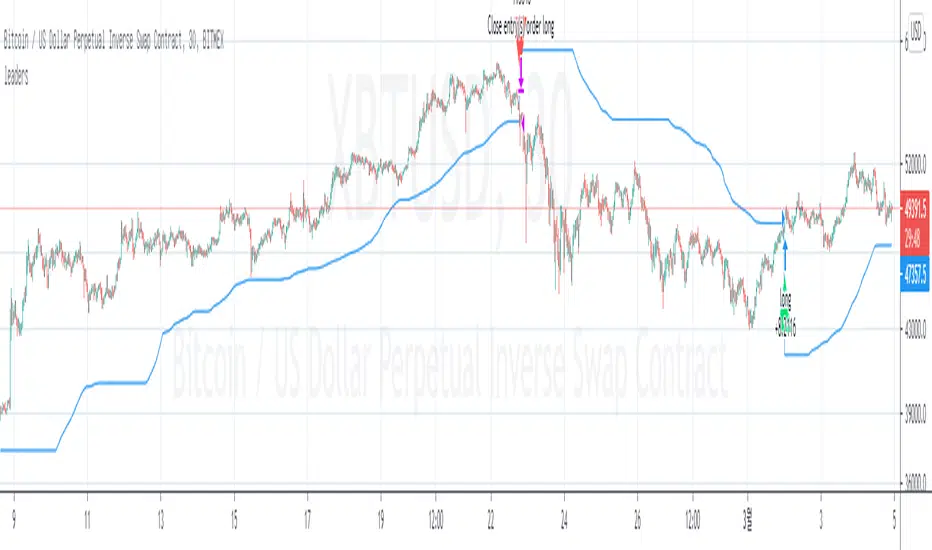
leadersIt is very similar to the index principle of the super trend.
the control is by length ( len ) and the deviation
there is alerts and signals
try to find best settings according to your needs
it can done in a different way as well
this one seems to work nice on stocks
Buy when breaking above the blue line, and liquidate when breaking below the blue line
NEO 5 min botThis bot design for Neo for 5 min chart
its a combination of low scanner (free script on my page) and linear regression and also pivots system
the buy system controlled by HTF , and also by the buy loss (short or long)
so lets say the bot go short but the trend is reversing upward, then by % that you choose you make it a buy so you do not miss the trade the same when your long is loosing then you buy it again at lower level by % you choose and by that you increase your chance for a better position of buy without pyramide
the sell system determine by Len and deviation and high time frame that control the pivot system
for any other assets it need to be optimise
I try to build a system that specific to each coin , so each bot design for a specif task or specific asset
so this bot work very weel on neo 5 min, it may not work well on others so be aware of it
use your money wisely when you buy or sell :)

The Profit Gate | Tier 1 Script | v1.0.0This script is used to optimized the trend of the stock based on volume , and many kind of moving average. You can use this to swing, or get the idea of long hold play. This work for Crypto as well as penny stock.
This script is best for Penny Stock, Big Cap, Crypto. It is generally based on the idea of averaging move of previous candles as well as current volume . This means if we have our candles at 15m, it will capture bunch of previous candles up to 10 years ahead to get an average move. This will give us a prediction of whether or not a stock will move up (Buy), or go down (Sell).
General Buy|Sell Tier 1
This script is used to optimized the trend of the stock based on volume , and many kind of moving average. You can use this to swing, or get the idea of long hold play. This work for Crypto as well as penny stock.
This script is best for Penny Stock, Big Cap, Crypto. It is generally based on the idea of averaging move of previous candles as well as current volume . This means if we have our candles at 15m, it will capture bunch of previous candles up to 10 years ahead to get an average move. This will give us a prediction of whether or not a stock will move up (Buy), or go down (Sell).
We also use Binary entropy function to optimize the original MACD .
This indicator should be able to tell you where to get in, out, or start to set trailing stop loss on the current position. I will constantly update this algorithm.
Trend analysis, This is ridge model that take in past data from the nearest certain number of candles then predict the next trend by an algorithm.
We also have standard deviation so we can apply it to find the best strike price with the highest probability to get ITM
Please DM me for access to this script

LTC 3-5 min scalperThis scalpler bot design for LTC and similar alts for 3-5 min chart
the scalper take profit at 1,2,3,4% exit at exit % which is our short
the buy system is modify low scaner (open script in indicator page)
plus HMA non repaint
I show in detail how to use this in my open script of low scanner strategy
there is filter that based on ema so our scalper only will buy on uptrend and less on down trend
there is leverage system if you want to use it
but you need to calculate risk reward and do your math on money magment if you use this system
So the logic here is to try to get lows and get out by the take profit and if we buy in uptrend then our chances for win will increase
you can try to change the take profit system to see if it improve this model or not
for different alts you may need to change setting
let me know if you have questions about this strategy

[Strategy] XBT Swing Trade StrategyThis is swing trade strategy for XBT trading.
Optimized for XBTUSD 4H.
I have developed about 20 years on IT field, and got several years of quant experience.
This indicator is never be repainted like other fake indicators.
A 2-day trial period is provided. (for testing the strategy with replay)
* description of setting factors
A factors
- A-Factor1: short term checking period
- A-Factor2: mid term checking period
- A-Factor3: long term checking period
B factors
- B-Factor1: determine detection of trend changing periods
- B-Factors2: strength on short trend changing
- B-Factors3: strength on long trend changing
The default setting is recommended, but it is also possible to optimize it by setting the details of the three category settings.
(Trade points of settings A, B factors are displayed in the transaction history to help tuning)
And supports limiting backtesting period for detailed backtesting.
* Note: Backtesting results do not guarantee future results.
* This indicator is an invite only indicator.
* If you want to use this indicator, contact with my information below.
