RSI Rising Crypto Trending StrategyThis is crypto and stock market trending strategy designed for long timeframes such as 4h+
From my tests it looks like it works better to trade crypto against crypto than trading against fiat.
Indicators used:
RSI for rising/falling of the trend
BB sidemarket
ROC sidemarket
Rules for entry
For long: RSI values are rising, and bb and roc tells us we are not in a sidemarket
For long: RSI values are falling, and bb and roc tells us we are not in a sidemarket
Rules for exit
We exit when we receive an opposite direction.
Cuation: Because this strategy uses no risk management, I recommend you takje care with it.
If you have any questions, let me know !
ค้นหาในสคริปต์สำหรับ "trend"

Rosebud Trend Backtest [DepthHouse]*Past Performance Does Not Guarantee Future Results*
*Strategy created for backtesting purposes only.
*Backtesting assesses the viability of a trading strategy or pricing model by discovering how it would have played out retrospectively using historical data.
* Please be sure to read all updates below as the information below could change with future updates.
Rosebud Trend Indicator uses complex range calculations to easily detect trend changes, critical support and resistance levels, and even aid in spotting reversals. The Critical Support & Resistance Zones are plotted via the red and green cloud. This cloud not only visually displays the expected trend direction but often acts as major support and resistance zones. The outer band measures the expected range in which the assets trade over longer periods of time.
The Rosebud Trend Backtest combines the calculations of the ATR Auto Oscillator & the Rosebud Trend Indicator to demonstrate backtest performance.
// Settings //
Users can switch the ‘ Trend Sensitivity ’ between ‘ Low ', ' Med ', and ‘ High ’ to increase or decrease the rate at which the cloud changes.
By altering the S/R Band Thickness users can furthermore increase or decrease the rate at which a trend changes by altering the thickness of the cloud. Default is .50 however this can be lowered if needed.
Bar colors are generated by a combination of Rosebuds primary function and our ATR AUTO Oscillator base functions. Users have 3 bar color options to select from: Simple, Complex, and Off.
Simple: Bars colors alternate between shades of red and green based on the trend direction and the ATR Auto strength. The stronger the shade, the stronger the trend.
Complex: This adds a few extra variables to the script which generates a more complex bar color display. Using this option, Rosebud will generate light red bars in a bull trend if downward movement is strong and vice versa in a bear trend. It also will generate a purple bar if the candle successfully closes above or below the Top & Bottom Range Bands; We call this a range break, and it could be an early sign of strong upward or downward movement.
Off: In case you like to keep things even simpler, this option hides all overlay bar colors.
ATR Options: Used for Light & Strong Entries/Exits // Bar Colors also based on these settings
ATR Smoothed Signal Option: Turns advance smoothing on or off. On will reduce signal noise, while Off could land you that perfect bottom signal with a lower success rate.
ATR Candlestick Length: Default factor for bar color and shape generation, the higher the number the fewer signals that will generate.
ATR Candlestick Smoothing: Default smoothing for the Candlestick Length
Signal Lookback: Adjust the factor at which Bull, Bear, Up, and Down. Lower this to 2 for more signals.
// ⇅ BackTest Settings ⇅ //
Short Trading: Option to see backtest results for both long and short positions. Default is Long Only.
Strategy Entry Options:
Trend Only: Positions are entered right as there is a cloud trend change.
Light Entry: This enters a trade as soon as there is a breakout or breakdown signal generated from the ATR settings.
Strong Entry: Multiple conditions must be met; Price action must be near the Trend Base and must receive either a bullish or bearish crossover in the oversold or overbought range of the ATR Settings.
Strategy Exit Options:
Trend Only: Exits all positions after there is a primary trend change.
Light Exit: Exits a user set percentage of open positions when the ATR generates a breakdown or breakout. Will continue to do this at each occurrence. Presets are built in to keep these from triggering too often in volatile conditions.
Strong Exit: Exits a user set percentage of open positions when the ATR generates a bullish or bearish crossover in the overbought or oversold ranges. Will continue to do this with each occurrence. Presets are built in to keep these from triggering too often in volatile conditions.
Profit Points: Exits a set percentage of the position up to 3 times at a user set percentage gap from the entry. Any remaining amount in the position exits upon a trend change.
Profit QTY Percent: Percent of the position to exit when an exit condition triggers. This does not apply to the “Trend Only” exit option.
Profit Percent Gap: Percent gap for Profit Point Exits. Recommend adjusting based on timeframe. See example below.

Ichimoku + RSI Crypto trending strategyThis is a crypto trending strategy designed for big timeframes such as 3-4h+.
Its components are:
RSI
ICHIMOKU full pack
Heikin Ashi candles for logic calculation inside
Rules for entry.
For long : we have a long cross condition on ichimoku and price is above the ichimoku lines, and at the same time RSI value is > 50.
For long : we have a short cross condition on ichimoku and price is below the ichimoku lines, and at the same time RSI value is < 50.
Rules for exit
We exit whenever we receive an opposite signal of the initial entry.
SInce this strategy is using no risk management inside, I recommend to be careful with it .
If you have any questions, let me know !

Maximized Scalping On Trend (by Coinrule)" The trend is your friend. " This is one of the most famous and valuable teachings that experienced traders can give to newbies. There is a reason for that.
No matter your views about where the price moves, what matters is where the price heads to . The market is always right, and ultimately it decides who gets the profit and who has to take a loss.
The purpose of this strategy is to spot when it's the most suitable time to buy an asset profiting from a potential short-term price increase. The strategy tends to open trades frequently, closing them on average in one and a half days.
ENTRY
The buy order is placed on assets that present strong momentum when it's more likely that it is about to increase further in the short term.
To capture momentum on the asset, the rule strategy requires:
the MA50 greater than the MA100
the RSI greater than 50
The rule, then, places the order when
The price crosses above the MA9.
EXIT
This strategy comes with a stop loss and a take profit which adapt dynamically to market conditions.
The trade is closed in profit when the RSI is greater than 70 , as the trend could experience a pull-back.
Alternatively, the trade is closed when the RSI is lower than 30 , being this a sign of weakening of the trend.
Pro tip : The 1-hour time frame has proven to return the best results on average. The strategy can also work well in the 15-min time frame if you want to increase the trades' frequency.
The strategy assumes each order to trade 30% of the available capital and opens a trade at a time. A trading fee of 0.1% is taken into account.

Wave Trend w/ VWMA overlayThis is a trend-following strategy and indicator which combines the Wave Trend Strategy (Lazy Bear) by thomas.gigure with the cRSI + Waves Strategy with VWMA overlay by Dr_Roboto .
You may update the parameters of the Wave Trend oscillator or the VWMA indicator to match your own preferences. You may also adjust the Base Quantity used for determining trade size (as described below) to suit your account size and risk tolerance.
The strategy identifies potential signals based on the on the Wave Trend oscillator, originally ported to TradingView by LazyBear. When a signal is produced by the Wave Trend oscillator, trade size is determined by the VWMA.
When the VWMA is trending against the direction of the Wave Trend signal, Base Quantity x 1 is used
When the VWMA is trending neutral, Base Quantity x 2 is used
When the VWMA is trending with the direction of the Wave Trend signal, Base Quantity x 4 is used
The strategy includes the ability to limit trade signals to certain defined periods of time ("Sessions") during the trading day and, optionally, to close any open position at the end of either or both "Sessions." This may be enabled/disabled via the Limit Signals to Trading Sessions? option on the "Inputs" tab of the strategy's "Settings" window.
If you are trading on a daily chart (or longer) you must disable the Limit Signals to Trading Sessions? in order for the strategy to produce signals.

[astropark] Trend Skywalker V1 [strategy]Dear Followers,
today another awesome Swing and Scalping Trading Strategy indicator: Trend Skywalker !
It shows a trend cloud that reacts very fast to price action, so it's perfect for trending markets: it helps a lot to find out
when a trend is going to end and a new is going to start
when to enter again within a trending market
where to put your stoploss
In this example below you can see the three points above:
In fact in a trending market it will highlight that:
price consolidation within the could is a trend weakening signal , so you can easily spot when a trend is going to end and a new is going to start
bullish/bearish trend cloud retests are nice opportunity to re-enter within a trending market, especially if cloud is thick
where to put your stoploss ( below the cloud and/or recent low in a buy scenario , above the cloud and/or recent high in a sell scenario )
This strategy/indicator has the following options:
change analysis window (the lower, the more reactive; the higher, the less reactive)
enable/disable signals on chart
enable/disable "more confirmations" signals filter
enable/disable bars and background coloring based on trend
enable/disable an automatic Trailing Stop strategy option (Automatic Stops)
enable/disable a peak profit tracker (the max percentage profit labels)
enable/disable highlights of trend cloud retests
enable/disable highlights of trend cloud price breakouts
Here below some examples how the indicator works on many markets and timeframe.
ETH/USD 4h
EUR/USD 15m
LTC/BTC 1h
This strategy only trigger 1 buy (where to start a long trade) or 1 sell (for short trade).
Keep in mind that proper risk management and money management strategies are very important to manage your trades (DM me if you need any clarification on these points).
This script will let you backtest the strategy performance over the backtesting period you set in input (it may be a lower period, depending on tradingview candles limitation related to your account).
The one for setting alarms can be found by searching for the astropark's "Trend Skywalker" and then choosing the indicator with "alarms" suffix in the name.
Strategy results are calculated on the time window from February 2018 to now, so about 3 years, using 10000$ as initial capital and working at 1x leverage (so no leverage at all! If you like to use leverage, be sure to use a safe option, like 2x or 3x at most in order to have liquidation price very far).
This is not the "Holy Grail", so use proper money and risk management strategies.
This is a premium indicator , so send me a private message in order to get access to this script.

MrBS:Directional Movement Index [Trend Friend Strategy]This goes with my MrBS:DMI+ indicator. I originally combined them into one, but then you cannot set alerts based on what the ADX and DMI is doing, only strategy alerts, so separate ones have more flexibility and uses.
Indicator Version is found under "MrBS:Directional Movement Index " ()
//// THE IDEA
The majority of profits made in the market come from trending markets. Of course there are strategies that would say otherwise but for the majority of people, THE TREND IS YOUR FRIEND (until the end). The idea is to follow the trend, entering once it has established its self and exiting positions when the trend weakens. This strategy gives a rough idea of the returns produced from following purely the ADX signals. At first Heikin Ashi values were used for the calculation but the results show it's not that effective. The functionality to switch between calculation types has been left in, so we can uses HA candle data to generate signals from while looking at an OHLC chart, if we want to experiment. Due to the way strategies work, we are unable to get reliable results when running the strategy on the HA chart even if we are calculating the signals from the real OHLC values. It is best to always run strategies on standard charts.
When using this strategy, I look for confirmation of the signal based on stochastic (14:3:6) direction, reversal level of stochastic, and divergance, to add confidence and adjust position size accordingly. I am going to try and code some version of that in future updates, if anyone can help or has suggestions please drop me a message.
//// INDICATOR DETAILS
- The default settings are for optimized Daily charts, for 4 hour I would suggest a smoothing of 2.
- The default values used for calculation are the Real OHLC, we can change this to Heikin Ashi in the menu.
- The strategy enters a position when ADX crosses the threshold level, and closes the position when ADX starts to fall.
- There is a signal filter in the form of a 377 period Hull Moving Average, which the price must be above or bellow for long and short positions respectively.
- The strategy closes the position when a cross-under of the ADX and its 4 period EMA. This is an attempt to stay into positions longer as sometimes the ADX will fall for 1 bar and then keep rising, while the overall trend is strong. The downside to this is that we exit trades later and this affects our max drawdown.

Pivot Sniper (Double RSI, Safe Zones, Divergence, Trend Sensor)Pivot Sniper establishes safe zones to trade at the top half or bottom half of the market using 1000 bar highest high and lowest low respectively. It makes entry decisions scanning for a special RSI pattern and then confirms using Divergence and whether it is above or below a moving average. It also has a trend sensor that avoid betting against long running trends.
Use on a 5 minute chart only. It needs this resolution to make it's decisions. It is designed for forex only.
If you would like access to try this script out post below or message me.
Thanks, Doug

EMA trend reversal strategy "muxie1" - 1.5x to 3xThis uses 2 EMA and Stop Loss and Take Profit,
The stops don't fire at the precise value but only when the trend reverses
it is actually good for 1D since 2019, it was however optimised for 1min but I am not able to share for 1m.
have equivalent code for quantum zone ftx
Great profit factor from 1.5x to 3x
Mandatory input is the position size per trade, tested with 1 btc for 100k virtual capital, remember to set it small for a low risk per trade, and even smaller if you use leverage,

Crypto Trend Following StrategyThis is the strategy script indicator of Crypto Trend Following Strategy which can be used for back testing. With study script indicator, strategy can be easily automated.
To set alerts, see Crypto Trend Following Study indicator.
Script is using several moving averages to keep you on the right side of the trend. Signals are also filtered based on other indicators to prevent buying already overbought or selling already oversold coins and avoid ranging markets.
MAIN GOAL
Main goal of the strategy is long-term stable profit. No strategy has 100% accuracy therefore there always will be some false signals. But patience pays, with Trend Following Strategy, you will get couple of small loses while waiting to get big wins when coin is trending strongly. As you never know the right time you must sustain and be in all trades to make sure that you will not miss the big move.
BACKTEST
This script is for free to play with so you can back test and see for yourself how the strategy performs on any of your favourite coins.
Strategy is optimized and back tested for USDT and BTC pairs on 6h timeframe but it can be used on any pair and any timeframe.
RISK & REWARD
Strategy does not use safety orders as DCAs usually leads to bag holding sooner or later. It does not use take profit either as strategy will tell you when to buy and when to sell based on the actual market condition.
You should always use stop loss to protect your account from drawdown or even being liquidated.
You can change stop loss or take profit as you like or even back test the strategy with your preferred settings to find what suits you best.
STRATEGY SETTINGS
You can use the strategy script for fine tuning and find best settings for yourself.
If you need any help with settings do not hesitate to ask. I would also appreciate any feedback and ideas how to improve the script.
==== Indicators settings ====
RSI Long < and StochRSI Long <
• used to filter out buy signals of already overbought coins - ( stoch ) RSI must be under set value to fire a BUY signal
RSI Short > and StochRSI Short >
• used to filter out sell signals of already oversold coins - ( stoch ) RSI must be over set value to fire a SELL signal
ADX >
• used to filter out buy or sell signals in ranging markets - ADX must be over set value to fire a BUY or SELL signal
MA Fast and Slow Length
• Two moving averages to indicate an actual short-term trend
Baseline Length & Type
• Baseline is a moving average which confirms the longer-term trend. You can set length and type of the moving average
==== Test period settings ====
• You can set the back tested window
==== Strategy settings =====
• Target Take profit and Stop loss in %
• Only LONG trades – tick if you do not want to calculate SHORT trades in the back test
• Plot key levels on chart – if you use stop loss and/or take profit, you can turn on levels of price to reach (yellow – bought price, red – stop loss – green - take profit)
Back test calculates with commission and fixed order size. You can change these settings on Properties Tab

SURE SHOT TREND IDENTIFIERSURE SHOT TREND IDENTIFIER (SSTI) - It keeps Traders on Trending Side of the Market
BELOW BASIC THINGS MUST KNOW BEFORE USING THIS TOOL
1. Priority One: Background should be GREEN for UP TREND and RED for DOWN TREND
2. Minimum 4 out of first 5 Signals MUST come from below list to take your position
1. UP TREND
i. Background GREEN
ii. Bottom GREEN Dot – Trading Point Alert to take position
iii. BIG GREEN UP Arrow – Indication for Bullish
iv. TOP GREEN Dots – Positive Trend Direction
v. Long Signal Message – with this combination, we can say it is confirmed trend
vi. Likely to Raise with Up Arrow Message – Optional, as this will trigger automatically when you get first 4 signals.
vii. More Buying Message – Optional, to give more strength to the Trend
2. DOWN TREND
i. Background RED
ii. Bottom RED Dot – Trading Point Alert to take position
iii. BIG RED DOWN Arrow – Indication for Bearish
iv. TOP RED Dots – Negative Trend Direction
v. Short Signal Message – with this combination, we can say it is confirmed trend
vi. Likely to Fall with Down Allow Message – Optional, as this will trigger automatically when you get first 4 signals.
vii. More Selling Message – Optional, to give more strength to the Trend
3. Lines with YELLOW color filling is CPR (Central Pivot Range)
1. It helps when to EXIT from the position
2. Small GREEN Dot Lines represents Resistance Levels with R1, R2, R3 and R4 Levels
3. Small RED Dot Lines represents Support Levels with S1, S2, S3 and S4 Levels
4. Very Important:
1. If background color and TOP Dots colors are different, then it will give you wrong indication, so please don’t take any position, wait to get both same color.
2. If TOP Dots are showing YELLOW color, then it will be sideways market, so wait to match background and TOP Dots colors. If already taken position, take the decision based on other conditions to continue or EXIT from the position.
3. Please take position only ON BEGINNING of the TREND, don’t take any position during MIDDLE of the TREND. You may end up with losses.
4. GREEN background but NO other 3 supportive indicator confirmation – Exit / Continue with existing position based on other conditions, but - No New Position
5. GREEN background will other 3 supportive indicators, but RED Dots on Top, then don’t take NEW Position or Don’t EXIT. Take decision based on other indicators.
6. RED background but NO other 3 supportive indicator confirmation – Exit / Continue with existing position based on other conditions, but - No New Position
7. Close Long Message at below of the Candle – EXIT / Cautious on existing position based on other conditions, but - No New Position
5. Decision Making to EXIT Positions from
1. UP TREND when you see any of the below alerts on GREEN background
i. Close Long Message
ii. More Selling Message
iii. DOWN Message
iv. BIG RED DOWN Arrow
v. CPR conditions
1. If Candle Touches R1/R2/R3/R4 and struggling to move ABOVE any of these levels, then EXIT from the position
2. If you are a conservative investor, best method is to EXIT after reaching 50% of any of the Lower to Upper Resistance Level. i.e from CPR R1 R2 R3 R4
3. If you are an aggressive investor, you can wait till it gives first 4 alerts to exit.
2. DOWN TREND when you see any of the below alerts on RED background
i. Close Short Message
ii. More Buying Message
iii. UP Message
iv. BIG GREEN UP Arrow
v. CPR conditions
1. If Candle Touches S1/S2/S3/S4 and struggling to move BELOW any of these levels, then EXIT from the position
2. If you are a conservative investor, best method is to EXIT after reaching 50% of any of the Upper to Lower Support Level. i.e from CPR S1 S2 S3 S4
3. If you are an aggressive investor, you can wait till it gives first 4 alerts to exit

[astropark] Trend Is Your Friend V3 [strategy]Dear Followers,
today another awesome Swing and Scalping Trading Strategy indicator, runnable on a bot , which works great on High Timeframes (1D is suggested) but also on lower ones (just write me in order to help you find correct settings) and even better on 1m Renko chart!
If you are a scalper, you will love suggested entries for fast profit. You can run it on 1h timeframe (below is not suggested, there is "no-trend" below 1h!) if you are used to scalp trading and close each trade whenever you feel happy (a proper trailing stop strategy is suggested anyway).
This is not an evolution of "Trend Is Your Friend V1" or V2 , but a twin sister or the "Trend Is Your Friend V1" indicator you can see here below
and twin sister or the "Trend Is Your Friend V2" indicator you can see here below
This strategy differs for the engine used as basis, but has the same usage settings:
enable/disable signals on chart
enable/disable showing trend cloud
enable/disable bar coloring based on trend
enable/disable background coloring based on trend
edit trend period length (direct message me in order to help you fine best settings)
edit a smart variant option to enhance the trend cloud on your chart
enable/disable an option to smart enter trade
This strategy only trigger 1 buy or 1 sell. In order to get notified when a signal is triggered, you need to use the "alarms" version of this indicator.
Strategy results are calculated on the timeframe from December 2012 to now, so on 8 years, using 10000$ as initial capital and working at 1x leverage (so no leverage at all! If you like to use leverage, be sure to use a safe option, like 3x or 5x at most in order to have liquidation price very far).
This is not the "Holy Grail", so use a proper risk management strategy.
This script will let you backtest how the indicator will perform on any chart you may test. Of course results will be very different depending on the chart and timeframe you will open. I tested a lot of charts and always you can find a combination that keep this strategy in profit on swing trading style (and this means that if you can have a daily look at the chart you can always manage to maximize your profit on each trade!)
The alarms version of this indicator, which will let you set all notifications you may need in order to be alerted on each triggered signals, can be found by searching for the astropark's "trend is your friend v3" and then choosing the indicator with "alarms" suffix in the name.
This is a premium indicator , so send me a private message in order to get access to this script.

[astropark] Trend Is Your Friend V1 [strategy]Dear Followers,
today another awesome Swing and Scalping Trading Strategy indicator, runnable on a bot , which works great on High Timeframes (1D is suggested) but also on lower ones (just write me in order to help you find correct settings) and even better on 1m Renko chart!
If you are a scalper, you will love suggested entries for fast profit. You can run it on 1h timeframe (below is not suggested, there is "no-trend" below 1h!) if you are used to scalp trading and close each trade whenever you feel happy (a proper trailing stop strategy is suggested anyway).
This strategy let's you edit following settings:
enable/disable signals on chart
enable/disable showing trend cloud
enable/disable bar coloring based on trend
enable/disable background coloring based on trend
enable a special option to enhance trend cloud on FOREX/Stocks charts (optional)
edit trend period length (you have to increase it if you go on lower timeframes, like 1h)
This strategy only trigger 1 buy or 1 sell. In order to get notified when a signal is triggered, you need to use the "alarms" version of this indicator.
Strategy results are calculated on the timeframe from August 2017 to now, so on almost 2 years and half, using 10000$ as initial capital and working at 1x leverage (so no leverage at all! If you like to use leverage, be sure to use a safe option, like 3x or 5x at most in order to have liquidation price very far).
This is not the "Holy Grail", so use a proper risk management strategy.
This script will let you backtest how the indicator will perform on any chart you may test. Of course results will be very different depending on the chart and timeframe you will open. I tested a lot of charts and always you can find a combination that keep this strategy in profit on swing trading style (and this means that if you can have a daily look at the chart you can always manage to maximize your profit on each trade!)
The alarms version of this indicator, which will let you set all notifications you may need in order to be alerted on each triggered signals, can be found by searching for the astropark's "trend is your friend" and then choosing the indicator with "alarms" suffix in the name.
This is a premium indicator , so send me a private message in order to get access to this script.

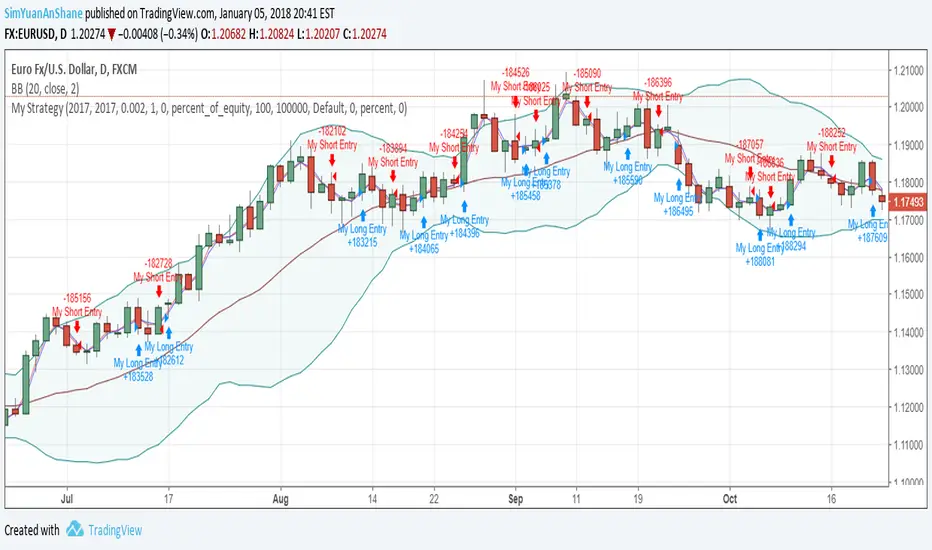
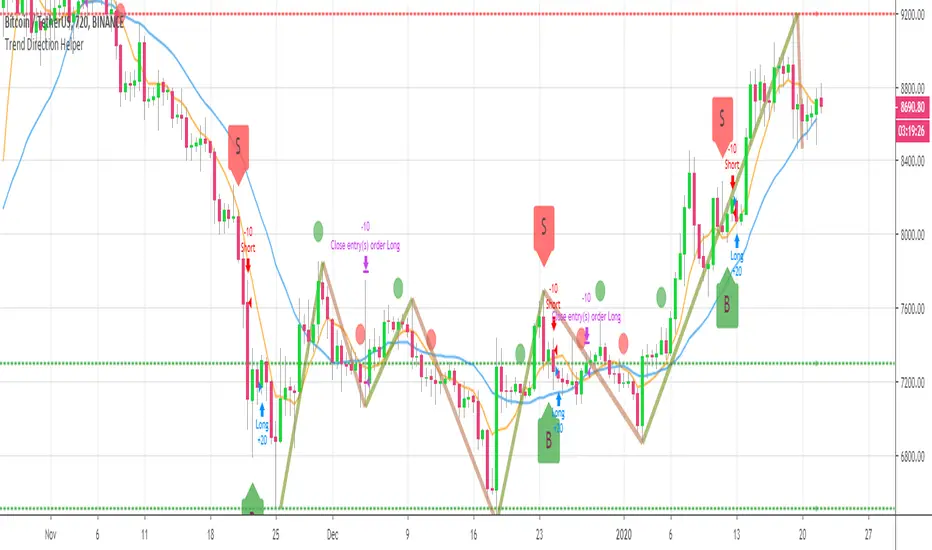
BEST Trend Direction Helper (Strategy Edition)Hello traders
A follower asked me to convert my Trend Direction Helper into a strategy
So blessed this indicator reached the 1400+ likes milestone - I can't believe how many people are trading with it
I based the setup as follow:
- Entries on those green/red labels
- exit whenever a Simple Moving Averages cross in the opposite direction happen
- possibility to filter only Longs/Shorts or both
Also...
The strategy includes the Zig Zag/Pivots high/low and other options from the indicator version. I only added a quick strategy component with a hard exit concept based on SMA cross
All the best fam and... HAPPY NEW YEAR !!!!!!!!!!!
Dave
Total Trend Follow Strategy with Pyramid and DCA
Introduction
This is a Pine 4 trend following strategy. It has a twin study with several alerts. The design intent is to produce a commercial grade signal generator that can be adapted to any symbol and interval. Ideally, the script is reliable enough to be the basis of an automated trading system web-hooked to a server with API access to crypto, forex and stock brokerages. The strategy can be run in three different modes: long, short and bidirectional.
As a trend following strategy, the behavior of the script is to buy on strength and sell on weakness. As such the trade orders maintain its directional bias according to price pressure. What you will see on the chart is long positions on the left side of the mountain and short on the right. Long and short positions are not intermingled as long as there exists a detectable trend. This is extremely beneficial feature in long running bull or bear markets. The script uses multiple setups to avoid the situation where you got in on the trend, took a small profit but couldn’t get back in because the logic is waiting for a pullback or some other intricate condition.
Deep draw-downs are a characteristic of trend following systems and this system is no different. However, this script makes use of the TradingView pyramid feature accessible from the properties tab. Additional trades can be placed in the draw-down space increasing the position size and thereby increasing the profit or loss when the position finally closes. Each individual add on trade increases its order size as a multiple of its pyramid level. This makes it easy to comply with NFA FIFO Rule 2-43(b) if the trades are executed here in America. The inputs dialog box contains various settings to adjust where the add on trades show up, under what circumstances and how frequent if at all. Please be advised that pyramiding is an advanced feature and can wipe out your account capital if your not careful. During the backtest use modest setting with realistic capital until you discover what you think you can handle.
In addition to pyramiding this script employs DCA which enables users to experiment with loss recovery techniques. This is another advanced feature which can increase the order size on new trades in response to stopped out or winning streak trades. The script keeps track of debt incurred from losing trades. When the debt is recovered the order size returns to the base amount specified in the TV properties tab. The inputs for this feature include a limiter to prevent your account from depleting capital during runaway markets. The main difference between DCA and pyramids is that this implementation of DCA applies to new trades while pyramids affect open positions. DCA is a popular feature in crypto trading but can leave you with large “bags” if your not careful. In other markets, especially margin trading, you’ll need a well funded account and much experience.
Consecutive loss limit can be set to report a breach of the threshold value. Every stop hit beyond this limit will be reported on a version 4 label above the bar where the stop is hit. Use the location of the labels along with the summary report tally to improve the adaptability of system. Don’t simply fit the chart. A good trading system should adapt to ever changing market conditions. On the study version the consecutive loss limit can be used to halt live trading on the broker side (Managed manually).
Design
This script uses nine indicators on two time frames. The chart (primary) interval and one higher time frame which is based on the primary. The higher time frame identifies the trend for which the primary will trade. I’ve tried to keep the higher time frame around five times greater than the primary. The original trading algorithms are a port from a much larger program on another trading platform. I’ve converted some of the statistical functions to use standard indicators available on TradingView. The setups make heavy use of the Hull Moving Average in conjunction with EMAs that form the Bill Williams Alligator as described in his book “New Trading Dimensions” Chapter 3. Lag between the Hull and the EMAs form the basis of the entry and exit points. The alligator itself is used to identify the trend main body.
The entire script is around 1700 lines of Pine code which is the maximum incidental size given the TradingView limits: local scopes, run-time duration and compile time. I’ve been working on this script for over a year and have tested it on various instruments stocks, forex and crypto. It performs well on higher liquidity markets that have at least a year of historical data. Though it can be configured to work on any interval between 5 minutes and 1 day, trend trading is generally a longer term paradigm. For day trading the 10 to 15 minute interval will allow you to catch momentum breakouts. For intraweek trades 30 minutes to 1 hour should give you a trade every other a day. Four hours and above are for seasoned deep pocket traders. Originally, this script contained both range trading and trend following logic but had to be broken into separate scripts due to the aforementioned limitations.
Inputs to the script use cone centric measurements in effort to avoid exposing adjustments to the various internal indicators. The goal was to keep the inputs relevant to the actual trade entry and exit locations as opposed to a series of MA input values and the like. As a result the strategy exposes over 50 inputs grouped into long or short sections. Inputs are available for the usual minimum profit and stop-loss as well as safeguards, trade frequency, DCA, modes, presets, reports and lots of calibrations. The inputs are numerous, I’m aware. Unfortunately, at this time, TradingView does not offer any other method to get data in the script. The usual initialization files such as cnf, cfg, ini, json and xml files are currently unsupported.
Example configurations for various instruments along with a detailed PDF user manual is available.
Indicator Repainting And Anomalies
Indicator repainting is an industry wide problem which mainly occurs when you mix backtest data with real-time data. It doesn't matter which platform you use some form of this condition will manifest itself on your chart over time. The critical aspect being whether live trades on your broker’s account continue to match your TradingView study. Since this trading system is featured as two separate scripts, indicator repainting is addressed in the study version. The strategy (this script) is intended to be used on historical data to determine the appropriate trading inputs to apply in the study. As such, the higher time frame of this strategy will indeed repaint. Please do not attempt to trade from the strategy. Please see the study version for more information.
One issue that comes up when comparing the strategy with the study is that the strategy trades show on the chart one bar later than the study. This problem is due to the fact that “strategy.entry()” and “strategy_exit()” do not execute on the same bar called. The study, on the other hand, has no such limitation since there are no position routines. However, alerts that are subsequently fired off when triggered in the study are dispatched from the TradingView servers one bar later from the study plot. Therefore the alert you actually receive on your cell phone matches the strategy plot but is one bar later than the study plot. A lot can happen in four hours if you are trading off a 240 bar.
Please be aware that the data source matters. Cryptocurrency has no central tick repository so each exchange supplies TradingView its feed. Even though it is the same symbol the quality of the data and subsequently the bars that are supplied to the chart varies with the exchange. This script will absolutely produce different results on different data feeds of the same symbol. Be sure to backtest this script on the same data you intend to receive alerts for. Any example settings I share with you will always have the exchange name used to generate the test results.
Usage
The following steps provide a very brief set of instructions that will get you started but will most certainly not produce the best backtest. A trading system that you are willing to risk your hard earned capital will require a well crafted configuration that involves time, expertise and clearly defined goals. As previously mentioned, I have several example configs that I use for my own trading that I can share with you along with a PDF which describes each input in detail. To get hands on experience in setting up your own symbol from scratch please follow the steps below.
The input dialog box contains over 50 inputs separated into seven sections. Each section is identified as such with a makeshift separator input. There are three main areas that must to be configured: long side, short side and settings that apply to both. The rest of the inputs apply to pyramids, DCA, reporting and calibrations. The following steps address these three main areas only. You will need to get your backtest in the black before moving on to the more advanced features
Step 1. Setup the Base currency and order size in the properties tab.
Step 2. Select the calculation presets in the Instrument Type field.
Step 3. Select “No Trade” in the Trading Mode field.
Step 4. Select the Histogram indicator from section 3. You will be experimenting with different ones so it doesn’t matter which one you try first.
Step 5. Turn on Show Markers in Section 3.
Step 6. Go to the chart and checkout where the markers show up. Blue is up and red is down. Long trades show up along the blue markers and short trades on the red.
Step 7. Make adjustments to Base To Vertex and Vertex To Base net change and roc in section 3. Use these fields to move the markers to where you want trades to be. Blue is long and red is short.
Step 8. Try a different indicator from section 3 and repeat Step 7 until you find the best match for this instrument on this interval. This step is complete when the Vertex settings and indicator combination produce the most favorable results.
Step 9. Turn off Show Markers in Section 3.
Step 10. Enable the Symmetrical and Deviation calculation models at the top of section 5 and 6 (Symmetrical, Deviation).
Step 11. Put in your Minimum Profit and Stop Loss in the first section. This is in pips or currency basis points (chart right side scale)
Step 12. Return to step 3 and select a Trading Mode (Long, Short, BiDir, Flip Flop). If you are planning to trade bidirectionally its best to configure long first then short. Combine them with BiDir or Flip Flop after setting up both sides of the trade individually.
Step 13. Trades should be showing on the chart.
Step 14. Make adjustments to the Vertex fields in section 3 until the TradingView performance report is showing a profit.
Step 15. Change indicators and repeat step 14. Pick the best indicator.
Step 16. Use the check boxes in sections 5 and 6 to improve the performance of each side.
Step 17. Try adding the Correlation calculation model to either side. This model can sometimes produce a negative result but can be improved by enabling “Adhere To Markers” or “Narrow Correlation Scope” in the sections 5 and 6.
Step 18. Enable the reporting conditions in section 7. Look for long runs of consecutive losses or high debt sequences. These are indications that your trading system cannot withstand sudden changes in market sentiment.
Step 19. Examine the chart and see that trades are being placed in accordance with your desired trading model.
Step 20. Apply the backtest settings to the study version and perform forward testing.
This script is open for beta testing. After successful beta test it will become a commercial application available by subscription only. I’ve invested quite a lot of time and effort into making this the best possible signal generator for all of the instruments I intend to trade. I certainly welcome any suggestions for improvements. Thank you all in advance.
Histogram Trends Strategy by SedkurThis gives to you buy-sell signal with MACD's histogram trends.
Use "Fast and Slow length" and "Trend of Histogram Number" inputs to take less or more signal.
"Trend of Histogram Number" : This means how many histogram bars the trend continues before trading.

Hucklekiwi Pip - HLHB Trend-Catcher SystemThe strategy was authored by Hucklekiwi Pip back in 2015 and is still being updated today. She says that the system was designed to simply catch short-term forex trends. At its heart, the system is a simple EMA crossover strategy with a couple of other indicators used for confirming entries.
Strategy Rules
See her original post here:
www.babypips.com
Be sure to check out the updates and tweaks over the years!
HOW TO USE
For full information on how to use this strategy and how to correctly set the exit time, see this post:
backtest-rookies.com

TREND PROTECTTrading system developed for protecting grid trading or gamma short positions or for taking advantage of a rise of the BTC protecting from crashes.
It is in forward test without changing the parameters since April 2018.

cryptomars 1.0 signal Concussion trend
Description:
1. In the indicator, there is an orange signal that fluctuates linearly. It is a buy signal when it goes from bottom to top. When the signal line remains in the upper position, it indicates a multi-party trend.
2. When it goes from top to bottom, it indicates a sell signal. When the signal line remains below, it indicates a sales trend.
3. Depending on the time level, when the position of the signal line changes, determine whether the current candle is completed or not according to the time level of the chart you selected to determine the signal. For example, if you select a chart level of 5 meters, then when the signal line changes, for example, it will send a sell signal from top to bottom. At this time, please do not rush to sell. You should wait for this 5 meter candlestick to complete. When the candle is over and the next candle is started, if the signal line remains in the top-down form, the sell signal is normal and you can sell it.
Because the position of the signal appears, it is the location of the sale. During the completion of the candlestick , the signal may disappear after disappearing. We only have to wait for a while to get a more stable deal.
4. The alarm setting is very simple. There are two lines in the indicator. One is the orange signal line that fluctuates up and down, and the other is the fixed zero line of “zero”.
We set it in the alarm. When the signal line passes "zero" from the top, the short signal is sent only when the candle map is completed. When the signal line passes "zero" from "up" below, the signal is sent for a long time when the candlestick is completed.
One trick, the appearance of the signal, is that the price runs in one direction for a while, so it appears at or near the bottom. Because, when we have already made a profit in the transaction, we can make a profit in advance, and we do not need to wait for the opposite signal to stop the profit and reduce the risk of profit retracement.
Because in this market, the fluctuations are very large, and the people who compete are also very fierce. What we need to do is to make every transaction as possible, and we are all profitable. If we sell and find that the price is still rising, please don't feel sorry, don't consider eating all the profits.
6. When the signal appears, in most cases, even in the impact trend, it will still run a distance in the direction of the signal, that is, you will profit, so please close the position and make a profit in time. Otherwise, when the price volatility is too small, you miss the profit point, the price starts to run in the opposite direction, and you may change from profit to loss.
BITMEX's trailing stop loss is a great feature, please use it flexibly.
7, if it is a shock trend, please try not to trade.
8. We recommend that you turn on the “cryptomars 3.0” and “cryptomars 2.0” indicators. No matter who signs the trade first, you can trade, which can help you get more profit.
9. Remember, I hope this indicator will be your powerful assistant, but please don't rely on it completely. Learning more trading knowledge and skills is even more important. Therefore, when we consider the profitable position, you can use your trading skills, MACD , KDJ, etc. to assist and profit in a more suitable position.

Prometheus Trend SurferPrometheus Trend Surfer is a strategy built to follow trends and make the best use of it by giving you long and short entries.
It works on all time frames and has a tight tolerance for non-profitable entries so you won’t get stuck in losing positions.
Gives you an option to set trend length so you can fit it to your style of trading.
You also have the option to backtest from the date you set in the options dialog.
Instructions
1. Load the script
2. Use Heikin-Ashi candles
Did we get your attention? If you wish to buy our script, shoot us a PM.
We are not analysts, investment advisors or anything of that sort. Everything that we provide with this script is purely for guidance, informational and educational purposes. All information contained herein should be independently verified and confirmed. We do not accept any liability for any loss or damage whatsoever caused in reliancee upon such information or services. Please be aware of the risks involved with any trading done in any financial market. Do not trade with money that you cannot afford to lose. When in doubt, you should consult a qualified financial advisor before making any investment decisions.

SHK Trend Strategy v1SHK Trend Strategy uses a combination of indicators to determine trends and place orders.
Some important notes:
- SHKTrend performs better on longer time frames (+3H, 4H, Daily, ...)
- This strategy is suited for trending markets
- Play with the parameters and find the best configuration for your chart.
- And one more thing: I HATE REPAINTING . So be 100% sure, it doesn't repaint pessimistic guys.
glad to see your comments below :)

EAG Trend FinderHi all,
this strategy is made for trend following and the volatility of cryptocurrencies.
Mainly for the 4H BTC chart even though it does work for alt coins but I haven't tested it on those yet.
This is a hands-on strategy, it doesn't give buy and sell signals without you doing some charting of yourself, try to define trends and use this strategy to find confirmation.
ignore the backtesting data since I made this for the past year and specific scenarios but couldn't figure out how to limit backtesting data so I ignored panel for this strategy.
Hands-on strategy!
Go long ( green boxes ) during up trends and short during down trends(blue boxes), sideways movement is the Achilles heel of this strategy and for that reason, it is important to try and filter the sideways movements as much as you can.
As always,
Happy Hunting!
Still a work in progress!

Trend following with HAThis is my first script and it is basically a MA crossover/under strategy that uses heikin ashi closing prices. I've also used limit orders based on HA opening prices of the previous day for entry which improves the performance. However, this impose a restriction when prices are moving too fast and the algo is unable to enter the trade, resulting in a bad position for a long period, which I believe is preventing this strategy from performing better. Will appreciate any comments/ suggestions to improve this (such as enter market prices the next day when failed to enter on HA price - not sure if this is possible) as I'm still starting out and will be more than happy to learn from the community here. Cheers!