Poster Trend AnalysisThis trend analysis indicator is an idea from:
Stocks & Commodities V. 40:03 (8–12): Intraday Patterns Of Price Change by Richard Poster, PhD
We decide an uptrend or downtrend is in play, if there are certain percentage of bars across N bars where the direction is the same. The default settings use what the article says, 66% of adjacent 15 bars must be in the same direction, to be trending. While the article isn't precise about what up or down bars mean, this indicator assumes an up direction if close is greater than the open.
The indicator also allows differing configurations for up and downtrend analysis, though the defaults, as per the article, are the same.
ค้นหาในสคริปต์สำหรับ "trend"
Volatility Percentile🎲 Volatility is an important measure to be included in trading plan and strategy. Strategies have varied outcome based on volatility of the instruments in hand.
For example,
🚩 Trend following strategies work better on low volatility instruments and reversal patterns work better in high volatility instruments. It is also important for us to understand the median volatility of an instrument before applying particular strategy strategy on them.
🚩 Different instrument will have different volatility range. For instance crypto currencies have higher volatility whereas major currency pairs have lower volatility with respect to their price. It is also important for us to understand if the current volatility of the instrument is relatively higher or lower based on the historical values.
This indicator is created to study and understand more about volatility of the instruments.
⬜ Process
▶ Volatility metric used here is ATR as percentage of price. Other things such as bollinger bandwidth etc can also be used with few changes.
▶ We use array based counters to count ATR values in different range. For example, if we are measuring ATR range based on precision 2, we will use array containing 10000 values all initially set to 0 which act as 10000 buckets to hold counters of different range. But, based on the ATR percentage range, they will be incremented. Let's say, if atr percent is 2, then 200th element of the array is increased by 1.
▶ When we do this for every bar, we have array of counters which has the division on how many bars had what range of atr percent.
▶ Using this array, we can calculate how many bars had atr percent more than current value, how many had less than current value, and how many bars in history has same atr percent as current value.
▶ With these information, we can calculate the percentile of atr percentage value. We can also plot a detailed table mentioning what percentile each range map to.
⬜ Settings
▶ ATR Parameters - this include Moving average type and Length for atr calculation.
▶ Rounding type refers to rounding ATR percentage value before we put into certain bucket. For example, if ATR percentage 2.7, round or ceil will make it 3, whereas floor will make it 2 which may fall into different buckets based on the precision selected.
▶ Precision refers to how much detailed the range should be. If precision set to 0, then we get array of 100 to collect the range where each value will represent a range of 1%. Similarly precision of 1 will lead to array of 1000 with each item representing range of 0.1. Default value used is 2 which is also the max precision possible in this script. This means, we use array of 10000 to track the range and percentile of the ATR.
▶ Display Settings - Inverse when applied track percentile with respect to lowest value of ATR instead of high. By default this is set to false. Other two options allow users to enable stats table. When detailed stats are enabled, ATR Percentile as plot is hidden.
▶ Table Settings - Allows users to select set size and coloring options.
▶ Indicator Time Window - Allow users to select particular timeframe instead of all available bars to run the study. By default windows are disabled. Users can chose start and end time individually.
Indicator display components can be described as below:
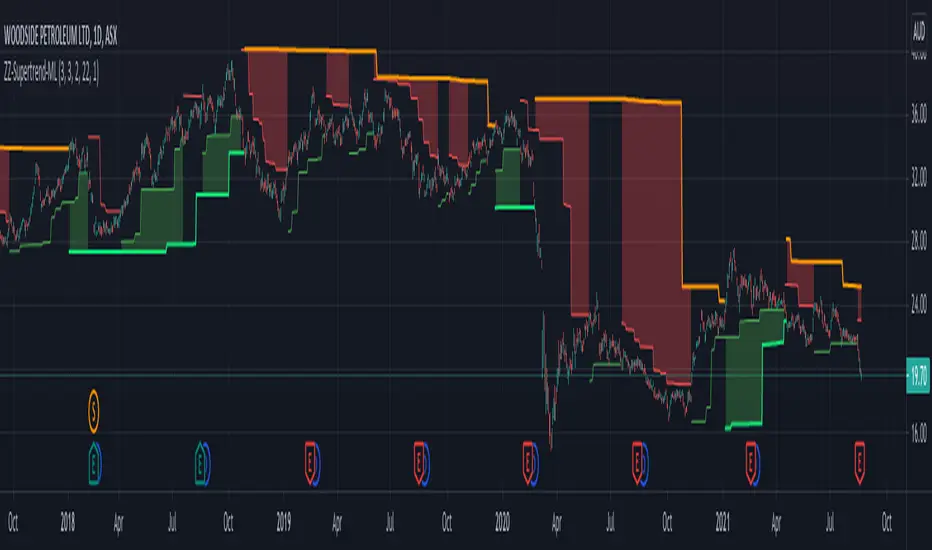
ALMA TrendlineThis is a simple indicator to make ALMA Trendline to be used as STOP LOSS guidance in trending market. The trendline will change color from GREEN to RED and vice versa once price crossing down or crossing up the trendline.
Currency Strength Meter [HeWhoMustNotBeNamed]⬜ Note: This is not the strength of currency pairs. But, in this script we are trying to derive strength of individual currencies by matching against single base currency.
⬜ Process
This is based on similar concept as that of Magic Numbers for stocks. Idea is simple.
▶ Calculate strength of each currency against USD. Derive the strength for both price movement and volume movement.
▶ Similarly calculate momentum of price and volume change.
▶ If USD is base currency, inverse momentum and strength index for the given symbol.
▶ Once these calculations are done, rank each currencies based on individual score on given things.
▶ Add up all the ranks to derive combined rank
▶ sort the currencies in the ascending order of overall rank.
⬜ USAGE
▶ Identify a base currency. In our case, we have used USD as base currency as it is easy to get pairs of all currencies with USD.
▶ Identify most used combos for all other currencies which are paired with USD. Fx pair can either have USD as base currency or quote currency. It is desirable to use the pair which is most traded. For example, USDJPY is more traded pair than JPYUSD - hence it is advisable to use USDJPY instead of JPYUSD. Similarly AUDUSD is more traded than USDAUD - hence choosing AUDUSD for the purpose of this exercise is better approach. Notice that USDJPY has USD as base currency whereas AUDUSD has USD as quote currency. These calculations are handled internally to derive the right outcome irrespective of position of USD in the pair.
▶ Identify the forex broker which has all the selected forex tickers. All comparison is done against a single broker. Hence, choosing broker which does not wide range of forex pairs will show NAN for many rows.
▶ Once we set these, we get tabular output containing strength and oscillator based trend indexes for both price and volume indicator. Currencies are ordered in descending order of strength. Hence, top of the list can be considered as currency having highest strength and bottom of the table can be considered as currency having lowest strength. Please note that the calculation is valid only for selected timeframe and users can set other parameters such as moving average type, oscillator type, length etc which can alter the outcome.
▶ Use multiple timeframes to find out stronger and weaker currencies. Use directional indicators to understand where they are heading. Combine all these info to come up with currency pair you would like to trade :)
⬜ Settings
▶ Main settings and Currencies
Base Currency : This is set to USD by default as rest of the tickers used are paired with USD. Whatever the base currency is selected, rest of the tickers should follow the same combination.
Timeframe : Timeframe for which rankings need to be calculated.
Currencies : These should be the currency pair which involve base currency defined in the setting on either side.
▶ Display
Table : Allows users to set table location and size of the table. By default this is set to middle center and default size is normal. If user want to use multiple timeframes side by side, they can do so by changing these display settings.
Stat Type : To show either comparative ranking or actual indicator values
Inverse Divergence [HeWhoMustNotBeNamed]Experimental.
In regular scenario divergence calculation follows these procedure
Pivots on price are considered as primary source
They are compared with pivots on oscillators
Trend bias of price is used
This is an experimental version where
Pivots on oscillators are considered as primary source
They are compared with pivots on price
Trend bias of oscillator is used. Using percentrank to define oscillator trend
Caution: Not meant for trading :)
Multilevel ZigZag SupertrendVery much similar to :
I have slightly changed code to accommodate multiple zigzags. Also removed possibility of external source to keep it simple.
Indicator shows 2 Level zigzag based supertrends. Second zigzag used is multi level zigzag and hence, this acts as higher timeframe filter and can be considered as overall trend bias.
Strategy TemplateTrying to include few basic things which is needed for strategy which can be used as template.
Few important components
Strategy parameters
Few important parameters include - initial_capital, default_qty_type, default_qty_value, commission_type, pyramiding and commission_value. All my strategies will have similar settings with initial captial set to 20000 to 100000. 100% of equity per trade with no pyramiding (set to 1) and minimal commission.
margin_long and margin_short can be used for leveraged trading. But, since we are not using pyramiding, it will make no effect.
Trade Limiting parameters
Two types of limiting is available in the scripts
Limiting trading direction : this is done through method strategy.risk.allow_entry_in and input parameter tradeDirection
Limiting trades to particular time window : This is achieved through adding start time and end time parameters of type input.time and check whether time is within this window
Custom Methods
customized security method to get higher timeframe data
customized moving average method to get moving average of any type
Custom Parameters
Moving average Type option list which I use quite often. Any strategy where there is need to use moving average, I try to scan through different moving average types and lengths to see which one is more appropriate for the given strategy. Hence, keeping this parameter in template to make it readily available when I start with new strategy
waitForCloseBeforeExit - this is used if trailing stop need to activated as soon as price hits the stop or only on close price. This is again something I switch quite often based on strategy. Hence, keeping this as part of the template.
Entry and Exit statements for long and short
These statements from line (57 to 62) can remain as is even with new strategy. Only thing to be set are variables - buyCondition, sellCondition, closeBuyCondition and closeSellCondition
Last but not the least
In pinescript, a long and short position cannot coexist in a strategy at any point of time. Any short positions created will automatically stop long positions and vice versa. Hence, it is important make short and long trades mutually exclusive. In this example, I have used 200 weekly moving average as trend bias. No short positions are taken when price is trading above 200 weekly moving average low/close and no long positions are taken when price is less than 200 weekly moving average high/close. Any rule built on top of this (In this case a simple supertrend rules) ensures that there are no conflicting signals and hence avoids confusing trades on the stratgy.
Price Adjusted ADX Trend IdentifierUsed to identify trend by applying advance decline formula directly to price action. The result is smoothed activity that incorporates trend strength so that minor pullbacks and consolidation that result from large moves do not cloud the overall trend of the chart. Also sideways action will identify the end of a trend sooner by incorporating the shrinking advance decline activity into price action.
The value is less important than the trend identification against the shown imbedded Bollinger band.
The script allows for advance decline length to be adjusted. Set at 2. Longer will be less reactive shorter will be more reactive.
I have not traded this indicator but it may be useful in identifying smoother trends. Possibly using the cross of the ADX line against the Bollinger upper/lower/mid lines.
Enjoy.
ZigZag SupertrendBack to my favourite supertrend. But, this time on the basis of zigzag pivots.
This is similar to forming supertrend based on pivot high lows - but instead of using pivot poitns, we are using zigzag pivots here.
Zigzag is derived using the same method as this script:
But, have removed labels and display options of zigzag. Older lines are also immediately deleted so that it can work well in lower timeframes without any error. Number of zigzaglines to be kept in memory depends on the parameter History
WaitForConfirmation option when selected only considers the confirmed zigzaglines and will ignore present zigzag line which is forming. This is not going to make much difference as the present zigzag line will be always opposite to low or high it formed and hence will not affect the stop loss levels or reversals.
WaitForClose is for supertrend determination. When checked uses close prices. If unchecked uses highs and lows for supertrend direction update.
ATR parameters allow you to set an adjustment below pivot high lows. This is required because support and resistence are often zones rather than single point. Hence, adds bit more wiggle room for trend continuation and delays frequent reversals on pullbacks.
Multitimeframe Pivot HiLoPivot High/Low for multi timeframes.
Could be great entry filter to include multi time frame pivots in trend trading strategies.
MA Strength StrategyThis is based on Aligned Moving Average Index published earlier:
But, instead of scoring trend based on how many moving averages are aligned, we are considering upside score. Higher scores are assigned for slower moving averages and lower scores for faster moving averages to give more stress to long term trend.
Buy/Sell conditions are based on moving average crossover on the upside score sum of Loopback days.
This is a very rough idea which seems to have been working ok on long only trades. Can be further improved.
TrendRangeIdentifier V3This is non-overlay version of
Since, we plot trend value which keeps incrementing/decrementing upon every step, this also helps us in identifying strength of trend and how long the trend is going on.
Other changes:
Removed display of channels
Coloring candles made optional
Supertrend - Delayed TrailI use supertrend for for trailing stops. One of the problem of trailing stops in long term trend trading is we get stopped too early and then trend continues. To avoid this problem, we can limit or delay our trailing.
In this modified version of supertrend, we can delay trailing by two methods:
Bars : Trail after certain bars. Input DelayBars says after how many bars it should trail.
Steps : Trail after reaching equivalent stop on the other side.
ConsiderWicks option reverse direction upon high reaching trailing Sell stop or low reaching trailing buy stop (instead of close)
ConsiderWicksForDelayByStep does the same thing for calculating if the steps have reached.
DMI & ADX Trend indicator - colour coded DMI and ADX plotted on an indicator. ADX histogram is colored when above value of 20 and rising when aligned with trend direction as defined by DMI criteria. (Green=Bullish & trending / Red=Bearish & trending)
Tori TrendlinesBasic script to plot trendlines according to the basic rules following Tori Trades strategy. This is a work in progress so please let me know if you find any issues with this.
TQ Gold Trend (Macro Regime)This indicator answers one question only:
Is gold in a monetary uptrend right now?
It does not:
Forecast prices
Time entries
Use momentum or volatility
It simply classifies the macro trend regime of gold.
3️⃣ Logic (Simple, Explicit)
Timeframe: Weekly
Indicator: 30-week Simple Moving Average
Interpretation:
Bullish: Price above a rising 30W SMA
Bearish: Price below a falling 30W SMA
Neutral: Everything else (transition / range)
This is classic macro trend / stage analysis, adapted for gold as a monetary asset.
4️⃣ How to Use It (User Instructions)
How to read the chart
>If Gold is Bull, precious metals matter.
>If Gold is Bear, ignore silver and miners.
>If Gold is Neutral, wait — no edge.
Best use
Check once per week
Use as the first filter before looking at:
Gold/DXY
Gold/SPY
Silver/Gold
Recommended timeframe
Weekly only (designed for macro regimes, not trading)
Weekly macro trend indicator for gold using a 30-week SMAWhat this indicator does
This indicator identifies the macro trend regime of gold using a simple, time-tested framework: the weekly price of gold relative to its 30-week simple moving average.
It is designed to answer one question only:
Is gold currently in a monetary uptrend?
How it works
The indicator uses weekly data and applies a 30-week SMA regime filter:
Bullish (Monetary Uptrend):
Gold price is above a rising 30-week SMA.
Bearish (Monetary Downtrend):
Gold price is below a falling 30-week SMA.
Neutral (Transition):
All other conditions (range-bound or early trend change).
A clear on-chart label displays the current regime.
How to use it
Use this as the first filter before analyzing silver, miners, or relative-strength ratios.
When gold is Bull, precious metals deserve attention.
When gold is Bear, most precious-metal trades lose their edge.
When gold is Neutral, patience is usually rewarded.
Best timeframe
This indicator is designed for weekly charts and macro-level decision-making.
It is not intended for day trading or short-term signals.
Who this is for:
Investors and traders focused on macro trends
Those treating gold as a monetary asset, not a short-term trade
Anyone looking for a clean, objective regime filter.
Super Regression Trend█ OVERVIEW
Super Regression Trend is an advanced trend-following indicator that combines classic linear regression with a SuperTrend mechanism based on RMSE (Root Mean Square Error). Instead of traditional ATR, it uses price deviations from the regression line, allowing for highly precise adaptation to current market volatility. The indicator is clean, dynamic, and equipped with optional risk management tools — automatic Take Profit and Stop Loss levels displayed after each trend reversal signal. Perfect for traders seeking solid trend confirmation with built-in position management support.
█ CONCEPT
The indicator was created to combine the advantages of linear regression (smooth trend tracking) with the reliability of the SuperTrend mechanism (trailing stop).
The key element is calculating RMSE based on deviations of the source price from the regression line over a specified period. The band around the regression (RMSE × multiplier) creates dynamic, trailing upper and lower levels. The trend changes only after price closes beyond this band — this allows the indicator to react quickly to new impulses while effectively filtering noise and false breakouts in consolidation.
█ FEATURES
Data source:
- Source price (default: close)
- Regression Length
Calculations:
- Linear regression line (ta.linreg)
- RMSE of deviations within the length window
- Upper and lower bands: regression ± (RMSE × Multiplier)
Trailing mechanism:
Levels are “pulled” in the direction opposite to the trend (minimized/maximized)
Trend change logic:
- Down → Up: close > upper band
- Up → Down: close < lower band
Visualization:
- SuperTrend line with breaks at reversal points
- Optional gradient fill between SuperTrend line and regression
- Optional bar coloring based on current trend
- “Buy” labels (green upward arrow) and “Sell” labels (red downward arrow) only on confirmed trend changes
Risk management:
- Optional automatic TP1/TP2/TP3 and SL levels after each signal
Two calculation modes:
- Candle Multiplier – multiplier of average candle body size (SMA(|open–close|))
- Percentage – percentage of the signal close price
Levels drawn as short horizontal lines
Persistent table in the top-right corner with current TP/SL values
Alerts:
- Buy Signal – triggers only on confirmed uptrend change
- Sell Signal – triggers only on confirmed downtrend change
█ HOW TO USE
Add to chart → paste the code in Pine Editor or search for “Super Regression Trend”.
Main settings:
- Regression Length → default 20 (regression window length)
- RMSE Multiplier → default 2 (key sensitivity parameter)
- Show SuperTrend Line / Fill to Regression / Color Bars → visual options
- Show TP/SL Levels → enable/disable risk management tools
- TP/SL Calculation Mode → “Candle Multiplier” or “Percentage”
- Multipliers/percentages for TP1–TP3 and SL → fully customizable
Interpretation:
- Green line and shading = uptrend
- Red line and shading = downtrend
- Higher RMSE Multiplier = fewer signals, higher quality
- Lower Multiplier = faster reaction, more signals (aggressive mode)
█ APPLICATIONS
Excellent for:
- Classic trend-following (enter with trend, exit on reversal)
- Momentum and breakout strategies
- Automated position management with optional TP/SL levels
Best combined with:
- Support/resistance levels, Pivot Points, psychological round numbers
- Confirmation from oscillators (RSI, Stochastic, MACD)
- Volume or volume profile analysis
Style adaptation:
- Scalping / daytrading → shorter regression length (10–20) and lower Multiplier (1.5–2.0)
- Swing / longer-term positions → longer regression (30–50) and higher Multiplier (2.0–3.0)
█ NOTES
- Works on all markets and timeframes
- Effectiveness depends on matching the RMSE Multiplier to the instrument’s volatility
- Higher Multiplier and Length values = fewer, but significantly more reliable signals
Sensex / Nifty Trend + Pullback (High Probability)Below is a Sensex / Nifty–optimized, error-proof, copy-paste ready Pine Script (v5) using a Trend + Pullback strategy.
This is designed for index trading, avoids repainting, and works cleanly on 15m / 30m / 60m charts.
CTA Trend Model (TA and Quant)Simple CTA Long-Term model using a mix of Quant and old school Technical Indicators.
Use on Daily or Weekly Charts for trending macro futures/spot markets
Mirror Trendline ToolThis indicator is an interactive mirror‑trendline drawing tool that uses three draggable points to build two related lines. Point One and Point Two define the primary (blue) trendline; Point Three defines the starting anchor for the mirrored line, which always has the opposite slope to the blue line and updates live as you move the anchor, giving continuous visual feedback while you drag it .
A color‑invert option automatically generates the mirrored line’s color by mathematically inverting the chosen base color while preserving its opacity, with a checkbox to disable inversion so both lines can share the same appearance . When “Stop at Intersection” is checked, both lines terminate exactly at their intersection, creating a clean V‑shaped construction that highlights the symmetry point between the reference move and its mirror . When the box is unchecked, both lines extend beyond that intersection, but their total duration is capped at no more than twice the original blue segment’s length, keeping projections proportionate and preventing excessively long rays from cluttering the chart .


