ค้นหาในสคริปต์สำหรับ "trend"

Trend TrackerWorks best on the Daily Something Iv'e been playing around with for a while seems to work real well on High Beta Names

Trend Follower Strategy (Long Only)Adjusted for Bitcoin.
Long position only.
10% of your balance each time.
Tight stop loss.
Reasonable profit-loss ratio.
Positive return every year.
No repaint.

FTT_concept (HTF)Trend following Strategy utilizing Heikin Ashi candles. Best results at higher time frames (12H+). I personally prefer 1D TF.
Cheers
Tip box
BTC: 3FMew3LkwAf5x6K3qjT9Tp3pXNFCWKgEfT
ETH: 0xC72d4128f95E1759FdbF027F412E794b62fBBbE8
LTC: LQts3ypPKodNpmQGpPRMZhFaH3yhyDw7iL

Noro's ZigTrend Strategy v1.0Trend reverse trade strategy. The indicator a zigzag is used.
If the candle is closed above than the line of a zigzag - to open a long position.
If the candle is closed below than the line of a zigzag - to open a short position.


Trend Strat_v5LONGS ONLY!!.. NO REPAINTING!!! Back-test started from 1/1/2018 to 4/16/2018.. Configuration has to be adjusted per pair.
Back-Test settings:
drive.google.com
Configuration Examples & Results:
drive.google.com
drive.google.com
drive.google.com
drive.google.com
drive.google.com
drive.google.com
7-day trail available with request.

IsAlgo - Manual TrendLine► Overview:
Manual TrendLine is a strategy that allows traders to manually insert a trendline and opens trades when the trendline is retested or when the price hits a new highest high or lowest low. It provides flexibility in trendline configuration and trading behavior, enabling responsive and adaptable trading strategies.
► Description:
The Manual TrendLine strategy revolves around using manually defined trendlines as the primary tool for making trading decisions. Traders start by specifying two key points on the chart to establish the trendline. Each point is defined by a specific time and price, enabling precise placement according to the trader’s analysis and insights. Additionally, the strategy allows for the adjustment of the trendline’s width, which acts as a buffer zone around the trendline, providing flexibility in how closely price movements must align with the trendline to trigger trades.
Once the trendline is established, the strategy continuously monitors price movements relative to this line. One of its core functions is to execute trades when the price retests the trendline. A retest occurs when the price approaches the trendline after initially diverging from it, indicating potential continuation of the prevailing trend. This behavior is often seen as a confirmation of the trend’s strength, and the strategy takes advantage of these moments to enter trades in the direction of the trend.
Beyond retests, the strategy also tracks the formation of new highest highs and lowest lows in relation to the trendline. When the price reaches a new highest high or lowest low, it signifies strong momentum in the trend’s direction. The strategy can be configured to open trades at these critical points.
Another key feature of the strategy is its response to trendline breaks. A break occurs when the price moves through the trendline, potentially signaling a reversal or a significant shift in market sentiment. The strategy can be set to open reverse trades upon such breaks, enabling traders to quickly adapt to changing market conditions. Additionally, traders have the option to stop opening new trades after a trendline break, helping to avoid trades during periods of uncertainty or increased volatility.
↑ Up Trend Example:
↓ Down Trend Example:
► Features and Settings:
⚙︎ TrendLine: Define the time and price of the two main points of the trendline, and set the trendline width.
⚙︎ Entry Candle: Specify the minimum and maximum body size and the body-to-candle size ratio for entry candles.
⚙︎ Trading Session: Define specific trading hours during which the strategy operates, restricting trades to preferred market periods.
⚙︎ Trading Days: Specify active trading days to avoid certain days of the week.
⚙︎ Backtesting: backtesting for a selected period to evaluate strategy performance. This feature can be deactivated if not needed.
⚙︎ Trades: Configure trade direction (long, short, or both), position sizing (fixed or percentage-based), maximum number of open trades, and daily trade limits.
⚙︎ Trades Exit: Set profit/loss limits, specify trade duration, or exit based on band reversal signals.
⚙︎ Stop Loss: Choose from various stop-loss methods, including fixed pips, ATR-based, or highest/lowest price points within a specified number of candles. Trades can also be closed after a certain number of adverse candle movements.
⚙︎ Break Even: Adjust stop loss to break even once predefined profit levels are reached, protecting gains.
⚙︎ Trailing Stop: Implement a trailing stop to adjust the stop loss as the trade becomes profitable, securing gains and potentially capturing further upside.
⚙︎ Take Profit: Set up to three take-profit levels using methods such as fixed pips, ATR, or risk-to-reward ratios. Alternatively, specify a set number of candles moving in the trade’s direction.
⚙︎ Alerts: Comprehensive alert system to notify users of significant actions, including trade openings and closings. Supports dynamic placeholders for take-profit levels and stop-loss prices.
⚙︎ Dashboard: Visual display on the chart providing detailed information about ongoing and past trades, aiding users in monitoring strategy performance and making informed decisions.
► Backtesting Details:
Timeframe: 30-minute EURUSD chart
Initial Balance: $10,000
Order Size: 500 units
Commission: 0.05%
Slippage: 5 ticks
This strategy opens trades around a manually drawn trendline, which results in a smaller number of closed trades.

IsAlgo - AI Trend Strategy► Overview:
The AI Trend Strategy employs a combination of technical indicators to guide trading decisions across various markets and timeframes. It uses a custom Super Trend indicator and an Exponential Moving Average (EMA) to analyze market trends and executes trades based on specific candlestick patterns. This strategy includes options for setting stop losses, take profit levels, and features an alert system for trade notifications.
► Description:
This strategy focuses on identifying the optimal "entry candle," which signals either a potential correction within the ongoing trend or the emergence of a new trend. The entry criteria for this candle are highly customizable, allowing traders to specify dimensions such as the candle's minimum and maximum size and body ratio. Additional settings include whether this candle should be the highest or lowest compared to recent candles and if a confirmation candle is necessary to validate the entry.
The Super Trend indicator is central to the strategy’s operation, dictating the direction of trades by identifying bullish or bearish trends. Traders have the option to configure trades to align with the direction of the trend identified by this indicator, or alternatively, to take positions counter to the trend for potential reversal strategies. This flexibility can be crucial during varying market conditions.
Additionally, the strategy incorporates an EMA alongside the Super Trend indicator to further analyze trend directions. This combined approach aims to reduce the occurrence of false signals and improve the strategy's overall trend analysis.
The learning algorithm is a standout feature of the AI Trend Strategy. After accumulating data from a predefined number of trades (e.g., after the first 100 trades), the algorithm begins to analyze past performances to identify patterns in wins and losses. It considers variables such as the distance from the current price to the trend line, the range between the highest and lowest prices during the trend, and the duration of the trend. This data informs the algorithm's predictions for future trades, aiming to improve accuracy and reduce losses by adapting to the evolving market conditions.
► Examples of Trade Execution:
1. In an Uptrend: The strategy might detect a suitable entry candle during a correction phase, which aligns with the continuing uptrend for a potential long trade.
2. In a Downtrend: Alternatively, the strategy might identify an entry candle at the end of a downtrend, suggesting a potential reversal or correction where a long trade could be initiated.
3. In an Uptrend: The strategy may also spot an entry candle at the end of an uptrend and execute a short trade, anticipating a reversal or significant pullback.
4. In a Downtrend: The strategy might find a suitable entry candle during a correction phase, indicating a continuation of the downtrend for a potential short trade.
These examples illustrate how the strategy identifies potential trading opportunities based on trend behavior and candlestick patterns.
► Features and Settings:
⚙︎ Trend: Utilizes a custom Super Trend indicator to identify the direction of the market trend. Users can configure the strategy to execute trades in alignment with this trend, take positions contrary to the trend, or completely ignore the trend information for their trading decisions.
⚙︎ Moving average: Employs an Exponential Moving Average (EMA) to further confirm the trend direction indicated by the Super Trend indicator. This setting can be used in conjunction with the Super Trend or disabled if preferred.
⚙︎ Entry candle: Defines the criteria for the candle that triggers a trade. Users can customize aspects such as the candle's size, body, and its relative position to previous candles to ensure it meets specific trading requirements before initiating a trade.
⚙︎ Learning algorithm: This component uses historical trade data to refine the strategy. It assesses various aspects of past trades, such as price trends and market conditions, to make more informed trading decisions in the future.
⚙︎ Trading session: Users can define specific trading hours during which the strategy should operate, allowing trades to be executed only during preferred market periods.
⚙︎ Trading days: This option enables users to specify which days the strategy should be active, providing the flexibility to avoid trading on certain days of the week if desired.
⚙︎ Backtesting: Enables a period during which the strategy can be tested over a selected start and end date, with an option to deactivate this feature if not needed.
⚙︎ Trades: Detailed configuration options include the direction of trades (long, short, or both), position sizing (fixed or percentage-based), the maximum number of open trades, and limitations on the number of trades per day or based on trend changes.
⚙︎ Trades Exit: Offers various strategies for exiting trades, such as setting limits on profits or losses, specifying the duration a trade should remain open, or closing trades based on trend reversal signals.
⚙︎ Stop loss: Various methods for setting stop losses are available, including fixed pips, based on Average True Range (ATR), or utilizing the highest or lowest price points within a designated number of previous candles. Another option allows for closing the trade after a specific number of candles moving in the opposite direction.
⚙︎ Break even: This feature adjusts the stop loss to a break-even point under certain conditions, such as reaching predefined profit levels, to protect gains.
⚙︎ Trailing stop: The trailing stop feature adjusts the stop loss as the trade moves into profit, aiming to secure gains while potentially capturing further upside.
⚙︎ Take profit: Up to three take profit levels can be established using various methods, such as a fixed amount of pips, risk-to-reward ratios based on the stop loss, ATR, or after a set number of candles that move in the direction of the trade.
⚙︎ Alerts: Includes a comprehensive alert system that informs the user of all significant actions taken by the strategy, such as trade openings and closings. It supports placeholders for dynamic values like take profit levels, stop loss prices, and more.
⚙︎ Dashboard: Provides a visual display of detailed information about ongoing and past trades on the chart, helping users monitor the strategy’s performance and make informed decisions.
► Backtesting Details:
Timeframe: 15-minute BTCUSD chart.
Initial Balance: $10,000.
Order Size: 4% of equity per trade.
Commission: 0.01%.
Slippage: 5 ticks.
Risk Management: Strategic stop loss settings are applied based on the most extreme price points within the last 18 candles.

AlgoBuilder [Trend-Following] | FractalystWhat's the strategy's purpose and functionality?
This strategy is designed for both traders and investors looking to rely on and trade based on historical and backtested data using automation. The main goal is to build profitable trend-following strategies that outperform the underlying asset in terms of returns while minimizing drawdown. For example, as for a benchmark, if the S&P 500 (SPX) has achieved an estimated 10% annual return with a maximum drawdown of -57% over the past 20 years, using this strategy with different entry and exit techniques, users can potentially seek ways to achieve a higher Compound Annual Growth Rate (CAGR) while maintaining a lower maximum drawdown.
Although the strategy can be applied to all markets and timeframes, it is most effective on stocks, indices, future markets, cryptocurrencies, and commodities and JPY currency pairs given their trending behaviors.
In trending market conditions, the strategy employs a combination of moving averages and diverse entry models to identify and capitalize on upward market movements. It integrates market structure-based trailing stop-loss mechanisms across different timeframes and provides exit techniques, including percentage-based and risk-reward (RR) based take profit levels.
Additionally, the strategy has also a feature that includes a built-in probability and sentiment function for traders who want to implement probabilities and market sentiment right into their trading strategies.
Performance summary, weekly, and monthly tables enable quick visualization of performance metrics like net profit, maximum drawdown, compound annual growth rate (CAGR), profit factor, average trade, average risk-reward ratio (RR), and more. This aids optimization to meet specific goals and risk tolerance levels effectively.
-----
How does the strategy perform for both investors and traders?
The strategy has two main modes, tailored for different market participants: Traders and Investors.
Trading:
1. Trading (1x):
- Designed for traders looking to capitalize on bullish trending markets.
- Utilizes a percentage risk per trade to manage risk and optimize returns.
- Suitable for active trading with a focus on trend-following and risk management.
- (1x) This mode ensures no stacking of positions, allowing for only one running position or trade at a time.
◓: Mode | %: Risk percentage per trade
2. Trading (2x):
Similar to the 1x mode but allows for two pyramiding entries.
This approach enables traders to increase their position size as the trade moves in their favor, potentially enhancing profits during strong bullish trends.
◓: Mode | %: Risk percentage per trade
3. Investing:
- Geared towards investors who aim to capitalize on bullish trending markets without using leverage while mitigating the asset's maximum drawdown.
- Utilizes 100% of the equity to buy, hold, and manage the asset.
- Focuses on long-term growth and capital appreciation by fully investing in the asset during bullish conditions.
- ◓: Mode | %: Risk not applied (In investing mode, the strategy uses 100% of equity to buy the asset)
-----
What's the purpose of using moving averages in this strategy? What are the underlying calculations?
Using moving averages is a widely-used technique to trade with the trend.
The main purpose of using moving averages in this strategy is to filter out bearish price action and to only take trades when the price is trading ABOVE specified moving averages.
The script uses different types of moving averages with user-adjustable timeframes and periods/lengths, allowing traders to try out different variations to maximize strategy performance and minimize drawdowns.
By applying these calculations, the strategy effectively identifies bullish trends and avoids market conditions that are not conducive to profitable trades.
The MA filter allows traders to choose whether they want a specific moving average above or below another one as their entry condition.
This comparison filter can be turned on (>/<) or off.
For example, you can set the filter so that MA#1 > MA#2, meaning the first moving average must be above the second one before the script looks for entry conditions. This adds an extra layer of trend confirmation, ensuring that trades are only taken in more favorable market conditions.
MA #1: Fast MA | MA #2: Medium MA | MA #3: Slow MA
⍺: MA Period | Σ: MA Timeframe
-----
What entry modes are used in this strategy? What are the underlying calculations?
The strategy by default uses two different techniques for the entry criteria with user-adjustable left and right bars: Breakout and Fractal.
1. Breakout Entries :
- The strategy looks for pivot high points with a default period of 3.
- It stores the most recent high level in a variable.
- When the price crosses above this most recent level, the strategy checks if all conditions are met and the bar is closed before taking the buy entry.
◧: Pivot high left bars period | ◨: Pivot high right bars period
2. Fractal Entries :
- The strategy looks for pivot low points with a default period of 3.
- When a pivot low is detected, the strategy checks if all conditions are met and the bar is closed before taking the buy entry.
◧: Pivot low left bars period | ◨: Pivot low right bars period
By utilizing these entry modes, the strategy aims to capitalize on bullish price movements while ensuring that the necessary conditions are met to validate the entry points.
-----
What type of stop-loss identification method are used in this strategy? What are the underlying calculations?
Initial Stop-Loss:
1. ATR Based:
The Average True Range (ATR) is a method used in technical analysis to measure volatility. It is not used to indicate the direction of price but to measure volatility, especially volatility caused by price gaps or limit moves.
Calculation:
- To calculate the ATR, the True Range (TR) first needs to be identified. The TR takes into account the most current period high/low range as well as the previous period close.
The True Range is the largest of the following:
- Current Period High minus Current Period Low
- Absolute Value of Current Period High minus Previous Period Close
- Absolute Value of Current Period Low minus Previous Period Close
- The ATR is then calculated as the moving average of the TR over a specified period. (The default period is 14).
Example - ATR (14) * 1.5
⍺: ATR period | Σ: ATR Multiplier
2. ADR Based:
The Average Day Range (ADR) is an indicator that measures the volatility of an asset by showing the average movement of the price between the high and the low over the last several days.
Calculation:
- To calculate the ADR for a particular day:
- Calculate the average of the high prices over a specified number of days.
- Calculate the average of the low prices over the same number of days.
- Find the difference between these average values.
- The default period for calculating the ADR is 14 days. A shorter period may introduce more noise, while a longer period may be slower to react to new market movements.
Example - ADR (14) * 1.5
⍺: ADR period | Σ: ADR Multiplier
Application in Strategy:
- The strategy calculates the current bar's ADR/ATR with a user-defined period.
- It then multiplies the ADR/ATR by a user-defined multiplier to determine the initial stop-loss level.
By using these methods, the strategy dynamically adjusts the initial stop-loss based on market volatility, helping to protect against adverse price movements while allowing for enough room for trades to develop.
Trailing Stop-Loss:
One of the key elements of this strategy is its ability to detec buyside and sellside liquidity levels across multiple timeframes to trail the stop-loss once the trade is in running profits.
By utilizing this approach, the strategy allows enough room for price to run.
There are two built-in trailing stop-loss (SL) options you can choose from while in a trade:
1. External Trailing Stop-Loss:
- Uses sell-side liquidity to trail your stop-loss, allowing price to consolidate before continuation. This method is less aggressive and provides more room for price fluctuations.
Example - External - Wick below the trailing SL - 12H trailing timeframe
⍺: Exit type | Σ: Trailing stop-loss timeframe
2. Internal Trailing Stop-Loss:
- Uses the most recent swing low with a period of 2 to trail your stop-loss. This method is more aggressive compared to the external trailing stop-loss, as it tightens the stop-loss closer to the current price action.
Example - Internal - Close below the trailing SL - 6H trailing timeframe
⍺: Exit type | Σ: Trailing stop-loss timeframe
Each market behaves differently across various timeframes, and it is essential to test different parameters and optimizations to find out which trailing stop-loss method gives you the desired results and performance.
-----
What type of break-even and take profit identification methods are used in this strategy? What are the underlying calculations?
For Break-Even:
- You can choose to set a break-even level at which your initial stop-loss moves to the entry price as soon as it hits, and your trailing stop-loss gets activated (if enabled).
- You can select either a percentage (%) or risk-to-reward (RR) based break-even, allowing you to set your break-even level as a percentage amount above the entry price or based on RR.
For TP1 (Take Profit 1):
- You can choose to set a take profit level at which your position gets fully closed or 50% if the TP2 boolean is enabled.
- Similar to break-even, you can select either a percentage (%) or risk-to-reward (RR) based take profit level, allowing you to set your TP1 level as a percentage amount above the entry price or based on RR.
For TP2 (Take Profit 2):
- You can choose to set a take profit level at which your position gets fully closed.
- As with break-even and TP1, you can select either a percentage (%) or risk-to-reward (RR) based take profit level, allowing you to set your TP2 level as a percentage amount above the entry price or based on RR.
The underlying calculations involve determining the price levels at which these actions are triggered. For break-even, it moves the initial stop-loss to the entry price and activate the trailing stop-loss once the break-even level is reached.
For TP1 and TP2, it's specifying the price levels at which the position is partially or fully closed based on the chosen method (percentage or RR) above the entry price.
These calculations are crucial for managing risk and optimizing profitability in the strategy.
⍺: BE/TP type (%/RR) | Σ: how many RR/% above the current price
-----
What's the ADR filter? What does it do? What are the underlying calculations?
The Average Day Range (ADR) measures the volatility of an asset by showing the average movement of the price between the high and the low over the last several days.
The period of the ADR filter used in this strategy is tied to the same period you've used for your initial stop-loss.
Users can define the minimum ADR they want to be met before the script looks for entry conditions.
ADR Bias Filter:
- Compares the current bar ADR with the ADR (Defined by user):
- If the current ADR is higher, it indicates that volatility has increased compared to ADR (DbU).(⬆)
- If the current ADR is lower, it indicates that volatility has decreased compared to ADR (DbU).(⬇)
Calculations:
1. Calculate ADR:
- Average the high prices over the specified period.
- Average the low prices over the same period.
- Find the difference between these average values in %.
2. Current ADR vs. ADR (DbU):
- Calculate the ADR for the current bar.
- Calculate the ADR (DbU).
- Compare the two values to determine if volatility has increased or decreased.
By using the ADR filter, the strategy ensures that trades are only taken in favorable market conditions where volatility meets the user's defined threshold, thus optimizing entry conditions and potentially improving the overall performance of the strategy.
>: Minimum required ADR for entry | %: Current ADR comparison to ADR of 14 days ago.
-----
What's the probability filter? What are the underlying calculations?
The probability filter is designed to enhance trade entries by using buyside liquidity and probability analysis to filter out unfavorable conditions.
This filter helps in identifying optimal entry points where the likelihood of a profitable trade is higher.
Calculations:
1. Understanding Swing highs and Swing Lows
Swing High: A Swing High is formed when there is a high with 2 lower highs to the left and right.
Swing Low: A Swing Low is formed when there is a low with 2 higher lows to the left and right.
2. Understanding the purpose and the underlying calculations behind Buyside, Sellside and Equilibrium levels.
3. Understanding probability calculations
1. Upon the formation of a new range, the script waits for the price to reach and tap into equilibrium or the 50% level. Status: "⏸" - Inactive
2. Once equilibrium is tapped into, the equilibrium status becomes activated and it waits for either liquidity side to be hit. Status: "▶" - Active
3. If the buyside liquidity is hit, the script adds to the count of successful buyside liquidity occurrences. Similarly, if the sellside is tapped, it records successful sellside liquidity occurrences.
5. Finally, the number of successful occurrences for each side is divided by the overall count individually to calculate the range probabilities.
Note: The calculations are performed independently for each directional range. A range is considered bearish if the previous breakout was through a sellside liquidity. Conversely, a range is considered bullish if the most recent breakout was through a buyside liquidity.
Example - BSL > 50%
-----
What's the sentiment Filter? What are the underlying calculations?
Sentiment filter aims to calculate the percentage level of bullish or bearish fluctuations within equally divided price sections, in the latest price range.
Calculations:
This filter calculates the current sentiment by identifying the highest swing high and the lowest swing low, then evenly dividing the distance between them into percentage amounts. If the price is above the 50% mark, it indicates bullishness, whereas if it's below 50%, it suggests bearishness.
Sentiment Bias Identification:
Bullish Bias: The current price is trading above the 50% daily range.
Bearish Bias: The current price is trading below the 50% daily range.
Example - Sentiment Enabled | Bullish degree above 50% | Bullish sentimental bias
>: Minimum required sentiment for entry | %: Current sentimental degree in a (Bullish/Bearish) sentimental bias
-----
What's the range length Filter? What are the underlying calculations?
The range length filter identifies the price distance between buyside and sellside liquidity levels in percentage terms. When enabled, the script only looks for entries when the minimum range length is met. This helps ensure that trades are taken in markets with sufficient price movement.
Calculations:
Range Length (%) = ( ( Buyside Level − Sellside Level ) / Current Price ) ×100
Range Bias Identification:
Bullish Bias: The current range price has broken above the previous external swing high.
Bearish Bias: The current range price has broken below the previous external swing low.
Example - Range length filter is enabled | Range must be above 5% | Price must be in a bearish range
>: Minimum required range length for entry | %: Current range length percentage in a (Bullish/Bearish) range
-----
What's the day filter Filter, what does it do?
The day filter allows users to customize the session time and choose the specific days they want to include in the strategy session. This helps traders tailor their strategies to particular trading sessions or days of the week when they believe the market conditions are more favorable for their trading style.
Customize Session Time:
Users can define the start and end times for the trading session.
This allows the strategy to only consider trades within the specified time window, focusing on periods of higher market activity or preferred trading hours.
Select Days:
Users can select which days of the week to include in the strategy.
This feature is useful for excluding days with historically lower volatility or unfavorable trading conditions (e.g., Mondays or Fridays).
Benefits:
Focus on Optimal Trading Periods:
By customizing session times and days, traders can focus on periods when the market is more likely to present profitable opportunities.
Avoid Unfavorable Conditions:
Excluding specific days or times can help avoid trading during periods of low liquidity or high unpredictability, such as major news events or holidays.
Increased Flexibility: The filter provides increased flexibility, allowing traders to adapt the strategy to their specific needs and preferences.
Example - Day filter | Session Filter
θ: Session time | Exchange time-zone
-----
What tables are available in this script?
Table Type:
- Summary: Provides a general overview, displaying key performance parameters such as Net Profit, Profit Factor, Max Drawdown, Average Trade, Closed Trades, Compound Annual Growth Rate (CAGR), MAR and more.
CAGR: It calculates the 'Compound Annual Growth Rate' first and last taken trades on your chart. The CAGR is a notional, annualized growth rate that assumes all profits are reinvested. It only takes into account the prices of the two end points — not drawdowns, so it does not calculate risk. It can be used as a yardstick to compare the performance of two strategies. Since it annualizes values, it requires a minimum 4H timeframe to display the CAGR value. annualizing returns over smaller periods of times doesn't produce very meaningful figures.
MAR: Measure of return adjusted for risk: CAGR divided by Max Drawdown. Indicates how comfortable the system might be to trade. Higher than 0.5 is ideal, 1.0 and above is very good, and anything above 3.0 should be considered suspicious and you need to make sure the total number of trades are high enough by running a Deep Backtest in strategy tester. (available for TradingView Premium users.)
Avg Trade: The sum of money gained or lost by the average trade generated by a strategy. Calculated by dividing the Net Profit by the overall number of closed trades. An important value since it must be large enough to cover the commission and slippage costs of trading the strategy and still bring a profit.
MaxDD: Displays the largest drawdown of losses, i.e., the maximum possible loss that the strategy could have incurred among all of the trades it has made. This value is calculated separately for every bar that the strategy spends with an open position.
Profit Factor: The amount of money a trading strategy made for every unit of money it lost (in the selected currency). This value is calculated by dividing gross profits by gross losses.
Avg RR: This is calculated by dividing the average winning trade by the average losing trade. This field is not a very meaningful value by itself because it does not take into account the ratio of the number of winning vs losing trades, and strategies can have different approaches to profitability. A strategy may trade at every possibility in order to capture many small profits, yet have an average losing trade greater than the average winning trade. The higher this value is, the better, but it should be considered together with the percentage of winning trades and the net profit.
Winrate: The percentage of winning trades generated by a strategy. Calculated by dividing the number of winning trades by the total number of closed trades generated by a strategy. Percent profitable is not a very reliable measure by itself. A strategy could have many small winning trades, making the percent profitable high with a small average winning trade, or a few big winning trades accounting for a low percent profitable and a big average winning trade. Most trend-following successful strategies have a percent profitability of 15-40% but are profitable due to risk management control.
BE Trades: Number of break-even trades, excluding commission/slippage.
Losing Trades: The total number of losing trades generated by the strategy.
Winning Trades: The total number of winning trades generated by the strategy.
Total Trades: Total number of taken traders visible your charts.
Net Profit: The overall profit or loss (in the selected currency) achieved by the trading strategy in the test period. The value is the sum of all values from the Profit column (on the List of Trades tab), taking into account the sign.
- Monthly: Displays performance data on a month-by-month basis, allowing users to analyze performance trends over each month.
- Weekly: Displays performance data on a week-by-week basis, helping users to understand weekly performance variations.
- OFF: Hides the performance table.
Labels:
- OFF: Hides labels in the performance table.
- PnL: Shows the profit and loss of each trade individually, providing detailed insights into the performance of each trade.
- Range: Shows the range length and Average Day Range (ADR), offering additional context about market conditions during each trade.
Profit Color:
- Allows users to set the color for representing profit in the performance table, helping to quickly distinguish profitable periods.
Loss Color:
- Allows users to set the color for representing loss in the performance table, helping to quickly identify loss-making periods.
These customizable tables provide traders with flexible and detailed performance analysis, aiding in better strategy evaluation and optimization.
-----
User-input styles and customizations:
To facilitate studying historical data, all conditions and rules can be applied to your charts. By plotting background colors on your charts, you'll be able to identify what worked and what didn't in certain market conditions.
Please note that all background colors in the style are disabled by default to enhance visualization.
-----
How to Use This Algobuilder to Create a Profitable Edge and System:
Choose Your Strategy mode:
- Decide whether you are creating an investing strategy or a trading strategy.
Select a Market:
- Choose a one-sided market such as stocks, indices, or cryptocurrencies.
Historical Data:
- Ensure the historical data covers at least 10 years of price action for robust backtesting.
Timeframe Selection:
- Choose the timeframe you are comfortable trading with. It is strongly recommended to use a timeframe above 15 minutes to minimize the impact of commissions on your profits.
Set Commission and Slippage:
- Properly set the commission and slippage in the strategy properties according to your broker or prop firm specifications.
Parameter Optimization:
- Use trial and error to test different parameters until you find the performance results you are looking for in the summary table or, preferably, through deep backtesting using the strategy tester.
Trade Count:
- Ensure the number of trades is 100 or more; the higher, the better for statistical significance.
Positive Average Trade:
- Make sure the average trade value is above zero.
(An important value since it must be large enough to cover the commission and slippage costs of trading the strategy and still bring a profit.)
Performance Metrics:
- Look for a high profit factor, MAR (Mar Ratio), CAGR (Compound Annual Growth Rate), and net profit with minimum drawdown. Ideally, aim for a drawdown under 20-30%, depending on your risk tolerance.
Refinement and Optimization:
- Try out different markets and timeframes.
- Continue working on refining your edge using the available filters and components to further optimize your strategy.
Automation:
- Once you’re confident in your strategy, you can use the automation section to connect the algorithm to your broker or prop firm.
- Trade a fully automated and backtested trading strategy, allowing for hands-free execution and management.
-----
What makes this strategy original?
1. Incorporating direct integration of probabilities into the strategy.
2. Leveraging market sentiment to construct a profitable approach.
3. Utilizing built-in market structure-based trailing stop-loss mechanisms across various timeframes.
4. Offering both investing and trading strategies, facilitating optimization from different perspectives.
5. Automation for efficient execution.
6. Providing a summary table for instant access to key parameters of the strategy.
-----
How to use automation?
For Traders:
1. Ensure the strategy parameters are properly set based on your optimized parameters.
2. Enter your PineConnector License ID in the designated field.
3. Specify the desired risk level.
4. Provide the Metatrader symbol.
5. Check for chart updates to ensure the automation table appears on the top right corner, displaying your License ID, risk, and symbol.
6. Set up an alert with the strategy selected as Condition and the Message as {{strategy.order.alert_message}}.
7. Activate the Webhook URL in the Notifications section, setting it as the official PineConnector webhook address.
8. Double-check all settings on PineConnector to ensure the connection is successful.
9. Create the alert for entry/exit automation.
For Investors:
1. Ensure the strategy parameters are properly set based on your optimized parameters.
2. Choose "Investing" in the user-input settings.
3. Create an alert with a specified name.
4. Customize the notifications tab to receive alerts via email.
5. Buying/selling alerts will be triggered instantly upon entry or exit order execution.
----
Strategy Properties
This script backtest is done on 4H COINBASE:BTCUSD , using the following backtesting properties:
Balance: $5000
Order Size: 10% of the equity
Risk % per trade: 1%
Commission: 0.04% (Default commission percentage according to TradingView competitions rules)
Slippage: 75 ticks
Pyramiding: 2
-----
Terms and Conditions | Disclaimer
Our charting tools are provided for informational and educational purposes only and should not be construed as financial, investment, or trading advice. They are not intended to forecast market movements or offer specific recommendations. Users should understand that past performance does not guarantee future results and should not base financial decisions solely on historical data.
Built-in components, features, and functionalities of our charting tools are the intellectual property of @Fractalyst Unauthorized use, reproduction, or distribution of these proprietary elements is prohibited.
By continuing to use our charting tools, the user acknowledges and accepts the Terms and Conditions outlined in this legal disclaimer and agrees to respect our intellectual property rights and comply with all applicable laws and regulations.

IsAlgo - Ultra Trend Strategy► Overview:
The Ultra Trend strategy is designed to identify trend lines based on average price movement and execute trades when the price crosses the middle line, confirmed by an entry candle. This strategy combines ATR, Moving Averages, and customizable candlestick patterns to provide a versatile and robust trading approach.
► Description:
The Ultra Trend strategy employs a multi-faceted approach to accurately gauge market trends and execute trades. It combines the Average True Range (ATR) with trendline analysis and Moving Averages, providing a comprehensive view of market conditions. The strategy uses ATR to measure market volatility and the average price movement, helping to set dynamic thresholds for trend detection and adapting to changing market conditions. The slope of the trend is calculated based on the angle of price movement, which aids in identifying the strength and direction of the trend.
Additionally, a Moving Average is used to filter trades, ensuring alignment with the broader market direction and reducing false signals, thereby enhancing trade accuracy.
Traders can configure the strategy to enter trades in the direction of the trend, against the trend, or both. This feature enhances the adaptability of the Ultra Trend strategy, making it suitable for various trading styles and market environments.
↑ Long Entry:
A long trade is executed when the entry candle crosses and closes above the trend line. This indicates a bullish market condition, signaling an opportunity to enter a buy position.
↓ Short Entry:
A short trade is executed when the entry candle crosses and closes below the trend line. This indicates a bearish market condition, signaling an opportunity to enter a sell position.
✕ Exit Conditions:
The strategy offers multiple stop-loss options to manage risk effectively. Traders can set stop-loss levels using fixed pips, ATR-based calculations, the higher/lower price of past candles, or close a trade if a candle moves against the trade direction.
Up to three take profit levels can be set using methods such as fixed pips, ATR, and risk-to-reward ratios. This allows traders to secure profits at various stages of the trade.
A trailing stop feature adjusts the stop loss as the trade moves into profit, locking in gains while allowing the trade to continue capturing potential upside. Additionally, a break-even feature moves the stop loss to the entry price once a certain profit level is reached, protecting against losses.
Trades can also be closed when a trend change is detected or when a candle closes outside a predefined channel, ensuring that positions are exited promptly in response to changing market conditions.
► Features and Settings:
⚙︎ Trend: Users can configure the trend direction, length, factor, and slope, allowing for precise control over how trends are identified and followed.
⚙︎ Moving Average: An Exponential Moving Average (EMA) can be employed to confirm the trend direction indicated by the trend lines. This provides further assurance that the trend line breakout is not a false signal. The EMA can be enabled or disabled based on user preference.
⚙︎ Entry Candle: The entry candle is the candle that breaks the trend line, signaling an entry opportunity. Users can specify the minimum and maximum size of the candle's body and the ratio of the body to the entire candle size. This ensures that only significant breakouts trigger trades.
⚙︎ Trading Session: This feature allows users to define specific trading hours during which the strategy should operate, ensuring trades are executed only during preferred market periods.
⚙︎ Trading Days: Users can specify which days the strategy should be active, offering the flexibility to avoid trading on specific days of the week.
⚙︎ Backtesting: Enables a backtesting period during which the strategy can be tested over a selected start and end date. This feature can be deactivated if not needed.
⚙︎ Trades: This includes configuring the direction of trades (long, short, or both), position sizing (fixed or percentage-based), the maximum number of open trades, and limitations on the number of trades per day or based on trend.
⚙︎ Trades Exit: The strategy offers various exit methods, such as setting profit or loss limits, specifying the duration a trade should remain open, or closing trades based on trend reversal.
⚙︎ Stop Loss: Various stop-loss methods are available, including a fixed number of pips, ATR-based, or using the highest or lowest price points within a specified number of previous candles. Additionally, trades can be closed after a specific number of candles move in the opposite direction of the trade.
⚙︎ Break Even: This feature adjusts the stop loss to a break-even point once certain conditions are met, such as reaching predefined profit levels, to protect gains.
⚙︎ Trailing Stop: The trailing stop feature adjusts the stop loss as the trade moves into profit, securing gains while potentially capturing further upside.
⚙︎ Take Profit: Up to three take-profit levels can be set using various methods, such as a fixed amount of pips, ATR, or risk-to-reward ratios based on the stop loss. Alternatively, users can specify a set number of candles moving in the direction of the trade.
⚙︎ Alerts: The strategy includes a comprehensive alert system that informs the user of all significant actions, such as trade openings and closings. It supports placeholders for dynamic values like take-profit levels and stop-loss prices.
⚙︎ Dashboard: A visual display provides detailed information about ongoing and past trades on the chart, helping users monitor the strategy's performance and make informed decisions.
► Backtesting Details:
Timeframe: 5-minute US30 chart
Initial Balance: $10,000
Order Size: 4% of equity per trade
Commission: $0.05 per contract
Slippage: 5 ticks
Stop Loss: ATR-based

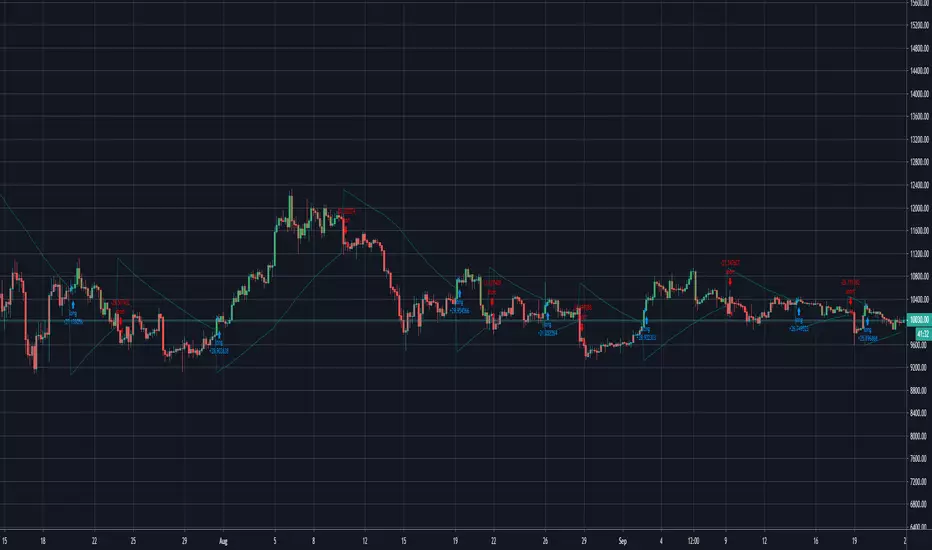
SOFEX Strong Volatility Trend Follower + BacktestingWhat is the SOFEX Strong Volatility Trend Follower + Backtesting script?
🔬 Trading Philosophy
This script is trend-following, attempting to avoid choppy markets.
It has been developed for Bitcoin and Ethereum trading, on 1H timeframe.
The strategy does not aim to make a lot of trades, or to always remain in a position and switch from long to short. Many times there is no direction and the market is in "random walk mode", and chasing trades is futile.
Expectations of performance should be realistic.
The script focuses on a balanced take-profit to stop-loss ratio. In the default set-up of the script, that is a 2% : 2% (1:1) ratio. A relatively low stop loss and take profit build onto the idea that positions should be exited promptly. There are many options to edit these values, including enabling trailing take profit and stop loss. Traders can also completely turn off TP and SL levels, and rely on opposing signals to exit and enter new trades.
Extreme scenarios can happen on the cryptocurrency markets, and disabling stop-loss levels completely is not recommended. The position size should be monitored since all of it is at risk with no stop-loss.
⚙️ Logic of the indicator
The Strong Volatility Trend Follower indicator aims at evading ranging market conditions. It does not seek to chase volatile, yet choppy markets. It aims at aggressively following confirmed trends. The indicator works best during strong, volatile trends, however, it has the downside of entering trades at trend tops or bottoms.
This indicator also leverages proprietary adaptive moving averages to identify and follow strong trend volatility effectively. Furthermore, it uses the Average Directional Index, Awesome Oscillator, ATR and a modified version of VWAP, to categorize trends into weak or strong ones. The VWAP indicator is used to identify the monetary (volume) inflow into a given trend, further helping to avoid short-term manipulations. It also helps to distinguish choppy-market volatility with a trending market one.
📟 Parameters Menu
The script has a comprehensive parameter menu:
Preset Selection : Choose between Bitcoin or Ethereum presets to tailor the indicator to your preferred cryptocurrency market.
Indicator Sensitivity Parameter : Adjust the sensitivity to adapt the indicator, particularly to make it seek higher-strength trends.
Indicator Signal Direction : Set the signal direction as Long, Short, or Both, depending on your preference.
Exit of Signals : You have options regarding Take-Profit (TP) and Stop-Loss (SL) levels. Enable TP/SL levels to exit trades at predetermined levels, or disable them to rely on direction changes for exits. Be aware that removing stop losses can introduce additional risk, and position sizing should be carefully monitored.
By enabling Trailing TP/SL, the system switches to a trailing approach, allowing you to:
- Place an initial customizable SL.
- Specify a level (%) for the Trailing SL to become active.
- When the activation level is reached, the system moves the trailing stop by a given Offset (%).
Additionally, you can enable exit at break-even, where the system places an exit order when the trail activation level is reached, accounting for fees and slippage.
Alert Messages : Define the fields for alert messages based on specific conditions. You can set up alerts to receive email, SMS, and in-app notifications. If you use webhooks for alerts, exercise caution, as these alerts can potentially execute trades without human supervision.
Backtesting : Default backtesting parameters are set to provide realistic backtesting performance:
- 0.04% Commission per trade (for both entries and exits)
- 3 ticks Slippage (highly dependent on exchange)
- Initial capital of $1000
- Order size of $1000
While the order size is equal to the initial capital, the script employs a 2% stop-loss order to limit losses and attempts to prevent risky trades from creating big losses. The order size is a set dollar value, so that the backtesting performance is linear, instead of using % of capital which may result in unrealistic backtesting performance.
Risk Disclaimer
Please be aware that backtesting results, while valuable for statistical overview, do not guarantee future performance in any way. Cryptocurrency markets are inherently volatile and risky. Always trade responsibly and do not risk more than you can afford to lose.

ATR Trend Run - Signals Alerts SL and TP by Tech Store OnThe script uses several ATR formulas for entering/exiting trades, support/resistance lines to take TP1 (take profit 1) and another ATR formula for TP2 (take profit 2). Everything is fully configurable to your preference, and you can back-test it via TradingView. You can also configure the indicator for signals during US trading sessions (with or without power hour), as well as taking profits/stop-loss session time(s), as well as to close a position at the end of the trading session no matter what. Also, you can turn all of that off, so there are no trading session/end of day limits and each trade will run until it either hits SL, TP1, TP1 > back to entry, TP2. Note: indicator is set to skip consecutive/opposite signals, while you currently have a trade open > if you hit a trend – ride it to the end!
For example: If you will be day trading SPY and you wish to close your positions no matter what right before the market closes (3:45PM ET > 15min before closes): Make sure to checkbox “Intraday – Close Position Before Market Closes” in the strategy/indicator Settings, so that you are alerted soon before the market closes, if you wish to continue holding the position – leave this checkbox unchecked.
SL: SL is set to be slightly above/below the signal candle, which is best suited for this strategy.
Strategy Take Profit Approach
While the initial position open and SL hit is always based on a closed candle bar (can’t do otherwise, as otherwise you will have 10s of fake signal alerts), there are 2 ways on trading this strategy in terms of TP1 and TP1 taken > back to Entry, which is based off Alert type.
You can switch this as you like within the indicator settings, “Checked: TP1 taken > back to Entry per Price Touch | Unchecked: per Candle Close”.
Candle Close vs Price Touch: with the Default method - Candle Close for an alert for TP1 or if price comes back to Entry after TP1 is taken will only be triggered once candle bar fully closes crossing the area, while Price Touch will alert when price touches the area before candle bar closes.
For example: your trade is running well, you grab TP1 and the price reverses and hits your trade Entry area. With Price Touch – you are immediately alerted to close your trade with no loss and with TP1 profit. With Candle Close - you will receive an alert only once candle bar fully closes on top of the Entry crossing it backwards, meaning it may lower your TP1 profit or even completely reverse the trade into loss in case it will be a huge candle bar for any reason. However, it may touch the Entry area, looking like the price is reversing, but then continue per initial trade direction, sometimes becoming a trend. So, while Price Touch seem like a more conservative approach, Candle Close can give you much bigger profits if you catch a trend, but you can always change it via the Settings.
Note: TradingView back-testing engine does not have a feature to open/close orders IMMEDIATELY via Price Touch trigger, but only when the candle closes after price touches the scripted area/line/etc., so you for the most accurate results, test your strategy out via Candle Close setting. Otherwise, decide yourself. I personally like more Candle Close since I can test it out via back-testing with the most accurate results.
TP2 is set per Candle Close as often the ATR trailing stop line will be hit and bounced off, so it’s best to wait until candle actually breaks it/closes through it.
Note: If you will be observing the strategy LIVE, during LIVE candle bar movement – it will look weird, like it’s placing an order after order during any trigger – this seem like a TradingView bug, but is only observational, once the candle bar is closed and you refresh TradingView it will all look correct.
Back-Testing
If you wish to do some back-testing, just modify the strategy/indicator Settings:
-----1) STRATEGY: This is for back-testing/experimenting with the script inputs.
----------a. You can setup a start date (date, month, year) from which it will start opening back-test trades, select a position size and select TP1 size, the idea here is to close half (or whatever you choose) portion of the trade once you hit your TP1, then to either close at small profit or to catch a trend and close the second portion of the position long way ahead from Entry, otherwise it will alert you to close the position at TP2, if price comes back to Entry, at reversal signal or at the end of US trading session if the option for it is checked. If you wish to close the whole position at TP1, just enter the same amount for TP1 to match backtest position size. Otherwise you can experiment with TP1 sizing – try it out!
-----2) Feel free to experiment with ATR settings and with S&R Left/Right bars, you may be amazed how results will differ and find some really cool combinations!
-----3) Make sure you select/de-select “Intraday – Close Position Before Market Closes” setting depending on what you are back-testing and on which conditions
-----4) Note: If you wish to do some deep back-testing (1+ years), use the “Deep Backtesting” feature within Strategy Tester on the TradingView as otherwise it may show wrong results or even fail to compute the results
Add the alerts
-----Right-click anywhere on the TradingView chart
-----Click on Add alert
-----Condition: ATR Trend Run - Signals Alerts SL and TP, by Tech Store On
----------o Right underneath the condition click on the drop-down menu and select “alert() function calls only”
-----Expiration time: Whatever you wish
-----Alert actions: Whatever notifications you wish
-----Alert name: DO NOT TOUCH THIS
-----Hit “Create”
-----Note: If you change ANY Settings within the indicator – you must DELETE the current alert and create a new one per steps above, otherwise it will continue triggering alerts per old Settings!
- Note: If you add the alert while the script is currently “In Position” it will not know that. So either wait when there will be no position open at all or close your position partially if the bot opens it twice bigger or so in case per script the bot will think it is already in position.
Note: Because of the slippage and the order processing time between TradingView, AutoView and the Broker (it’s usually about a second or so), it is suggested to not use a timeframe lower than 1min. The script is working really well with 1M/3M/5M/H1/H4 timeframes per my back-testing, but feel free to explore via Strategy Back-testing what’s best for the instrument you wish to trade.
If you wish to try this out for a week or so – please reach out and I will give you access.

EMA bands + leledc + bollinger bands trend following strategy v2The basics:
In its simplest form, this strategy is a positional trend following strategy which enters long when price breaks out above "middle" EMA bands and closes or flips short when price breaks down below "middle" EMA bands. The top and bottom of the middle EMA bands are calculated from the EMA of candle highs and lows, respectively.
The idea is that entering trades on breakouts of the high EMAs and low EMAs rather than the typical EMA based on candle closes gives a bit more confirmation of trend strength and minimizes getting chopped up. To further reduce getting chopped up, the strategy defaults to close on crossing the opposite EMA band (ie. long on break above high EMA middle band and close below low EMA middle band).
This strategy works on all markets on all timeframes, but as a trend following strategy it works best on markets prone to trending such as crypto and tech stocks. On lower timeframes, longer EMAs tend to work best (I've found good results on EMA lengths even has high up to 1000), while 4H charts and above tend to work better with EMA lengths 21 and below.
As an added filter to confirm the trend, a second EMA can be used. Inputting a slower EMA filter can ensure trades are entered in accordance with longer term trends, inputting a faster EMA filter can act as confirmation of breakout strength.
Bar coloring can be enabled to quickly visually identify a trend's direction for confluence with other indicators or strategies.
The goods:
Waiting for the trend to flip before closing a trade (especially when a longer base EMA is used) often leaves money on the table. This script combines a number of ways to identify when a trend is exhausted for backtesting the best early exits.
"Delayed bars inside middle bands" - When a number of candle's in a row open and close between the middle EMA bands, it could be a sign the trend is weak, or that the breakout was not the start of a new trend. Selecting this will close out positions after a number of bars has passed
"Leledc bars" - Originally introduced by glaz, this is a price action indicator that highlights a candle after a number of bars in a row close the same direction and result in greatest high/low over a period. It often triggers when a strong trend has paused before further continuation, or it marks the end of a trend. To mitigate closing on false Leledc signals, this strategy has two options: 1. Introducing requirement for increased volume on the Leledc bars can help filter out Leledc signals that happen mid trend. 2. Closing after a number of Leledc bars appear after position opens. These two options work great in isolation but don't perform well together in my testing.
"Bollinger Bands exhaustion bars" - These bars are highlighted when price closes back inside the Bollinger Bands and RSI is within specified overbought/sold zones. The idea is that a trend is overextended when price trades beyond the Bollinger Bands. When price closes back inside the bands it's likely due for mean reversion back to the base EMA in which this strategy will ideally re-enter a position. Since the added RSI requirements often make this indicator too strict to trigger a large enough sample size to backtest, I've found it best to use "non-standard" settings for both the bands and the RSI as seen in the default settings.
"Buy/Sell zones" - Similar to the idea behind using Bollinger Bands exhaustion bars as a closing signal. Instead of calculating off of standard deviations, the Buy/Sell zones are calculated off multiples of the middle EMA bands. When trading beyond these zones and subsequently failing back inside, price may be due for mean reversion back to the base EMA. No RSI filter is used for Buy/Sell zones.
If any early close conditions are selected, it's often worth enabling trade re-entry on "middle EMA band bounce". Instead of waiting for a candle to close back inside the middle EMA bands, this feature will re-enter position on only a wick back into the middle bands as will sometimes happen when the trend is strong.
Any and all of the early close conditions can be combined. Experimenting with these, I've found can result in less net profit but higher win-rates and sharpe ratios as less time is spent in trades.
The deadly:
The trend is your friend. But wouldn't it be nice to catch the trends early? In ranging markets (or when using slower base EMAs in this strategy), waiting for confirmation of a breakout of the EMA bands at best will cause you to miss half the move, at worst will result in getting consistently chopped up. Enabling "counter-trend" trades on this strategy will allow the strategy to enter positions on the opposite side of the EMA bands on either a Leledc bar or Bollinger Bands exhaustion bar. There is a filter requiring either a high/low (for Leledc) or open (for BB bars) outside the selected inner or outer Buy/Sell zone. There are also a number of different close conditions for the counter-trend trades to experiment with and backtest.
There are two ways I've found best to use counter-trend trades
1. Mean reverting scalp trades when a trend is clearly overextended. Selecting from the first 5 counter-trend closing conditions on the dropdown list will usually close the trades out quickly, with less profit but less risk.
2. Trying to catch trends early. Selecting any of the close conditions below the first 5 can cause the strategy to behave as if it's entering into a new trend (from the wrong side).
This feature can be deadly effective in profiting from every move price makes, or deadly to the strategy's PnL if not set correctly. Since counter-trend trades open opposite the middle bands, a stop-loss is recommended to reduce risk. If stop-losses for counter-trend trades are disabled, the strategy will hold a position open often until liquidation in a trending market if th trade is offsides. Note that using a slower base EMA makes counter-trend stop-losses even more necessary as it can reduce the effectiveness of the Buy/Sell zone filter for opening the trades as price can spend a long time trending outside the zones. If faster EMAs (34 and below) are used with "Inner" Buy/Zone filter selected, the first few closing conditions will often trigger almost immediately closing the trade at a loss.
The niche:
I've added a feature to default into longs or shorts. Enabling these with other features (aside from the basic long/short on EMA middle band breakout) tends to break the strategy one way or another. Enabling default long works to simulate trying to acquire more of the asset rather than the base currency. Enabling default short can have positive results for those high FDV, high inflation coins that go down-only for months at a time. Otherwise, I use default short as a hedge for coins that I hold and stake spot. I gain the utility and APR of staking while reducing the risk of holding the underlying asset by maintaining a net neutral position *most* of the time.
Disclaimer:
This script is intended for experimenting and backtesting different strategies around EMA bands. Use this script for your live trading at your own risk. I am a rookie coder, as such there may be errors in the code that cause the strategy to behave not as intended. As far as I can tell it doesn't repaint, but I cannot guarantee that it does not. That being said if there's any question, improvements, or errors you've found, drop a comment below!

Robrechtian Long-Medium Breakout Trend SystemRobrechtian Long–Medium-Term Breakout Trend System
A professional, rule-based trend-following strategy designed to capture large, sustained price movements using pure price action and breakouts.
This system follows long-established trend-following philosophy: no prediction, no volatility targeting, and no profit targets. Only disciplined entries, position additions, and exits driven entirely by trend structure.
Core Principles
Breakout-driven entries: Initial positions are taken only when price breaks above/below the 80-day Donchian channel, confirming a long–medium-term trend shift.
Short-term confirmation: Breakouts must also exceed the 20-day channel, reducing false positives.
Trend-direction filter: A 50-day moving average slope filter ensures alignment with the broader trend.
Explosive bar filter: Entries avoid excessively large, single-candle expansions (>2.5× ATR(20)) to prevent chasing exhaustion spikes.
Pyramiding into strength: Additional units are added only when price makes fresh 20-day breakouts in the direction of the trend. No scaling out. No adding on dips.
Exit only on trend violation: Positions are closed exclusively when price breaks the opposite 80-day channel. This preserves unlimited upside while enforcing disciplined exits.
Pure trend philosophy: No volatility targeting, no smoothing, no discretionary overrides, no optimization for short-term performance.
Intended Use
This system is designed primarily for diversified futures portfolios, where diversification across dozens of globally liquid markets creates robustness and stability. However, it may also be used on individual assets for educational and analytical purposes.
The system embraces the core trend-following logic:
Small losses, big winners, and unlimited upside when trends persist.
⚠️ WARNINGS / DISCLAIMERS
⚠️ Warning 1 — This strategy is not optimized for single stocks
The Robrechtian Trend System is designed for multi-asset futures portfolios, not single equities.
Performance on individual tickers may vary greatly due to lack of diversification.
⚠️ Warning 2 — Trend following includes substantial drawdowns
Deep drawdowns are a normal and expected feature of all long-term trend-following systems.
The strategy does not attempt to smooth returns or manage volatility.
If you seek steady, low-volatility equity curves, this system is not suitable.
⚠️ Warning 3 — No volatility targeting or risk smoothing
This system intentionally avoids volatility-based position sizing.
Trades may experience larger fluctuations than systems using risk parity or vol targeting.
⚠️ Warning 4 — Not financial advice
This script is for educational and research purposes only.
Past performance does not guarantee future results.
Use at your own risk.
⚠️ Warning 5 — TradingView backtests have known limitations
TradingView does not simulate:
futures contract roll logic
slippage
real bid/ask spreads
liquidity conditions
limit-up/limit-down behavior
Results may vary from live market execution.

Zero Lag Trend Signals (MTF) [Quant Trading] V7Overview
The Zero Lag Trend Signals (MTF) V7 is a comprehensive trend-following strategy that combines Zero Lag Exponential Moving Average (ZLEMA) with volatility-based bands to identify high-probability trade entries and exits. This strategy is designed to reduce lag inherent in traditional moving averages while incorporating dynamic risk management through ATR-based stops and multiple exit mechanisms.
This is a longer term horizon strategy that takes limited trades. It is not a high frequency trading and therefore will also have limited data and not > 100 trades.
How It Works
Core Signal Generation:
The strategy uses a Zero Lag EMA (ZLEMA) calculated by applying an EMA to price data that has been adjusted for lag:
Calculate lag period: floor((length - 1) / 2)
Apply lag correction: src + (src - src )
Calculate ZLEMA: EMA of lag-corrected price
Volatility bands are created using the highest ATR over a lookback period multiplied by a band multiplier. These bands are added to and subtracted from the ZLEMA line to create upper and lower boundaries.
Trend Detection:
The strategy maintains a trend variable that switches between bullish (1) and bearish (-1):
Long Signal: Triggers when price crosses above ZLEMA + volatility band
Short Signal: Triggers when price crosses below ZLEMA - volatility band
Optional ZLEMA Trend Confirmation:
When enabled, this filter requires ZLEMA to show directional momentum before entry:
Bullish Confirmation: ZLEMA must increase for 4 consecutive bars
Bearish Confirmation: ZLEMA must decrease for 4 consecutive bars
This additional filter helps avoid false signals in choppy or ranging markets.
Risk Management Features:
The strategy includes multiple stop-loss and take-profit mechanisms:
Volatility-Based Stops: Default stop-loss is placed at ZLEMA ± volatility band
ATR-Based Stops: Dynamic stop-loss calculated as entry price ± (ATR × multiplier)
ATR Trailing Stop: Ratcheting stop-loss that follows price but never moves against position
Risk-Reward Profit Target: Take-profit level set as a multiple of stop distance
Break-Even Stop: Moves stop to entry price after reaching specified R:R ratio
Trend-Based Exit: Closes position when price crosses EMA in opposite direction
Performance Tracking:
The strategy includes optional features for monitoring and analyzing trades:
Floating Statistics Table: Displays key metrics including win rate, GOA (Gain on Account), net P&L, and max drawdown
Trade Log Labels: Shows entry/exit prices, P&L, bars held, and exit reason for each closed trade
CSV Export Fields: Outputs trade data for external analysis
Default Strategy Settings
Commission & Slippage:
Commission: 0.1% per trade
Slippage: 3 ticks
Initial Capital: $1,000
Position Size: 100% of equity per trade
Main Calculation Parameters:
Length: 70 (range: 70-7000) - Controls ZLEMA calculation period
Band Multiplier: 1.2 - Adjusts width of volatility bands
Entry Conditions (All Disabled by Default):
Use ZLEMA Trend Confirmation: OFF - Requires ZLEMA directional momentum
Re-Enter on Long Trend: OFF - Allows multiple entries during sustained trends
Short Trades:
Allow Short Trades: OFF - Strategy is long-only by default
Performance Settings (All Disabled by Default):
Use Profit Target: OFF
Profit Target Risk-Reward Ratio: 2.0 (when enabled)
Dynamic TP/SL (All Disabled by Default):
Use ATR-Based Stop-Loss & Take-Profit: OFF
ATR Length: 14
Stop-Loss ATR Multiplier: 1.5
Profit Target ATR Multiplier: 2.5
Use ATR Trailing Stop: OFF
Trailing Stop ATR Multiplier: 1.5
Use Break-Even Stop-Loss: OFF
Move SL to Break-Even After RR: 1.5
Use Trend-Based Take Profit: OFF
EMA Exit Length: 9
Trade Data Display (All Disabled by Default):
Show Floating Stats Table: OFF
Show Trade Log Labels: OFF
Enable CSV Export: OFF
Trade Label Vertical Offset: 0.5
Backtesting Date Range:
Start Date: January 1, 2018
End Date: December 31, 2069
Important Usage Notes
Default Configuration: The strategy operates in its most basic form with default settings - using only ZLEMA crossovers with volatility bands and volatility-based stop-losses. All advanced features must be manually enabled.
Stop-Loss Priority: If multiple stop-loss methods are enabled simultaneously, the strategy will use whichever condition is hit first. ATR-based stops override volatility-based stops when enabled.
Long-Only by Default: Short trading is disabled by default. Enable "Allow Short Trades" to trade both directions.
Performance Monitoring: Enable the floating stats table and trade log labels to visualize strategy performance during backtesting.
Exit Mechanisms: The strategy can exit trades through multiple methods: stop-loss hit, take-profit reached, trend reversal, or trailing stop activation. The trade log identifies which exit method was used.
Re-Entry Logic: When "Re-Enter on Long Trend" is enabled with ZLEMA trend confirmation, the strategy can take multiple long positions during extended uptrends as long as all entry conditions remain valid.
Capital Efficiency: Default setting uses 100% of equity per trade. Adjust "default_qty_value" to manage position sizing based on risk tolerance.
Realistic Backtesting: Strategy includes commission (0.1%) and slippage (3 ticks) to provide realistic performance expectations. These values should be adjusted based on your broker and market conditions.
Recommended Use Cases
Trending Markets: Best suited for markets with clear directional moves where trend-following strategies excel
Medium to Long-Term Trading: The default length of 70 makes this strategy more appropriate for swing trading rather than scalping
Risk-Conscious Traders: Multiple stop-loss options allow traders to customize risk management to their comfort level
Backtesting & Optimization: Comprehensive performance tracking features make this strategy ideal for testing different parameter combinations
Limitations & Considerations
Like all trend-following strategies, performance may suffer in choppy or ranging markets
Default 100% position sizing means full capital exposure per trade - consider reducing for conservative risk management
Higher length values (70+) reduce signal frequency but may improve signal quality
Multiple simultaneous risk management features may create conflicting exit signals
Past performance shown in backtests does not guarantee future results
Customization Tips
For more aggressive trading:
Reduce length parameter (minimum 70)
Decrease band multiplier for tighter bands
Enable short trades
Use lower profit target R:R ratios
For more conservative trading:
Increase length parameter
Enable ZLEMA trend confirmation
Use wider ATR stop-loss multipliers
Enable break-even stop-loss
Reduce position size from 100% default
For optimal choppy market performance:
Enable ZLEMA trend confirmation
Increase band multiplier
Use tighter profit targets
Avoid re-entry on trend continuation
Visual Elements
The strategy plots several elements on the chart:
ZLEMA line (color-coded by trend direction)
Upper and lower volatility bands
Long entry markers (green triangles)
Short entry markers (red triangles, when enabled)
Stop-loss levels (when positions are open)
Take-profit levels (when enabled and positions are open)
Trailing stop lines (when enabled and positions are open)
Optional ZLEMA trend markers (triangles at highs/lows)
Optional trade log labels showing complete trade information
Exit Reason Codes (for CSV Export)
When CSV export is enabled, exit reasons are coded as:
0 = Manual/Other
1 = Trailing Stop-Loss
2 = Profit Target
3 = ATR Stop-Loss
4 = Trend Change
Conclusion
Zero Lag Trend Signals V7 provides a robust framework for trend-following with extensive customization options. The strategy balances simplicity in its core logic with sophisticated risk management features, making it suitable for both beginner and advanced traders. By reducing moving average lag while incorporating volatility-based signals, it aims to capture trends earlier while managing risk through multiple configurable exit mechanisms.
The modular design allows traders to start with basic trend-following and progressively add complexity through ZLEMA confirmation, multiple stop-loss methods, and advanced exit strategies. Comprehensive performance tracking and export capabilities make this strategy an excellent tool for systematic testing and optimization.
Note: This strategy is provided for educational and backtesting purposes. All trading involves risk. Past performance does not guarantee future results. Always test thoroughly with paper trading before risking real capital, and adjust position sizing and risk parameters according to your risk tolerance and account size.
================================================================================
TAGS:
================================================================================
trend following, ZLEMA, zero lag, volatility bands, ATR stops, risk management, swing trading, momentum, trend confirmation, backtesting
================================================================================
CATEGORY:
================================================================================
Strategies
================================================================================
CHART SETUP RECOMMENDATIONS:
================================================================================
For optimal visualization when publishing:
Use a clean chart with no other indicators overlaid
Select a timeframe that shows multiple trade signals (4H or Daily recommended)
Choose a trending asset (crypto, forex major pairs, or trending stocks work well)
Show at least 6-12 months of data to demonstrate strategy across different market conditions
Enable the floating stats table to display key performance metrics
Ensure all indicator lines (ZLEMA, bands, stops) are clearly visible
Use the default chart type (candlesticks) - avoid Heikin Ashi, Renko, etc.
Make sure symbol information and timeframe are clearly visible
================================================================================
COMPLIANCE NOTES:
================================================================================
✅ Open-source publication with complete code visibility
✅ English-only title and description
✅ Detailed explanation of methodology and calculations
✅ Realistic commission (0.1%) and slippage (3 ticks) included
✅ All default parameters clearly documented
✅ Performance limitations and risks disclosed
✅ No unrealistic claims about performance
✅ No guaranteed results promised
✅ Appropriate for public library (original trend-following implementation with ZLEMA)
✅ Educational disclaimers included
✅ All features explained in detail
================================================================================

VWAP Trend Strategy (Intraday) [KedarArc Quant]Description:
An intraday strategy that anchors to VWAP and only trades when a local EMA trend gate and a volume participation gate are both open. It offers two entry templates—Cross and Cross-and-Retest—with an optional Momentum Exception for impulsive moves. Exits combine a TrendBreak (structure flips) with an ATR emergency stop (risk cap).
Updates will be published under this script.
Why this merits a new script
This is not a simple “VWAP + EMA + ATR” overlay. The components are sequenced as gates and branches that *change the trade set* in ways a visual mashup cannot:
1. Trend Gate first (EMA fast vs. slow on the entry timeframe)
Counter-trend VWAP crosses are suppressed. Many VWAP scripts fire on every cross; here, no entry logic even evaluates unless the trend gate is open.
2. Participation Gate second (Volume SMA × multiplier)
This gate filters thin liquidity moves around VWAP. Without it, the same visuals would produce materially more false triggers.
3. Branching entries with structure awareness
* Cross: Immediate VWAP cross in the trend direction.
* Cross-and-Retest: Requires a revisit to VWAP vicinity within a lookback window (recent low near VWAP for longs; recent high for shorts). This explicitly removes first-touch fakeouts that a plain cross takes.
* Momentum Exception (optional): A quantified body% + volume condition can bypass the retest when flow is impulsive—intentional risk-timing, not “just another indicator.”
4. Dual exits that reference both anchor and structure
* TrendBreak: Close only when price loses VWAP and EMA alignment flips.
* ATR stop: Placed at entry to cap tail risk.
These exits complement the entry structure rather than being generic stop/target add-ons.
What it does
* Trades the session’s fair value anchor (VWAP), but only with local-trend agreement (EMA fast vs. slow) and sufficient participation (volume filter).
* Lets you pick Cross or Cross-and-Retest entries; optionally allow a fast Momentum Exception when candles expand with volume.
* Manages positions with a structure exit (TrendBreak) and an emergency ATR stop from entry.
How it works (concepts & calculations)
* VWAP (session anchor):
Standard VWAP of the active session; entries reference the cross and the retest proximity to VWAP.
* Trend gate:
Long context only if `EMA(fast) > EMA(slow)`; short only if `EMA(fast) < EMA(slow)`.
A *gate*, not a trigger—entries aren’t considered unless this is true.
* Participation (volume) gate:
Require `volume > SMA(volume, volLen) × volMult`.
Screens out low-participation wiggles around VWAP.
Entries:
* Cross: Price crosses VWAP in the trend direction while volume gate is open.
* Cross-and-Retest: After crossing, price revisits VWAP vicinity within `lookback` (recent *low near VWAP* for longs; recent *high near VWAP* for shorts).
* Momentum Exception (optional): If body% (|close−open| / range) and volume exceed thresholds, enter without waiting for the retest.
Exits:
* TrendBreak (structure):
* Longs close when `price < VWAP` and `EMA(fast) < EMA(slow)` (mirror for shorts).
* ATR stop (risk):
* From entry: `stop = entry ± ATR(atrLen) × atrMult`.
How to use it ?
1. Select market & timeframe: Intraday on liquid symbols (equities, futures, crypto).
2. Pick entry mode:
* Start with Cross-and-Retest for fewer, more selective signals.
* Enable Momentum Exception if strong moves leave without retesting.
3. Tune guards:
* Raise `volMult` to ignore thin periods; lower it for more activity.
* Adjust `lookback` if retests come late/early on your symbol.
4. Risk:
* `atrLen` and `atrMult` set the emergency stop distance.
5. Read results per session: Optional panel (if enabled) summarizes Net-R, Win%, and PF for today’s session to evaluate
behavior regime by regime.
⚠️ Disclaimer
This script is provided for educational purposes only.
Past performance does not guarantee future results.
Trading involves risk, and users should exercise caution and use proper risk management when applying this strategy.

Oscillator Price Divergence & Trend Strategy (DPS) // AlgoFyreThe Oscillator Price Divergence & Trend Strategy (DPS) strategy combines price divergence and trend indicators for trend trading. It uses divergence conditions to identify entry points and a trend source for directional bias. The strategy incorporates risk management through dynamic position sizing based on a fixed risk amount. It allows for both long and short positions with customizable stop-loss and take-profit levels. The script includes visualization options for entry, stop-loss, and take-profit levels, enhancing trade analysis.
TABLE OF CONTENTS
🔶 ORIGINALITY
🔸Divergence-Trend Combination
🔸Dynamic Position Sizing
🔸Customizable Risk Management
🔶 FUNCTIONALITY
🔸Indicators
🞘 Trend Indicator
🞘 Oscillator Source
🔸Conditions
🞘 Long Entry
🞘 Short Entry
🞘 Take Profit
🞘 Stop Loss
🔶 INSTRUCTIONS
🔸Adding the Strategy to the Chart
🔸Configuring the Strategy
🔸Backtesting and Practice
🔸Market Awareness
🔸Visual Customization
🔶 CONCLUSION
▅▅▅▅▅▅▅▅▅▅▅▅▅▅▅▅▅▅▅▅▅▅▅▅▅▅▅▅▅▅▅▅▅▅▅▅▅▅▅▅▅▅▅▅▅
🔶 ORIGINALITY The Divergence Trend Trading with Dynamic Position Sizing strategy uniquely combines price divergence indicators with trend analysis to optimize entry and exit points. Unlike static trading strategies, it employs dynamic position sizing based on a fixed risk amount, ensuring consistent risk management. This approach allows traders to adapt to varying market conditions by adjusting position sizes according to predefined risk parameters, enhancing both flexibility and control in trading decisions. The strategy's integration of customizable stop-loss and take-profit levels further refines its risk management capabilities, making it a robust tool for both trending and volatile markets.
🔸Divergence-Trend Combination By combining trend direction with divergence conditions, the strategy enhances the accuracy of entry signals, aligning trades with prevailing market trends.
🔸Dynamic Position Sizing This strategy calculates position sizes dynamically, based on a fixed risk amount, allowing traders to maintain consistent risk exposure across trades.
🔸Customizable Risk Management Traders can set flexible risk-reward ratios and adjust stop-loss and take-profit levels, tailoring the strategy to their risk tolerance and market conditions.
🔶 FUNCTIONALITY The Divergence Trend Trading with Dynamic Position Sizing strategy leverages a combination of trend indicators and price and oscillator divergences to identify optimal trading opportunities. This strategy is designed to capitalize on medium to long-term price movements and works best on h1, h4 or D1 timeframes. It allows traders to manage risk effectively while taking advantage of both long and short positions.
🔸Indicators 🞘 Trend Indicator: A long trend is used to determine market direction, ensuring trades align with prevailing trends.
Recommendation: We recommend using the Adaptive MAs (Hurst, CVaR, Fractal) // AlgoFyre indicator with the following settings for trend detection. However, you can use any trend indicator that suits your trading style, e.g. an EMA 200.
🞘 Oscillator Source: The oscillator source is used for momentum price divergence identification. Any momentum oscillator can be used, e.g. RSI, Stochastic etc. A good oscillator is the Stochastic with the following settings:
🔸Conditions 🞘 Long Entry: A long entry condition is met if price closes above the trend AND selected divergence conditions are met, e.g. regular bullish divergence with a 10 bar lookback period with the divergence being below the 50 point mean. If the info table shows all 3 columns in the same color, the entry conditions are met and a position is opened.
🞘 Short Entry: A short entry condition is met if price closes below the trend AND selected divergence conditions are met, e.g. regular bearish divergence with a 10 bar lookback period with the divergence being above the 50 point mean.
🞘 Take Profit: Take Profit is determined by the Risk to Reward Ratio settings depending on the price distance between the entry price and the stop loss price, e.g. if stop loss is 1% away from entry and Risk Reward Ratio is 3:1 then Take Profit will be set at 3% from entry.
🞘 Stop Loss: Stop loss is a fixed level away from the trend source. For long positions, stop loss is set below the trend, and for short positions, above the trend.
🔶 INSTRUCTIONS The Divergence Trend Trading with Dynamic Position Sizing strategy can be set up by adding it to your TradingView chart and configuring parameters such as the oscillator source, trend source, and risk management settings. This strategy is designed to capitalize on short-term price movements by dynamically adjusting position sizes based on predefined risk parameters. Enhance the accuracy of signals by combining this strategy with additional indicators like trend-following or momentum-based tools. Adjust settings to better manage risk and optimize entry and exit points.
🔸Adding the Strategy to the Chart:
Go to your TradingView chart.
Click on the "Indicators" button at the top.
Search for "Divergence Trend Trading with Dynamic Position Sizing // AlgoFyre" in the indicators list.
Click on the strategy to add it to your chart.
🔸Configuring the Strategy:
Open the strategy settings by clicking on the gear icon next to its name on the chart.
Oscillator Source: Select the source for the oscillator. An oscillator like Stochastic needs to be attached to the chart already in order to be used as an oscillator source to be selectable.
Trend Source: Choose the trend source to determine market direction. A trend indicator like Adaptive MAs (Hurst, CVaR, Fractal) // AlgoFyre needs to be attached to the chart already in order to be used as a trend source to be selectable.
Stop Loss Percentage: Set the stop loss distance from the trend source as a percentage.
Risk/Reward Ratio: Define the desired risk/reward ratio for trades.
🔸Backtesting and Practice:
Backtest the strategy on historical data to understand how it performs in various market environments.
Practice using the strategy on a demo account before implementing it in live trading.
🔸Market Awareness:
Keep an eye on market news and events that might cause extreme price movements. The strategy reacts to price data and might not account for news-driven events that can cause large deviations.
🔸Visual Customization Visualization Settings: Customize the display of entry price, take profit, and stop loss levels.
Color Settings: Switch to the AlgoFyre theme or set custom colors for bullish, bearish, and neutral states.
Table Settings: Enable or disable the information table and adjust its position.
🔶 CONCLUSION
The Divergence Trend Trading with Dynamic Position Sizing strategy provides a robust framework for capitalizing on short-term market trends by combining price divergence with dynamic position sizing. This strategy leverages divergence conditions to identify entry points and utilizes a trend source for directional bias, ensuring trades align with prevailing market conditions. By incorporating dynamic position sizing based on a fixed risk amount, traders can effectively manage risk and adapt to varying market conditions. The strategy's customizable stop-loss and take-profit levels further enhance its risk management capabilities, making it a versatile tool for both trending and volatile markets. With its strategic blend of technical indicators and risk management, the Divergence Trend Trading strategy offers traders a comprehensive approach to optimizing trade execution and maximizing potential returns.
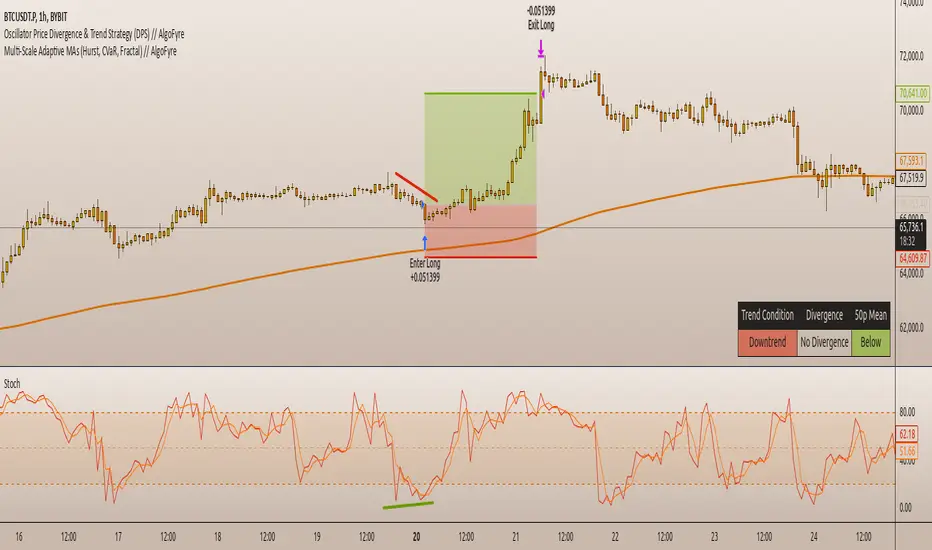
Alligator + MA Trend Catcher [TradeDots]The "Alligator + MA Trend Catcher" is a trading strategy that integrates the William Alligator indicator with a Moving Average (MA) to establish robust entry and exit conditions, optimized for capturing trends.
HOW IT WORKS
This strategy combines the traditional William Alligator set up with an additional Moving Average indicator for enhanced trend confirmation, creating a user-friendly backtesting tool for traders who prefer the Alligator method.
The original Alligator strategy can frequently present fluctuations, even in well-established trends, leading to potentially premature exits. To mitigate this, we incorporate a Moving Average as a secondary confirmation measure to ensure the market trend has indeed shifted.
Here’s the operational flow for long orders:
Entry Signal: When the price rises above the Moving Average, it confirms a bullish market state. Enter if Alligator spread in an upward direction. The trade remains active even if the Alligator indicator suggests a trend reversal.
Exit Signal: The position is closed when the price falls below the Moving Average, and the Alligator spreads in the downward direction. This setup helps traders to maintain positions through the entirety of the trend for maximum gain.
APPLICATION
This strategy is tailored for assets with significant, well-defined trends, such as Bitcoin and Ethereum, which are known for their high volatility and substantial price movements.
This strategy offers a low win-rate but high reward configuration, making asset selection critical for long-term profitability. If you choose assets that lack strong price momentum, there's a high chance that this strategy may not be effective.
For traders seeking to maximize gains from large trends without exiting prematurely, this strategy provides an aggressive yet controlled approach to riding out substantial market waves.
DEFAULT SETUP
Commission: 0.01%
Initial Capital: $10,000
Equity per Trade: 80%
RISK DISCLAIMER
Trading entails substantial risk, and most day traders incur losses. All content, tools, scripts, articles, and education provided by TradeDots serve purely informational and educational purposes. Past performances are not definitive predictors of future results.

FluxFilter Trend Strategy [BITsPIP]Hello fellow traders, I'm excited to share with you the FluxFilter Trend Strategy, a trading approach I've developed for those interested in exploring trend-following strategies. My goal was to create something straightforward and accessible, so traders looking to refine their portfolios can easily integrate its features. By the end of this guide, I hope you'll have a solid grasp of how the FluxFilter Trend Strategy functions, appreciate its benefits, understand its potential drawbacks, and see how it might fit into various trading contexts.
I) Overview
The FluxFilter Trend Strategy is tailored to align with the market's long-term trend. It examines the price data from the previous year to gauge the market's overall trajectory by employing moving averages. Subsequently, within shorter timeframes, the strategy utilizes a combination of modified Supertrend, Hull Suite, and various trend-following and filtering techniques to generate buy or sell signals. Although its advanced take profit and stop loss mechanisms might initially present a learning curve, they are integral to the strategy's effectiveness. They are designed to secure gains by capturing prevailing trends and mitigating the impact of false reversal signals.
II) Deep Backtesting
Deep backtesting stands as a cornerstone in the development of trading strategies, offering a robust method for traders to assess the performance of their strategy against historical data. This process yields a retrospective view, illustrating how the strategy might have navigated through past market fluctuations, thereby shedding light on its potential robustness and areas for refinement. However, it's crucial to acknowledge that a strategy's performance can be influenced by a myriad of factors including market dynamics, the chosen timeframe, and the inherent attributes of the traded asset. Consequently, it's advisable to conduct thorough backtesting under various conditions to ascertain the strategy's reliability before applying it to actual trading scenarios.
III) Benefits
A primary advantage of the FluxFilter Trend Strategy is its proficiency in discerning genuine market trends from mere price fluctuations, thereby avoiding premature or uncertain trades. Unlike approaches that take high risks on speculative trades, this strategy prioritizes a high degree of confidence in the direction of the trade. It meticulously waits for a clear confirmation of the market trend. Once this certainty is established, the strategy promptly generates trade signals, ensuring that traders are positioned to capitalize on optimal market entry points without delay. This approach not only enhances the potential for profit but also aligns with a disciplined and methodical trading ethos.
IV) Applications
FluxFilter Trend Strategy can be applied across various timeframes, with a particular efficacy in those under 15 minutes. Its adaptable framework means it can be customized to cater to a variety of asset classes, encompassing stocks, commodities, forex, and cryptocurrencies. Initially, the strategy was specifically calibrated for low-volatile cryptocurrencies, as reflected in the default settings for stop loss and take profit values. It's important to recognize that the unique volatility and trend patterns of your selected market necessitate careful adjustments to these parameters. This fine-tuning of profit targets and stop loss thresholds is crucial for aligning the strategy with the specific dynamics of your chosen market, which I will discuss shortly.
V) Strategy's Logic
1. Trend Identification: My conviction lies in the power of trend trading to yield long-term gains. Central to the FluxFilter Trend Strategy is the Hull Suite indicator, a tool developed by InSilico, serving as one of the confirmation indicators. This indicator acts as a compass for trend direction; a price residing above the Hull Suite line signals an uptrend, potentially marking an entry point for a buy position or confirming it. In contrast, a price positioned below this line suggests a downtrend, potentially indicating a strategic moment to sell or confirming the sell.
2. Noise Reduction: The financial markets are known for their 'noise'—short-lived price movements that can obscure the true market direction. The FluxFilter Trend Strategy is designed to sift through this noise, thereby facilitating more lucid and informed trading decisions. It employs a set of straightforward yet innovative techniques to single out significant misleading fluctuations. This is achieved by analyzing recent bars to spot bars with unusually large bodies, which often represent misleading market noise.
3. Risk Management: A key facet of the strategy is its emphasis on pragmatic risk management. Traders are empowered to establish practical stop-loss and take-profit levels, tailoring these crucial parameters to the specific market they are engaging in. This customization is instrumental in optimizing long-term profitability, ensuring that the strategy adapts fluidly to the unique characteristics and volatility patterns of different trading environments.
VI) Strategy's Input Settings and Default Values
1. Modified Supertrend
i. Factor: Serving as a multiplier in the Average True Range (ATR) calculation, this parameter adjusts the distance of the Supertrend line relative to the price chart. Elevating the factor value widens the gap between the Supertrend line and price, offering a more conservative stance. On the flip side, diminishing the factor value pulls the Supertrend line closer to the price action, heightening its sensitivity. While the preset value is 1, you have the flexibility to modify this to suit your trading approach.
ii. ATR Length: This defines the count of bars that are incorporated into the ATR computation, directly influencing the Supertrend's adaptability to market changes. With a default setting of 30 bars, it strikes a balance, smoothing over short-term fluctuations while maintaining a meaningful sensitivity to market trends. Adjusting this parameter allows you to tailor the indicator's responsiveness to suit your trading strategy, considering the volatility and behavioral patterns of the asset you are trading.
2. Hull Suite
i. Hull Suite Length: Designed for capturing long-term trends, the Hull Suite Length is configured at 1000. Functioning comparably to moving averages, the Hull Suite features upper and lower bands, though these are not employed in our current strategy.
ii. Length Multiplier: It's advisable to maintain a minimal value for the Length Multiplier, prioritizing the optimization of the Hull Suite Length. Presently, it is set to 1.
3. Filtering Indicators
i. Fluctuation Filtering Percentage: It's advisable to set this parameter to ten times the size of the average bar in your specific market, as this helps effectively mitigate the impact of market fluctuations. While the initial default is 0.4(%), based on the BTCUSDT market, it's crucial to adjust this figure to align with the characteristics of different assets or markets you're trading in.
ii. Fluctuation Filtering Bars: This parameter designates the count of preceding bars to consider when assessing market fluctuations. It's fully customizable, allowing you to tailor it based on your market insights. The preset default is 3, a balance chosen to minimize susceptibility to potentially misleading signals.
iii. Trend Confirmation Percentage: This metric is pivotal for verifying the viability of a trend post-entry. If the trade doesn't achieve this percentage in profit, it indicates a deviation from the expected trend. Under such circumstances, it may be prudent to exit the trade prematurely rather than awaiting the stop-loss trigger. It's recommended to set this parameter at half the size of the average candle body for the market you're analyzing. The initial default is set at 0.2(%).
4. StopLoss and TakeProfit
i. StopLoss and TakeProfit Settings: Two distinct approaches are available. Semi-Automatic StopLoss/TakeProfit Setting and Manual StopLoss/TakeProfit Setting. The Semi-Automatic mode streamlines the process by allowing you to input values for a 5-minute timeframe, subsequently auto-adjusting these values across various timeframes, both lower and higher. Conversely, the Manual mode offers full control, enabling you to meticulously define TakeProfit values for each individual timeframe.
ii. TakeProfit Threshold # and TakeProfit Value #: Imagine this mechanism as an ascending staircase. Each step represents a range, with the lower boundary (TakeProfit Value) designed to close the trade upon being reached, and the upper boundary (TakeProfit Threshold) upon being hit, propelling the trade to the next level, and forming a new range. This stair-stepping approach enhances risk management and has the potential to increase profitability. The pre-set configurations are tailored for volatile markets, such as BTCUSDT. It's advisable to devote time to tailoring these settings to your specific market, aiming to achieve optimal results based on backtesting.
iii. StopLoss Value: In line with its name, this value marks the limit of loss you're prepared to accept should the market trend go against your expectations. It's crucial to note that once your asset reaches the first TakeProfit range, the initial StopLoss value becomes obsolete, supplanted by the first TakeProfit Value. The default StopLoss value is pegged at 1.8(%), a figure worth considering in your trading strategy.
VII) Entry Conditions
The principal element that triggers the signal is the Modified Supertrend. Additional indicators serve as confirmatory tools. Nonetheless, to refine your strategy effectively, it's crucial to fine-tune the parameters. This involves adjusting input variables such as take profit levels, threshold parameters, and the filtering values discussed previously.
VIII) Exit Conditions
The strategy stipulates exit conditions primarily governed by stop loss and take profit parameters. On infrequent occasions, if the trend lacks confirmation post-entry, the strategy mandates an exit upon the issuance of a reverse signal (whether confirmed or unconfirmed) by the strategy itself.
Good Luck!!

METRIC-TREND-TRADERThis script is a Fully Automated trading script meant to be used with "Oanda" broker and the plug-ins for algorithmic trading automation.( FOREX ONLY)
This script is meant to capture "TREND FOLLOWING " for intraday charts (1hour) preferably and will hold for days / weeks .trading on forex markets.
(The combination of indicators includes a short high and low price channel and a longer term high and low price channel)
This script is original in description as being automated to try and capture dynamic trending markets with both long and short fractal price channels. although trend trading is not an original concept. trend trading with this dynamic indicator allows the user visualize both short term and longer term price action at the same time, helping to make better trading decisions. the channels are designed to buy breakouts in the direction of the longer term trend while trailing stop a built-in stop loss that allows normal market movement while attempting to lock in flexible profits.
The concept of this indicator is be able to quickly visualize trends by high lighting the large green areas beneath price "when trending long" which is the difference between the (user defined) short term lows and the (user defined) Long period price lows.
For "down trending" markets a large red area above price will be displayed and this is the difference between the (user defined) short term highs and the (user defined) long term highs.
This strategy uses a lower than reward profile to jump in direction of market moves for continuation,
(1 risk to 4 reward)
in the likelihood the instrument will continue (example) 200 pips before it reverts 50 pips in the counter direction.
This strategy should only be used in markets that you believe are "TRENDING" at the time of trading otherwise you risk trend trading a range market.
This script uses a (user defined period) of short term high and low price ( green/red color) and (user defined period) Long Term high and low price (green/red) chosen in the indicator settings menu.
The default parameters are 10 with a (minimum of 1 and maximum of 10000) for the short term channel and 50 with a (minimum of 1 and maximum of 10000) for the long term price channel , the default parameters = roughly 2 days "long term" and 10 hours "short term" of price action on the (1 hour) chart.
Strategy entries and exits , for Long trades the trade will be entered if the short term high crosses above the Long Term high and the Short term low is not equal to the Long term low . the trade will exit if profit or stop loss are hit or if the Short term low crosses under the long term low.
For Short trades the trade will enter short if , the short term low crosses under the long term low and the short term high is not equal to the long term high. the trade will exit if profit or stop loss are hit or the short term high crosses over the long term high
"The default parameters should be kept unless you fully understand the complete strategy"
There are two very important inputs to be selected at the user setting menu "Long Only " and "Short Only" if you are looking to place long trades only select "Long Only" or for short trades select " Short Only" it is not recommended to keep both selected as it will trade both sides!
When the trade is entered a red , a blue and green horizontal dotted line will appear on the chart.
the blue line is the strategy entry price , the red line is the stop loss price , and the green line is the take profit price . the colors will invert if the trade is long or short.
(Setting alerts should be done in the indicator settings menu, and the parameters you chose will determine the stop loss/target and the amount of "units = (position size)" you wish to trade for the (forex only) markets. using "alert() function calls only" is the only alert that should be used with this strategy.
(note : when "alert() function calls only" is set two messages will be sent, one closing any open position in the opposite direction and one placing the new order regardless if you are currently in a trade or not)
Trade targets , stoploss and trade position size are a user defined variables entered in the indicator settings menu. (target pips minimum 0 and a maximum of 1000)(stop pips minimum of 0 and maximum of 1000)
Back test date range is included in the script for back testing different data periods.
the back ground will be colored a transparent navy blue if the period you are looking trading is with in the date range( note: to place live trades the end date will need to be in the future)
this is also adjustable in the settings menu
The avoid spread filter is a user defined time in which the spread is typically higher than average, applying this filter avoids trades in the specified time. When this filter is applied there will be a transparent red back ground color in the specified time.
Back test default setting are equivocal to OANDA:USDJPY
at the time of this publication placing trades with the "Oanda" broker are as follows , USD units = 2000 equal 2000 USD position size . "Oanda" current leverage is 20 to 1 for this particular pair and commission is paid in spread (1.4) pips = 0.19 USD per trade , Margin required for the trade is 100.0 USD , Position sizing = 10% of a 1000 USD account.
OANDA:USDJPY
