No Nonsense NNFX VP Strategy for Back Testing Indicators| jhAfter putting the whole system together, sat down to benchmark the various confirmation indicators, shrink it down to backtest individual confirmation indicators.
Results for 24 periods way better than 10, then again it's only one pair. :)
More details below.
//////////////////////////////////////////////////////////////////////////////////////////////////////////////////////////////////
//Designed per No Nonsense Forex VP rules
//For testing your individual indicators before the full system
//Originated from causecelebre
//Tried to put in as much VP rules as possible
///////////////////////////////////////////////////
//Rules Implemented:
///////////////////////////////////////////////////
// - SL 1.5 x ATR
// - TP 1 x ATR
//
// - Entry conditions
//// - Entry from 1 x confirmation
// - Exit conditions
//// - Exit on confirmation flip
///////////////////////////////////////////////////
//Trades entries
///////////////////////////////////////////////////
// - First entry L1 or S1 with standard SL and TP
///////////////////////////////////////////////////
//Included Indicators and settings
///////////////////////////////////////////////////
// - Confirmtion = SSL 10
///////////////////////////////////////////////////
//Credits
// Strategy causecelebre www.tradingview.com
// SSL Channel ErwinBeckers www.tradingview.com
//////////////////////////////////////////////////////////////////////////////////////////////////////////////////////////////////
//Change log
//First release. Testing of indicators
//////////////////////////////////////////////////////////////////////////////////////////////////////////////////////////////////
ค้นหาในสคริปต์สำหรับ "tp"

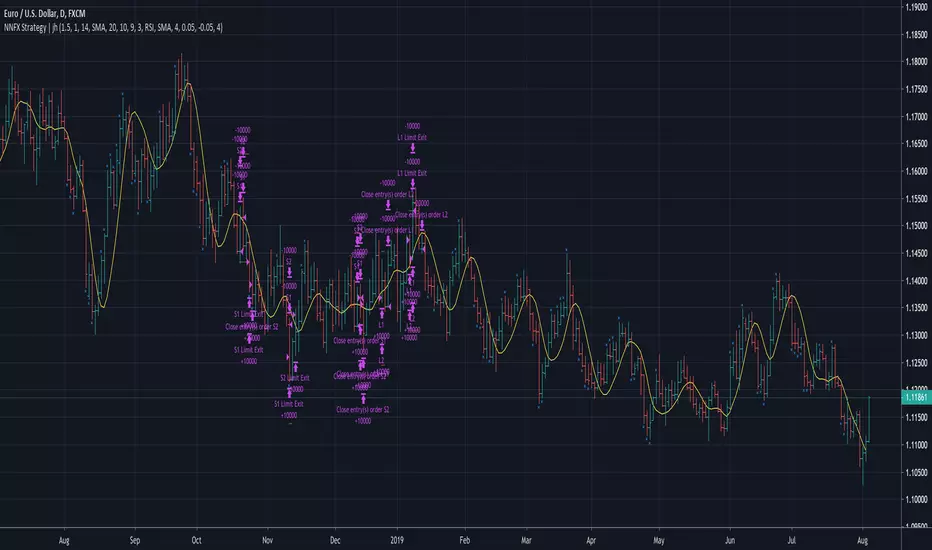
No Nonsense NNFX VP Strategy for Back Testing | jhMy first script, be kind :)
Most of the rules are implemented:
- Money management
- ATR, Baseline, Confirmation, Volume, Exit
More details below.
//////////////////////////////////////////////////////////////////////////////////////////////////////////////////////////////////
//////////////////////////////////////////////////////////////////////////////////////////////////////////////////////////////////
//Designed per No Nonsense Forex VP rules
//Made to be as modular as possible, so we can swap the indicators in and out.
//Originated from causecelebre
//Tried to put in as much VP rules as possible
///////////////////////////////////////////////////
//Rules Implemented:
///////////////////////////////////////////////////
// - SL 1.5 x ATR
// - TP 1 x ATR
//
// - Entry conditions
//// - Entry within 1 candles of baseline + 1 x confirmation + volume
//// - Entry only if baseline is < 1 x ATR
// - Exit conditions
//// - Exit on exit indicator or when baseline or confirmation flip
///////////////////////////////////////////////////
//Trades entries
///////////////////////////////////////////////////
// - First entry L1 or S1 with standard SL and TP
// - Second entry L2 or S2 with standard SL and exit upon the exit conditions
///////////////////////////////////////////////////
//Included Indicators and settings
///////////////////////////////////////////////////
// - Baseline = HMA 20
// - Confirmtion = SSL 10
// - Volume = TDFI 4
// - Exit = RVI 4
///////////////////////////////////////////////////
//Credits
// Strategy causecelebre
// TDFI causecelebre
// SSL Channel ErwinBeckers
//////////////////////////////////////////////////////////////////////////////////////////////////////////////////////////////////
//////////////////////////////////////////////////////////////////////////////////////////////////////////////////////////////////
Adaptive Zero Lag EMA [STUDY]A user has asked for the Study/Indicator version of this Strategy .
If you encounter the error "loop....>100ms" simply toggle the eye icon to hide and unhide the indicator
The following is simply quoted from my previous post for your convenience: (obviously there won't be risk, Stop Loss, or Take profit parameters!)
OPERATING PRINCIPLE
The strategy is based on Ehlers idea that any indicator can be turned into a signal-producing trade system through smoothing and other filtering processes.
In fact, I'm using his Zero Lag EMA ( ZLEMA ) as a baseline indicator as well as some code snippets he has made public (1). God bless open source!
Next, I've provided the option to use an Instantaneous Frequency Measurement (IFM) method, which will adaptively choose the best period for the ZLEMA (2)
I've written other studies that use the differential calculus approximations for IFM, so it was only natural to include them in this strategy.
The primary two are Cosine IFM (3) and In-phase Quadrature IFM (4). You can also find an indicator with both plotted and the ability to average them together, as one IFM prefers long periods and the other short. (5)
BEFORE WE BEGIN
1. This strategy only runs on "normal" FX pairs ( EURUSD , GBPJPY , AUDUSD ...) and will fail on Metals or Commodities.
Cryptos are largely untested.
2. Please run it on these time frames: M15 to D.
Anything outside this range will likely fail.
HOW TO USE AND SUCCEED
1. If the Default settings don't produce good results right off the bat, then lower gain limit to 1 or 2 and threshold to 0.01.
2. Test each setting under adaptive method. If you want to leave it Off, then I'd recommend using some kind of IFM (see my links below) to
discover the most efficient period to use.
3. Once you have the best adaptive method chosen, begin incrementing gain limit until you find a nice balance between profit factor ( PF ) and drawdown.
4. Now, begin incrementing threshold. The goal is to have PF above 2 and a drawdown as low as possible.
5. Finally, change the source! Typically, close is the best option, but I have run into cases where high
yielded the highest returns and win rate.
6. Sit back, relax, and tweak the risk until you're happy with the return and drawdown amounts.
ADVANCED
You may need to adjust take profit (TP) points and stop loss (SL) points to create the best entry possible. Don't be greedy! You'll likely have poor
results if the TP is set to 300 and SL is 50.
If you are trading a pair that has a long Dominant Cycle Period, then you may increase Max Period to allow the IFM
to accept longer periods. Any period above the Max Period will be rejected. This may increase lag time!
Cheers and good luck trading!
-DasanC
(1)www.mesasoftware.com
(2)www.jamesgoulding.com
(3) Cosine IFM
(4) I-Q IFM
(5) Averaging IFM
IFM stands for Instantaneous frequency measurement
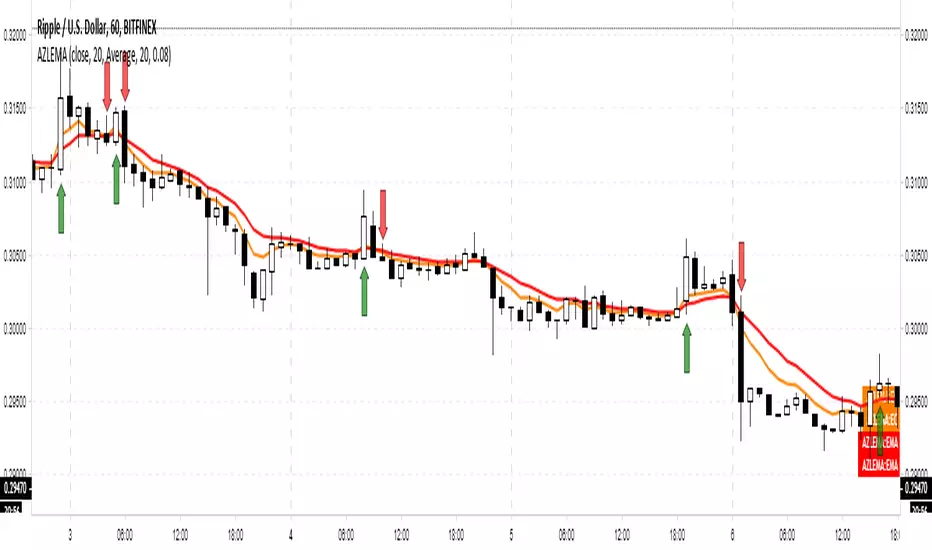
Adaptive Zero Lag EMA v2This is my most successful strategy to date! Please enjoy and join the Open Source movement by sharing your code and ideas online!
OPERATING PRINCIPLE
The strategy is based on Ehlers idea that any indicator can be turned into a signal-producing trade system through smoothing and other filtering processes.
In fact, I'm using his Zero Lag EMA (ZLEMA) as a baseline indicator as well as some code snippets he has made public (1). God bless open source!
Next, I've provided the option to use an Instantaneous Frequency Measurement (IFM) method, which will adaptively choose the best period for the ZLEMA (2)
I've written other studies that use the differential calculus approximations for IFM, so it was only natural to include them in this strategy.
The primary two are Cosine IFM (3) and In-phase Quadrature IFM (4). You can also find an indicator with both plotted and the ability to average them together, as one IFM prefers long periods and the other short. (5)
BEFORE WE BEGIN
1. This strategy only runs on "normal" FX pairs (EURUSD, GBPJPY, AUDUSD ...) and will fail on Metals or Commodities.
Cryptos are largely untested.
2. Please run it on these time frames: M15 to D.
Anything outside this range will likely fail.
HOW TO USE AND SUCCEED
1. If the Default settings don't produce good results right off the bat, then lower gain limit to 1 or 2 and threshold to 0.01.
2. Test each setting under adaptive method . If you want to leave it Off , then I'd recommend using some kind of IFM (see my links below) to
discover the most efficient period to use.
3. Once you have the best adaptive method chosen, begin incrementing gain limit until you find a nice balance between profit factor (PF) and drawdown.
4. Now, begin incrementing threshold . The goal is to have PF above 2 and a drawdown as low as possible.
5. Finally, change the source ! Typically, close is the best option, but I have run into cases where high
yielded the highest returns and win rate.
6. Sit back, relax, and tweak the risk until you're happy with the return and drawdown amounts.
ADVANCED
You may need to adjust take profit (TP) points and stop loss (SL) points to create the best entry possible. Don't be greedy! You'll likely have poor
results if the TP is set to 300 and SL is 50.
If you are trading a pair that has a long Dominant Cycle Period , then you may increase Max Period to allow the IFM
to accept longer periods. Any period above the Max Period will be rejected. This may increase lag time!
Cheers and good luck trading!
-DasanC
PS - This code doesn't repaint or have future-leak, which was present in Pinescript v2.
PPS - Believe me! These returns are typical! Sometimes you must push aside the "if it's too good to be true..." mindset that society has ingrained in you.
Do you really believe the most successful pass up opportunities before investigating them? ;)
(1) Ehlers & Ric Zero Lag EMA
(2) Measuring Cycles by Ehlers
(3) Cosine IFM
(4) Inphase Quadrature IFM
(5) Averaging IFM

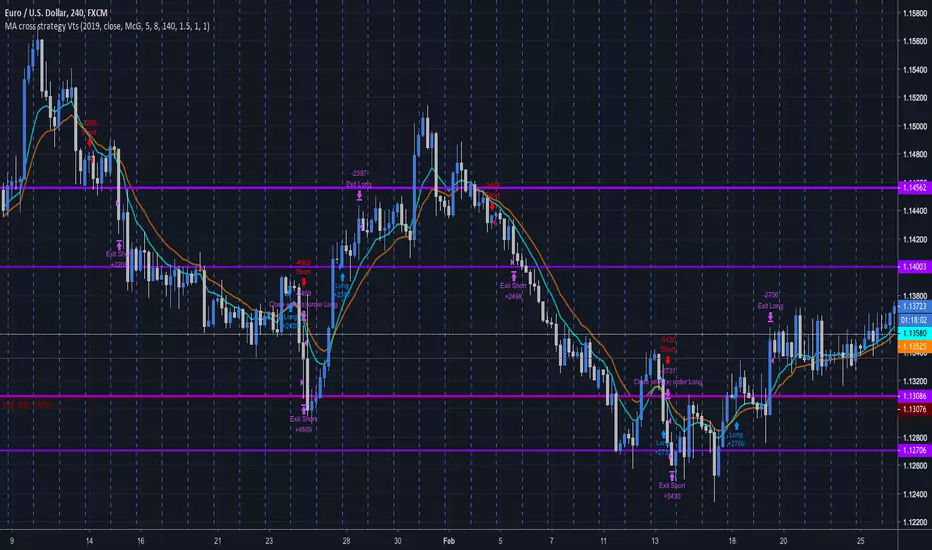
MA cross strategy VtsThe simple Moving average cross strategy is here implemented.
I guess there are multitudes of similar scripts around.
I post this one since I was asked by some friends, and I'll let it free to use for anybody.
Here you can choose the year where to start backtesting, the source, the type of MA, the SL and TP multiplicators of ATR, for which you can also choose the averaging period.
Feel free to modify this script. I would be grateful if you could preserve the first lines of comments including my user names.
The MA cross strategies can be very effective, especially when used on the daily TF.
Try for example the combo EMA15-EMA30 SL=1.5ATR TP=1ATR on EURCHF daily to get an impressive 83% win ratio.
Or EMA20-EMA81 on the GBPCHF to get an 87%.
In those cases where EMA does not perform well, try to set a less lagging MA, like the Hull MA.
I hope you like this script so that you could push the like button multiple (odd) times and you start following me.
I've got a bunch of other interesting scripts to share.
Comments and suggestions are welcome.
Forex Master v4.0 (EUR/USD Mean-Reversion Algorithm)DESCRIPTION
Forex Master v4.0 is a mean-reversion algorithm currently optimized for trading the EUR/USD pair on the 5M chart interval. All indicator inputs use the period's closing price and all trades are executed at the open of the period following the period where the trade signal was generated.
There are 3 main components that make up Forex Master v4.0:
I. Trend Filter
The algorithm uses a version of the ADX indicator as a trend filter to trade only in certain time periods where price is more likely to be range-bound (i.e., mean-reverting). This indicator is composed of a Fast ADX and a Slow ADX, both using the same look-back period of 50. However, the Fast ADX is smoothed with a 6-period EMA and the Slow ADX is smoothed with a 12-period EMA. When the Fast ADX is above the Slow ADX, the algorithm does not trade because this indicates that price is likelier to trend, which is bad for a mean-reversion system. Conversely, when the Fast ADX is below the Slow ADX, price is likelier to be ranging so this is the only time when the algorithm is allowed to trade.
II. Bollinger Bands
When allowed to trade by the Trend Filter, the algorithm uses the Bollinger Bands indicator to enter long and short positions. The Bolliger Bands indicator has a look-back period of 20 and a standard deviation of 1.5 for both upper and lower bands. When price crosses over the lower band, a Long Signal is generated and a long position is entered. When price crosses under the upper band, a Short Signal is generated and a short position is entered.
III. Money Management
Rule 1 - Each trade will use a limit order for a fixed quantity of 50,000 contracts (0.50 lot). The only exception is Rule
Rule 2 - Order pyramiding is enabled and up to 10 consecutive orders of the same signal can be executed (for example: 14 consecutive Long Signals are generated over 8 hours and the algorithm sends in 10 different buy orders at various prices for a total of 350,000 contracts).
Rule 3 - Every order will include a bracket with both TP and SL set at 50 pips (note: the algorithm only closes the current open position and does not enter the opposite trade once a TP or SL has been hit).
Rule 4 - When a new opposite trade signal is generated, the algorithm sends in a larger order to close the current open position as well as open a new one (for example: 14 consecutive Long Signals are generated over 8 hours and the algorithm sends in 10 different buy orders at various prices for a total of 350,000 contracts. A Short Signal is generated shortly after the 14th Long Signal. The algorithm then sends in a sell order for 400,000 contracts to close the 350,000 contracts long position and open a new short position of 50,000 contracts).

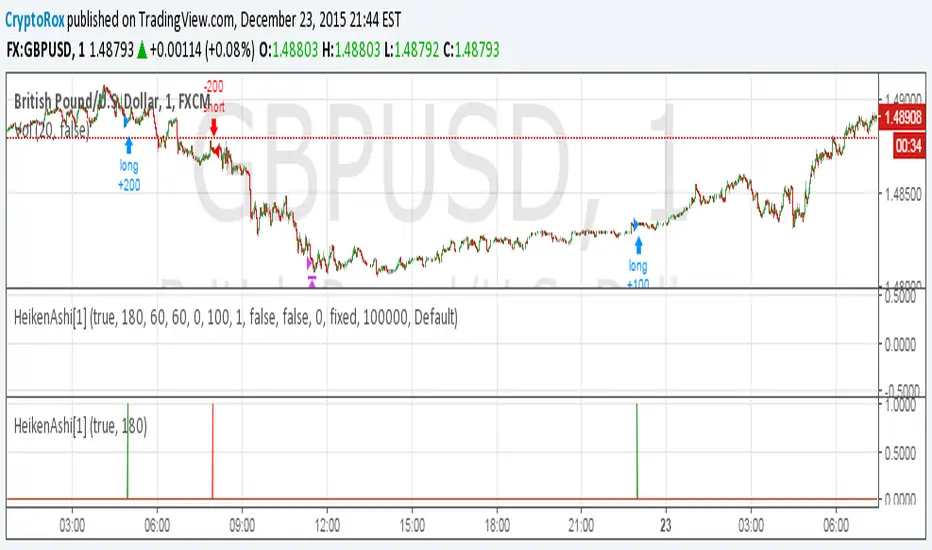
HeikenAshi[1]This is the alert script so you can automate this strategy using AutoView:
Make sure to use
crossing down value 0.9 once per bar (on condition) for this.
For the alert Message if you're using AutoView:
Long GBPUSD
c=order b=short
c=position b=short l=200 t=market
b=long q=0.01 l=200 t=market tp=60 sl=60
Short GBPUSD
c=order b=long
c=position b=long l=200 t=market
b=short q=0.01 l=200 t=market tp=60 sl=60
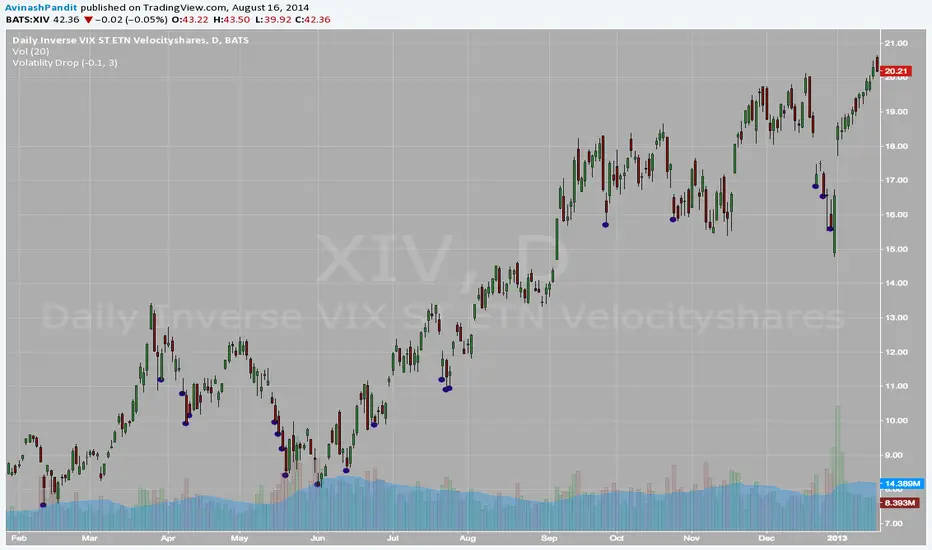
Percent Drop - For XIVUseful for Rangebound stocks.
I am using it with XIV , start accumulating day after circle appears.
Have TP of 20% upside
Average it if TP not hit on next flash
BTC Regime Oscillator (MC + Spread) [1D]ONLY SUPPOSED TO BE USED FOR BTC PERPS, AND SPOT LEVERAGING:
This is a risk oscillator that measures whether Bitcoin’s price is supported by real capital or is running ahead of it, and converts that into a simple risk-regime oscillator.
It's built with market cap, and FDV, and Z-scores compressed to -100 <-> 100
I created this indicator because I got tired of FOMO Twitter and Wall Street games.
DO NOT USE THIS AS A BEGIN-ALL-AND-END-ALL. YOU NEED TO USE THIS AS A CONFIRMATION INDICATOR, AND ON HTF ONLY (1D>) IF YOU USE THIS ON LOWER TIMEFRAMES, YOU ARE FEEDING YOUR MONEY TO A LOW-LIFE DING BAT ON WALL STREET. HERE IS HOW IT WORKS:
This indicator is Split up by
A) Market Cap
--> Represents real money in BTC
--> Ownership capital
--> If MC is rising, money is entering BTC
B) FDV (Fully Diluted Valuation)
--> For BTC: price(21M) (21,000,000)
--> Represents the theoretical valuation
--> Since BTC really has a fixed cap, FDV mostly tracks the price
C) Oscillators
Both MC and FDV are:
--> Logged (to handle scale)
--> Normalized (Z-score)
--> Compressed to -100 <-> 100
HERE ARE THREE THINGS YOU ARE GOING TO SEE ON THE CHART
A) The market cap oscillator (MC OSC)
--> Normalized trend of real capital
RISING: Indicates capital inflow
FALLING: Indicates capital outflow
B) FDV Oscillator
--> Normalized trend of valuation pressure
ABOVE MC: Price is ahead of capital
BELOW MC: Capital is keeping up
!!!! FDV IS CONTEXT NOT SIGNALS !!!!
C) Spread = (FDV - MC)
--> The difference between valuation and capital
(THIS IS THE CORE SIGNAL)
NEGATIVE: Capital is gonna lead price
NEAR 0: Balanced
POSITIVE: Price leads capital
(THIS MEANS STRESS FOR BTC, NOT DILLUTION!)
WHAT DOES -60, 0, 60 MEAN?:
--> These are meant to serve as risk zones, not buy/sell dynamics; this is not the same as an RSI oscillator.
A) 0 level
--> Price and capital are balanced
--> No structural stress
(TRADE WITH NORMAL POSITION SIZE, AND NORMAL EXPECTATIONS)
B) Below -60 (Supportive/Compressed)
--> BTC is relatively cheap to recent history
--> Capital supports price well
(ALWAYS REMEMBER TO CONFIRM THIS WITH WHAT THE CHART IS TELLING YOU)
--> Press trends
--> Use higher ATRs
--> Pullbacks are better here
C) Above 60 (Overextension, or fragile)
--> BTC is expensive relative to recent history
--> Price is ahead of capital
(ALWAYS REMEMBER TO CONFIRM THIS WITH WHAT THE CHART IS TELLING YOU)
--> Reduce leverage, use smaller ATR
--> Use lower ATRs, TP faster
--> Do not chase breakouts
--> Expect volatility and whipsaws
"Can I press trades right now? Or do I need to hog my capital?"
CONDITIONS:
Spread Less than 0 and below -60 = Press trades
Spread near 0 = Normal trading conditions
Spread is Greater than 0 or above 60+ = Capital protection

Gold Sniper V21: M15 Holding MasterGold Sniper Entry (Follow Trend to enter)
My Indicator :
- Clarify the M30 in Up/Down Trend
- Only entry the trade in M1/M5 Timeframe to make a Sniper Entry.
- Indicator will show when to TP before the Trend Change

ATR R-LevelsATR-R Levels is built for clarity of risk management.
The script takes your account size, chosen risk %, and the market’s volatility, then turns all of that into exact stop-loss, take-profit, and position size so there’s no guessing.
It’s inspired by key principles from NNFX, especially ATR-based stop placement and fixed-risk position sizing, but redesigned for fast intraday crypto trading. You get the same consistency and discipline NNFX is known for, adapted to a much shorter timeframe.
ATR-R Levels gives you:
A volatility-based stop using ATR
A clean 2R (or custom R-multiple) target
Automatic position sizing based on your risk rules
A simple HUD showing ATR, entry, stop, TP, size, and risk
Optional net profit estimates after fees
Let me know what you think or if you use it!

TedAlpha – Structure / FVG / OB Sessions:
Only looks for trades when price is inside your defined London or NY time blocks.
CHOCH:
Uses pivots to track swing highs/lows, then flags a bullish CHOCH when structure flips from LL/LH to HH/HL, and vice versa for bearish.
FVG:
Detects 3-candle imbalance and keeps the zone “active” for fvgLookback bars, then checks if price trades back into it.
Order Blocks:
On a CHOCH, grabs the last opposite candle (bearish before bull CHOCH = bullish OB, bullish before bear CHOCH = bearish OB) and marks its body as the OB zone.
Signal:
A valid long = bull CHOCH + in session + (price inside bullish FVG and/or bullish OB, depending on toggles).
Short is the mirror image.
RR 1:3:
SL uses the last swing low (for longs) or last swing high (for shorts), TP is auto-set at 3× that distance and plotted as lines.

Mirpapa_Lib_UnicornLibrary "Mirpapa_Lib_Unicorn"
유니콘 패턴 라이브러리 (Unicorn Pattern Library)
유니콘 모델 전략 로직, 데이터 구조체 및 상태 관리를 구현합니다.
initUnicornData(_isBull, _createTime, _createBar, _timeframe)
UnicornData 초기화
@description 새로운 UnicornData 객체를 생성하고 초기화합니다.
Parameters:
_isBull (bool) : 방향 (True: 상승, False: 하락)
_createTime (int) : 생성 시간
_createBar (int) : 생성 Bar Index
_timeframe (string) : 시간대
calculateOverlap(_obTop, _obBot, _fvgTop, _fvgBot)
중첩 영역(Overlap Zone) 계산
@description OB와 FVG 사이의 겹치는 영역을 계산합니다.
Parameters:
_obTop (float) : OB 상단
_obBot (float) : OB 하단
_fvgTop (float) : FVG 상단
_fvgBot (float) : FVG 하단
Returns: 겹침 영역 상단, 하단, 겹침 여부
updateUnicornStatus(_data, _currentHigh, _currentLow, _time)
유니콘 상태 업데이트
@description 가격 움직임에 따라 유니콘 패턴의 상태를 업데이트합니다.
active: 진입 대기 (리테스트 대기) -> triggered: 진입 (TP/SL 대기) -> win/loss: 결과 확정
Parameters:
_data (UnicornData) : UnicornData 객체
_currentHigh (float) : 현재 고가
_currentLow (float) : 현재 저가
_time (int) : 현재 시간
Returns: UnicornData 업데이트된 객체
activateUnicorn(_data)
유니콘 활성화 (Active 전환)
@description Pending 상태인 유니콘 데이터를 Active 상태로 전환합니다. (보통 CHoCH 발생 시 호출)
Parameters:
_data (UnicornData) : UnicornData 객체
setTradeLevels(_data, _entry, _stop, _target)
트레이딩 레벨 설정
@description 진입가, 목표가, 손절가를 설정합니다.
Parameters:
_data (UnicornData) : UnicornData 객체
_entry (float) : 진입가
_stop (float) : 손절가
_target (float) : 목표가
UnicornData
유니콘 데이터 (UnicornData)
Fields:
_isBull (series bool) : // 상승/하락 방향 (True: Long, False: Short)
_status (series string) : // "pending", "active", "triggered", "win", "loss", "cancelled"
_createTime (series int) : // 생성 시간
_createBar (series int) : // 생성 bar_index
_obTop (series float) : // OB 상단
_obBot (series float) : // OB 하단
_obTime (series int) : // OB 캔들 시간
_obBox (series box) : // OB 박스 객체
_fvgTop (series float) : // FVG 상단
_fvgBot (series float) : // FVG 하단
_fvgTime (series int) : // FVG 시간
_fvgBox (series box) : // FVG 박스 객체
_zoneTop (series float) : // 겹침 영역 상단 (Unicorn Zone)
_zoneBot (series float) : // 겹침 영역 하단 (Unicorn Zone)
_zoneBox (series box) : // Unicorn Zone 박스 객체
_chochConfirmed (series bool) : // CHoCH 확정 여부
_chochTime (series int) : // CHoCH 발생 시간
_chochPrice (series float) : // CHoCH 돌파 가격
_entryPrice (series float) : // 진입가
_targetPrice (series float) : // 목표가 (다음 유동성 레벨)
_stopPrice (series float) : // 손절가 (Zone 반대편)
_result (series string) : // "none", "win", "loss"
_resultTime (series int) : // 결과 확정 시간
_resultPrice (series float) : // 결과 확정 가격
_profitPips (series float) : // 수익 pips (양수)
_lossPips (series float) : // 손실 pips (음수)
_profitPercent (series float) : // 수익 %
_lossPercent (series float) : // 손실 %
_rrRatio (series float) : // Risk:Reward 비율
_timeframe (series string) : // 시간대 (HTF/MTF/CTF)
_triggerTime (series int) : // 진입 트리거 시간 (리테스트)
_triggerPrice (series float) : // 진입 트리거 가격
_isRetested (series bool) : // 리테스트 여부
_retestCount (series int) : // 리테스트 횟수
_maxDrawdown (series float) : // 최대 손실폭 (진입 후)
_maxProfit (series float) : // 최대 수익폭 (진입 후)

Fanfans极简原版优化版### 中英文双语总结(300字内)
中文:该指标为Fanfans极简原版优化版,基于RSI和ATR构建核心交易信号,新增趋势(EMA)、成交量、时间、价格位置多维度过滤,及动态ATR倍数调整功能。含同方向订单间隔限制、多级止盈止损(支持阈值触发),内置信号质量评分、标签标注与警报推送,可自定义过滤规则和显示样式,通过多维度筛选降低无效信号,提升短周期交易信号准确性。
English: This is an optimized version of Fanfans' minimalist indicator, building core trading signals based on RSI and ATR. It adds multi-dimensional filters (trend/EMA, volume, time, price position) and dynamic ATR multiplier adjustment, includes same-direction order interval limits, multi-level SL/TP (supporting threshold triggers), built-in signal quality scoring, label annotation and alert push. Customizable filter rules and display styles reduce invalid signals via multi-dimensional screening, improving short-term trading signal accuracy.

Fanfans结构+极简合并增强版V2
中文:该指标整合Fanfans结构、高斯GWMA、动态摆动VWAP、MACD及极简交易信号,内置结构/GWMA/VWAP/EMA多维度过滤、成交量确认、动态ATR等优化功能。支持多空信号标注、止损止盈分层设置、信号质量评分,搭配图表信息面板与多级别警报共振机制,适用于1分钟等短周期交易,兼顾信号灵敏度与准确性。
English: This indicator integrates Fanfans structure, Gaussian GWMA, dynamic swing VWAP, MACD, and simple trading signals. It features multi-dimensional filters (structure/GWMA/VWAP/EMA), volume confirmation, dynamic ATR optimization. Supporting long/short signal labeling, layered SL/TP settings, signal quality scoring, it comes with a chart info panel and multi-level alert resonance. Suitable for short-term trading (e.g., 1-minute timeframe), balancing signal sensitivity and accuracy.

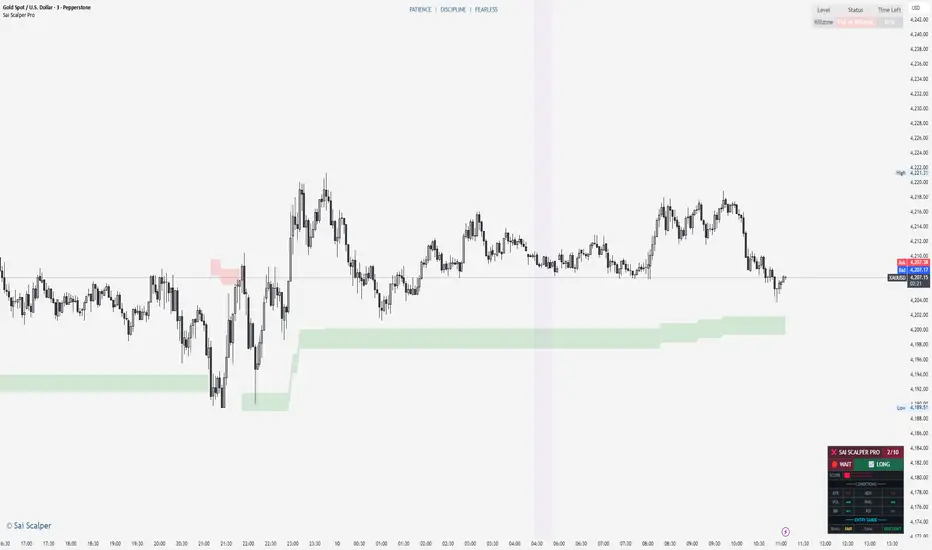
Sai Scalper ProSai Scalper Pro – Feature Summary
Trend Engine
- ATR-based trailing stop with Fibonacci levels (61.8%, 78.6%, 88.6%)
- Auto trend detection with swing point tracking
Scalping Detection (0-10 Score)
- Analyzes 7 factors: ATR compression, ADX, Volume, Range, Consolidation, RSI, BB Squeeze
- Smart state machine with hysteresis to prevent false signals
- Adjustable sensitivity & stability settings
Cloud Modes (7 Options)
- Full Zone, Entry Zone, Premium/Discount, Fib Bands, Upper/Middle/Lower Band
Pro Dashboard
- Real-time scalp score with visual meter
- Entry quality rating & zone display
- Suggested TP/SL based on ATR
- Session detection (Sydney/Tokyo/London/NY) with overlap alerts
- 3 styles (Minimal/Pro/Full) × 4 sizes × 9 positions
Alerts
- Scalp ready, Prime conditions (8+), Optimal entry zone
- Direction-specific (Long/Short bias)
Combines trend-following Fibonacci analysis with intelligent ranging detection for optimal scalping opportunities.
Golden Cross RSI Daily Helper (US Stocks)//@version=5
indicator("Golden Cross RSI Daily Helper (US Stocks)", overlay=true, timeframe="D", timeframe_gaps=true)
//========= الإعدادات الأساسية =========//
emaFastLen = input.int(50, "EMA سريع (اتجاه قصير المدى)")
emaSlowLen = input.int(200, "EMA بطيء (اتجاه طويل المدى)")
rsiLen = input.int(14, "فترة RSI")
rsiMin = input.float(40.0, "حد RSI الأدنى للدخول", 0.0, 100.0)
rsiMax = input.float(60.0, "حد RSI الأعلى للدخول", 0.0, 100.0)
slBufferPerc = input.float(1.5, "نسبة البفر لوقف الخسارة (%) أسفل/أعلى EMA200", 0.1, 5.0)
rrRatio = input.float(2.0, "نسبة العائد إلى المخاطرة (R:R)", 1.0, 5.0)
//========= حساب المؤشرات =========//
emaFast = ta.ema(close, emaFastLen)
emaSlow = ta.ema(close, emaSlowLen)
rsiVal = ta.rsi(close, rsiLen)
// اتجاه السوق
trendUp = emaFast > emaSlow
trendDown = emaFast < emaSlow
// ارتداد السعر من EMA50 أو EMA200 تقريبياً
bounceFromEmaFast = close > emaFast and low <= emaFast
bounceFromEmaSlow = close > emaSlow and low <= emaSlow
bounceLong = bounceFromEmaFast or bounceFromEmaSlow
bounceFromEmaFastShort = close < emaFast and high >= emaFast
bounceFromEmaSlowShort = close < emaSlow and high >= emaSlow
bounceShort = bounceFromEmaFastShort or bounceFromEmaSlowShort
// فلتر RSI
rsiOk = rsiVal >= rsiMin and rsiVal <= rsiMax
//========= شروط الدخول =========//
// شراء
longSignal = trendUp and bounceLong and rsiOk
// بيع
shortSignal = trendDown and bounceShort and rsiOk
//========= حساب وقف الخسارة والأهداف =========//
// نستخدم سعر إغلاق شمعة الإشارة كسعر دخول افتراضي
entryPriceLong = close
entryPriceShort = close
// وقف الخسارة حسب EMA200 + البفر
slLong = emaSlow * (1.0 - slBufferPerc / 100.0)
slShort = emaSlow * (1.0 + slBufferPerc / 100.0)
// المسافة بين الدخول ووقف الخسارة
riskLong = math.max(entryPriceLong - slLong, syminfo.mintick)
riskShort = math.max(slShort - entryPriceShort, syminfo.mintick)
// هدف الربح حسب R:R
tpLong = entryPriceLong + rrRatio * riskLong
tpShort = entryPriceShort - rrRatio * riskShort
//========= الرسم على الشارت =========//
// رسم المتوسطات
plot(emaFast, title="EMA 50", color=color.new(color.blue, 0), linewidth=2)
plot(emaSlow, title="EMA 200", color=color.new(color.orange, 0), linewidth=2)
// تلوين الخلفية حسب الاتجاه
bgcolor(trendUp ? color.new(color.green, 92) : trendDown ? color.new(color.red, 92) : na)
// إشارة شراء
plotshape(
longSignal,
title = "إشارة شراء",
style = shape.triangleup,
location = location.belowbar,
size = size.large,
color = color.new(color.green, 0),
text = "BUY")
// إشارة بيع
plotshape(
shortSignal,
title = "إشارة بيع",
style = shape.triangledown,
location = location.abovebar,
size = size.large,
color = color.new(color.red, 0),
text = "SELL")
// رسم SL و TP عند ظهور الإشارة
slPlotLong = longSignal ? slLong : na
tpPlotLong = longSignal ? tpLong : na
slPlotShort = shortSignal ? slShort : na
tpPlotShort = shortSignal ? tpShort : na
plot(slPlotLong, title="وقف خسارة شراء", color=color.new(color.red, 0), style=plot.style_linebr)
plot(tpPlotLong, title="هدف شراء", color=color.new(color.green, 0), style=plot.style_linebr)
plot(slPlotShort, title="وقف خسارة بيع", color=color.new(color.red, 0), style=plot.style_linebr)
plot(tpPlotShort, title="هدف بيع", color=color.new(color.green, 0), style=plot.style_linebr)
//========= إعداد التنبيهات =========//
alertcondition(longSignal, title="تنبيه إشارة شراء", message="إشارة شراء: ترند صاعد + ارتداد من EMA + RSI في المنطقة المسموحة.")
alertcondition(shortSignal, title="تنبيه إشارة بيع", message="إشارة بيع: ترند هابط + ارتداد من EMA + RSI في المنطقة المسموحة.")

ATR ZigZag BreakoutATR ZigZag Breakout
This strategy uses my ATR ZigZag indicator (powered by the ZigZagCore library) to scalp breakouts at volatility-filtered highs and lows.
Everyone knows stops cluster around clear swing highs and lows. Breakout traders often pile in there, too. These levels are predictable areas where aggressive orders hit the tape. The idea here is simple:
→ Let ATR ZigZag define clean, volatility-filtered pivots
→ Arm a stop market order at those pivots
→ Join the breakout when the crowd hits the level
The key to greater success in this simple strategy lies in the ZigZag. Because the pivots are filtered by ATR instead of fixed bar counts or fractals, the levels tend to be more meaningful and less noisy.
This approach is especially suited for intraday trading on volatile instruments (e.g., NQ, GC, liquid crypto pairs).
How It Works
1. Pivot detection
The ATR ZigZag uses an ATR-based threshold to confirm swing highs and lows. Only when price has moved far enough in the opposite direction does a pivot become “official.”
2. Candidate breakout level
When a new swing direction is detected and the most recent high/low has not yet been broken in the current leg, the strategy arms a stop market order at that pivot.
• Long candidate → most recent swing high
• Short candidate → most recent swing low
These “candidate trades” are shown as dotted lines.
3. Entry, SL, and TP
If price breaks through the level, the stop order is filled and a bracket is placed:
• Stop loss = ATR × SL multiplier
• Take profit = SL distance × RR multiplier
Once a level has traded, it is not reused in the same swing leg.
4. Cancel & rotate
If the market reverses and forms a new swing in the opposite direction before the level is hit, the pending order is cancelled and a new candidate is considered in the new direction.
Additional Features
• Optional session filter for backtesting specific trading hours

Reversal WaveThis is the type of quantitative system that can get you hated on investment forums, now that the Random Walk Theory is back in fashion. The strategy has simple price action rules, zero over-optimization, and is validated by a historical record of nearly a century on both Gold and the S&P 500 index.
Recommended Markets
SPX (Weekly, Monthly)
SPY (Monthly)
Tesla (Weekly)
XAUUSD (Weekly, Monthly)
NVDA (Weekly, Monthly)
Meta (Weekly, Monthly)
GOOG (Weekly, Monthly)
MSFT (Weekly, Monthly)
AAPL (Weekly, Monthly)
System Rules and Parameters
Total capital: $10,000
We will use 10% of the total capital per trade
Commissions will be 0.1% per trade
Condition 1: Previous Bearish Candle (isPrevBearish) (the closing price was lower than the opening price).
Condition 2: Midpoint of the Body The script calculates the exact midpoint of the body of that previous bearish candle.
• Formula: (Previous Open + Previous Close) / 2.
Condition 3: 50% Recovery (longCondition) The current candle must be bullish (green) and, most importantly, its closing price must be above the midpoint calculated in the previous step.
Once these parameters are met, the system executes a long entry and calculates the exit parameters:
Stop Loss (SL): Placed at the low of the candle that generated the entry signal.
Take Profit (TP): Calculated by projecting the risk distance upward.
• Calculation: Entry Price + (Risk * 1).
Risk:Reward Ratio of 1:1.
About the Profit Factor
In my experience, TradingView calculates profits and losses based on the percentage of movement, which can cause returns to not match expectations. This doesn’t significantly affect trending systems, but it can impact systems with a high win rate and a well-defined risk-reward ratio. It only takes one large entry candle that triggers the SL to translate into a major drop in performance.
For example, you might see a system with a 60% win rate and a 1:1 risk-reward ratio generating losses, even though commissions are under control relative to the number of trades.
My recommendation is to manually calculate the performance of systems with a well-defined risk-reward ratio, assuming you will trade using a fixed amount per trade and limit losses to a fixed percentage.
Remember that, even if candles are larger or smaller in size, we can maintain a fixed loss percentage by using leverage (in cases of low volatility) or reducing the capital at risk (when volatility is high).
Implementing leverage or capital reduction based on volatility is something I haven’t been able to incorporate into the code, but it would undoubtedly improve the system’s performance dramatically, as it would fix a consistent loss percentage per trade, preventing losses from fluctuating with volatility swings.
For example, we can maintain a fixed loss percentage when volatility is low by using the following formula:
Leverage = % of SL you’re willing to risk / % volatility from entry point to exit or SL
And if volatility is high and exceeds the fixed percentage we want to expose per trade (if SL is hit), we could reduce the position size.
For example, imagine we only want to risk 15% per SL on Tesla, where volatility is high and would cause a 23.57% loss. In this case, we subtract 23.57% from 15% (the loss percentage we’re willing to accept per trade), then subtract the result from our usual position size.
23.57% - 15% = 8.57%
Suppose I use $200 per trade.
To calculate 8.57% of $200, simply multiply 200 by 8.57/100. This simple calculation shows that 8.57% equals about $17.14 of the $200. Then subtract that value from $200:
$200 - $17.14 = $182.86
In summary, if we reduced the position size to $182.86 (from the usual $200, where we’re willing to lose 15%), no matter whether Tesla moves up or down 23.57%, we would still only gain or lose 15% of the $200, thus respecting our risk management.
Final Notes
The code is extremely simple, and every step of its development is detailed within it.
If you liked this strategy, which complements very well with others I’ve already published, stay tuned. Best regards.

Profitable Pair Correlation Divergence Scanner v6This strategy identifies divergence opportunities between two correlated assets using a combination of Z-Score spread analysis, trend confirmation, RSI & MACD momentum checks, correlation filters, and ATR-based stop-loss/take-profit management. It’s optimized for positive P&L and realistic trade execution.
Key Features:
Pair Divergence Detection:
Measures deviation between returns of two assets and identifies overbought/oversold spread conditions using Z-Score.
Trend Alignment:
Trades only in the direction of the primary asset’s trend using a fast EMA vs slow EMA filter.
Momentum Confirmation:
Confirms trades with RSI and MACD to reduce false signals.
Correlation Filter:
Ensures the pair is strongly correlated before taking trades, avoiding noisy signals.
Risk Management:
Dynamic ATR-based stop-loss and take-profit ensures proper reward-to-risk ratio.
Exit Conditions:
Automatically closes positions when Z-Score normalizes, or ATR-based exits are hit.
How It Works:
Calculate Returns:
Computes returns for both assets over the selected timeframe.
Z-Score Spread:
Calculates the spread between returns and normalizes it using moving average and standard deviation.
Trend Filter:
Only takes long trades if the fast EMA is above the slow EMA, and short trades if the fast EMA is below the slow EMA.
Momentum Confirmation:
Confirms trade direction with RSI (>50 for longs, <50 for shorts) and MACD alignment.
Correlation Check:
Ensures the pair’s recent correlation is strong enough to validate divergence signals.
Trade Execution:
Opens positions when Z-Score crosses thresholds and all conditions align. Positions close when Z-Score normalizes or ATR-based SL/TP is hit.
Plot Explanation:
Z-Score: Blue line shows divergence magnitude.
Entry Levels: Red/Green lines mark long/short thresholds.
Exit Zone: Gray lines show normalization zone.
EMA Trend Lines: Purple (fast), Orange (slow) for trend alignment.
Correlation: Teal overlay shows current correlation strength.
Usage Tips:
Use highly correlated pairs for best results (e.g., EURUSD/GBPUSD).
Run on higher timeframe charts (1h or 4h) to reduce noise.
Adjust ATR multiplier based on volatility to avoid premature stops.
Combine with alerts for automated notifications or webhook execution.
Conclusion:
The Profitable Pair Correlation Divergence Scanner v6 is designed for traders who want systematic, low-risk, positive P&L trading opportunities with minimal manual monitoring. By combining trend alignment, momentum confirmation, correlation filters, and dynamic exits, it reduces false signals and improves execution reliability.
Run it on TradingView and watch how it captures divergence opportunities while maintaining positive P&L across trades.

MeanReversion_tradeALERTOverview The Apex Reversal Predictor v2.5 is a specialized mean reversion strategy designed for scalping high-volatility assets like NQ (Nasdaq), ES (S&P 500), and Crypto. While most indicators chase breakouts, this system hunts for "Liquidity Sweeps"—moments where the market briefly breaks a key level to trap retail traders before snapping back to the true value (VWAP).
This is not just a signal indicator; it is a full Trade Manager that calculates your Entry, Stop Loss, and Take Profit levels automatically based on volatility (ATR).
The Logic: Why This Works Markets act like a rubber band. They can only stretch so far from their average price before snapping back. This script combines three layers of logic to identify these snap-back points:
The Stretch (Sigma Score): Measures how far price is from the VWAP relative to ATR. If the score > 2.0, the "rubber band" is overextended.
The Trap (Liquidity Sweep): Identifies Pivot Highs/Lows. It waits for price to break a pivot (luring in breakout traders) and then immediately reverse (trapping them).
The Exhaustion (RSI): Confirms that momentum is Overbought/Oversold to prevent trading against a strong trend.
Key Features
Dynamic Lines: Automatically draws Blue (Entry), Red (SL), and Green (TP) lines on the chart for active trades.
Smart Targets: Two modes for taking profit:
Mean Reversion: Targets the VWAP line (High Win Rate).
Fixed Ratio: Targets a specific Risk:Reward (e.g., 1:2).
Live Dashboard: Tracks Win Rate, Net Points, and the live "Stretch Score" in the bottom right corner.
Alert Ready: Formatted JSON alerts for easy integration with Discord or trading bots.
How & When to Use (User Guide)
1. Best Timeframes
5-Minute (5m): Best for NQ and volatile stocks (TSLA, NVDA). Filters out 1-minute noise but catches the intraday reversals.
15-Minute (15m): Best for Forex or slower-moving indices (ES).
2. The Setup Checklist Before taking a trade, look at the Dashboard in the bottom right:
Step 1: Check the "Stretch (Sigma)". Is it Orange or Red? This means price is extended and ripe for a reversal. If it's Green, the market is calm—be careful.
Step 2: Wait for the Signal.
"Apex BUY" (Green Label): Price swept a low and closed green.
"Apex SELL" (Red Label): Price swept a high and closed red.
Step 3: Execute. Enter at the close of the signal candle. Set your stop loss at the Red Line provided by the script.
3. Warning / When NOT to Use
Strong Trending Days: If the market is trending heavily (e.g., creating higher highs all day without looking back), do not fight the trend.
News Events: Avoid using this during CPI, FOMC, or NFP releases. The "rubber band" logic breaks during news because volatility expands indefinitely.

Options Scalper v2 - SPY/QQQHere's a comprehensive description of the Options Scalper v2 strategy:
---
## Options Scalper v2 - SPY/QQQ
### Overview
A multi-indicator confluence-based scalping strategy designed for trading SPY and QQQ options on short timeframes (1-5 minute charts). The strategy uses a scoring system to generate high-probability CALL and PUT signals by requiring alignment across multiple technical indicators before triggering entries.
---
### Core Logic
The strategy operates on a **scoring system (0-9 points)** where both bullish (CALL) and bearish (PUT) conditions are evaluated independently. A signal only fires when:
1. A recent EMA crossover occurred (within the last 3 bars)
2. The direction's score meets the minimum threshold (default: 4 points)
3. The signal's score is higher than the opposite direction
4. Enough bars have passed since the last signal (cooldown period)
5. Price action occurs during valid trading sessions
---
### Indicators Used
| Indicator | Purpose | CALL Condition | PUT Condition |
|-----------|---------|----------------|---------------|
| **9/21 EMA Cross** | Primary trigger | Fast EMA crosses above slow | Fast EMA crosses below slow |
| **200 EMA** | Trend filter | Price above 200 EMA | Price below 200 EMA |
| **RSI (14)** | Momentum filter | RSI between 45-65 | RSI between 35-55 |
| **VWAP** | Institutional level | Price above VWAP | Price below VWAP |
| **MACD (12,26,9)** | Momentum confirmation | MACD line > Signal line | MACD line < Signal line |
| **Stochastic (14,3)** | Overbought/Oversold | Oversold or K > D | Overbought or K < D |
| **Volume** | Participation confirmation | Spike on green candle | Spike on red candle |
| **Price Structure** | Breakout detection | Higher high formed | Lower low formed |
---
### Scoring Breakdown
**CALL Score (Max 9 points):**
- Recent EMA cross up: +2 pts
- EMA alignment (fast > slow): +1 pt
- RSI in bullish range: +1 pt
- Above VWAP: +1 pt
- MACD bullish: +1 pt
- Volume spike on green candle: +1 pt
- Stochastic setup: +1 pt
- Above 200 EMA: +1 pt
- Breaking higher high: +1 pt
**PUT Score (Max 9 points):**
- Recent EMA cross down: +2 pts
- EMA alignment (fast < slow): +1 pt
- RSI in bearish range: +1 pt
- Below VWAP: +1 pt
- MACD bearish: +1 pt
- Volume spike on red candle: +1 pt
- Stochastic setup: +1 pt
- Below 200 EMA: +1 pt
- Breaking lower low: +1 pt
---
### Risk Management
The strategy uses **ATR-based dynamic stops and targets**:
| Parameter | Default | Description |
|-----------|---------|-------------|
| Stop Loss | 1.5x ATR | Distance below entry for longs, above for shorts |
| Take Profit | 2.0x ATR | Creates a 1:1.33 risk-reward ratio |
Positions are also closed on:
- Opposite direction signal (flip trade)
- Take profit or stop loss hit
---
### Session Filtering
Trades are restricted to high-liquidity periods by default:
- **Morning Session:** 9:30 AM - 11:00 AM EST
- **Afternoon Session:** 2:30 PM - 3:55 PM EST
This avoids choppy midday price action and captures the highest volume periods.
---
### Input Parameters
| Parameter | Default | Description |
|-----------|---------|-------------|
| Fast EMA | 9 | Fast moving average period |
| Slow EMA | 21 | Slow moving average period |
| Trend EMA | 200 | Long-term trend filter |
| RSI Length | 14 | RSI calculation period |
| RSI Overbought | 65 | Upper RSI threshold |
| RSI Oversold | 35 | Lower RSI threshold |
| Volume Multiplier | 1.2x | Volume spike detection threshold |
| Min Signal Strength | 4 | Minimum score required to trigger |
| Crossover Lookback | 3 | Bars to consider crossover "recent" |
| Min Bars Between Signals | 5 | Cooldown period between signals |
---
### Visual Elements
**Chart Plots:**
- Green line: 9 EMA (fast)
- Red line: 21 EMA (slow)
- Gray line: 200 EMA (trend)
- Purple dots: VWAP
**Signal Markers:**
- Green triangle up + "CALL" label: Buy call signal
- Red triangle down + "PUT" label: Buy put signal
- Small circles: EMA crossover reference points
**Info Table (Top Right):**
- Real-time CALL and PUT scores
- RSI, MACD, Stochastic values
- VWAP and 200 EMA position
- Recent crossover status
- Current signal state
---
### Alerts
| Alert Name | Trigger |
|------------|---------|
| CALL Entry | Standard call signal fires |
| PUT Entry | Standard put signal fires |
| Strong CALL | Call signal with score ≥ 6 |
| Strong PUT | Put signal with score ≥ 6 |
---
### Recommended Usage
| Setting | 0DTE Scalping | Intraday Swings |
|---------|---------------|-----------------|
| Timeframe | 1-2 min | 5 min |
| Min Signal Strength | 5-6 | 4 |
| ATR Stop Mult | 1.0 | 1.5 |
| ATR TP Mult | 1.5 | 2.0 |
| Option Delta | 0.40-0.50 | 0.30-0.40 |
---
### Key Improvements Over v1
1. **Requires actual crossover** - Eliminates false signals from simple trend continuation
2. **Balanced scoring** - Both directions evaluated equally, highest score wins
3. **Signal cooldown** - Prevents overtrading with minimum bar spacing
4. **Multi-indicator confluence** - 8 factors must align for signal generation
5. **Volume-candle alignment** - Volume spikes only count when matching candle direction
---
### Disclaimer
This strategy is for educational purposes. Backtest thoroughly before live trading. Options trading involves significant risk of loss. Past performance does not guarantee future results.

Liquidity Sweep Indicator (Signal-based SL + BE/TP)I created a more advanced version of my Liquidity Sweep Indicator. Open source, but I dont recommend to create a TV-strategy from the code because you should combine it with price action an chart analysis! Have fun :)
