Ayman Entry Signal – Ultimate PRO (Scalping Gold Settings)1. Overview
This indicator is a professional gold scalping tool built for TradingView using Pine Script v6.
It combines multiple price action and technical filters to generate high-probability Buy/Sell signals with built-in trade management features (TP1, TP2, SL, Break Even, Partial Close, Stats tracking).
It is optimized for XAUUSD but can be applied to other assets with proper setting adjustments.
2. Key Features
Multi-Condition Trade Signals – EMA trend, Break of Structure, Order Blocks, FVG, Liquidity Sweeps, Pin Bars, Higher Timeframe confirmation, Trend Cloud, SMA Cross, and ADX.
Full Trade Management – Auto-calculates lot size, SL, TP1, TP2, Break Even, Partial Close.
Dynamic Chart Drawing – Entry lines, SL/TP lines, trade boxes, and real-time PnL.
Statistics Panel – Tracks wins, losses, breakeven trades, and total PnL over selected dates.
Customizable Filters – All filters can be turned ON/OFF to match your strategy.
3. Main Inputs & Settings
Account Settings
Capital ($) – Total trading capital.
Risk Percentage (%) – Risk per trade.
TP to SL Ratio – Risk-to-reward ratio.
Value Per Point ($) – Value per pip/point for lot size calculation.
SL Buffer – Extra points added to SL to avoid stop hunts.
Take Profit Settings
TP1 % of Full Target – Fraction of TP1 compared to TP2.
Move SL to Entry after TP1? – Activates Break Even after TP1.
Break Even Buffer – Extra points when moving SL to BE.
Take Partial Close at TP1 – Option to close half at TP1.
Signal Filters
ATR Period – For SL/TP calculation buffer.
EMA Trend – Uses EMA 9/21 crossover for trend.
Break of Structure (BoS) – Requires structure break confirmation.
Order Block (OB) – Validates trades within OB zones.
Fair Value Gap (FVG) – Confirms trades inside FVGs.
Liquidity Sweep – Checks if liquidity zones are swept.
Pin Bar Confirmation – Uses candlestick patterns for extra confirmation.
Pin Bar Body Ratio – Controls strictness of Pin Bar filter.
Higher Timeframe Filters (HTF)
HTF EMA Confirmation – Confirms lower timeframe trades with higher timeframe trend.
HTF BoS – Confirms with higher timeframe structure break.
HTF Timeframe – Selects higher timeframe.
Advanced Filters
SuperTrend Filter – Confirms trades based on SuperTrend.
ADX Filter – Filters out low volatility periods.
SMA Cross Filter – Uses SMA 8/9 cross as filter.
Trend Cloud Filter – Uses EMA 50/200 as a cloud trend filter.
4. How It Works
Buy Signal Conditions
EMA 9 > EMA 21 (trend bullish)
Optional filters (BoS, OB, FVG, Liquidity Sweep, Pin Bar, HTF confirmations, ADX, SMA Cross, Trend Cloud) must pass if enabled.
When all active filters pass → Buy signal triggers.
Sell Signal Conditions
EMA 9 < EMA 21 (trend bearish)
Same filtering process but for bearish conditions.
When all active filters pass → Sell signal triggers.
5. Trade Execution & Management
When a signal triggers:
Lot size is auto-calculated based on risk % and SL distance.
SL is placed beyond recent swing high/low + ATR buffer.
TP1 and TP2 are calculated from the SL using the reward-to-risk ratio.
Break Even: If enabled, SL moves to entry price after TP1 is hit.
Partial Close: If enabled, half of the position closes at TP1.
Trade Exit: Full exit at TP2, SL hit, or partial close at TP1.
6. Chart Display
Entry Line – Shows entry price.
SL Line – Red dashed line at stop loss level.
TP1 Line – Lime dashed line for TP1.
TP2 Line – Green dashed line for TP2.
PnL Labels – Displays real-time profit/loss in $.
Trade Box – Visual area showing trade range.
Pin Bar Shapes – Optional, marks Pin Bars.
7. Statistics Panel
Stats Header – Shows “Stats”.
Total Trades
Wins
Losses
Breakeven Trades
Total PnL
Can be reset or filtered by date.
8. How to Use
Load the Indicator in TradingView.
Select Gold (XAUUSD) on your preferred scalping timeframe (1m, 5m, 15m).
Adjust settings:
Use default gold scalping settings for quick start.
Enable/disable filters according to your style.
Wait for a Buy/Sell alert.
Confirm visually that all desired conditions align.
Place trade with calculated lot size, SL, and TP levels shown on chart.
Let trade run – the indicator manages Break Even & Partial Close if enabled.
9. Recommended Timeframes
Scalping: 1m, 5m, 15m
Day Trading: 15m, 30m, 1H
Swing: 4H, Daily (adjust settings accordingly)
ค้นหาในสคริปต์สำหรับ "tp"

Game Theory Trading StrategyGame Theory Trading Strategy: Explanation and Working Logic
This Pine Script (version 5) code implements a trading strategy named "Game Theory Trading Strategy" in TradingView. Unlike the previous indicator, this is a full-fledged strategy with automated entry/exit rules, risk management, and backtesting capabilities. It uses Game Theory principles to analyze market behavior, focusing on herd behavior, institutional flows, liquidity traps, and Nash equilibrium to generate buy (long) and sell (short) signals. Below, I'll explain the strategy's purpose, working logic, key components, and usage tips in detail.
1. General Description
Purpose: The strategy identifies high-probability trading opportunities by combining Game Theory concepts (herd behavior, contrarian signals, Nash equilibrium) with technical analysis (RSI, volume, momentum). It aims to exploit market inefficiencies caused by retail herd behavior, institutional flows, and liquidity traps. The strategy is designed for automated trading with defined risk management (stop-loss/take-profit) and position sizing based on market conditions.
Key Features:
Herd Behavior Detection: Identifies retail panic buying/selling using RSI and volume spikes.
Liquidity Traps: Detects stop-loss hunting zones where price breaks recent highs/lows but reverses.
Institutional Flow Analysis: Tracks high-volume institutional activity via Accumulation/Distribution and volume spikes.
Nash Equilibrium: Uses statistical price bands to assess whether the market is in equilibrium or deviated (overbought/oversold).
Risk Management: Configurable stop-loss (SL) and take-profit (TP) percentages, dynamic position sizing based on Game Theory (minimax principle).
Visualization: Displays Nash bands, signals, background colors, and two tables (Game Theory status and backtest results).
Backtesting: Tracks performance metrics like win rate, profit factor, max drawdown, and Sharpe ratio.
Strategy Settings:
Initial capital: $10,000.
Pyramiding: Up to 3 positions.
Position size: 10% of equity (default_qty_value=10).
Configurable inputs for RSI, volume, liquidity, institutional flow, Nash equilibrium, and risk management.
Warning: This is a strategy, not just an indicator. It executes trades automatically in TradingView's Strategy Tester. Always backtest thoroughly and use proper risk management before live trading.
2. Working Logic (Step by Step)
The strategy processes each bar (candle) to generate signals, manage positions, and update performance metrics. Here's how it works:
a. Input Parameters
The inputs are grouped for clarity:
Herd Behavior (🐑):
RSI Period (14): For overbought/oversold detection.
Volume MA Period (20): To calculate average volume for spike detection.
Herd Threshold (2.0): Volume multiplier for detecting herd activity.
Liquidity Analysis (💧):
Liquidity Lookback (50): Bars to check for recent highs/lows.
Liquidity Sensitivity (1.5): Volume multiplier for trap detection.
Institutional Flow (🏦):
Institutional Volume Multiplier (2.5): For detecting large volume spikes.
Institutional MA Period (21): For Accumulation/Distribution smoothing.
Nash Equilibrium (⚖️):
Nash Period (100): For calculating price mean and standard deviation.
Nash Deviation (0.02): Multiplier for equilibrium bands.
Risk Management (🛡️):
Use Stop-Loss (true): Enables SL at 2% below/above entry price.
Use Take-Profit (true): Enables TP at 5% above/below entry price.
b. Herd Behavior Detection
RSI (14): Checks for extreme conditions:
Overbought: RSI > 70 (potential herd buying).
Oversold: RSI < 30 (potential herd selling).
Volume Spike: Volume > SMA(20) x 2.0 (herd_threshold).
Momentum: Price change over 10 bars (close - close ) compared to its SMA(20).
Herd Signals:
Herd Buying: RSI > 70 + volume spike + positive momentum = Retail buying frenzy (red background).
Herd Selling: RSI < 30 + volume spike + negative momentum = Retail selling panic (green background).
c. Liquidity Trap Detection
Recent Highs/Lows: Calculated over 50 bars (liquidity_lookback).
Psychological Levels: Nearest round numbers (e.g., $100, $110) as potential stop-loss zones.
Trap Conditions:
Up Trap: Price breaks recent high, closes below it, with a volume spike (volume > SMA x 1.5).
Down Trap: Price breaks recent low, closes above it, with a volume spike.
Visualization: Traps are marked with small red/green crosses above/below bars.
d. Institutional Flow Analysis
Volume Check: Volume > SMA(20) x 2.5 (inst_volume_mult) = Institutional activity.
Accumulation/Distribution (AD):
Formula: ((close - low) - (high - close)) / (high - low) * volume, cumulated over time.
Smoothed with SMA(21) (inst_ma_length).
Accumulation: AD > MA + high volume = Institutions buying.
Distribution: AD < MA + high volume = Institutions selling.
Smart Money Index: (close - open) / (high - low) * volume, smoothed with SMA(20). Positive = Smart money buying.
e. Nash Equilibrium
Calculation:
Price mean: SMA(100) (nash_period).
Standard deviation: stdev(100).
Upper Nash: Mean + StdDev x 0.02 (nash_deviation).
Lower Nash: Mean - StdDev x 0.02.
Conditions:
Near Equilibrium: Price between upper and lower Nash bands (stable market).
Above Nash: Price > upper band (overbought, sell potential).
Below Nash: Price < lower band (oversold, buy potential).
Visualization: Orange line (mean), red/green lines (upper/lower bands).
f. Game Theory Signals
The strategy generates three types of signals, combined into long/short triggers:
Contrarian Signals:
Buy: Herd selling + (accumulation or down trap) = Go against retail panic.
Sell: Herd buying + (distribution or up trap).
Momentum Signals:
Buy: Below Nash + positive smart money + no herd buying.
Sell: Above Nash + negative smart money + no herd selling.
Nash Reversion Signals:
Buy: Below Nash + rising close (close > close ) + volume > MA.
Sell: Above Nash + falling close + volume > MA.
Final Signals:
Long Signal: Contrarian buy OR momentum buy OR Nash reversion buy.
Short Signal: Contrarian sell OR momentum sell OR Nash reversion sell.
g. Position Management
Position Sizing (Minimax Principle):
Default: 1.0 (10% of equity).
In Nash equilibrium: Reduced to 0.5 (conservative).
During institutional volume: Increased to 1.5 (aggressive).
Entries:
Long: If long_signal is true and no existing long position (strategy.position_size <= 0).
Short: If short_signal is true and no existing short position (strategy.position_size >= 0).
Exits:
Stop-Loss: If use_sl=true, set at 2% below/above entry price.
Take-Profit: If use_tp=true, set at 5% above/below entry price.
Pyramiding: Up to 3 concurrent positions allowed.
h. Visualization
Nash Bands: Orange (mean), red (upper), green (lower).
Background Colors:
Herd buying: Red (90% transparency).
Herd selling: Green.
Institutional volume: Blue.
Signals:
Contrarian buy/sell: Green/red triangles below/above bars.
Liquidity traps: Red/green crosses above/below bars.
Tables:
Game Theory Table (Top-Right):
Herd Behavior: Buying frenzy, selling panic, or normal.
Institutional Flow: Accumulation, distribution, or neutral.
Nash Equilibrium: In equilibrium, above, or below.
Liquidity Status: Trap detected or safe.
Position Suggestion: Long (green), Short (red), or Wait (gray).
Backtest Table (Bottom-Right):
Total Trades: Number of closed trades.
Win Rate: Percentage of winning trades.
Net Profit/Loss: In USD, colored green/red.
Profit Factor: Gross profit / gross loss.
Max Drawdown: Peak-to-trough equity drop (%).
Win/Loss Trades: Number of winning/losing trades.
Risk/Reward Ratio: Simplified Sharpe ratio (returns / drawdown).
Avg Win/Loss Ratio: Average win per trade / average loss per trade.
Last Update: Current time.
i. Backtesting Metrics
Tracks:
Total trades, winning/losing trades.
Win rate (%).
Net profit ($).
Profit factor (gross profit / gross loss).
Max drawdown (%).
Simplified Sharpe ratio (returns / drawdown).
Average win/loss ratio.
Updates metrics on each closed trade.
Displays a label on the last bar with backtest period, total trades, win rate, and net profit.
j. Alerts
No explicit alertconditions defined, but you can add them for long_signal and short_signal (e.g., alertcondition(long_signal, "GT Long Entry", "Long Signal Detected!")).
Use TradingView's alert system with Strategy Tester outputs.
3. Usage Tips
Timeframe: Best for H1-D1 timeframes. Shorter frames (M1-M15) may produce noisy signals.
Settings:
Risk Management: Adjust sl_percent (e.g., 1% for volatile markets) and tp_percent (e.g., 3% for scalping).
Herd Threshold: Increase to 2.5 for stricter herd detection in choppy markets.
Liquidity Lookback: Reduce to 20 for faster markets (e.g., crypto).
Nash Period: Increase to 200 for longer-term analysis.
Backtesting:
Use TradingView's Strategy Tester to evaluate performance.
Check win rate (>50%), profit factor (>1.5), and max drawdown (<20%) for viability.
Test on different assets/timeframes to ensure robustness.
Live Trading:
Start with a demo account.
Combine with other indicators (e.g., EMAs, support/resistance) for confirmation.
Monitor liquidity traps and institutional flow for context.
Risk Management:
Always use SL/TP to limit losses.
Adjust position_size for risk tolerance (e.g., 5% of equity for conservative trading).
Avoid over-leveraging (pyramiding=3 can amplify risk).
Troubleshooting:
If no trades are executed, check signal conditions (e.g., lower herd_threshold or liquidity_sensitivity).
Ensure sufficient historical data for Nash and liquidity calculations.
If tables overlap, adjust position.top_right/bottom_right coordinates.
4. Key Differences from the Previous Indicator
Indicator vs. Strategy: The previous code was an indicator (VP + Game Theory Integrated Strategy) focused on visualization and alerts. This is a strategy with automated entries/exits and backtesting.
Volume Profile: Absent in this strategy, making it lighter but less focused on high-volume zones.
Wick Analysis: Not included here, unlike the previous indicator's heavy reliance on wick patterns.
Backtesting: This strategy includes detailed performance metrics and a backtest table, absent in the indicator.
Simpler Signals: Focuses on Game Theory signals (contrarian, momentum, Nash reversion) without the "Power/Ultra Power" hierarchy.
Risk Management: Explicit SL/TP and dynamic position sizing, not present in the indicator.
5. Conclusion
The "Game Theory Trading Strategy" is a sophisticated system leveraging herd behavior, institutional flows, liquidity traps, and Nash equilibrium to trade market inefficiencies. It’s designed for traders who understand Game Theory principles and want automated execution with robust risk management. However, it requires thorough backtesting and parameter optimization for specific markets (e.g., forex, crypto, stocks). The backtest table and visual aids make it easy to monitor performance, but always combine with other analysis tools and proper capital management.
If you need help with backtesting, adding alerts, or optimizing parameters, let me know!

Ultimate Scalping Strategy v2Strategy Overview
This is a versatile scalping strategy designed primarily for low timeframes (like 1-min, 3-min, or 5-min charts). Its core logic is based on a classic EMA (Exponential Moving Average) crossover system, which is then filtered by the VWAP (Volume-Weighted Average Price) to confirm the trade's direction in alignment with the market's current intraday sentiment.
The strategy is highly customizable, allowing traders to add layers of confirmation, control trade direction, and manage exits with precision.
Core Strategy Logic
The strategy's entry signals are generated when two primary conditions are met simultaneously:
Momentum Shift (EMA Crossover): It looks for a crossover between a fast EMA (default length 9) and a slow EMA (default length 21).
Buy Signal: The fast EMA crosses above the slow EMA, indicating a potential shift to bullish momentum.
Sell Signal: The fast EMA crosses below the slow EMA, indicating a potential shift to bearish momentum.
Trend/Sentiment Filter (VWAP): The crossover signal is only considered valid if the price is on the "correct" side of the VWAP.
For a Buy Signal: The price must be trading above the VWAP. This confirms that, on average, buyers are in control for the day.
For a Sell Signal: The price must be trading below the VWAP. This confirms that sellers are generally in control.
Confirmation Filters (Optional)
To increase the reliability of the signals and reduce false entries, the strategy includes two optional confirmation filters:
Price Action Filter (Engulfing Candle): If enabled (Use Price Action), the entry signal is only valid if the crossover candle is also an "engulfing" candle.
A Bullish Engulfing candle is a large green candle that completely "engulfs" the body of the previous smaller red candle, signaling strong buying pressure.
A Bearish Engulfing candle is a large red candle that engulfs the previous smaller green candle, signaling strong selling pressure.
Volume Filter (Volume Spike): If enabled (Use Volume Confirmation), the entry signal must be accompanied by a surge in volume. This is confirmed if the volume of the entry candle is greater than its recent moving average (default 20 periods). This ensures the move has strong participation behind it.
Exit Strategy
A position can be closed in one of three ways, creating a comprehensive exit plan:
Stop Loss (SL): A fixed stop loss is set at a level determined by a multiple of the Average True Range (ATR). For example, a 1.5 multiplier places the stop 1.5 times the current ATR value away from the entry price. This makes the stop dynamic, adapting to market volatility.
Take Profit (TP): A fixed take profit is also set using an ATR multiplier. By setting the TP multiplier higher than the SL multiplier (e.g., 2.0 for TP vs. 1.5 for SL), the strategy aims for a positive risk-to-reward ratio on each trade.
Exit on Opposite Signal (Reversal): If enabled, an open position will be closed automatically if a valid entry signal in the opposite direction appears. For example, if you are in a long trade and a valid short signal occurs, the strategy will exit the long position immediately. This feature turns the strategy into more of a reversal system.
Key Features & Customization
Trade Direction Control: You can enable or disable long and short trades independently using the Allow Longs and Allow Shorts toggles. This is useful for trading in harmony with a higher-timeframe trend (e.g., only allowing longs in a bull market).
Visual Plots: The strategy plots the Fast EMA, Slow EMA, and VWAP on the chart for easy visualization of the setup. It also plots up/down arrows to mark where valid buy and sell signals occurred.
Dynamic SL/TP Line Plotting: A standout feature is that the strategy automatically draws the exact Stop Loss and Take Profit price lines on the chart for every active trade. These lines appear when a trade is entered and disappear as soon as it is closed, providing a clear visual of your risk and reward targets.
Alerts: The script includes built-in alertcondition calls. This allows you to create alerts in TradingView that can notify you on your phone or execute trades automatically via a webhook when a long or short signal is generated.

MVO - MA Signal StrategyStrategy Description: MA Signal Strategy with Heikin Ashi, Break-even and Trailing Stop
⸻
🔍 Core Concept
This strategy enters long or short trades based on Heikin Ashi candles crossing above or below a moving average (MA), with optional confirmation from the Money Flow Index (MFI). It includes:
• Dynamic stop loss and take profit levels based on ATR
• Optional break-even stop adjustment
• Optional trailing stop activation after breakeven
• Full visual feedback for trades and zones
⸻
⚙️ Indicators Used
• Heikin Ashi Candles: Smooth price action to reduce noise.
• Simple Moving Average (MA): Determines trend direction.
• Average True Range (ATR): Sets volatility-based SL/TP.
• Money Flow Index (MFI): Optional momentum filter for entries.
⸻
📈 Trade Entry Logic
✅ Long Entry:
Triggered if:
• Heikin Ashi close crosses above the MA
or
• MFI is below 20 and Heikin Ashi close is above the MA
❌ Short Entry:
Triggered if:
• Heikin Ashi close crosses below the MA
or
• MFI is above 90 and Heikin Ashi close is below the MA
⸻
🛑 Stop Loss & Take Profit
• SL is set using riskMult * ATR
• TP is set using rewardMult * ATR
Example:
• If ATR = 10, riskMult = 1, rewardMult = 5
→ SL = 10 points, TP = 50 points from entry
⸻
⚖️ Break-even Logic (Optional)
• If price moves in your favor by breakevenTicks * ATR, SL is moved to entry price.
• Enabled via checkbox Enable Break Even.
⸻
📉 Trailing Stop Logic (Optional)
• Once break-even is hit, a trailing stop starts moving behind price by trailATRmult * ATR.
• Trailing stop only activates after break-even is reached.
• Enabled via checkbox Enable Trailing Stop.
📊 Visual Elements
• Heikin Ashi candles are drawn on the main chart.
• Trade zones are shaded between SL and TP during open trades.
• Lines mark Entry, SL, TP, Break-even trigger.
• Markers show entries and exits:
• Green/red triangles = long/short entries
• ✅ = Take profit hit
• ❌ = Stop loss hit
✅ Best Use Case
• Trending markets with strong pullbacks
• Works on multiple timeframes
• Better suited for assets with consistent volatility (ATR behavior)

Enhanced Market Structure StrategyATR-Based Risk Management:
Stop Loss: 2 ATR from entry (configurable)
Take Profit: 3 ATR from entry (configurable)
Dynamic Position Sizing: Based on ATR stop distance and max risk percentage
Advanced Signal Filters:
RSI Filter:
Long trades: RSI < 70 and > 40 (avoiding overbought)
Short trades: RSI > 30 and < 60 (avoiding oversold)
Volume Filter:
Requires volume > 1.2x the 20-period moving average
Ensures institutional participation
MACD Filter (Optional):
Long: MACD line above signal line and rising
Short: MACD line below signal line and falling
EMA Trend Filter:
50-period EMA for trend confirmation
Long trades require price above rising EMA
Short trades require price below falling EMA
Higher Timeframe Filter:
Uses 4H/Daily EMA for multi-timeframe confluence
Enhanced Entry Logic:
Regular Entries: IDM + BOS + ALL filters must pass
Sweep Entries: Failed breakouts with tighter stops (1.6 ATR)
High-Probability Focus: Only trades when multiple confirmations align
Visual Improvements:
Detailed Entry Labels: Show entry, stop, target, and risk percentage
SL/TP Lines: Visual representation of risk/reward
Filter Status: Bar coloring shows when all filters align
Comprehensive Statistics: Real-time performance metrics
Key Strategy Parameters:
pinescript// Recommended Settings for Different Markets:
// Forex (4H-Daily):
// - CHoCH Period: 50-75
// - ATR SL: 2.0, ATR TP: 3.0
// - All filters enabled
// Crypto (1H-4H):
// - CHoCH Period: 30-50
// - ATR SL: 2.5, ATR TP: 4.0
// - Volume filter especially important
// Indices (4H-Daily):
// - CHoCH Period: 50-100
// - ATR SL: 1.8, ATR TP: 2.7
// - EMA and MACD filters crucial
Expected Performance Improvements:
Win Rate: 55-70% (improved filtering)
Profit Factor: 2.0-3.5+ (better risk/reward with ATR)
Reduced Drawdown: Stricter filters reduce false signals
Consistent Risk: ATR-based stops adapt to volatility
This enhanced version provides much more robust signal filtering while maintaining the core market structure edge, resulting in higher-probability trades with consistent risk management.

ORB Scalp setup by UnenbatDescription
ORB Scalp Setup by Unenbat is a precise breakout scalping tool that identifies short-term price ranges at the transition between hourly sessions.
📌 Core Features:
Draws a dynamic box using the price range from the last 3 minutes of the previous hour and the first 3 minutes of the new hour (total 5m59s range).
Automatically plots:
Box representing the selected range.
Opening Price Line at the start of the hour.
TP Lines (Take Profit) above and below the box at customizable distances.
BE Lines (Break-Even) above and below the box at customizable distances.
Box and line lengths are user-defined (default: 60 minutes).
Works across historical data (up to the last 100 days).
Fully customizable visuals (colors, offsets, visibility toggles).
🎯 How to Use:
Ideal for scalp traders using breakout strategies.
Enter trades when price breaks above or below the box range.
Use TP and BE lines as clear reference levels for exits or trailing stop logic.
⚙️ Custom Settings:
Enable/disable each component (box, open line, TP line, BE line).
Set your own offset in pips for TP/BE lines.
Adjust the box duration to match your trading style.
Modify start and end times of the range as needed.

BARTRADINGPREDV4Please note, that all of the indicators on the chart are working together. I am showing all of the indicators so that you might see the benefits of these indicators working as one. Do your own research. Trade smart. I code tools not advice. So please make decisions based on your trading style and knowledge. Use my scripts freely but please note they are protected by Mozilla.
Script Summary: BARTRADINGPREDV4
This Pine Script indicator is a comprehensive trading tool that overlays on your TradingView chart. It combines moving averages, regression channels, volume analysis, RSI filtering, and pattern recognition to assist in making trading decisions. It also provides a forward-looking projection to help anticipate future price movement.
Key Features & Logic
1. Moving Averages
HMA (High Moving Average): Simple moving average of the high price over a user-defined lookback period.
LMA (Low Moving Average): Simple moving average of the low price over the same period.
HLMA (High-Low Moving Average): The average of HMA and LMA, providing a midline reference.
2. RSI Filtering
Optionally enables a Relative Strength Index (RSI) filter to help avoid trades when the market is not trending strongly.
Only allows buy signals if RSI is above 50, and sell signals if RSI is below 50 (if enabled).
3. Signal Generation
BUY Signal: Triggered when HL2 (average of OHLC) crosses over LMA and (optionally) RSI > 50.
SELL Signal: Triggered when HL2 crosses under HMA and (optionally) RSI < 50.
XSB (Extra Strong Buy): HL2 crosses over HMA, is above HLMA, up volume is greater than down volume, and (optionally) RSI > 50.
XBS (Extra Strong Sell): HL2 crosses under LMA, is below HLMA, down volume is greater than up volume, and (optionally) RSI < 50.
Enable/Disable XSB/XBS: You can turn these signals on or off via script inputs.
4. Take Profit (TP) and Stop Loss (SL) Levels
TP and SL are dynamically calculated based on the difference between HMA and LMA, providing contextually relevant exit levels.
5. Regression Channel and Prediction
Linear Regression Line: Plots a regression line over the lookback period to show the underlying trend.
ATR Channel: Adds an upper and lower channel around the regression line using ATR (Average True Range) for a realistic prediction envelope.
Forward Projection: Projects the regression line forward by a user-defined number of bars, visually showing where the trend could extend if current momentum persists.
6. Pattern Recognition
Higher Highs/Lows and Lower Highs/Lows: Marks bars where new higher highs/lows or lower highs/lows are set, helping you spot trend continuation or reversal points.
7. Status Table
A table shows the current price’s relationship to HMA, HLMA, and LMA, color-coded for quick visual interpretation.
User Instructions
Inputs
Number of Lookback Bars: Sets the period for all moving averages and regression calculations.
Prediction Length: (Legacy; not used in current logic.)
TURN ON OR OFF XSB/XBS Signal: Toggle extra strong buy/sell signals.
Enable RSI Filter: Only allow signals when RSI is in the correct zone.
RSI Period: Sets the sensitivity of the RSI filter.
Table Position: Choose where the status table appears on your chart.
ATR Length & Multiplier: Control the width of the regression prediction channel.
Bars Forward (Projection): Number of bars to project the regression line into the future.
How to Use
Add the script to your TradingView chart.
Adjust inputs to suit your asset and timeframe.
Interpret signals:
BUY (B) and SELL (S): Appear as green/red labels below/above bars.
XSB (blue) and XBS (orange): Indicate extra strong buy/sell conditions.
HH/HL (green triangles): New higher highs/lows.
LH/LL (red triangles): New lower highs/lows.
Watch the regression channel: The yellow regression line shows the trend; the shaded band indicates expected volatility.
Check the projection: The dashed magenta line projects the regression trend forward, giving a visual target for price continuation.
Use the table: Quickly see if price is above or below each moving average.
Interpreting the Prediction Aspects
Regression Line & Channel
Regression Line (Yellow): Represents the best-fit line of price over the lookback period, showing overall trend direction.
ATR Channel: The upper and lower bands (yellow, semi-transparent) account for typical volatility, suggesting a range where price is likely to stay if the trend continues.
Forward Projection
Dashed Magenta Line: Projects the regression line forward by the specified number of bars, using the current slope. This is a trend continuation forecast—not a guarantee, but a statistically reasonable path if current conditions persist.
How to use: If price is respecting the regression trend and within the channel, the projection provides a visual target for where price might go in the near future.
TP/SL Levels
TP (Take Profit): Suggests a price target above the current HL2, based on recent volatility.
SL (Stop Loss): Suggests a protective stop below HL2.
Best Practices & Warnings
No indicator is perfect! Always combine signals with your own analysis and risk management.
Regression projection is not a crystal ball: It simply extends the current trend, which can and will change, especially after big news or at support/resistance.
Use on liquid, trending assets for best results.
Adjust lookback and ATR settings for your market and timeframe.
Summary Table Example
Price vs HMA vs HLMA vs LMA
43000 +100 +50 -20
Green: Price is above average (bullish).
Red: Price is below average (bearish).
Yellow: Price is very close to the average (neutral).
Final Notes
This script is designed to be a multi-tool for trend trading and prediction, combining classic and modern techniques. The forward projection helps visualize possible future price action, while signals and overlays keep you informed of trend shifts and trade opportunities.

Adaptive Trend Cloud + Smart Reversal Zones [@darshakssc]This indicator combines a volatility-adjusted trend cloud with RSI- and volume-based reversal signals to help traders visually spot potential trend continuation or reversal zones.
It’s designed to look clean, colorful, and informative — great for both beginners and experienced traders looking for chart clarity and actionable insights.
🔍 How It Works
🔵 1. Trend Cloud
1. The cloud is created using a 34-period EMA as the base and adjusted with a 14-period ATR multiplier.
2. When price is above the EMA, the cloud turns green (bullish).
3. When price is below the EMA, it turns red (bearish).
4. A neutral gray tone shows when price is inside the cloud, signaling potential indecision.
🔁 2. Smart Reversal Signal Logic
1. Signals appear only when price enters the cloud zone, indicating a potential change in direction.
2. To confirm the reversal, the following conditions must also be met:
3. RSI is below 40 (for bullish reversals) or above 60 (for bearish reversals)
4. A volume spike occurs (1.8× the 20-bar volume average)
5. A cooldown of 10 bars between signals prevents overplotting
🎯 3. TP & SL Labels
1. When a valid buy or sell signal appears:
🎯 TP (Take Profit) is placed at 2× ATR distance
🛑 SL (Stop Loss) is placed at 1× ATR distance
These levels are shown via chart labels for visual reference
🛎️ 4. Alerts
1. Built-in alerts trigger on:
🟢 Buy reversal signals
🔴 Sell reversal signals
✅ How to Use
1. Apply the indicator to any chart (works best on 5min–4h timeframes)
2. Look for the 🟢 Buy / 🔴 Sell labels when price touches the cloud
3. Use the visual TP/SL markers as reference zones — not financial advice
4. Combine with your own risk management, price action or confluence tools
⚙️ Customization Options
1. EMA & ATR lengths and multipliers
2. RSI and volume thresholds
3. Signal cooldown to reduce noise
4. Toggle TP/SL zones on or off
⚠️ Disclaimer
This script is for educational purposes only and does not constitute financial advice. Always test on demo accounts and combine with your own trading system.

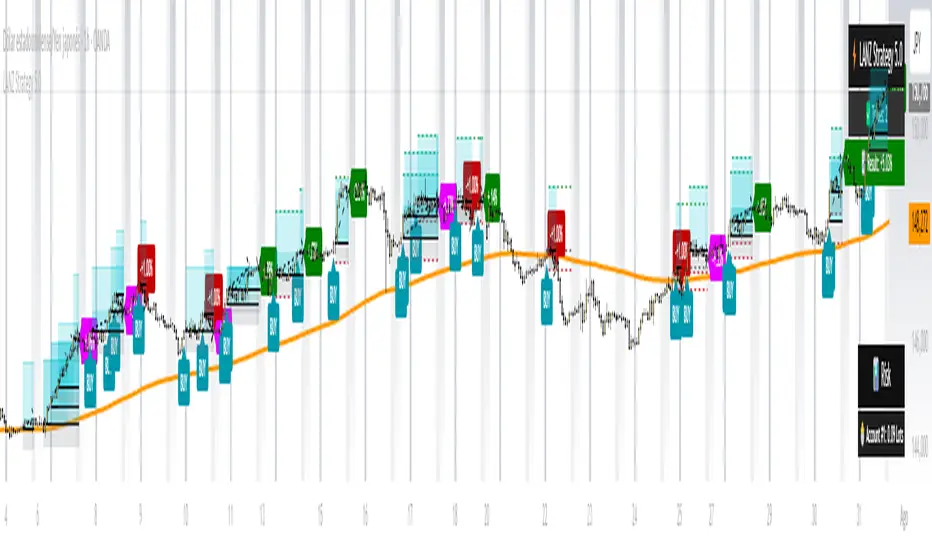
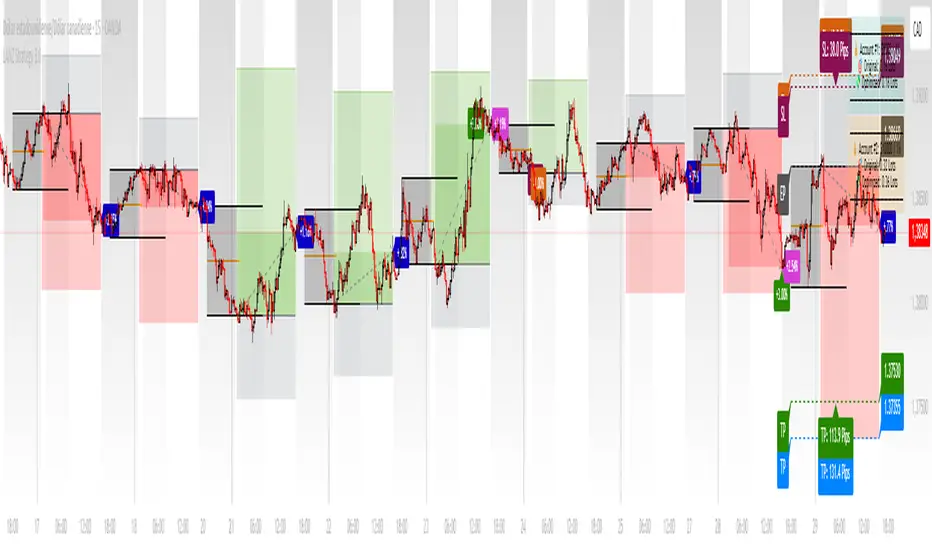
LANZ Strategy 6.0 [Backtest]🔷 LANZ Strategy 6.0 — Precision Backtesting Based on 09:00 NY Candle, Dynamic SL/TP, and Lot Size per Trade
LANZ Strategy 6.0 is the simulation version of the original LANZ 6.0 indicator. It executes a single LIMIT BUY order per day based on the 09:00 a.m. New York candle, using dynamic Stop Loss and Take Profit levels derived from the candle range. Position sizing is calculated automatically using capital, risk percentage, and pip value — allowing accurate trade simulation and performance tracking.
📌 This is a strategy script — It simulates real trades using strategy.entry() and strategy.exit() with full money management for risk-based backtesting.
🧠 Core Logic & Trade Conditions
🔹 BUY Signal Trigger:
At 09:00 a.m. NY (New York time), if:
The current candle is bullish (close > open)
→ A BUY order is placed at the candle’s close price (EP)
Only one signal is evaluated per day.
⚙️ Stop Loss / Take Profit Logic
SL can be:
Wick low (0%)
Or dynamically calculated using a % of the full candle range
TP is calculated using the user-defined Risk/Reward ratio (e.g., 1:4)
The TP and SL levels are passed to strategy.exit() for each trade simulation.
💰 Risk Management & Lot Size Calculation
Before placing the trade:
The system calculates pip distance from EP to SL
Computes the lot size based on:
Account capital
Risk % per trade
Pip value (auto or manual)
This ensures every trade uses consistent, scalable risk regardless of instrument.
🕒 Manual Close at 3:00 p.m. NY
If the trade is still open by 15:00 NY time, it will be closed using strategy.close().
The final result is the actual % gain/loss based on how far price moved relative to SL.
📊 Backtest Accuracy
One trade per day
LIMIT order at the candle close
SL and TP pre-defined at execution
No repainting
Session-restricted (only runs on 1H timeframe)
✅ Ideal For:
Traders who want to backtest a clean and simple daily entry system
Strategy developers seeking reproducible, high-conviction trades
Users who prefer non-repainting, session-based simulations
👨💻 Credits:
💡 Developed by: LANZ
🧠 Logic & Money Management Engine: LANZ
📈 Designed for: 1H charts
🧪 Purpose: Accurate simulation of LANZ 6.0's NY Candle Entry system

LANZ Strategy 5.0🔷 LANZ Strategy 5.0 — Intraday BUY Signals, Dynamic Lot Size per Account, Real-Time Dashboard and Smart Execution
LANZ Strategy 5.0 is a powerful intraday tool designed for traders who need a visual-first, data-backed BUY system, enhanced with risk-aware lot size calculation and a real-time performance dashboard. This indicator intelligently detects strong momentum setups and provides visual and statistical clarity throughout the session.
📌 This is an indicator, not a strategy — It does not place trades automatically but provides precise conditions, alerts, and visual guides to support execution.
🧠 Core Logic & Features
BUY Entry Conditions (Signal Engine)
A BUY signal is triggered when:
The current price is above the EMA200 (trend filter)
The last 3 candles are bullish (candle body close > open)
You are within the defined session window (NY time)
When all conditions are met and you haven’t reached the daily trade limit, a signal appears on the chart and an optional alert is triggered.
Operational Hours Filter (NY Time)
You define:
Start time (e.g., 01:15 NY)
End time (e.g., 16:00 NY)
The system only evaluates and executes signals within this period. If a BUY setup occurs outside the window, it’s ignored. The chart is also highlighted with a transparent teal background to visually show active trading hours.
Lot Size Panel with Per-Account Risk Management
Designed for traders managing multiple accounts or capital sources. You can enable up to 5 accounts, each with:
Its own capital
Its own risk percentage per trade
The system uses the defined SL in pips, plus the instrument’s pip value, to calculate the lot size per account. All values are shown in a dedicated panel at the bottom-right, automatically updating with each new trade.
The emojis (🐣🦊🦁🐲🐳) distinguish each account visually.
Trade Visualization with Customizable Lines
When a signal is triggered:
An Entry Point (EP) line is drawn at the candle’s close.
A Stop Loss (SL) line is placed X pips below the entry.
A Take Profit (TP) line is placed Y pips above the entry.
All three lines are fully customizable in style, color, and thickness. You define how many bars the lines should extend.
Outcome Tracking & Real-Time Dashboard
Each trade outcome is measured:
SL hit = –1.00%
TP hit = +3.00%
Manual close = calculated dynamically based on price at close time
Each result is labeled on the chart near its level, and stored.
The top-right dashboard updates in real time:
✅ Number of trades
📈 Cumulative % gain/loss of the day (color-coded)
Alerts You Can Trust:
You’ll get a Buy Alert when a valid signal is formed
You’ll get a Trade Executed Alert when the visual operation is plotted
You’ll get a SL/TP Hit Alert with price and result
You’ll get a Manual Close Alert if the configured time is reached and the trade is still active
⚙️ Step-by-Step Execution Flow
At every bar, the system checks:
Are we within the session time window?
Is price above EMA?
Are the last 3 candles bullish?
✅ If yes:
A BUY signal is plotted
Entry/SL/TP lines are drawn
Lot sizes are calculated and displayed
Trade is added to the daily count
🕐 At the configured Manual Close time (e.g., 16:00 NY):
If the trade is still open, it's closed
A label is added with the exact result in %
💡 Ideal For:
Intraday traders who operate within fixed time sessions
Traders managing multiple accounts or capital pools
Anyone who wants full visual clarity of every decision point
Traders who appreciate dynamic lot size calculation and clean execution tracking
👨💻 Credits:
💡 Developed by: LANZ
🧠 Strategy concept & execution model: LANZ
🧪 Tested on: 1H charts with visual-only execution
📈 Designed for: Clarity, adaptability, and full intraday control
Long/Short/Exit/Risk management Strategy # LongShortExit Strategy Documentation
## Overview
The LongShortExit strategy is a versatile trading system for TradingView that provides complete control over entry, exit, and risk management parameters. It features a sophisticated framework for managing long and short positions with customizable profit targets, stop-loss mechanisms, partial profit-taking, and trailing stops. The strategy can be enhanced with continuous position signals for visual feedback on the current trading state.
## Key Features
### General Settings
- **Trading Direction**: Choose to trade long positions only, short positions only, or both.
- **Max Trades Per Day**: Limit the number of trades per day to prevent overtrading.
- **Bars Between Trades**: Enforce a minimum number of bars between consecutive trades.
### Session Management
- **Session Control**: Restrict trading to specific times of the day.
- **Time Zone**: Specify the time zone for session calculations.
- **Expiration**: Optionally set a date when the strategy should stop executing.
### Contract Settings
- **Contract Type**: Select from common futures contracts (MNQ, MES, NQ, ES) or custom values.
- **Point Value**: Define the dollar value per point movement.
- **Tick Size**: Set the minimum price movement for accurate calculations.
### Visual Signals
- **Continuous Position Signals**: Implement 0 to 1 visual signals to track position states.
- **Signal Plotting**: Customize color and appearance of position signals.
- **Clear Visual Feedback**: Instantly see when entry conditions are triggered.
### Risk Management
#### Stop Loss and Take Profit
- **Risk Type**: Choose between percentage-based, ATR-based, or points-based risk management.
- **Percentage Mode**: Set SL/TP as a percentage of entry price.
- **ATR Mode**: Set SL/TP as a multiple of the Average True Range.
- **Points Mode**: Set SL/TP as a fixed number of points from entry.
#### Advanced Exit Features
- **Break-Even**: Automatically move stop-loss to break-even after reaching specified profit threshold.
- **Trailing Stop**: Implement a trailing stop-loss that follows price movement at a defined distance.
- **Partial Profit Taking**: Take partial profits at predetermined price levels:
- Set first partial exit point and percentage of position to close
- Set second partial exit point and percentage of position to close
- **Time-Based Exit**: Automatically exit a position after a specified number of bars.
#### Win/Loss Streak Management
- **Streak Cutoff**: Automatically pause trading after a series of consecutive wins or losses.
- **Daily Reset**: Option to reset streak counters at the start of each day.
### Entry Conditions
- **Source and Value**: Define the exact price source and value that triggers entries.
- **Equals Condition**: Entry signals occur when the source exactly matches the specified value.
### Performance Analytics
- **Real-Time Stats**: Track important performance metrics like win rate, P&L, and largest wins/losses.
- **Visual Feedback**: On-chart markers for entries, exits, and important events.
### External Integration
- **Webhook Support**: Compatible with TradingView's webhook alerts for automated trading.
- **Cross-Platform**: Connect to external trading systems and notification platforms.
- **Custom Order Execution**: Implement advanced order flows through external services.
## How to Use
### Setup Instructions
1. Add the script to your TradingView chart.
2. Configure the general settings based on your trading preferences.
3. Set session trading hours if you only want to trade specific times.
4. Select your contract specifications or customize for your instrument.
5. Configure risk parameters:
- Choose your preferred risk management approach
- Set appropriate stop-loss and take-profit levels
- Enable advanced features like break-even, trailing stops, or partial profit taking as needed
6. Define entry conditions:
- Select the price source (such as close, open, high, or an indicator)
- Set the specific value that should trigger entries
### Entry Condition Examples
- **Example 1**: To enter when price closes exactly at a whole number:
- Long Source: close
- Long Value: 4200 (for instance, to enter when price closes exactly at 4200)
- **Example 2**: To enter when an indicator reaches a specific value:
- Long Source: ta.rsi(close, 14)
- Long Value: 30 (triggers when RSI equals exactly 30)
### Best Practices
1. **Always backtest thoroughly** before using in live trading.
2. **Start with conservative risk settings**:
- Small position sizes
- Reasonable stop-loss distances
- Limited trades per day
3. **Monitor and adjust**:
- Use the performance table to track results
- Adjust parameters based on how the strategy performs
4. **Consider market volatility**:
- Use ATR-based stops during volatile periods
- Use fixed points during stable markets
## Continuous Position Signals Implementation
The LongShortExit strategy can be enhanced with continuous position signals to provide visual feedback about the current position state. These signals can help you track when the strategy is in a long or short position.
### Adding Continuous Position Signals
Add the following code to implement continuous position signals (0 to 1):
```pine
// Continuous position signals (0 to 1)
var float longSignal = 0.0
var float shortSignal = 0.0
// Update position signals based on your indicator's conditions
longSignal := longCondition ? 1.0 : 0.0
shortSignal := shortCondition ? 1.0 : 0.0
// Plot continuous signals
plot(longSignal, title="Long Signal", color=#00FF00, linewidth=2, transp=0, style=plot.style_line)
plot(shortSignal, title="Short Signal", color=#FF0000, linewidth=2, transp=0, style=plot.style_line)
```
### Benefits of Continuous Position Signals
- Provides clear visual feedback of current position state (long/short)
- Signal values stay consistent (0 or 1) until condition changes
- Can be used for additional calculations or alert conditions
- Makes it easier to track when entry conditions are triggered
### Using with Custom Indicators
You can adapt the continuous position signals to work with any custom indicator by replacing the condition with your indicator's logic:
```pine
// Example with moving average crossover
longSignal := fastMA > slowMA ? 1.0 : 0.0
shortSignal := fastMA < slowMA ? 1.0 : 0.0
```
## Webhook Integration
The LongShortExit strategy is fully compatible with TradingView's webhook alerts, allowing you to connect your strategy to external trading platforms, brokers, or custom applications for automated trading execution.
### Setting Up Webhooks
1. Create an alert on your chart with the LongShortExit strategy
2. Enable the "Webhook URL" option in the alert dialog
3. Enter your webhook endpoint URL (from your broker or custom trading system)
4. Customize the alert message with relevant information using TradingView variables
### Webhook Message Format Example
```json
{
"strategy": "LongShortExit",
"action": "{{strategy.order.action}}",
"price": "{{strategy.order.price}}",
"quantity": "{{strategy.position_size}}",
"time": "{{time}}",
"ticker": "{{ticker}}",
"position_size": "{{strategy.position_size}}",
"position_value": "{{strategy.position_value}}",
"order_id": "{{strategy.order.id}}",
"order_comment": "{{strategy.order.comment}}"
}
```
### TradingView Alert Condition Examples
For effective webhook automation, set up these alert conditions:
#### Entry Alert
```
{{strategy.position_size}} != {{strategy.position_size}}
```
#### Exit Alert
```
{{strategy.position_size}} < {{strategy.position_size}} or {{strategy.position_size}} > {{strategy.position_size}}
```
#### Partial Take Profit Alert
```
strategy.order.comment contains "Partial TP"
```
### Benefits of Webhook Integration
- **Automated Trading**: Execute trades automatically through supported brokers
- **Cross-Platform**: Connect to custom trading bots and applications
- **Real-Time Notifications**: Receive trade signals on external platforms
- **Data Collection**: Log trade data for further analysis
- **Custom Order Management**: Implement advanced order types not available in TradingView
### Compatible External Applications
- Trading bots and algorithmic trading software
- Custom order execution systems
- Discord, Telegram, or Slack notification systems
- Trade journaling applications
- Risk management platforms
### Implementation Recommendations
- Test webhook delivery using a free service like webhook.site before connecting to your actual trading system
- Include authentication tokens or API keys in your webhook URL or payload when required by your external service
- Consider implementing confirmation mechanisms to verify trade execution
- Log all webhook activities for troubleshooting and performance tracking
## Strategy Customization Tips
### For Scalping
- Set smaller profit targets (1-3 points)
- Use tighter stop-losses
- Enable break-even feature after small profit
- Set higher max trades per day
### For Day Trading
- Use moderate profit targets
- Implement partial profit taking
- Enable trailing stops
- Set reasonable session trading hours
### For Swing Trading
- Use longer-term charts
- Set wider stops (ATR-based often works well)
- Use higher profit targets
- Disable daily streak reset
## Common Troubleshooting
### Low Win Rate
- Consider widening stop-losses
- Verify that entry conditions aren't triggering too frequently
- Check if the equals condition is too restrictive; consider small tolerances
### Missing Obvious Trades
- The equals condition is extremely precise. Price must exactly match the specified value.
- Consider using floating-point precision for more reliable triggers
### Frequent Stop-Outs
- Try ATR-based stops instead of fixed points
- Increase the stop-loss distance
- Enable break-even feature to protect profits
## Important Notes
- The exact equals condition is strict and may result in fewer trade signals compared to other conditions.
- For instruments with decimal prices, exact equality might be rare. Consider the precision of your value.
- Break-even and trailing stop calculations are based on points, not percentage.
- Partial take-profit levels are defined in points distance from entry.
- The continuous position signals (0 to 1) provide valuable visual feedback but don't affect the strategy's trading logic directly.
- When implementing continuous signals, ensure they're aligned with the actual entry conditions used by the strategy.
---
*This strategy is for educational and informational purposes only. Always test thoroughly before using with real funds.*

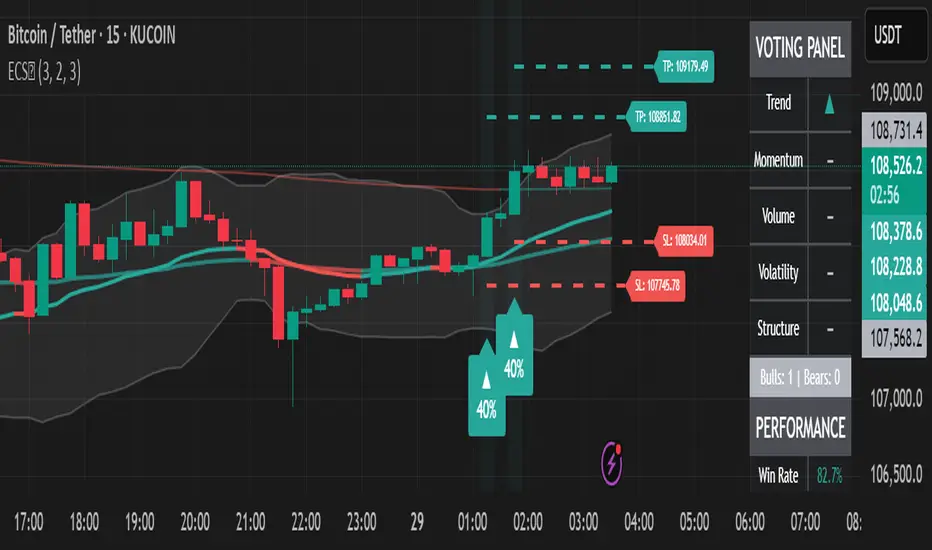
Ensemble Consensus System
The Ensemble Consensus System (ECS) brings a **Random Forest-style ensemble vote** to Pine Script: five orthogonal "expert" strategies each cast a bull/bear vote (+1/-1/0), and only high-confidence consensus moves become signals—dramatically reducing noise while capturing strong directional moves.
## What Makes This Original
ECS is the first Pine Script indicator to implement true machine learning-style ensemble voting. Rather than relying on a single methodology, five independent experts analyze different market dimensions:
• **Trend Expert**: Multi-timeframe EMA alignment analysis
• **Momentum Expert**: RSI/MACD/Stochastic confluence with consistency filters
• **Volume Expert**: Proprietary volume pressure + OBV confirmation
• **Volatility Expert**: Bollinger Band mean reversion opportunities
• **Structure Expert**: Adaptive pivot-based support/resistance detection
## How It Works
The system requires consensus among experts, with an **adaptive threshold** based on market volatility:
| Volatility Regime | ATR/Close | Votes Required |
|-------------------|-----------|----------------|
| Low Volatility | <1% | 2+ |
| Normal Markets | 1-2% | 3+ |
| High Volatility | >2% | 4+ |
This dynamic adjustment prevents overtrading in choppy conditions while maintaining responsiveness during strong trends.
## Key Features
### Signals
• **Visual entry points** with strength percentage (60% = 3/5 experts agree)
• **Adaptive thresholds** that adjust to market conditions
• **Multi-expert consensus** reduces false signals
### Risk Control
• **Dynamic stop-loss/take-profit** based on ATR
• **Regime-adjusted targets** (±50% in volatile markets)
• **Visual SL/TP lines** with exact price labels
### Analytics
• **Real-time vote panel** showing each expert's stance
• **Performance tracking** with win rate and P/L
• **Market regime indicator** (Trending/Ranging/Volatile)
• **Light Mode** for better performance on slower systems
## How to Use
1. **Apply ECS** to a liquid instrument on 15m-4H timeframe (best: 1H)
2. **Wait for signal** - green ▲ for long, red ▼ for short with strength %
3. **Verify votes** - check panel to see which experts agree
4. **Execute trade** using the displayed SL/TP levels
5. **Monitor regime** - be cautious if market regime changes
### Quick Start Settings
• **Standard Trading**: Use defaults (3 votes, adaptive mode ON)
• **Conservative**: Increase to 4 votes minimum
• **Aggressive**: Reduce to 2 votes, tighten stops
## Important Limitations
• **Chart Types**: Not compatible with Renko/Heikin-Ashi
• **Volume Data**: Requires reliable volume (forex pairs may underperform)
• **News Events**: Signals may lag during gaps/major announcements
• **Processing**: Heavy calculations - use Light Mode if needed
## Settings Guide
**Ensemble Controls**
• `Minimum Votes` (default: 3): Base threshold before volatility adjustment
• `Adaptive Mode` (default: ON): Auto-adjusts threshold by market volatility
**Visual Options**
• `Vote Panel`: Live expert voting display
• `Performance Stats`: Win rate and trade tracking
• `Light Mode`: Disables heavy visuals for speed
**Risk Parameters**
• `Stop Multiplier` (default: 2.0): ATR multiple for stop-loss
• `TP Multiplier` (default: 3.0): ATR multiple for take-profit
• `Dynamic TP` (default: ON): Adjusts targets by market regime
## Troubleshooting
**Too few signals?**
→ Lower minimum votes or check if market is ranging
**Indicator running slow?**
→ Enable Light Mode, disable performance tracking
**Weird volume votes?**
→ Verify your symbol has accurate volume data
## Technical Concepts
The ensemble approach mimics **Random Forest algorithms** where multiple decision trees vote on outcomes. By requiring agreement among experts using orthogonal methodologies, ECS filters out signals that would fail under different market lenses. The adaptive threshold addresses fixed-parameter weakness by dynamically adjusting selectivity based on volatility.
• Adaptive pivot lookback for dynamic structure detection
• Safe volume pressure calculation preventing division errors
• Momentum consistency filter reducing choppy false signals
• Unified dashboard merging vote panel + performance stats
• Regime-based dynamic take-profit adjustment
*Educational indicator demonstrating ensemble methods in Pine Script. No guarantee of future performance. Always use proper risk management and position sizing.*
EMA Pullback Speed Strategy 📌 **Overview**
The **EMA Pullback Speed Strategy** is a trend-following approach that combines **price momentum** and **Exponential Moving Averages (EMA)**.
It aims to identify high-probability entry points during brief pullbacks within ongoing uptrends or downtrends.
The strategy evaluates **speed of price movement**, **relative position to dynamic EMA**, and **candlestick patterns** to determine ideal timing for entries.
One of the key concepts is checking whether the price has **“not pulled back too much”**, helping focus only on situations where the trend is likely to continue.
⚠️ This strategy is designed for educational and research purposes only. It does not guarantee future profits.
🧭 **Purpose**
This strategy addresses the common issue of **"jumping in too late during trends and taking unnecessary losses."**
By waiting for a healthy pullback and confirming signs of **trend resumption**, traders can enter with greater confidence and reduce false entries.
🎯 **Strategy Objectives**
* Enter in the direction of the prevailing trend to increase win rate
* Filter out false signals using pullback depth, speed, and candlestick confirmations
* Predefine Take-Profit (TP) and Stop-Loss (SL) levels for safer, rule-based trading
✨ **Key Features**
* **Dynamic EMA**: Reacts faster when price moves quickly, slower when market is calm – adapting to current momentum
* **Pullback Filter**: Avoids trades when price pulls back too far (e.g., more than 5%), indicating a trend may be weakening
* **Speed Check**: Measures how strongly the price returns to the trend using candlestick body speed (open-to-close range in ticks)
📊 **Trading Rules**
**■ Long Entry Conditions:**
* Current price is above the dynamic EMA (indicating uptrend)
* Price has pulled back toward the EMA (a "buy the dip" situation)
* Pullback depth is within the threshold (not excessive)
* Candlesticks show consecutive bullish closes and break the previous high
* Price speed is strong (positive movement with momentum)
**■ Short Entry Conditions:**
* Current price is below the dynamic EMA (indicating downtrend)
* Price has pulled back up toward the EMA (a "sell the rally" setup)
* Pullback is within range (not too deep)
* Candlesticks show consecutive bearish closes and break the previous low
* Price speed is negative (downward momentum confirmed)
**■ Exit Conditions (TP/SL):**
* **Take-Profit (TP):** Fixed 1.5% target above/below entry price
* **Stop-Loss (SL):** Based on recent price volatility, calculated using ATR × 4
💰 **Risk Management Parameters**
* Symbol & Timeframe: BTCUSD on 1-hour chart (H1)
* Test Capital: \$3000 (simulated account)
* Commission: 0.02%
* Slippage: 2 ticks (minimal execution lag)
* Max risk per trade: 5% of account balance
* Backtest Period: Aug 30, 2023 – May 9, 2025
* Profit Factor (PF): 1.965 (Net profit ÷ Net loss, including spreads & fees)
⚙️ **Trading Parameters & Indicator Settings**
* Maximum EMA Length: 50
* Accelerator Multiplier: 3.0
* Pullback Threshold: 5.0%
* ATR Period: 14
* ATR Multiplier (SL distance): 4.0
* Fixed TP: 1.5%
* Short-term EMA: 21
* Long-term EMA: 50
* Long Speed Threshold: ≥ 1000.0 (ticks)
* Short Speed Threshold: ≤ -1000.0 (ticks)
⚠️Adjustments are based on BTCUSD.
⚠️Forex and other currency pairs require separate adjustments.
🔧 **Strategy Improvements & Uniqueness**
Unlike basic moving average crossovers or RSI triggers, this strategy emphasizes **"momentum-supported pullbacks"**.
By combining dynamic EMA, speed checks, and candlestick signals, it captures trades **as if surfing the wave of a trend.**
Its built-in filters help **avoid overextended pullbacks**, which often signal the trend is ending – making it more robust than traditional trend-following systems.
✅ **Summary**
The **EMA Pullback Speed Strategy** is easy to understand, rule-based, and highly reproducible – ideal for both beginners and intermediate traders.
Because it shows **clear visual entry/exit points** on the chart, it’s also a great tool for practicing discretionary trading decisions.
⚠️ Past performance is not a guarantee of future results.
Always respect your Stop-Loss levels and manage your position size according to your risk tolerance.

15-Min Opening Range Breakout STEP-BY-STEP RULES
1. Define the Opening Range (OR)
Mark the high and low of the first 15-minute candle of the session.
This creates your Opening Range.
Example: London session opens at 08:00 GMT. Use the 08:00–08:15 candle.
2. Set Entry Triggers
Buy Breakout: Place a Buy Stop order 1 pip above the Opening Range high.
Sell Breakout: Place a Sell Stop order 1 pip below the Opening Range low.
⚠️ Only one side should be triggered. Cancel the opposite order once one is active.
3. Set Stop Loss (SL)
For Buy trades:
SL = Opening Range Low - 2 pips
For Sell trades:
SL = Opening Range High + 2 pips
This ensures you give the price enough space, while keeping risk controlled.
4. Set Take Profit (TP)
Use either of these two approaches:
✅ Fixed Risk-Reward (Preferred)
Target 1: TP = 2R (i.e., 2 × SL distance)
Target 2 (optional): Leave runner for 3R or trail stop behind minor S/R
✅ Fixed Pip Target (alternative)
TP = +50 pips
SL = -20 pips
Matches your preferred risk model of 20 SL / 50 TP
5. Trade Management
If no breakout occurs within 1 hour, cancel the pending orders. No trade that day.
If trade triggers but fails to move, consider time-based exit after 2 hours.
Optional: Move SL to breakeven once price moves 1R in your favor.

LANZ Strategy 3.0🔷 LANZ Strategy 3.0 — Asian Range Fibonacci Strategy with Execution Window Logic
LANZ Strategy 3.0 is a rule-based trading system that utilizes the Asian session range to project Fibonacci levels and manage entries during a defined execution window. Designed for Forex and index traders, this strategy focuses on structured price behavior around key levels before the New York session.
🧠 Core Components:
Asian Session Range Mapping: Automatically detects the high, low, and midpoint during the Asian session.
Fibonacci Level Projection: Projects configurable Fibonacci retracement and extension levels based on the Asian range.
Execution Window Logic: Uses the 01:15 NY candle as a reference to validate potential reversals or continuation setups.
Conditional Entry System: Includes logic for limit order entries (buy or sell) at specific Fib levels, with reversal logic if price breaks structure before execution.
Risk Management: Entry orders are paired with dynamic SL and TP based on Fibonacci-based distances, maintaining a risk-reward ratio consistent with intraday strategies.
📊 Visual Features:
Asian session high/low/mid lines.
Fibonacci levels: Original (based on raw range) and Optimized (user-adjustable).
Session background coloring for Asia, Execution Window, and NY session.
Labels and lines for entry, SL, and TP targets.
Dynamic deletion of untriggered orders after execution window expires.
⚙️ How It Works:
The script calculates the Asian session range.
Projects Fibonacci levels from the range.
Waits for the 01:15 NY candle to close to validate a signal.
If valid, a limit entry order (BUY or SELL) is plotted at the selected level.
If price structure changes (e.g., breaks the high/low), reversal logic may activate.
If no trade is triggered, orders are cleared before the NY session.
🔔 Alerts:
Alerts trigger when a valid setup appears after 01:15 NY candle.
Optional alerts for order activation, SL/TP hit, or trade cancellation.
📝 Notes:
Intended for semi-automated or discretionary trading.
Best used on highly liquid markets like Forex majors or indices.
Script parameters include session times, Fib ratios, SL/TP settings, and reversal logic toggle.
Credits:
Developed by LANZ, this script merges traditional session-based analysis with Fibonacci tools and structured execution timing, offering a unique framework for morning volatility plays.
LANZ Strategy 4.0🔷 LANZ Strategy 4.0 — Trend Impulse Detection with Risk Management
LANZ Strategy 4.0 is a multi-indicator trend strategy designed for short to medium-term trading on any asset or timeframe. It combines Parabolic SAR, Supertrend, ADX, and time zone highlighting to detect and confirm trend impulses, while managing entries with dynamic Stop Loss (SL) and Take Profit (TP) levels.
🧠 Core Components:
Parabolic SAR: Identifies short-term trend reversals.
Supertrend: Highlights trend continuation zones.
ADX Filter: Ensures trend strength by filtering entries when ADX exceeds a defined threshold.
Impulse Detection Logic: Detects and confirms movement impulses with a counter, only generating trade signals on confirmed sequences.
Risk Management: Calculates dynamic SL/TP with a default risk-reward ratio of 1:2, minimum SL of 4 pts, and maximum of 12 pts.
📊 Visual Features:
Trend lines from Supertrend and SAR.
Colored background zones for different sessions (Asia, NY).
Labels and lines for entry, SL, and TP.
Movement number labels help visualize impulse progression.
Alerts when a new impulse is confirmed.
⚙️ How It Works:
The strategy waits for a confirmed impulse (i.e., change in SAR + Supertrend + ADX filter).
Once a valid impulse is confirmed:
A trade signal (BUY/SELL) is shown.
SL and TP levels are calculated and drawn.
The script monitors live price to determine if SL or TP is hit.
Impulse counter advances to label movement progression.
🔔 Alerts:
You will receive an alert each time a new valid impulse is confirmed, indicating a potential trading opportunity.
📝 Notes:
Script is intended for discretionary or assisted trading, not automated execution.
Works best during active sessions with visible trend direction.
You can adjust ATR period, multiplier, SL padding, and impulse thresholds.
Credits:
Developed by LANZ combines established technical indicators and original impulse-count logic.

Williams R Zone Scalper v1.0[BullByte]Originality & Usefulness
Unlike standard Williams R cross-over scripts, this strategy layers five dynamic filters—moving-average trend, Supertrend, Choppiness Index, Bollinger Band Width, and volume validation —and presents a real-time dashboard with equity, PnL, filter status, and key indicator values. No other public Pine script combines these elements with toggleable filters and a custom dashboard. In backtests (BTC/USD (Binance), 5 min, 24 Mar 2025 → 28 Apr 2025), adding these filters turned a –2.09 % standalone Williams R into a +5.05 % net winner while cutting maximum drawdown in half.
---
What This Script Does
- Monitors Williams R (length 14) for overbought/oversold reversals.
- Applies up to five dynamic filters to confirm trend strength and volatility direction:
- Moving average (SMA/EMA/WMA/HMA)
- Supertrend line
- Choppiness Index (CI)
- Bollinger Band Width (BBW)
- Volume vs. its 50-period MA
- Plots blue arrows for Long entries (R crosses above –80 + all filters green) and red arrows for Short entries (R crosses below –20 + all filters green).
- Optionally sets dynamic ATR-based stop-loss (1.5×ATR) and take-profit (2×ATR).
- Shows a dashboard box with current position, equity, PnL, filter status, and real-time Williams R / MA/volume values.
---
Backtest Summary (BTC/USD(Binance), 5 min, 24 Mar 2025 → 28 Apr 2025)
• Total P&L : +50.70 USD (+5.05 %)
• Max Drawdown : 31.93 USD (3.11 %)
• Total Trades : 198
• Win Rate : 55.05 % (109/89)
• Profit Factor : 1.288
• Commission : 0.01 % per trade
• Slippage : 0 ticks
Even in choppy March–April, this multi-filter approach nets +5 % with a robust risk profile, compared to –2.09 % and higher drawdown for Williams R alone.
---
Williams R Alone vs. Multi-Filter Version
• Total P&L :
– Williams R alone → –20.83 USD (–2.09 %)
– Multi-Filter → +50.70 USD (+5.05 %)
• Max Drawdown :
– Williams R alone → 62.13 USD (6.00 %)
– Multi-Filter → 31.93 USD (3.11 %)
• Total Trades : 543 vs. 198
• Win Rate : 60.22 % vs. 55.05 %
• Profit Factor : 0.943 vs. 1.288
---
Inputs & What They Control
- wrLen (14): Williams R look-back
- maType (EMA): Trend filter type (SMA, EMA, WMA, HMA)
- maLen (20): Moving-average period
- useChop (true): Toggle Choppiness Index filter
- ciLen (12): CI look-back length
- chopThr (38.2): CI threshold (below = trending)
- useVol (true): Toggle volume-above-average filter
- volMaLen (50): Volume MA period
- useBBW (false): Toggle Bollinger Band Width filter
- bbwMaLen (50): BBW MA period
- useST (false): Toggle Supertrend filter
- stAtrLen (10): Supertrend ATR length
- stFactor (3.0): Supertrend multiplier
- useSL (false): Toggle ATR-based SL/TP
- atrLen (14): ATR period for SL/TP
- slMult (1.5): SL = slMult × ATR
- tpMult (2.0): TP = tpMult × ATR
---
How to Read the Chart
- Blue arrow (Long): Williams R crosses above –80 + all enabled filters green
- Red arrow (Short) : Williams R crosses below –20 + all filters green
- Dashboard box:
- Top : position and equity
- Next : cumulative PnL in USD & %
- Middle : green/white dots for each filter (green=passing, white=disabled)
- Bottom : Williams R, MA, and volume current values
---
Usage Tips
- Add the script : Indicators → My Scripts → Williams R Zone Scalper v1.0 → Add to BTC/USD chart on 5 min.
- Defaults : Optimized for BTC/USD.
- Forex majors : Raise `chopThr` to ~42.
- Stocks/high-beta : Enable `useBBW`.
- Enable SL/TP : Toggle `useSL`; stop-loss = 1.5×ATR, take-profit = 2×ATR apply automatically.
---
Common Questions
- * Why not trade every Williams R reversal?*
Raw Williams R whipsaws in sideways markets. Choppiness and volume filters reduce false entries.
- *Can I use on 1 min or 15 min?*
Yes—adjust ATR length or thresholds accordingly. Defaults target 5 min scalping.
- *What if all filters are on?*
Fewer arrows, higher-quality signals. Expect ~10 % boost in average win size.
---
Disclaimer & License
Trading carries risk of loss. Use this script “as is” under the Mozilla Public License 2.0 (mozilla.org). Always backtest, paper-trade, and adjust risk settings to your own profile.
---
Credits & References
- Pine Script v6, using TradingView’s built-in `ta.supertrend()`.
- TradingView House Rules: www.tradingview.com
Goodluck!
BullByte

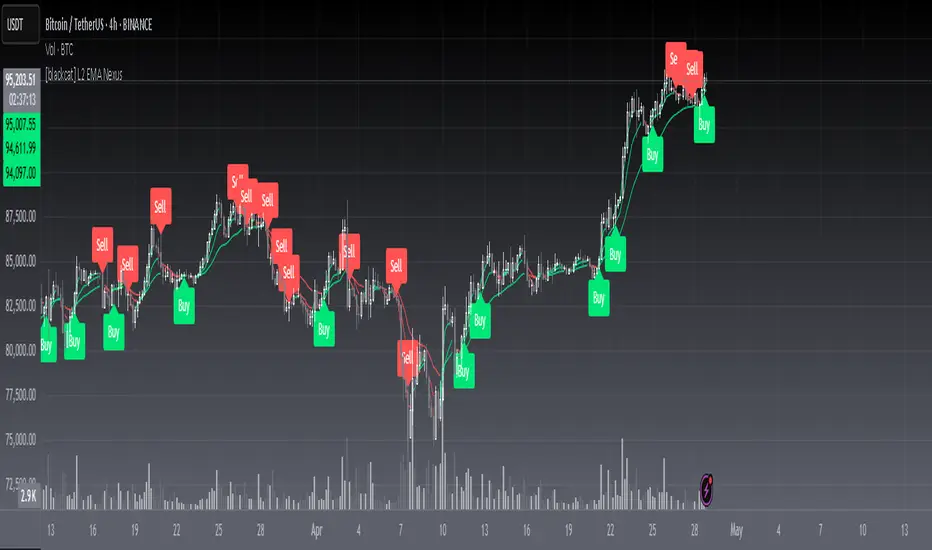
[blackcat] L2 EMA NexusOVERVIEW
The L2 EMA Nexus is a comprehensive trading indicator that utilizes a three-tiered Exponential Moving Average (EMA) system to identify potential trading opportunities. This script combines technical analysis with robust risk management features to help traders make informed decisions.
KEY FEATURES
• Triple EMA Analysis:
Customizable source inputs for each EMA
Adjustable length parameters (3, 8, 21 periods)
Dynamic color coding based on trend direction
Real-time price action monitoring
• Advanced Entry Signals:
High-low price action verification
EMA cross-overs and cross-unders
Multi-timeframe trend confirmation
Dynamic position sizing limits
• Risk Management:
Configurable Take Profit levels
Flexible Stop Loss settings
Optional TP/SL activation
Clear visual indicators for levels
HOW TO USE
Setup Initial Parameters:
Configure EMA lengths for your timeframe
Set Take Profit percentage (default 25%)
Define Stop Loss percentage (default 2.5%)
Adjust pyramiding limit as needed
Enable/Disable Features:
Toggle TP/SL settings based on strategy
Customize alert conditions
Modify visual labels for clarity
Monitor Trading Signals:
Watch for buy/sell labels
Track TP/SL levels
Monitor position status
TRADE MANAGEMENT
• Entry Conditions:
Long Entry: Higher high with rising EMA1 and stable EMA3
Short Entry: Lower low with falling EMA1 and stable EMA2
• Exit Conditions:
Take Profit: Price reaches defined percentage above/below entry
Stop Loss: Price reaches defined percentage below/above entry
• Position Control:
Limited to specified number of positions
Automatic position tracking
Clear visual indication of current trades
TECHNICAL DETAILS
• EMA Calculation:
Uses Exponential Moving Average for trend following
Color-coded based on 2-bar trend direction
Multiple timeframe compatibility
• Label System:
Clear buy/sell markers
Take Profit and Stop Loss indicators
Real-time position status updates
• Alert Configuration:
Customizable alert messages
Multiple alert conditions
Option to enable/disable specific alerts
LIMITATIONS
⚠️ Important Considerations:
Results may vary across different market conditions
Historical performance does not guarantee future results
Always backtest strategy before live trading
Consider complementing with additional analysis tools
BEST PRACTICES
• Recommended Timeframes:
Daily charts for long-term strategies
4-hour charts for swing trading
1-hour charts for short-term trading
• Risk Management Tips:
Start with small position sizes
Always use TP/SL in live trading
Monitor market volatility before entering trades
TROUBLESHOOTING
• Common Issues:
Ensure proper chart resolution
Verify alert conditions are enabled
Check for conflicting indicators
• Performance Optimization:
Use appropriate timeframe for your strategy
Adjust indicator parameters based on market conditions
Monitor for potential overfitting
BTC Trading RobotOverview
This Pine Script strategy is designed for trading Bitcoin (BTC) by placing pending orders (BuyStop and SellStop) based on local price extremes. The script also implements a trailing stop mechanism to protect profits once a position becomes sufficiently profitable.
________________________________________
Inputs and Parameter Setup
1. Trading Profile:
o The strategy is set up specifically for BTC trading.
o The systemType input is set to 1, which means the strategy will calculate trade parameters using the BTC-specific inputs.
2. Common Trading Inputs:
o Risk Parameters: Although RiskPercent is defined, its actual use (e.g., for position sizing) isn’t implemented in this version.
o Trading Hours Filter:
SHInput and EHInput let you restrict trading to a specific hour range. If these are set (non-zero), orders will only be placed during the allowed hours.
3. BTC-Specific Inputs:
o Take Profit (TP) and Stop Loss (SL) Percentages:
TPasPctBTC and SLasPctBTC are used to determine the TP and SL levels as a percentage of the current price.
o Trailing Stop Parameters:
TSLasPctofTPBTC and TSLTgrasPctofTPBTC determine when and by how much a trailing stop is applied, again as percentages of the TP.
4. Other Parameters:
o BarsN is used to define the window (number of bars) over which the local high and low are calculated.
o OrderDistPoints acts as a buffer to prevent the entry orders from being triggered too early.
________________________________________
Trade Parameter Calculation
• Price Reference:
o The strategy uses the current closing price as the reference for calculations.
• Calculation of TP and SL Levels:
o If the systemType is set to BTC (value 1), then:
Take Profit Points (Tppoints) are calculated by multiplying the current price by TPasPctBTC.
Stop Loss Points (Slpoints) are calculated similarly using SLasPctBTC.
A buffer (OrderDistPoints) is set to half of the take profit points.
Trailing Stop Levels:
TslPoints is calculated as a fraction of the TP (using TSLTgrasPctofTPBTC).
TslTriggerPoints is similarly determined, which sets the profit level at which the trailing stop will start to activate.
________________________________________
Time Filtering
• Session Control:
o The current hour is compared against SHInput (start hour) and EHInput (end hour).
o If the current time falls outside the allowed window, the script will not place any new orders.
________________________________________
Entry Orders
• Local Price Extremes:
o The strategy calculates a local high and local low using a window of BarsN * 2 + 1 bars.
• Placing Stop Orders:
o BuyStop Order:
A long entry is triggered if the current price is less than the local high minus the order distance buffer.
The BuyStop order is set to trigger at the level of the local high.
o SellStop Order:
A short entry is triggered if the current price is greater than the local low plus the order distance buffer.
The SellStop order is set to trigger at the level of the local low.
Note: Orders are only placed if there is no current open position and if the session conditions are met.
________________________________________
Trailing Stop Logic
Once a position is open, the strategy monitors profit levels to protect gains:
• For Long Positions:
o The script calculates the profit as the difference between the current price and the average entry price.
o If this profit exceeds the TslTriggerPoints threshold, a trailing stop is applied by placing an exit order.
o The stop price is set at a distance below the current price, while a limit (profit target) is also defined.
• For Short Positions:
o The profit is calculated as the difference between the average entry price and the current price.
o A similar trailing stop exit is applied if the profit exceeds the trigger threshold.
________________________________________
Summary
In essence, this strategy works by:
• Defining entry levels based on recent local highs and lows.
• Placing pending stop orders to enter the market when those levels are breached.
• Filtering orders by time, ensuring trades are only taken during specified hours.
• Implementing a trailing stop mechanism to secure profits once the trade moves favorably.
This approach is designed to automate BTC trading based on price action and dynamic risk management, although further enhancements (like dynamic position sizing based on RiskPercent) could be added for a more complete risk management system.

AsianRange&Midnight 2.2### Midnight Setup: Trading Strategy
#### **Bias Definition (Trend Identification)**
- The Daily (D) bias is defined the previous day and validated on the line chart.
- On the Daily chart, identify the nearest V-shaped formation that has broken close to the current price. This formation determines the Daily bias direction.
#### **H4 Bias Analysis (Trend Confirmation)**
- Switch to an H4 chart to refine the analysis.
- Identify a similar V-shaped formation that has broken in the H4 timeframe.
- If the Daily and H4 biases are aligned, the setup is valid.
#### **Entry Strategy (Position Entries)**
- **Bearish Bias (D and H4 identical):**
- Short entry at the high level of the Midnight range.
- **Bullish Bias (D and H4 identical):**
- Long entry at the low level of the Midnight range.
#### **Bias Divergence (Context Adaptation)**
- If the H4 bias is opposite to the Daily bias, this indicates an H4 retracement of the Daily bias.
- Enter a counter-trend trade with reduced risk.
- No TP target beyond 50% of the extension validating the Daily break. It is also not recommended to enter against this divergence beyond 50%.
#### **Divergence Scenarios (Reactions to Divergences)**
- **Daily Bearish Bias, H4 Bullish Bias:**
- Long entry at the Midnight Low.
- **Daily Bullish Bias, H4 Bearish Bias:**
- Short entry at the Midnight High.
#### **Daily Bias Resumption (Trend Alignment)**
- As soon as the H4 bias resumes the Daily bias direction, follow this trend and adjust the position accordingly.
#### **Instructions for Divergent Bias (Managing Divergence)**
- When holding a position with a divergent bias, it is crucial to manage it carefully.
- Exit counter-trend trades as soon as the H4 bias realigns with the Daily bias.
- Limit the duration of counter-trend trades per session and adjust the H4 bias for the next session if needed.
#### **SL/TP Management (Profit Taking and Protection Optimization)**
- **Take Profit (TP):**
- Entry in M15 with a minimum RR of 3.
- TP at 5H NYE, or RR 5, or 15H NYE.
- **Stop Loss (SL):**
- Minimum 15 pips, placed just above the nearest swing to the entry point to protect capital.
- **Red Announcement Days:**
- Either abstain from trading or set a 40-pip SL to limit volatility impact.
- **At 6H/7H NYE:**
- Manage the trade based on its progress: exit, set to BE (Break Even), or keep the SL in place.
- Any SL adjustment outside these rules can only be made if supported by data or backtests.
#### **Risk Management (Capital Protection)**
- Maximum risk of **1% of capital per trade** (allowing for **10 consecutive losses** without significantly affecting capital).
- In case of a loss, **reduce risk by 50% on the next trade** until the loss is recovered.
#### **Efficiency Conditions (When This Setup Works Best)**
- This setup is particularly effective in **strong trends**, where the market has a clear direction.
- It is **less effective in ranging markets**, where prices move within a narrow range without a clear trend.
Setup Midnight : Stratégie de Trading

Crypto Strategy SUSDT 10 minThis strategy is designed to trade the **SUSDT** pair on a **10-minute time frame**, using a combination of an Exponential Moving Average (EMA) and percentage-based Stop Loss (SL) and Take Profit (TP) levels.
### How the strategy works:
1. **EMA Calculation**:
- The strategy calculates a 24-period Exponential Moving Average (EMA) based on the closing price.
- This EMA serves as the primary trend indicator.
2. **Entry Conditions**:
- **Long Position**: A long position is entered when the closing price is above the EMA and the opening price is below the EMA. This indicates a potential upward trend.
- **Short Position**: A short position is entered when the closing price is below the EMA and the opening price is above the EMA. This indicates a potential downward trend.
3. **Stop Loss and Take Profit**:
- Both Stop Loss (SL) and Take Profit (TP) are calculated based on the entry price of the position.
- **For Long Positions**:
- Stop Loss is set as a percentage below the entry price.
- Take Profit is set as a percentage above the entry price.
- **For Short Positions**:
- Stop Loss is set as a percentage above the entry price.
- Take Profit is set as a percentage below the entry price.
- The percentage values for SL and TP can be adjusted in the strategy's settings (default: SL = 2%, TP = 4%).
4. **Exit Conditions**:
- The position is closed automatically when either the Stop Loss or Take Profit level is reached.
5. **Visualization**:
- The 24-period EMA is plotted on the chart as a blue line, helping visualize the trend direction.
### Key Features:
- **Pair and Time Frame**: The strategy is optimized for the SUSDT pair on a 10-minute time frame.
- **Customizable Parameters**: Users can adjust the Stop Loss and Take Profit percentages to suit their risk tolerance and trading style.
- **Trend-Following Approach**: The strategy uses the EMA to identify and follow the current market trend.
This strategy is simple yet effective for capturing trends while managing risk through predefined Stop Loss and Take Profit levels.

[3Commas] HA & MAHA & MA
🔷What it does: This tool is designed to test a trend-following strategy using Heikin Ashi candles and moving averages. It enters trades after pullbacks, aiming to let profits run once the risk-to-reward ratio reaches 1:1 while securing the position.
🔷Who is it for: It is ideal for traders looking to compare final results using fixed versus dynamic take profits by adjusting parameters and trade direction—a concept applicable to most trading strategies.
🔷How does it work: We use moving averages to define the market trend, then wait for opposite Heikin Ashi candles to form against it. Once these candles reverse in favor of the trend, we enter the trade, using the last swing created by the pullback as the stop loss. By applying the breakeven ratio, we protect the trade and let it run, using the slower moving average as a trailing stop.
A buy signal is generated when:
The previous candle is bearish (ha_bear ), indicating a pullback.
The fast moving average (ma1) is above the slow moving average (ma2), confirming an uptrend.
The current candle is bullish (ha_bull), showing trend continuation.
The Heikin Ashi close is above the fast moving average (ma1), reinforcing the bullish bias.
The real price close is above the open (close > open), ensuring bullish momentum in actual price data.
The signal is confirmed on the closed candle (barstate.isconfirmed) to avoid premature signals.
dir is undefined (na(dir)), preventing repeated signals in the same direction.
A sell signal is generated when:
The previous candle is bullish (ha_bull ), indicating a temporary upward move before a potential reversal.
The fast moving average (ma1) is below the slow moving average (ma2), confirming a downtrend.
The current candle is bearish (ha_bear), showing trend continuation to the downside.
The Heikin Ashi close is below the fast moving average (ma1), reinforcing bearish pressure.
The real price close is below the open (close < open), confirming bearish momentum in actual price data.
The signal is confirmed after the candle closes (barstate.isconfirmed), avoiding premature entries.
dir is undefined (na(dir)), preventing consecutive signals in the same direction.
In simple terms, this setup looks for trend continuation after a pullback, confirming entries with both Heikin Ashi and real price action, supported by moving average alignment to avoid false signals.
If the price reaches a 1:1 risk-to-reward ratio, the stop will be moved to the entry point. However, if the slow moving average surpasses this level, it will become the new exit point, acting as a trailing stop
🔷Why It’s Unique
Easily visualizes the benefits of using risk-to-reward ratios when trading instead of fixed percentages.
Provides a simple and straightforward approach to trading, embracing the "keep it simple" concept.
Offers clear visualization of DCA Bot entry and exit points based on user preferences.
Includes an option to review the message format before sending signals to bots, with compatibility for multi-pair and futures contract pairs.
🔷 Considerations Before Using the Indicator
⚠️Very important: The indicator must be used on charts with real price data, such as Japanese candlesticks, line charts, etc. Do not use it on Heikin Ashi charts, as this may lead to unrealistic results.
🔸Since this is a trend-following strategy, use it on timeframes above 4 hours, where market noise is reduced and trends are clearer. Also, carefully review the statistics before using it, focusing on pairs that tend to have long periods of well-defined trends.
🔸Disadvantages:
False Signals in Ranges: Consolidating markets can generate unreliable signals.
Lagging Indicator: Being based on moving averages, it may react late to sudden price movements.
🔸Advantages:
Trend Focused: Simplifies the identification of trending markets.
Noise Reduction: Uses Heikin Ashi candles to identify trend continuation after pullbacks.
Broad Applicability: Suitable for forex, crypto, stocks, and commodities.
🔸The strategy provides a systematic way to analyze markets but does not guarantee successful outcomes. Use it as an additional tool rather than relying solely on an automated system.
Trading results depend on various factors, including market conditions, trader discipline, and risk management. Past performance does not ensure future success, so always approach the market cautiously.
🔸Risk Management: Define stop-loss levels, position sizes, and profit targets before entering any trade. Be prepared for potential losses and ensure your approach aligns with your overall trading plan.
🔷 STRATEGY PROPERTIES
Symbol: BINANCE:BTCUSDT (Spot).
Timeframe: 4h.
Test Period: All historical data available.
Initial Capital: 10000 USDT.
Order Size per Trade: 1% of Capital, you can use a higher value e.g. 5%, be cautious that the Max Drawdown does not exceed 10%, as it would indicate a very risky trading approach.
Commission: Binance commission 0.1%, adjust according to the exchange being used, lower numbers will generate unrealistic results. By using low values e.g. 5%, it allows us to adapt over time and check the functioning of the strategy.
Slippage: 5 ticks, for pairs with low liquidity or very large orders, this number should be increased as the order may not be filled at the desired level.
Margin for Long and Short Positions: 100%.
Indicator Settings: Default Configuration.
MA1 Length: 9.
MA2 Length: 18.
MA Calculations: EMA.
Take Profit Ratio: Disable. Ratio 1:4.
Breakeven Ratio: Enable, Ratio 1:1.
Strategy: Long & Short.
🔷 STRATEGY RESULTS
⚠️Remember, past results do not guarantee future performance.
Net Profit: +324.88 USDT (+3.25%).
Max Drawdown: -81.18 USDT (-0.78%).
Total Closed Trades: 672.
Percent Profitable: 35.57%.
Profit Factor: 1.347.
Average Trade: +0.48 USDT (+0.48%).
Average # Bars in Trades: 13.
🔷 HOW TO USE
🔸 Adjust Settings:
The default values—MA1 (9) and MA2 (18) with EMA calculation—generally work well. However, you can increase these values, such as 20 and 40, to better identify stronger trends.
🔸 Choose a Symbol that Typically Trends:
Select an asset that tends to form clear trends. Keep in mind that the Strategy Tester results may show poor performance for certain assets, making them less suitable for sending signals to bots.
🔸 Experiment with Ratios:
Test different take profit and breakeven ratios to compare various scenarios—especially to observe how the strategy performs when only the trade is protected.
🔸This is an example of how protecting the trade works: once the price moves in favor of the position with a 1:1 risk-to-reward ratio, the stop loss is moved to the entry price. If the Slow MA surpasses this level, it will act as a trailing stop, aiming to follow the trend and maximize potential gains.
🔸In contrast, in this example, for the same trade, if we set a take profit at a 1:3 risk-to-reward ratio—which is generally considered a good risk-reward relationship—we can see how a significant portion of the upward move is left on the table.
🔸Results Review:
It is important to check the Max Drawdown. This value should ideally not exceed 10% of your capital. Consider adjusting the trade size to ensure this threshold is not surpassed.
Remember to include the correct values for commission and slippage according to the symbol and exchange where you are conducting the tests. Otherwise, the results will not be realistic.
If you are satisfied with the results, you may consider automating your trades. However, it is strongly recommended to use a small amount of capital or a demo account to test proper execution before committing real funds.
🔸Create alerts to trigger the DCA Bot:
Verify Messages: Ensure the message matches the one specified by the DCA Bot.
Multi-Pair Configuration: For multi-pair setups, enable the option to add the symbol in the correct format.
Signal Settings: Enable whether you want to receive long or short signals (Entry | TP | SL), copy and paste the the messages for the DCA Bots configured.
Alert Setup:
When creating an alert, set the condition to the indicator and choose "alert() function call only.
Enter any desired Alert Name.
Open the Notifications tab, enable Webhook URL, and paste the Webhook URL.
For more details, refer to the section: "How to use TradingView Custom Signals".
Finalize Alerts: Click Create, you're done! Alerts will now be sent automatically in the correct format.
🔷 INDICATOR SETTINGS
MA 1: Fast MA Length
MA 2: Slow MA Length
MA Calc: MA's Calculations (SMA,EMA, RMA,WMA)
TP Ratio: This is the take profit ratio relative to the stop loss, where the trade will be closed in profit.
BE Ratio: This is the breakeven ratio relative to the stop loss, where the stop loss will be updated to breakeven or if the MA2 is greater than this level.
Strategy: Order Type direction in which trades are executed.
Use Custom Test Period: When enabled signals only works in the selected time window. If disabled it will use all historical data available on the chart.
Test Start and End: Once the Custom Test Period is enabled, here you select the start and end date that you want to analyze.
Check Messages: Enable the table to review the messages to be sent to the bot.
Entry | TP | SL: Enable this options to send Buy Entry, Take Profit (TP), and Stop Loss (SL) signals.
Deal Entry and Deal Exit : Copy and paste the message for the deal start signal and close order at Market Price of the DCA Bot. This is the message that will be sent with the alert to the Bot, you must verify that it is the same as the bot so that it can process properly so that it executes and starts the trade.
DCA Bot Multi-Pair: You must activate it if you want to use the signals in a DCA Bot Multi-pair in the text box you must enter (using the correct format) the symbol in which you are creating the alert, you can check the format of each symbol when you create the bot.
👨🏻💻💭 We hope this tool helps enhance your trading. Your feedback is invaluable, so feel free to share any suggestions for improvements or new features you'd like to see implemented.
__
The information and publications within the 3Commas TradingView account are not meant to be and do not constitute financial, investment, trading, or other types of advice or recommendations supplied or endorsed by 3Commas and any of the parties acting on behalf of 3Commas, including its employees, contractors, ambassadors, etc.

Sunil BB Blast Heikin Ashi StrategySunil BB Blast Heikin Ashi Strategy
The Sunil BB Blast Heikin Ashi Strategy is a trend-following trading strategy that combines Bollinger Bands with Heikin-Ashi candles for precise market entries and exits. It aims to capitalize on price volatility while ensuring controlled risk through dynamic stop-loss and take-profit levels based on a user-defined Risk-to-Reward Ratio (RRR).
Key Features:
Trading Window:
The strategy operates within a user-defined time window (e.g., from 09:20 to 15:00) to align with market hours or other preferred trading sessions.
Trade Direction:
Users can select between Long Only, Short Only, or Long/Short trade directions, allowing flexibility depending on market conditions.
Bollinger Bands:
Bollinger Bands are used to identify potential breakout or breakdown zones. The strategy enters trades when price breaks through the upper or lower Bollinger Band, indicating a possible trend continuation.
Heikin-Ashi Candles:
Heikin-Ashi candles help smooth price action and filter out market noise. The strategy uses these candles to confirm trend direction and improve entry accuracy.
Risk Management (Risk-to-Reward Ratio):
The strategy automatically adjusts the take-profit (TP) level and stop-loss (SL) based on the selected Risk-to-Reward Ratio (RRR). This ensures that trades are risk-managed effectively.
Automated Alerts and Webhooks:
The strategy includes automated alerts for trade entries and exits. Users can set up JSON webhooks for external execution or trading automation.
Active Position Tracking:
The strategy tracks whether there is an active position (long or short) and only exits when price hits the pre-defined SL or TP levels.
Exit Conditions:
The strategy exits positions when either the take-profit (TP) or stop-loss (SL) levels are hit, ensuring risk management is adhered to.
Default Settings:
Trading Window:
09:20-15:00
This setting confines the strategy to the specified hours, ensuring trading only occurs during active market hours.
Strategy Direction:
Default: Long/Short
This allows for both long and short trades depending on market conditions. You can select "Long Only" or "Short Only" if you prefer to trade in one direction.
Bollinger Band Length (bbLength):
Default: 19
Length of the moving average used to calculate the Bollinger Bands.
Bollinger Band Multiplier (bbMultiplier):
Default: 2.0
Multiplier used to calculate the upper and lower bands. A higher multiplier increases the width of the bands, leading to fewer but more significant trades.
Take Profit Multiplier (tpMultiplier):
Default: 2.0
Multiplier used to determine the take-profit level based on the calculated stop-loss. This ensures that the profit target aligns with the selected Risk-to-Reward Ratio.
Risk-to-Reward Ratio (RRR):
Default: 1.0
The ratio used to calculate the take-profit relative to the stop-loss. A higher RRR means larger profit targets.
Trade Automation (JSON Webhooks):
Allows for integration with external systems for automated execution:
Long Entry JSON: Customizable entry condition for long positions.
Long Exit JSON: Customizable exit condition for long positions.
Short Entry JSON: Customizable entry condition for short positions.
Short Exit JSON: Customizable exit condition for short positions.
Entry Logic:
Long Entry:
The strategy enters a long position when:
The Heikin-Ashi candle shows a bullish trend (green close > open).
The price is above the upper Bollinger Band, signaling a breakout.
The previous candle also closed higher than it opened.
Short Entry:
The strategy enters a short position when:
The Heikin-Ashi candle shows a bearish trend (red close < open).
The price is below the lower Bollinger Band, signaling a breakdown.
The previous candle also closed lower than it opened.
Exit Logic:
Take-Profit (TP):
The take-profit level is calculated as a multiple of the distance between the entry price and the stop-loss level, determined by the selected Risk-to-Reward Ratio (RRR).
Stop-Loss (SL):
The stop-loss is placed at the opposite Bollinger Band level (lower for long positions, upper for short positions).
Exit Trigger:
The strategy exits a trade when either the take-profit or stop-loss level is hit.
Plotting and Visuals:
The Heikin-Ashi candles are displayed on the chart, with green candles for uptrends and red candles for downtrends.
Bollinger Bands (upper, lower, and basis) are plotted for visual reference.
Entry points for long and short trades are marked with green and red labels below and above bars, respectively.
Strategy Alerts:
Alerts are triggered when:
A long entry condition is met.
A short entry condition is met.
A trade exits (either via take-profit or stop-loss).
These alerts can be used to trigger notifications or webhook events for automated trading systems.
Notes:
The strategy is designed for use on intraday charts but can be applied to any timeframe.
It is highly customizable, allowing for tailored risk management and trading windows.
The Sunil BB Blast Heikin Ashi Strategy combines two powerful technical analysis tools (Bollinger Bands and Heikin-Ashi candles) with strong risk management, making it suitable for both beginners and experienced traders.
Feebacks are welcome from the users.
