Multi-Factor Reversal AnalyzerMulti-Factor Reversal Analyzer – Quantitative Reversal Signal System
OVERVIEW
Multi-Factor Reversal Analyzer is a comprehensive technical analysis toolkit designed to detect market tops and bottoms with high precision. It combines trend momentum analysis, price action behavior, wave oscillation structure, and volatility breakout potential into one unified indicator.
This indicator is not a random mix of tools — each module is carefully selected for a specific purpose. When combined, they form a multi-dimensional view of the market, merging trend analysis, momentum divergence, and volatility compression to produce high-confidence signals.
Why Combine These Modules?
Module Combination Ideas & How to Use Them
Factor A: Trend Detector + Gold Zone
Concept:
• The Trend Detector (light yellow histogram) evaluates market strength:
• Histogram trending downward or staying below 50 → bearish conditions;
• Trending upward or staying above 50 → bullish conditions.
• The Gold Zone identifies areas of volatility compression — typically a prelude to explosive market moves.
Practical Application:
• When the Gold Zone appears and the Trend Detector is bearish → likely downside move;
• When the Gold Zone appears and the Trend Detector is bullish → likely upside breakout.
• Note: The Gold Zone does not mean the bottom is in. It is not a buy signal on its own — always combine it with other modules for directional bias.
Factor B: PAI + Wave Trend
Concept:
• PAI (Price Action Index) is a custom oscillator that combines price momentum with volatility dispersion, displaying strength zones:
• Green area → bullish dominance;
• Red area → bearish pressure.
• Wave Trend offers smoothed crossover signals via the main and signal lines.
Practical Application:
• When PAI is in the green zone and Wave Trend makes a bullish crossover → potential reversal to the upside;
• When PAI is in the red zone and Wave Trend shows a bearish crossover → potential start of a downtrend.
Factor C: Trend Detector + PAI
Concept:
• Combines directional trend strength with price action strength to confirm setups via confluence.
Practical Application:
• Trend Detector histogram bottoms out + PAI enters the green zone → high chance of upward reversal;
• Histogram tops out + PAI in the red zone → increased likelihood of downside continuation.
Multi-Factor Confluence (Advanced Use)
• When Trend Detector, PAI, and Wave Trend all align in the same direction (bullish or bearish), the directional signal becomes significantly more reliable.
• This setup is especially useful for trend-following or swing trade entries.
KEY FEATURES
1. Multi-Layer Reversal Logic
• Combines trend scoring, oscillator divergence, and volatility squeezes for triangulated reversal detection.
• Helps traders distinguish between trend pullbacks and true reversals.
2. Advanced Divergence Detection
• Detects both regular and hidden divergences using pivot-based confirmation logic.
• Customizable lookback ranges and pivot sensitivity provide flexible tuning for different market styles.
3. Gold Zone Volatility Compression
• Highlights pre-breakout zones using custom oscillation models (RSI, harmonic, Karobein, etc.).
• Improves anticipation of breakout opportunities following low-volatility compressions.
4. Trend Direction Context
• PAI and Trend Score components provide top-down insight into prevailing bias.
• Built-in “Straddle Area” highlights consolidation zones; breakouts from this area often signal new trend phases.
5. Flexible Visualization
• Color-coded trend bars, reversal markers, normalized oscillator plots, and trend strength labels.
• Designed for both visual discretionary traders and data-driven system developers.
USAGE GUIDELINES
1. Applicable Markets
• Suitable for stocks, crypto, futures, and forex
• Supports reversal, mean-reversion, and breakout trading styles
2. Recommended Timeframes
• Short-term traders: 5m / 15m / 1H — use Wave Trend divergence + Gold Zone
• Swing traders: 4H / Daily — rely on Price Action Index and Trend Detector
• Macro trend context: use PAI HTF mode for higher timeframe overlays
3. Reversal Strategy Flow
• Watch for divergence (WT/PAI) + Gold Zone compression
• Confirm with Trend Score weakening or flipping
• Use Straddle Area breakout for final trigger
• Optional: enable bar coloring or labels for visual reinforcement
• The indicator performs optimally when used in conjunction with a harmonic pattern recognition tool
4. Additional Note on the Gold Zone
The “Gold Zone” does not directly indicate a market bottom. Since it is displayed at the bottom of the chart, it may be misunderstood as a bullish signal. In reality, the Gold Zone represents a compression of price momentum and volatility, suggesting that a significant directional move is about to occur. The direction of that move—upward or downward—should be determined by analyzing the histogram:
• If histogram momentum is weakening, the Gold Zone may precede a downward move.
• If histogram momentum is strengthening, it may signal an upcoming rebound or rally.
Treat the Gold Zone as a warning of impending volatility, and always combine it with trend indicators for accurate directional judgment.
RISK DISCLAIMER
• This indicator calculates trend direction based on historical data and cannot guarantee future market performance. When using this indicator for trading, always combine it with other technical analysis tools, fundamental analysis, and personal trading experience for comprehensive decision-making.
• Market conditions are uncertain, and trend signals may result in false positives or lag. Traders should avoid over-reliance on indicator signals and implement stop-loss strategies and risk management techniques to reduce potential losses.
• Leverage trading carries high risks and may result in rapid capital loss. If using this indicator in leveraged markets (such as futures, forex, or cryptocurrency derivatives), exercise caution, manage risks properly, and set reasonable stop-loss/take-profit levels to protect funds.
• All trading decisions are the sole responsibility of the trader. The developer is not liable for any trading losses. This indicator is for technical analysis reference only and does not constitute investment advice.
• Before live trading, it is recommended to use a demo account for testing to fully understand how to use the indicator and apply proper risk management strategies.
CHANGELOG
v1.0: Initial release featuring integrated Price Action Index, Trend Strength Scoring, Wave Trend Oscillator, Gold Zone Compression Detection, and dual-type divergence recognition. Supports higher timeframe (HTF) synchronization, visual signal markers, and diversified parameter configurations.
ค้นหาในสคริปต์สำหรับ "top"

Nifty Advance/Decline Ratio - First 20 StocksNifty 20 Advance/Decline Ratio Indicator
This Pine Script tracks the Advance/Decline Ratio of the top 20 Nifty stocks (by weightage as of March 31, 2025). It helps gauge the market's strength by comparing the number of advancing vs. declining stocks among major Nifty heavyweights. The script calculates and plots the ratio, with a reference line at 1 (neutral point). This indicator resets daily and provides insights into overall market trends based on the performance of the top Nifty stocks.
Key Features:
Tracks advance/decline movements of top 20 Nifty stocks.
Plots the Advance/Decline Ratio on the chart.
Resets daily for fresh analysis.

RSI3M3+ v.1.8RSI3M3+ v.1.8 Indicator
This script is an advanced trading indicator based on Walter J. Bressert's cycle analysis methodology, combined with an RSI (Relative Strength Index) variation. Let me break it down and explain how it works.
Core Concepts
The RSI3M3+ indicator combines:
A short-term RSI (3-period)
A 3-period moving average to smooth the RSI
Bressert's cycle analysis principles to identify optimal trading points
RSI3M3+ Indicator VisualizationImage Walter J. Bressert's Cycle Analysis Concepts
Walter Bressert was a pioneer in cycle analysis trading who believed markets move in cyclical patterns that can be measured and predicted. His key principles integrated into this indicator include:
Trading Cycles: Markets move in cycles with measurable time spans from low to low
Timing Bands: Projected periods when the next cyclical low or high is anticipated
Oscillator Use: Using oscillators like RSI to confirm cycle position
Entry/Exit Rules: Specific rules for trade entry and exit based on cycle position
Key Parameters in the Script
Basic RSI Parameters
Required bars: Minimum number of bars needed (default: 20)
Overbought region: RSI level considered overbought (default: 70)
Oversold region: RSI level considered oversold (default: 30)
Bressert-Specific Parameters
Cycle Detection Length: Lookback period for cycle identification (default: 30)
Minimum/Maximum Cycle Length: Expected cycle duration in days (default: 15-30)
Buy Line: Lower threshold for buy signals (default: 40)
Sell Line: Upper threshold for sell signals (default: 60)
How the Indicator Works
RSI3M3 Calculation:
Calculates a 3-period RSI (sRSI)
Smooths it with a 3-period moving average (sMA)
Cycle Detection:
Identifies bottoms: When the RSI is below the buy line (40) and starting to turn up
Identifies tops: When the RSI is above the sell line (60) and starting to turn down
Records these points to calculate cycle lengths
Timing Bands:
Projects when the next cycle bottom or top should occur
Creates visual bands on the chart showing these expected time windows
Signal Generation:
Buy signals occur when the RSI turns up from below the oversold level (30)
Sell signals occur when the RSI turns down from above the overbought level (70)
Enhanced by Bressert's specific timing rules
Bressert's Five Trading Rules (Implemented in the Script)
Cycle Timing: The low must be 15-30 market days from the previous Trading Cycle bottom
Prior Top Validation: A Trading Cycle high must have occurred with the oscillator above 60
Oscillator Behavior: The oscillator must drop below 40 and turn up
Entry Trigger: Entry is triggered by a rise above the price high of the upturn day
Protective Stop: Place stop slightly below the Trading Cycle low (implemented as 99% of bottom price)
How to Use the Indicator
Reading the Chart
Main Plot Area:
Green line: 3-period RSI
Red line: 3-period moving average of the RSI
Horizontal bands: Oversold (30) and Overbought (70) regions
Dotted lines: Buy line (40) and Sell line (60)
Yellow vertical bands: Projected timing windows for next cycle bottom
Signals:
Green up arrows: Buy signals
Red down arrows: Sell signals
Trading Strategy
For Buy Signals:
Wait for the RSI to drop below the buy line (40)
Look for an upturn in the RSI from below this level
Enter the trade when price rises above the high of the upturn day
Place a protective stop at 99% of the Trading Cycle low
For Sell Signals:
Wait for the RSI to rise above the sell line (60)
Look for a downturn in the RSI from above this level
Consider exiting or taking profits when a sell signal appears
Alternative exit: When price moves below the low of the downturn day
Cycle Timing Enhancement:
Pay attention to the yellow timing bands
Signals occurring within these bands have higher probability of success
Signals outside these bands may be less reliable
Practical Tips for Using RSI3M3+
Timeframe Selection:
The indicator works best on daily charts for intermediate-term trading
Can be used on weekly charts for longer-term position trading
On intraday charts, adjust cycle lengths accordingly
Market Applicability:
Works well in trending markets with clear cyclical behavior
Less effective in choppy, non-trending markets
Consider additional indicators for trend confirmation
Parameter Adjustment:
Different markets may have different natural cycle lengths
You may need to adjust the min/max cycle length parameters
Higher volatility markets may need wider overbought/oversold levels
Trade Management:
Enter trades when all Bressert's conditions are met
Use the protective stop as defined (99% of cycle low)
Consider taking partial profits at the projected cycle high timing
Advanced Techniques
Multiple Timeframe Analysis:
Confirm signals with the same indicator on higher timeframes
Enter in the direction of the larger cycle when smaller and larger cycles align
Divergence Detection:
Look for price making new lows while RSI makes higher lows (bullish)
Look for price making new highs while RSI makes lower highs (bearish)
Confluence with Price Action:
Combine with support/resistance levels
Use with candlestick patterns for confirmation
Consider volume confirmation of cycle turns
This RSI3M3+ indicator combines the responsiveness of a short-term RSI with the predictive power of Bressert's cycle analysis, offering traders a sophisticated tool for identifying high-probability trading opportunities based on market cycles and momentum shifts.
THANK YOU FOR PREVIOUS CODER THAT EFFORT TO CREATE THE EARLIER VERSION THAT MAKE WALTER J BRESSERT CONCEPT IN TRADINGVIEW @ADutchTourist

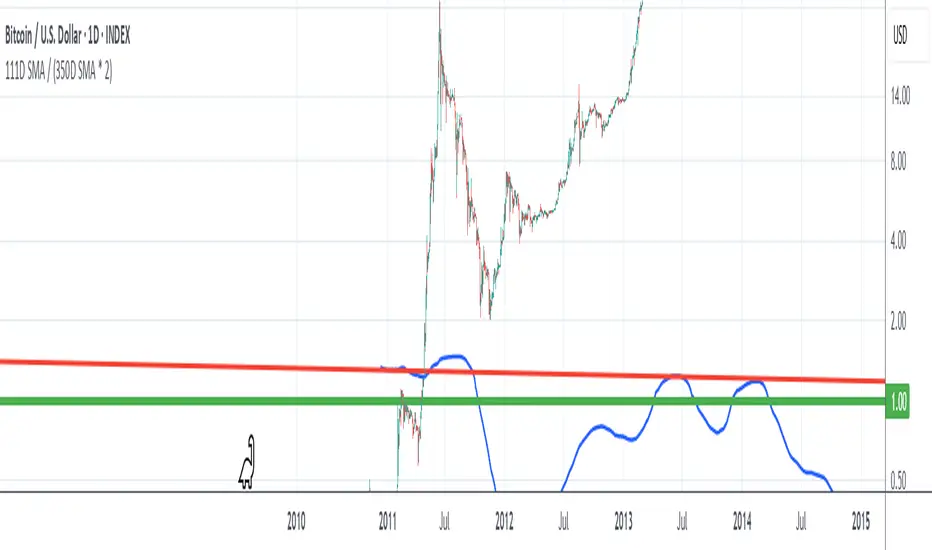
111D SMA / (350D SMA * 2)Indicator: Pi Cycle Ratio
This custom technical indicator calculates a ratio between two moving averages that are used for the PI Cycle Top indicator. The PI Cycle Top indicator triggers when the 111-day simple moving average (111D SMA) crosses up with the 350-day simple moving average (350D SMA *2).
The line value is ratio is calculated as:
Line Value = 111DSMA / (350D SMA × 2)
When the 111D SMA crosses with the 350D SMA triggering the PI Cycle Top, the value of the ratio between the two lines is 1.
This visualizes the ratio between the two moving averages into a single line. This indicator can be used for technical analysis for historical and future moves.
Casa_UtilsLibrary "Casa_Utils"
A collection of convenience and helper functions for indicator and library authors on TradingView
formatNumber(num)
My version of format number that doesn't have so many decimal places...
Parameters:
num (float) : The number to be formatted
Returns: The formatted number
getDateString(timestamp)
Convenience function returns timestamp in yyyy/MM/dd format.
Parameters:
timestamp (int) : The timestamp to stringify
Returns: The date string
getDateTimeString(timestamp)
Convenience function returns timestamp in yyyy/MM/dd hh:mm format.
Parameters:
timestamp (int) : The timestamp to stringify
Returns: The date string
getInsideBarCount()
Gets the number of inside bars for the current chart. Can also be passed to request.security to get the same for different timeframes.
Returns: The # of inside bars on the chart right now.
getLabelStyleFromString(styleString, acceptGivenIfNoMatch)
Tradingview doesn't give you a nice way to put the label styles into a dropdown for configuration settings. So, I specify them in the following format: "Center", "Left", "Lower Left", "Lower Right", "Right", "Up", "Upper Left", "Upper Right", "Plain Text", "No Labels". This function takes care of converting those custom strings back to the ones expected by tradingview scripts.
Parameters:
styleString (string)
acceptGivenIfNoMatch (bool) : If no match for styleString is found and this is true, the function will return styleString, otherwise it will return tradingview's preferred default
Returns: The string expected by tradingview functions
getTime(hourNumber, minuteNumber)
Given an hour number and minute number, adds them together and returns the sum. To be used by getLevelBetweenTimes when fetching specific price levels during a time window on the day.
Parameters:
hourNumber (int) : The hour number
minuteNumber (int) : The minute number
Returns: The sum of all the minutes
getHighAndLowBetweenTimes(start, end)
Given a start and end time, returns the high or low price during that time window.
Parameters:
start (int) : The timestamp to start with (# of seconds)
end (int) : The timestamp to end with (# of seconds)
Returns: The high or low value
getPremarketHighsAndLows()
Returns an expression that can be used by request.security to fetch the premarket high & low levels in a tuple.
Returns: (tuple)
getAfterHoursHighsAndLows()
Returns an expression that can be used by request.security to fetch the after hours high & low levels in a tuple.
Returns: (tuple)
getOvernightHighsAndLows()
Returns an expression that can be used by request.security to fetch the overnight high & low levels in a tuple.
Returns: (tuple)
getNonRthHighsAndLows()
Returns an expression that can be used by request.security to fetch the high & low levels for premarket, after hours and overnight in a tuple.
Returns: (tuple)
getLineStyleFromString(styleString, acceptGivenIfNoMatch)
Tradingview doesn't give you a nice way to put the line styles into a dropdown for configuration settings. So, I specify them in the following format: "Solid", "Dashed", "Dotted", "None/Hidden". This function takes care of converting those custom strings back to the ones expected by tradingview scripts.
Parameters:
styleString (string) : Plain english (or TV Standard) version of the style string
acceptGivenIfNoMatch (bool) : If no match for styleString is found and this is true, the function will return styleString, otherwise it will return tradingview's preferred default
Returns: The string expected by tradingview functions
getPercentFromPrice(price)
Get the % the current price is away from the given price.
Parameters:
price (float)
Returns: The % the current price is away from the given price.
getPositionFromString(position)
Tradingview doesn't give you a nice way to put the positions into a dropdown for configuration settings. So, I specify them in the following format: "Top Left", "Top Center", "Top Right", "Middle Left", "Middle Center", "Middle Right", "Bottom Left", "Bottom Center", "Bottom Right". This function takes care of converting those custom strings back to the ones expected by tradingview scripts.
Parameters:
position (string) : Plain english position string
Returns: The string expected by tradingview functions
getRsiAvgsExpression(rsiLength)
Call request.security with this as the expression to get the average up/down values that can be used with getRsiPrice (below) to calculate the price level where the supplied RSI level would be reached.
Parameters:
rsiLength (simple int) : The length of the RSI requested.
Returns: A tuple containing the avgUp and avgDown values required by the getRsiPrice function.
getRsiPrice(rsiLevel, rsiLength, avgUp, avgDown)
use the values returned by getRsiAvgsExpression() to calculate the price level when the provided RSI level would be reached.
Parameters:
rsiLevel (float) : The RSI level to find price at.
rsiLength (int) : The length of the RSI to calculate.
avgUp (float) : The average move up of RSI.
avgDown (float) : The average move down of RSI.
Returns: The price level where the provided RSI level would be met.
getSizeFromString(sizeString)
Tradingview doesn't give you a nice way to put the sizes into a dropdown for configuration settings. So, I specify them in the following format: "Auto", "Huge", "Large", "Normal", "Small", "Tiny". This function takes care of converting those custom strings back to the ones expected by tradingview scripts.
Parameters:
sizeString (string) : Plain english size string
Returns: The string expected by tradingview functions
getTimeframeOfChart()
Get the timeframe of the current chart for display
Returns: The string of the current chart timeframe
getTimeNowPlusOffset(candleOffset)
Helper function for drawings that use xloc.bar_time to help you know the time offset if you want to place the end of the drawing out into the future. This determines the time-size of one candle and then returns a time n candleOffsets into the future.
Parameters:
candleOffset (int) : The number of items to find singular/plural for.
Returns: The future time
getVolumeBetweenTimes(start, end)
Given a start and end time, returns the sum of all volume across bars during that time window.
Parameters:
start (int) : The timestamp to start with (# of seconds)
end (int) : The timestamp to end with (# of seconds)
Returns: The volume
isToday()
Returns true if the current bar occurs on today's date.
Returns: True if current bar is today
padLabelString(labelText, labelStyle)
Pads a label string so that it appears properly in or not in a label. When label.style_none is used, this will make sure it is left-aligned instead of center-aligned. When any other type is used, it adds a single space to the right so there is padding against the right end of the label.
Parameters:
labelText (string) : The string to be padded
labelStyle (string) : The style of the label being padded for.
Returns: The padded string
plural(num, singular, plural)
Helps format a string for plural/singular. By default, if you only provide num, it will just return "s" for plural and nothing for singular (eg. plural(numberOfCats)). But you can optionally specify the full singular/plural words for more complicated nomenclature (eg. plural(numberOfBenches, 'bench', 'benches'))
Parameters:
num (int) : The number of items to find singular/plural for.
singular (string) : The string to return if num is singular. Defaults to an empty string.
plural (string) : The string to return if num is plural. Defaults to 's' so you can just add 's' to the end of a word.
Returns: The singular or plural provided strings depending on the num provided.
timeframeInSeconds(timeframe)
Get the # of seconds in a given timeframe. Tradingview's timeframe.in_seconds() expects a simple string, and we often need to use series string, so this is an alternative to get you the value you need.
Parameters:
timeframe (string)
Returns: The number of secondsof that timeframe
timeframeOfChart()
Convert a timeframe string to a consistent standard.
Returns: The standard format for the string, or the unchanged value if it is unknown.
timeframeToString(timeframe)
Convert a timeframe string to a consistent standard.
Parameters:
timeframe (string)
Returns: (string) The standard format for the string, or the unchanged value if it is unknown.
stringToTimeframe(strTimeframe)
Convert an english-friendly timeframe string to a value that can be used by request.security. Specifically, this corrects hour strings (eg. 4h) to their numeric "minute" equivalent (eg. 240)
Parameters:
strTimeframe (string)
Returns: (string) The standard format for the string, or the unchanged value if it is unknown.
getPriceLabel(price, labelOffset, labelStyle, labelSize, labelColor, textColor)
Defines a label for the end of a price level line.
Parameters:
price (float) : The price level to render the label at.
labelOffset (int) : The number of candles to place the label to the right of price.
labelStyle (string) : A plain english string as defined in getLabelStyleFromString.
labelSize (string) : The size of the label.
labelColor (color) : The color of the label.
textColor (color) : The color of the label text (defaults to #ffffff)
Returns: The label that was created.
setPriceLabel(label, labelName, price, labelOffset, labelTemplate, labelStyle, labelColor, textColor)
Updates the label position & text based on price changes.
Parameters:
label (label) : The label to update.
labelName (string) : The name of the price level to be placed on the label.
price (float) : The price level to render the label at.
labelOffset (int) : The number of candles to place the label to the right of price.
labelTemplate (string) : The str.format template to use for the label. Defaults to: '{0}: {1} {2}{3,number,#.##}%' which means '{price}: {labelName} {+/-}{percentFromPrice}%'
labelStyle (string)
labelColor (color)
textColor (color)
getPriceLabelLine(price, labelOffset, labelColor, lineWidth)
Defines a line that will stretch from the plot line to the label.
Parameters:
price (float) : The price level to render the label at.
labelOffset (int) : The number of candles to place the label to the right of price.
labelColor (color)
lineWidth (int) : The width of the line. Defaults to 1.
setPriceLabelLine(line, price, labelOffset, lastTime, lineColor)
Updates the price label line based on price changes.
Parameters:
line (line) : The line to update.
price (float) : The price level to render the label at.
labelOffset (int) : The number of candles to place the label to the right of price.
lastTime (int) : The last time that the line should stretch from. Defaults to time.
lineColor (color)

Tweezer Bull Bear
## Tweezer Patterns Indicator
This indicator detects and displays two candlestick patterns: Tweezer Top (Bearish) and Tweezer Bottom (Bullish).
### Features:
- Detects Tweezer Top and Tweezer Bottom patterns
- Uses SMA for trend detection (customizable)
- Visual indicators: labels and background colors
- Tooltips with pattern explanations
- Configurable alerts
### Tweezer Top (Bearish):
- Occurs in uptrends
- Two-candle pattern: long green followed by red
- Nearly identical highs
- Potential bearish reversal signal
### Tweezer Bottom (Bullish):
- Occurs in downtrends
- Two-candle pattern: long red followed by green
- Nearly identical lows
- Potential bullish reversal signal
### Customization:
- Choose trend detection method: SMA50 or SMA50 + SMA200
- Adjustable label colors
This indicator helps traders identify potential market reversal points with clear visual cues and explanations.

MACD Histogram Color Tabledisplaying the MACD Histogram color and divergences across multiple timeframes. Here's how it works step by step:
1. Setting the Table Position
The script allows the user to choose where the table will be placed using the positionOption input. The three options are:
Top Right
Top Left
Top Center
Depending on the selected option, the table is created at the corresponding position.
2. Creating the Table
A table (macdTable) is created with 8 columns (for different timeframes) and 3 rows (for different data points).
3. MACD Histogram Color Function (f_get_macd_color)
This function calculates the MACD line, signal line, and histogram for a given timeframe.
The histogram (histLine) is used to determine the cell background color:
Green if the histogram is positive.
Red if the histogram is negative.
4. Divergence Detection Function (f_detect_divergence)
This function looks for bullish and bearish divergences using the MACD histogram:
Bullish Divergence (🟢)
The price makes a lower low.
The MACD histogram makes a higher low.
Bearish Divergence (🔴)
The price makes a higher high.
The MACD histogram makes a lower high.
The function returns:
🟢 (green circle) for bullish divergence.
🔴 (red circle) for bearish divergence.
"" (empty string) if no divergence is detected.
5. Populating the Table
The table has three rows for each timeframe:
First row: Displays the timeframe labels (5m, 15m, 30m, etc.).
Second row: Shows MACD Histogram color (red/green).
Third row: Displays divergences (🟢/🔴).
This is done using table.cell() for each timeframe.
6. Final Result
A table is displayed on the chart.
Each column represents a different timeframe.
The color-coded row shows the MACD histogram status.
The bottom row shows detected divergences.

ASCII ARTASCII ART - Simple ASCII Art Display Indicator
A minimalist indicator that displays ASCII art on your TradingView charts. This tool allows you to add creative visual elements to your charts through ASCII art text.
Key Features
Input ASCII art through a text area
Choose from 9 display positions (top-left, top-center, top-right, middle-left, middle-center, middle-right, bottom-left, bottom-center, bottom-right)
Customize font size
Set font color
How to Use
Add the indicator to your chart
Input your ASCII art in the text area
Configure position, font size, and color
View your art on the chart
Settings
Text Area: Input field for ASCII art
Table position: Select display location
Font size: Set text size (0 for auto-adjust)
Font color: Choose text color
This script is created for educational purposes and does not provide trading signals. It is purely designed for displaying ASCII art on your charts to enhance visual customization.

Donchian Trend Ribbon (Gradient)Donchian Trend Ribbon (Gradient) Indicator
The Donchian Trend Ribbon (Gradient) uses Donchian Channels to visualize trend direction, strength, and market phases. Columns with varying colors and intensity help traders quickly assess trends.
Key Components:
Green Columns (Bullish):
Appear when price is above the upper Donchian Channel boundary.
Bright green in the top zone (25-50): Strong bullish trend.
Darker green in the lower zone (0-25): Weak/moderate bullish trend.
A full-height bright green column indicates a very strong upward move.
Red Columns (Bearish):
Appear when price is below the lower Donchian Channel boundary.
Bright red in the top zone (25-50): Strong bearish trend.
Darker red in the lower zone (0-25): Weak/moderate bearish trend.
A full-height bright red column indicates a very strong downward move.
Black Columns (Neutral):
Indicate no trend or market consolidation.
Signal to wait for trend emergence.
Expanding Steps:
Steps expanding downward from the upper edge (50) suggest diminishing momentum.
Steps expanding upward from the lower edge (0) indicate growing trend strength.
Methods of Use:
Identify Trends: Green (buy) or red (sell) columns in the top zone (25-50) signal strong trends.
Assess Strength: Bright colors = strong trends, darker colors = weaker trends. Full-height bright columns indicate very strong moves.
Neutral Phases: Black columns suggest waiting for a trend.
Example Strategy:
Buy when green columns appear in the 25-50 range with bright intensity.
Sell when red columns appear in the 25-50 range with bright intensity.
Exit positions if columns turn black or darker-colored.

Total Volume for Custom PeriodIndicator Description: Total Volume for Custom Period
This indicator calculates the total trading volume for a specified time period and displays the result in the top-right corner of the chart. It is designed for traders and analysts who want to see the cumulative volume over a defined range of time without needing to calculate it manually.
Features:
Customizable Time Period:
Define the start and end times of the calculation using the easy-to-use settings panel.
The indicator dynamically updates as you adjust the dates.
Accurate Volume Calculation:
Calculates the total trading volume for all candlesticks between the selected start and end dates.
Works on all assets and timeframes supported by TradingView (stocks, crypto, forex, etc.).
Fixed Display:
The result is displayed in the top-right corner of the chart inside a clear and simple table.
The value remains visible regardless of chart movement or zoom level.
Real-time Updates:
Automatically recalculates the volume when new data is added or the selected time period changes.
Customizable Design:
Black text with a transparent background ensures the display is clear and non-intrusive.
Large text size for easy readability.
Use Cases:
Volume Analysis: Quickly assess the total trading activity over a specific time period.
Historical Data Analysis: Compare volume data across different time intervals.
Custom Strategies: Use the total volume metric as part of a broader trading strategy or analysis.
How It Works:
Open the settings panel of the indicator and input the desired Start Date and End Date.
The indicator calculates the total trading volume for all candles within the selected range.
The result is displayed in the top-right corner of the chart.
This indicator is a simple yet powerful tool for traders who rely on volume analysis to make informed decisions. It enhances your ability to study market behavior during specific periods and provides insights into trading activity with ease.

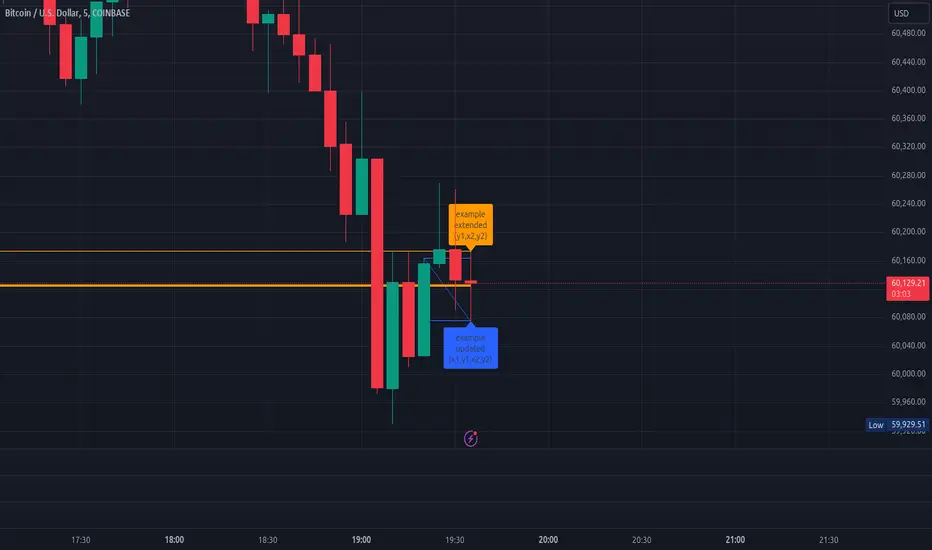
ImbalancesThis Pine Script is a trading indicator designed to identify imbalances in the market, specifically on candlestick charts. An imbalance refers to situations where there is a significant difference between buyers and sellers, which can create gaps or areas of inefficiency in the price. These imbalances often act as zones where price may return to "fill" or correct these inefficiencies.
1. Identifying Imbalances
The script analyzes candlestick patterns to detect imbalances based on the relationship between the highs, lows, and closes of consecutive candles. Specifically, it looks for:
Top Imbalances (Bearish): Areas where selling pressure has dominated, causing inefficiencies in the price. These are represented by patterns like multiple consecutive bearish candles or bearish gaps.
Bottom Imbalances (Bullish): Areas where buying pressure has dominated, leading to bullish gaps or inefficiencies.
When an imbalance is detected, the script highlights the area using visual boxes on the chart.
2. Visual Representation
The indicator uses colored boxes to show imbalances directly on the chart:
Top (Bearish) Imbalances: Highlighted using shades of red.
Bottom (Bullish) Imbalances: Highlighted using shades of green.
The boxes are further categorized into three states based on their level of mitigation:
Unmitigated: The imbalance has not been "filled" by price yet.
Partially Mitigated: Price has entered the imbalance zone but not completely filled it.
Fully Mitigated: Price has completely filled the imbalance zone.
3. Mitigation Logic
The concept of mitigation refers to the price revisiting an imbalance zone to correct the inefficiency:
If price fully or partially revisits an imbalance zone, the box's color changes to indicate the mitigation level (e.g., from unmitigated to partially/fully mitigated).
Fully mitigated boxes may be removed or recolored, depending on user preferences.
4. User Customization
The script provides several inputs to customize its behavior:
Enable or disable top and bottom imbalance detection.
Color settings: Users can define different colors for unmitigated, partially mitigated, and fully mitigated imbalances.
Mitigation display options: Users can choose whether to show fully mitigated imbalances on the chart or remove them.
5. Key Calculations
Imbalance Size: The size of the imbalance is calculated as the price difference between a candle's high and low across the relevant pattern.
Pattern Detection: The script checks for specific candlestick patterns (e.g., three consecutive bearish candles) to identify potential imbalances.
6. Practical Use Case
This indicator is useful for traders who:
Rely on supply and demand zones for their trading strategies.
Look for areas where price is likely to return (retesting unmitigated imbalances can signal potential trade setups).
Want to visually track market inefficiencies over time.
In Summary
The "Imbalances" indicator highlights and tracks price inefficiencies on candlestick charts. It marks zones where buying or selling pressure was dominant, and it dynamically updates these zones based on price action to indicate their mitigation status. This tool is particularly helpful for traders who use price action and market structure in their strategies.

US/JP Factor/Sector Performance RankingThis indicator is designed to help you easily understand the strengths and weaknesses of different factors and sectors in the U.S. stock market. It looks at various ETFs, ranks their performance over a specific period (20 days by default), and shows the results visually.
= How the Ranking Works
The best-performing rank is shown as -1, with lower ranks as -2, -3, -4, and so on. This setup makes it easy to see rank order in TradingView’s default view.
If you turn on the “Inverse” setting, ranks will be shown as positive numbers in order (e.g., 1, 2, 3…). In this case, it’s recommended to reverse the TradingView scale for better understanding.
= How the Indicator Reacts to Market Conditions
- Normal Market Conditions
Certain factors or sectors often stay at the top rank. For example, during the rallies at the start of 2024 and in May, the Momentum factor performed well, showing a risk-on market environment.
On the other hand, sectors at the bottom rank also tend to stay in specific positions.
- Market Tops
Capital flows within sectors slow down, and top ranks begin to change frequently. This may suggest a market turning point.
- Bear Markets or High Volatility
Rankings become more chaotic in these conditions. These large changes can help you understand market sentiment and the level of volatility.
= Way of using the Indicator
You can use this indicator in the following ways:
- To apply sector rotation strategies.
- To build positions after volatile markets calm down.
- To take long positions on strong elements (higher ranks) and short positions on weaker ones (lower ranks).
= Things to Keep in Mind
It’s a Lagging Indicator
This indicator calculates rankings using the past 20 days of data. It doesn’t provide signals for the future but is a tool for analyzing past performance. To predict the market, you should combine this with other tools or leading indicators.
However, since trends in capital flows often continue, this indicator can help you spot those trends.
= Customization
This indicator is set up for U.S. and Japanese stock markets. However, you can customize it for other markets by changing the ticker and label description in the script.
==Japanese Description==
このインジケーターは、米国株市場におけるファクターやセクターの強弱を直感的に把握するために設計されています。
各ETFを参照し、特定期間(デフォルトでは20日間)のパフォーマンスを順位付けし、それを視覚的に表示します。
= インジケーターの特徴
- ランク付けの仕様
ランク1位は-1で表され、順位が下がるごとに-2、-3、-4…と減少します。この仕様により、TradingViewの標準状態でランクの高低を直感的に把握できるようにしました。
さらに、Inverse設定をONにすると、1位から順に正の値(例: 1, 2, 3…)で表示されるようになります。この場合、TradingViewのスケールを反転させることを推奨します。
= 市況とインジケーターの動き
- 平常時の市況
特定のファクターやセクターがランク1位を維持することが多いです。
例えば、2024年の年初や同年5月の上昇相場では、Momentumファクターが効果を発揮し、リスクオンの市場環境であったことを示しています。
一方、最下位に位置するセクターも特定の順位を維持する傾向があります。
- 天井圏の市況
セクター内の資金流入や流出が停滞し、上位ランクの変動が起こり始めます。これが市場の転換点を示唆する場合があります。
- 下落相場や荒れた市況
ランク順位が大きく乱れることが特徴です。この変動の大きさは、市況の雰囲気やボラティリティの高さを感じ取る材料として活用できます。
= 活用方法
このインジケーターは以下のような投資戦略に役立てることができます:
- セクターローテーションを活用した投資戦略
- 荒れた相場が落ち着いたタイミングでのポジション構築
- 強い要素(ランク上位)のロング、弱い要素(ランク下位)のショート
= 注意点
- 遅行指標であること
本インジケーターは、過去20日間のデータを基にランクを算出します。そのため、先行的なシグナルを提供するものではなく、過去のパフォーマンスに基づいた分析ツールです。市場を先回りするには、別途先行指標や分析を組み合わせる必要があります。
ただし、特定のファクターやセクターへの資金流入・流出が継続する傾向があるため、これを見極める手助けにはなります。
= カスタマイズについて
このインジケーターは米国・日本株市場に特化しています。ただし、他国のファクターやセクターのETFや指数が利用可能であれば、スクリプト内のtickerとlabel descriptionを変更することでカスタマイズが可能です。

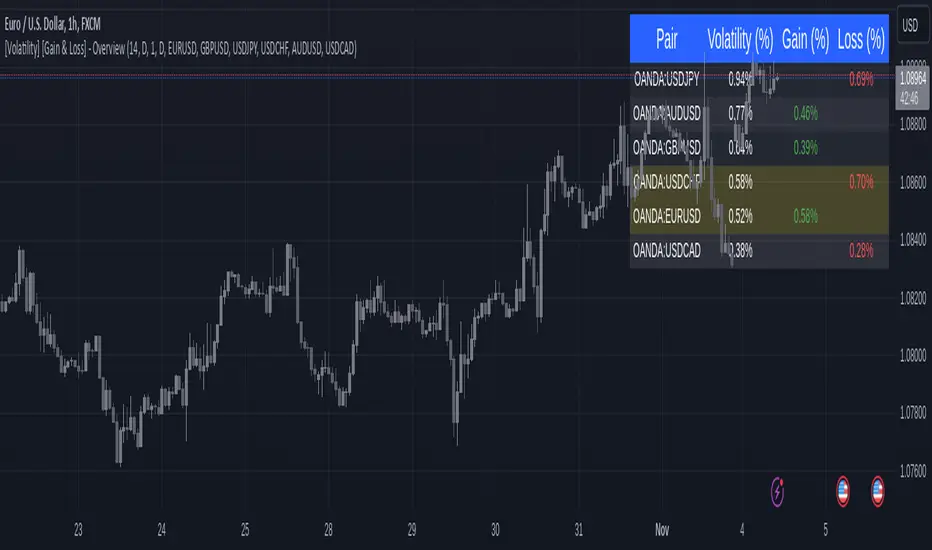
[Volatility] [Gain & Loss] - OverviewFX:EURUSD
Indicator Overview: Volatility & Gain/Loss - Forex Pair Analysis
This indicator, " —Overview" , is designed for users interested in analyzing the volatility and gain/loss metrics of multiple forex pairs. The tool is especially useful for traders aiming to assess currency pair volatility alongside gain and loss percentages over selected periods. It enables a clearer understanding of pair behavior and aids in decision-making.
Key Features
Customizable Volatility and Gain/Loss Periods : Define your preferred calculation periods and timeframes for both volatility and gain/loss to tailor the indicator to specific trading strategies. Multi-Pair Analysis : This indicator supports up to six forex pairs (default pairs include EURUSD, GBPUSD, USDJPY, USDCHF, AUDUSD, and USDCAD) and allows you to adjust these pairs as needed. Visual Ranking : Forex pairs are sorted by volatility, displaying the highest pairs at the top for quick reference. Top Gain/Loss Highlighting : The pair with the maximum gain and the pair with the maximum loss are highlighted in the table, making it easy to identify the best and worst performers at a glance.
Indicator Settings
Volatility Settings : Period : Adjust the number of periods used in the ATR (Average True Range) calculation. A default period of 14 is set. Timeframe : Select a timeframe (e.g., Daily, Weekly) for volatility calculation to match your analysis preference.
Gain/Loss Settings : Period : Choose the number of periods for gain/loss calculation. The default is set to 1. Timeframe : Select the timeframe for gain/loss calculation, independent of the volatility timeframe.
Symbol Selection : Configure up to six forex pairs. By default, popular forex pairs are pre-loaded but can be customized to include other currency pairs.
Output and Visualization
Table Display : This indicator displays data in a neatly structured table positioned in the top-right corner of your chart. Columns : Includes columns for the Forex Pair, Volatility Percentage, Gain Percentage, and Loss Percentage. Color Coding : Volatility is displayed in a standard color for clear readability. Gain values are highlighted in green, and Loss values are highlighted in red, allowing for quick visual differentiation. Highlighting : Rows representing the pair with the highest gain and the pair with the most significant loss are especially highlighted for emphasis.
How to Use
Volatility Analysis : This metric gives insight into the average price range movements for each pair over the specified period and timeframe, helping you evaluate the potential for rapid price changes. Gain/Loss Tracking : Gain or loss percentages show the pair's recent performance, allowing you to observe whether a currency pair is trending positively or negatively over the chosen period. Comparative Pair Ranking : Use the table to identify pairs with the highest volatility and extremes in gain or loss to guide trading decisions based on market conditions.
Ideal For
Swing Traders and Day Traders looking to understand short-term market fluctuations in currency pairs. Risk Management : Helps traders gauge pairs with higher risk (volatility) and recent performance (gain/loss) for informed position sizing and risk control.
This indicator is a comprehensive tool for visualizing and analyzing key forex pairs, making it an essential addition for traders looking to stay updated on volatility trends and recent price changes.
lib_setLibrary "lib_set"
This is a convenience lib that bundles different setter functions allowing to update all coordinates and of line/box in one call, and coordinates and text for label.
method set_xy_text(this, x, y, txt, tooltip)
Updates a label object with new data (equals redrawing it)
Namespace types: series label
Parameters:
this (label)
x (int) : reassigns the x coordinate, optional param, no effect if x = na (same as draw(extend_only = true) for Line objects). Avoiding to reassign x can prevent errors for invalid params passed to set_x***
y (float) : reassigns the y coordinate
txt (string) : reassigns the label text
tooltip (string) : reassigns the label tooltip
method set_xy1_xy2(this, x1, y1, x2, y2)
Updates a line object with new data (equals redrawing it)
Namespace types: series line
Parameters:
this (line)
x1 (int) : reassigns the x1 coordinate, optional param, no effect if x1 = na (same as draw(extend_only = true) for Line objects). Avoiding to reassign x1 can prevent errors for invalid params passed to set_x***
y1 (float) : reassigns the y1 coordinate
x2 (int) : reassigns the x2 coordinate
y2 (float) : reassigns the y2 coordinate
method set_left_top_right_bottom(this, left, top, right, bottom)
Updates a box object with new data (equals redrawing it)
Namespace types: series box
Parameters:
this (box)
left (int) : reassigns the left coordinate, optional param, no effect if left = na (same as draw(extend_only = true) for Box objects). Avoiding to reassign 'left' can prevent errors for invalid params passed to set_x***
top (float) : reassigns the top coordinate
right (int) : reassigns the right coordinate
bottom (float) : reassigns the bottom coordinate
Autotable█ OVERVIEW
The library allows to automatically draw a table based on a string or float matrix (or both) controlling all of the parameters of the table (including merging cells) with parameter matrices (like, e.g. matrix of cell colors).
All things you would normally do with table.new() and table.cell() are now possible using respective parameters of library's main function, autotable() (as explained further below).
Headers can be supplied as arrays.
Merging of the cells is controlled with a special matrix of "L" and "U" values which instruct a cell to merged with the cell to the left or upwards (please see examples in the script and in this description).
█ USAGE EXAMPLES
The simplest and most straightforward:
mxF = matrix.new(3,3, 3.14)
mxF.autotable(bgcolor = color.rgb(249, 209, 29)) // displays float matrix as a table in the top right corner with defalult settings
mxS = matrix.new(3,3,"PI")
// displays string matrix as a table in the top right corner with defalult settings
mxS.autotable(Ypos = "bottom", Xpos = "right", bgcolor = #b4d400)
// displays matrix displaying a string value over a float value in each cell
mxS.autotable(mxF, Ypos = "middle", Xpos = "center", bgcolor = color.gray, text_color = #86f62a)
Draws this:
Tables with headers:
if barstate.islast
mxF = matrix.new(3,3, 3.14)
mxS = matrix.new(3,3,"PI")
arColHeaders = array.from("Col1", "Col2", "Col3")
arRowHeaders = array.from("Row1", "Row2", "Row3")
// float matrix with col headers
mxF.autotable(
bgcolor = #fdfd6b
, arColHeaders = arColHeaders
)
// string matrix with row headers
mxS.autotable(arRowHeaders = arRowHeaders, Ypos = "bottom", Xpos = "right", bgcolor = #b4d400)
// string/float matrix with both row and column headers
mxS.autotable(mxF
, Ypos = "middle", Xpos = "center"
, arRowHeaders = arRowHeaders
, arColHeaders = arColHeaders
, cornerBgClr = #707070, cornerTitle = "Corner\ncell", cornerTxtClr = #ffdc13
, bgcolor = color.gray, text_color = #86f62a
)
Draws this:
█ FUNCTIONS
One main function is autotable() which has only one required argument mxValS, a string matrix.
Please see below the description of all of the function parameters:
The table:
tbl (table) (Optional) If supplied, this table will be deleted.
The data:
mxValS (matrix ) (Required) Cell text values
mxValF (matrix) (Optional) Numerical part of cell text values. Is concatenated to the mxValS values via `string_float_separator` string (default "\n")
Table properties, have same effect as in table.new() :
defaultBgColor (color) (Optional) bgcolor to be used if mxBgColor is not supplied
Ypos (string) (Optional) "top", "bottom" or "center"
Xpos (string) (Optional) "left", "right", or "center"
frame_color (color) (Optional) frame_color like in table.new()
frame_width (int) (Optional) frame_width like in table.new()
border_color (color) (Optional) border_color like in table.new()
border_width (int) (Optional) border_width like in table.new()
force_overlay (simple bool) (Optional) If true draws table on main pane.
Cell parameters, have same effect as in table.cell() ):
mxBgColor (matrix) (Optional) like bgcolor argument in table.cell()
mxTextColor (matrix) (Optional) like text_color argument in table.cell()
mxTt (matrix) (Optional) like tooltip argument in table.cell()
mxWidth (matrix) (Optional) like width argument in table.cell()
mxHeight (matrix) (Optional) like height argument in table.cell()
mxHalign (matrix) (Optional) like text_halign argument in table.cell()
mxValign (matrix) (Optional) like text_valign argument in table.cell()
mxTextSize (matrix) (Optional) like text_size argument in table.cell()
mxFontFamily (matrix) (Optional) like text_font_family argument in table.cell()
Other table properties:
tableWidth (float) (Optional) Overrides table width if cell widths are non zero. E.g. if there are four columns and cell widths are 20 (either as set via cellW or via mxWidth) then if tableWidth is set to e.g. 50 then cell widths will be 50 * (20 / 80), where 80 is 20*4 = total width of all cells. Works simialar for widths set via mxWidth - determines max sum of widths across all cloumns of mxWidth and adjusts cell widths proportionally to it. If cell widths are 0 (i.e. auto-adjust) tableWidth has no effect.
tableHeight (float) (Optional) Overrides table height if cell heights are non zero. E.g. if there are four rows and cell heights are 20 (either as set via cellH or via mxHeight) then if tableHeigh is set to e.g. 50 then cell heights will be 50 * (20 / 80), where 80 is 20*4 = total height of all cells. Works simialar for heights set via mxHeight - determines max sum of heights across all cloumns of mxHeight and adjusts cell heights proportionally to it. If cell heights are 0 (i.e. auto-adjust) tableHeight has no effect.
defaultTxtColor (color) (Optional) text_color to be used if mxTextColor is not supplied
text_size (string) (Optional) text_size to be used if mxTextSize is not supplied
font_family (string) (Optional) cell text_font_family value to be used if a value in mxFontFamily is no supplied
cellW (float) (Optional) cell width to be used if a value in mxWidth is no supplied
cellH (float) (Optional) cell height to be used if a value in mxHeight is no supplied
halign (string) (Optional) cell text_halign value to be used if a value in mxHalign is no supplied
valign (string) (Optional) cell text_valign value to be used if a value in mxValign is no supplied
Headers parameters:
arColTitles (array) (Optional) Array of column titles. If not na a header row is added.
arRowTitles (array) (Optional) Array of row titles. If not na a header column is added.
cornerTitle (string) (Optional) If both row and column titles are supplied allows to set the value of the corner cell.
colTitlesBgColor (color) (Optional) bgcolor for header row
colTitlesTxtColor (color) (Optional) text_color for header row
rowTitlesBgColor (color) (Optional) bgcolor for header column
rowTitlesTxtColor (color) (Optional) text_color for header column
cornerBgClr (color) (Optional) bgcolor for the corner cell
cornerTxtClr (color) (Optional) text_color for the corner cell
Cell merge parameters:
mxMerge (matrix) (Optional) A matrix determining how cells will be merged. "L" - cell merges to the left, "U" - upwards.
mergeAllColTitles (bool) (Optional) Allows to print a table title instead of column headers, merging all header row cells and leaving just the value of the first cell. For more flexible options use matrix arguments leaving header/row arguments na.
mergeAllRowTitles (bool) (Optional) Allows to print one text value merging all header row cells and leaving just the value of the first cell. For more flexible options use matrix arguments leaving header/row arguments na.
Format:
string_float_separator (string) (Optional) A string used to separate string and float parts of cell values (mxValS and mxValF). Default is "\n"
format (string) (Optional) format string like in str.format() used to format numerical values
nz (string) (Optional) Determines how na numerical values are displayed.
The only other available function is autotable(string,... ) with a string parameter instead of string and float matrices which draws a one cell table.
█ SAMPLE USE
E.g., CSVParser library demo uses Autotable's for generating complex tables with merged cells.
█ CREDITS
The library was inspired by @kaigouthro's matrixautotable . A true master. Many thanks to him for his creative, beautiful and very helpful libraries.

StrConcatWrap█ OVERVIEW
Contains functions for concatenation and wrapping of the strings:
- concatTrunc() / concatTrunc2() - Concatenate via a separator up to a given length truncating from left or right. concatTrunc2 returns also the number of overflowing chars (in a tuple)
- print() - A powerful concatenate function truncating chars from left or right and/or lines from top or bottom. By default just adds new lines respecting max length.
- wrap() - Wraps each line of the text adding prefix/postfix. If resulting string exceeds max length truncates from the end adding " "
- scroll() Returns a range of lines from the source string.
█ FUNCTIONS
method concatTrunc2(this, txt, separator, max_length, truncate_left, ignore_empty_strings)
Concatenates two strings leaving _max_length chars truncating from left/right. (Truncates from the end of the string by default).
this String to which txt is added
txt String to be added
max_length (int) (Optional) max length of string, default: 4096
separator (string) (Optional) If both this and txt are non empty separator is added in between. Usually "\n" is used.
truncate_left (bool) (Optional) if true truncates left string (this), if false - txt. Default - false (truncates txt)
ignore_empty_strings (bool) (Optional) if true and one of `this` or `txt` is empty just returns the other, if false - adds separator.
Returns: (tuple ) A tuple . E.g. if `this` is 4095 chars and separator is 2 chars then 4095+2=4097 exceeds default max_length = 4096 by 1, so will be returned, even if , e.g. `txt` is empty and `ignore_empty_strings` is true.
method concatTrunc(this, txt, separator, max_length, truncate_left, ignore_empty_strings)
Concatenates two strings leaving _max_length chars truncating from left/right. (Truncates from the end of the string by default).
this : string to which txt is added
txt : string to be added to this
max_length : max length of string, default: 4096
separator : If both this and txt are non empty separator is added in between. Usually "\n" is used.
truncate_left : if true truncates left string (this), if false - txt. Default - false (truncates txt)
ignore_empty_strings : (bool) (Optional) if true and one of `this` or `txt` is empty just returns the other, if false - adds separator.
Returns: (string) Resulting string
method printLines( this, txt, max_length, max_lines, line_break_regex, line_break, truncate_left, ignore_empty_strings, add_line_numbers, line_number_format, start_line_number, print_to_last_line)
Adds up to `max_lines` lines from `txt` to `this` observing `max_length`, truncating from left or right (truncating source strings `this` and/or `txt` themselves if necessary).
this : (string) Print outputs `txt` to the end of `this`
txt : (string) Print outputs `txt` to the end of `this`
max_length : (int) (Optional) Chars in excess of `max_length` will be truncated (ending chars by default, see `truncate_left` arg). Default: 4096
max_lines : (int) (Optional) Lines in excess of `max_lines` will be truncated (from end by default, see `truncate_left` arg). Default: 4096
line_break_regex : (string) (Optional) A regex expression used to search for linebrakes. Default is "(\\n|\\r|\\r\\n)"
line_break : (string) (Optional) A string added as a line break. Default is "\n".
truncate_left : (bool) (Optional) If true chars in excess of `max_length` will be truncated from the beginning , if false - from the end. Default: false.
ignore_empty_strings : (bool) (Optional) If false a line break will be added (as an empty string), if false `this` will not change.
add_line_numbers : (bool) (Optional) If true adds number before each line. Default format: "LN0001". Custom fomat can be set with `line_number_format'.
line_numbers_format : (string) (Optional) Line number format (like in `str.format()`). Default: `"LN{0000: }"`
print_to_last_line : (string) (Optional) If true will add text to the last line (notwithout adding line break before the first added line). Default: false.
Returns: ` ` where `outS` = `this` + added lines, `intLenthOverflow` = number of truncated chars (including separator), e.g. if `this` is 4095 chars and separator is 2 chars then 4095+2=4097 exceeds default max_length = 4096 by 1, so will be returned, even if , e.g. `txt` is empty and `ignore_empty_strings` is true, and n - number of added lines
method print( this, txt, max_length, max_lines, truncate_left, truncate_top, truncate_lines_src, add_line_numbers, line_number_format, print_to_last_line)
Powerful concatenate function. In simplest form (`this.print(txt)`) just adds `txt` to the end of `this` starting from new line. If `print_to_last_line` is true then concatenates. Can truncate for _max_length (from right by default) and max_lines (truncating from top or bottom). (First removes excessive lines (over `max_lines`) then concatenates truncating for `max_length`.) `print()` looks for all kinds of line breaks (`\r`, `\n` or `\r\n`) and replaces them with `\n`.
this : (string) Print outputs `txt` to the end of `this`
txt : (string) Print outputs `txt` to the end of `this`
max_length : (int) (Optional) Chars in excess of `max_length` will be truncated (ending chars by default, see `truncate_left` arg). Default: 4096
max_lines : (int) (Optional) Lines in excess of `max_lines` will be truncated (from end by default, see `truncate_left` arg). Default: 4096
truncate_left : (bool) (Optional) If true chars in excess of `max_length` will be truncated from the beginning , if false - from the end. Default: false.
truncate_top : (bool) (Optional) If true lines in excess of `max_lines` will be truncated from the top, if false - from the bottom. Default: false.
truncate_lines_src : (bool) (Optional) If true and either `this` or `txt` exceed `max_lines` they will be truncated (excessive lines removed). (Characters in excess of max_length will be truncated regardless). If truncate_top and txt has more than max_lines lines excessive lines will be truncated from the top. (if truncate_top escessive lines from `this` will be truncated regardless of truncate_src). If not truncate_top and this has more than max_lines lines excessive lines will be truncated from the bottom. (if not truncate_top escessive lines from `txt` will be truncated regardless of truncate_src)
add_line_numbers : (bool) (Optional) If true adds number before each line. Default format: "LN0001". Custom fomat can be set with `line_number_format'.
line_numbers_format : (string) (Optional) Line number format (like in `str.format()`). Default: `"LN{0000: }"`
print_to_last_line : (string) (Optional) If true will add text to the last line (notwithout adding line break before the first added line). Default: false.
Returns: ` ` where `outS` = `this` + added lines.
method wrap(this, wrap_width, breaker_prefix, breaker_postfix, line_postfix, max_length)
Wraps each line of `this` to wrap_width adding breaker_prefix to the end of each line (before "\n") and breaker_postfix to the beginning of each line (after "\n")" (i.e. breaker_prefix'es are effectively added to the end of each line (but the last) and breaker_postfix'es to the beginning of new line starting from second). If with breakers the line exceeds 4096 it is truncated from the right and " " is added at the end.
wrap_width : (series int) Width of each line (chars).
breaker_prefix : (series string) (Optional) Text to add at the end of each line. (Default = "")
breaker_postfix : (series string) (Optional) Text to add after the each added line break at the beginning of next line. (Default = "")
Returns: the wrapped text
export method scroll(this, start_line, lines_in_window, show_line_numbers, show_header)
Scrolls the text (this) by returning a given number of lines (`lines_in_window`) starting from `start_line`. Can add line numbers and/or a header line in the form "Starting from line ... out of total ... lines, ... chars"
start_line : (int) (Optional) Start line
lines_in_window : (int) (Optional) Number of lines to read and return
show_line_numbers : (bool) (Optional) If true preceeds each line with a line number in the form "LN0001}: "
show_header : (bool) (Optional) If true shows the header string in the form "Starting from line {0} out of total {1} lines, {2} chars" followed by a separator line "----------".
Returns: (string) Range of strings.

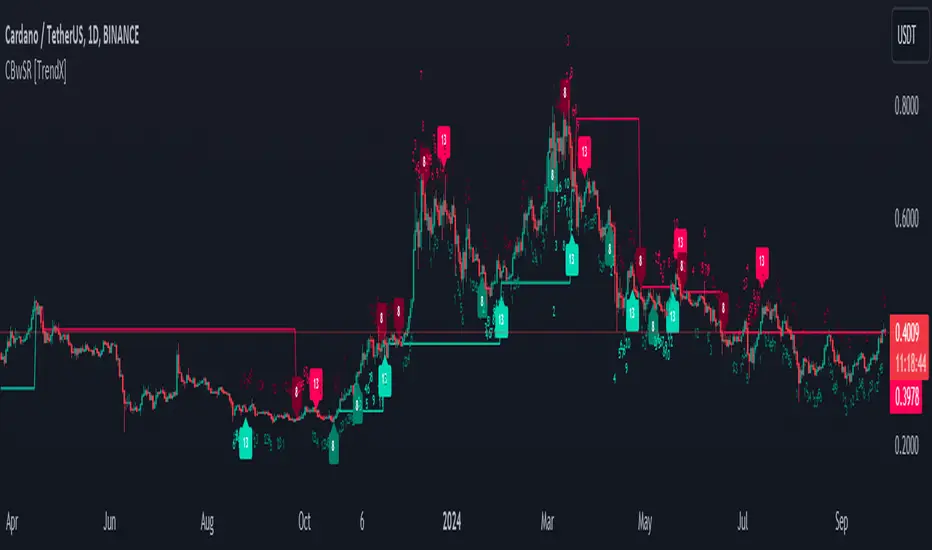
Consecutive Beta with Dynamic Support Resistance [TrendX_]The Consecutive Beta with Dynamic Support Resistance indicator is tailored to harness trend momentum, recognize top & bottom reversals, and leverage dynamic support and resistance levels. This indicator introduces a new approach by combining the concepts of beta, consecutive counting mechanisms, and the supertrend structure, making it a fresh tool for understanding market trends and patterns.
💎 KEY FEATURES
Candle’s Relative Valuation Using Beta: The core of the TrendX indicator lies in using beta to gauge volatility. Beta serves as a measure of how an asset moves relative to the broader market, helping traders understand whether the asset is more or less volatile in different market conditions.
Counting Techniques for Momentum & Reversals: By employing counting techniques to reach a significant threshold, the indicator can measure trend momentum and spot top/bottom reversals.
Dynamic Support & Resistance: This feature relies on consecutive beta counting to dynamically adapt support and resistance levels. These levels are key in predicting potential entry and exit points following the general trend direction.
⚙️ USAGES
Initial Start and Distance: Customize the initial start point and distance for better control over trading strategies. For instance, starting at 1 and using an even distance of 2 will yield odd consecutive counting series;
Phase 1 Completion for Reversal Strategies: This initial phase focuses on identifying short-term reversals;
Phase 2 Completion for Support/Resistance: A support level forms after completing two bullish phases, while a resistance level forms after completing two bearish phases. This structure helps in clarifying trend directions when breakout these key levels.
🔎 BREAKDOWN
Phase 1:
The indicator counts consecutive candles that show a higher Beta than in previous periods over a given length. The completion of countings only succeed when the whole series is uninterruptedly counted, or else countings will be canceled. This strict adherence to consecutive counts serves to ensure that only strong, sustained momentum is recognized and also helps filter out noise, weak signals and establish the initial direction catalyst, setting up for further trend analysis.
Phase 2:
After Phase 1 ends, the Phase 2 counting mechanism begins. This phase focuses on bottom reversals through consecutive higher beta candles, and top reversals by counting lower beta candles. At this stage, interuptions will not cancel the counting process. The ability to continue counting in Phase 2 allows for a broader perspective on market behavior. Even if individual candles do not consistently meet the criteria for consecutive counts, the cumulative effect of higher or lower beta readings over time provides valuable insights into market sentiment and trend direction.
Dynamic Support & Resistance:
After Phase 2 completion, if the average of high, low, and close surpasses both recent support and resistance levels from Phase 2, an uptrend is confirmed, which the support level is displayed. If it drops below these levels, a downtrend is indicated, where resistance is displayed instead of support. The result is displayed through a colored supertrend-line (teal for uptrend, red for downtrend).
DISCLAIMER
This indicator is not financial advice, it can only help traders make better decisions. There are many factors and uncertainties that can affect the outcome of any endeavor, and no one can guarantee or predict with certainty what will occur. Therefore, one should always exercise caution and judgment when making decisions based on past performance.
Bitcoin Logarithmic Growth Curve 2024The Bitcoin logarithmic growth curve is a concept used to analyze Bitcoin's price movements over time. The idea is based on the observation that Bitcoin's price tends to grow exponentially, particularly during bull markets. It attempts to give a long-term perspective on the Bitcoin price movements.
The curve includes an upper and lower band. These bands often represent zones where Bitcoin's price is overextended (upper band) or undervalued (lower band) relative to its historical growth trajectory. When the price touches or exceeds the upper band, it may indicate a speculative bubble, while prices near the lower band may suggest a buying opportunity.
Unlike most Bitcoin growth curve indicators, this one includes a logarithmic growth curve optimized using the latest 2024 price data, making it, in our view, superior to previous models. Additionally, it features statistical confidence intervals derived from linear regression, compatible across all timeframes, and extrapolates the data far into the future. Finally, this model allows users the flexibility to manually adjust the function parameters to suit their preferences.
The Bitcoin logarithmic growth curve has the following function:
y = 10^(a * log10(x) - b)
In the context of this formula, the y value represents the Bitcoin price, while the x value corresponds to the time, specifically indicated by the weekly bar number on the chart.
How is it made (You can skip this section if you’re not a fan of math):
To optimize the fit of this function and determine the optimal values of a and b, the previous weekly cycle peak values were analyzed. The corresponding x and y values were recorded as follows:
113, 18.55
240, 1004.42
451, 19128.27
655, 65502.47
The same process was applied to the bear market low values:
103, 2.48
267, 211.03
471, 3192.87
676, 16255.15
Next, these values were converted to their linear form by applying the base-10 logarithm. This transformation allows the function to be expressed in a linear state: y = a * x − b. This step is essential for enabling linear regression on these values.
For the cycle peak (x,y) values:
2.053, 1.268
2.380, 3.002
2.654, 4.282
2.816, 4.816
And for the bear market low (x,y) values:
2.013, 0.394
2.427, 2.324
2.673, 3.504
2.830, 4.211
Next, linear regression was performed on both these datasets. (Numerous tools are available online for linear regression calculations, making manual computations unnecessary).
Linear regression is a method used to find a straight line that best represents the relationship between two variables. It looks at how changes in one variable affect another and tries to predict values based on that relationship.
The goal is to minimize the differences between the actual data points and the points predicted by the line. Essentially, it aims to optimize for the highest R-Square value.
Below are the results:
It is important to note that both the slope (a-value) and the y-intercept (b-value) have associated standard errors. These standard errors can be used to calculate confidence intervals by multiplying them by the t-values (two degrees of freedom) from the linear regression.
These t-values can be found in a t-distribution table. For the top cycle confidence intervals, we used t10% (0.133), t25% (0.323), and t33% (0.414). For the bottom cycle confidence intervals, the t-values used were t10% (0.133), t25% (0.323), t33% (0.414), t50% (0.765), and t67% (1.063).
The final bull cycle function is:
y = 10^(4.058 ± 0.133 * log10(x) – 6.44 ± 0.324)
The final bear cycle function is:
y = 10^(4.684 ± 0.025 * log10(x) – -9.034 ± 0.063)
The main Criticisms of growth curve models:
The Bitcoin logarithmic growth curve model faces several general criticisms that we’d like to highlight briefly. The most significant, in our view, is its heavy reliance on past price data, which may not accurately forecast future trends. For instance, previous growth curve models from 2020 on TradingView were overly optimistic in predicting the last cycle’s peak.
This is why we aimed to present our process for deriving the final functions in a transparent, step-by-step scientific manner, including statistical confidence intervals. It's important to note that the bull cycle function is less reliable than the bear cycle function, as the top band is significantly wider than the bottom band.
Even so, we still believe that the Bitcoin logarithmic growth curve presented in this script is overly optimistic since it goes parly against the concept of diminishing returns which we discussed in this post:
This is why we also propose alternative parameter settings that align more closely with the theory of diminishing returns.
Our recommendations:
Drawing on the concept of diminishing returns, we propose alternative settings for this model that we believe provide a more realistic forecast aligned with this theory. The adjusted parameters apply only to the top band: a-value: 3.637 ± 0.2343 and b-parameter: -5.369 ± 0.6264. However, please note that these values are highly subjective, and you should be aware of the model's limitations.
Conservative bull cycle model:
y = 10^(3.637 ± 0.2343 * log10(x) - 5.369 ± 0.6264)

JordanSwindenLibraryLibrary "JordanSwindenLibrary"
TODO: add library description here
getDecimals()
Calculates how many decimals are on the quote price of the current market
Returns: The current decimal places on the market quote price
getPipSize(multiplier)
Calculates the pip size of the current market
Parameters:
multiplier (int) : The mintick point multiplier (1 by default, 10 for FX/Crypto/CFD but can be used to override when certain markets require)
Returns: The pip size for the current market
truncate(number, decimalPlaces)
Truncates (cuts) excess decimal places
Parameters:
number (float) : The number to truncate
decimalPlaces (simple float) : (default=2) The number of decimal places to truncate to
Returns: The given number truncated to the given decimalPlaces
toWhole(number)
Converts pips into whole numbers
Parameters:
number (float) : The pip number to convert into a whole number
Returns: The converted number
toPips(number)
Converts whole numbers back into pips
Parameters:
number (float) : The whole number to convert into pips
Returns: The converted number
getPctChange(value1, value2, lookback)
Gets the percentage change between 2 float values over a given lookback period
Parameters:
value1 (float) : The first value to reference
value2 (float) : The second value to reference
lookback (int) : The lookback period to analyze
Returns: The percent change over the two values and lookback period
random(minRange, maxRange)
Wichmann–Hill Pseudo-Random Number Generator
Parameters:
minRange (float) : The smallest possible number (default: 0)
maxRange (float) : The largest possible number (default: 1)
Returns: A random number between minRange and maxRange
bullFib(priceLow, priceHigh, fibRatio)
Calculates a bullish fibonacci value
Parameters:
priceLow (float) : The lowest price point
priceHigh (float) : The highest price point
fibRatio (float) : The fibonacci % ratio to calculate
Returns: The fibonacci value of the given ratio between the two price points
bearFib(priceLow, priceHigh, fibRatio)
Calculates a bearish fibonacci value
Parameters:
priceLow (float) : The lowest price point
priceHigh (float) : The highest price point
fibRatio (float) : The fibonacci % ratio to calculate
Returns: The fibonacci value of the given ratio between the two price points
getMA(length, maType)
Gets a Moving Average based on type (! MUST BE CALLED ON EVERY TICK TO BE ACCURATE, don't place in scopes)
Parameters:
length (simple int) : The MA period
maType (string) : The type of MA
Returns: A moving average with the given parameters
barsAboveMA(lookback, ma)
Counts how many candles are above the MA
Parameters:
lookback (int) : The lookback period to look back over
ma (float) : The moving average to check
Returns: The bar count of how many recent bars are above the MA
barsBelowMA(lookback, ma)
Counts how many candles are below the MA
Parameters:
lookback (int) : The lookback period to look back over
ma (float) : The moving average to reference
Returns: The bar count of how many recent bars are below the EMA
barsCrossedMA(lookback, ma)
Counts how many times the EMA was crossed recently (based on closing prices)
Parameters:
lookback (int) : The lookback period to look back over
ma (float) : The moving average to reference
Returns: The bar count of how many times price recently crossed the EMA (based on closing prices)
getPullbackBarCount(lookback, direction)
Counts how many green & red bars have printed recently (ie. pullback count)
Parameters:
lookback (int) : The lookback period to look back over
direction (int) : The color of the bar to count (1 = Green, -1 = Red)
Returns: The bar count of how many candles have retraced over the given lookback & direction
getBodySize()
Gets the current candle's body size (in POINTS, divide by 10 to get pips)
Returns: The current candle's body size in POINTS
getTopWickSize()
Gets the current candle's top wick size (in POINTS, divide by 10 to get pips)
Returns: The current candle's top wick size in POINTS
getBottomWickSize()
Gets the current candle's bottom wick size (in POINTS, divide by 10 to get pips)
Returns: The current candle's bottom wick size in POINTS
getBodyPercent()
Gets the current candle's body size as a percentage of its entire size including its wicks
Returns: The current candle's body size percentage
isHammer(fib, colorMatch)
Checks if the current bar is a hammer candle based on the given parameters
Parameters:
fib (float) : (default=0.382) The fib to base candle body on
colorMatch (bool) : (default=false) Does the candle need to be green? (true/false)
Returns: A boolean - true if the current bar matches the requirements of a hammer candle
isStar(fib, colorMatch)
Checks if the current bar is a shooting star candle based on the given parameters
Parameters:
fib (float) : (default=0.382) The fib to base candle body on
colorMatch (bool) : (default=false) Does the candle need to be red? (true/false)
Returns: A boolean - true if the current bar matches the requirements of a shooting star candle
isDoji(wickSize, bodySize)
Checks if the current bar is a doji candle based on the given parameters
Parameters:
wickSize (float) : (default=2) The maximum top wick size compared to the bottom (and vice versa)
bodySize (float) : (default=0.05) The maximum body size as a percentage compared to the entire candle size
Returns: A boolean - true if the current bar matches the requirements of a doji candle
isBullishEC(allowance, rejectionWickSize, engulfWick)
Checks if the current bar is a bullish engulfing candle
Parameters:
allowance (float) : (default=0) How many POINTS to allow the open to be off by (useful for markets with micro gaps)
rejectionWickSize (float) : (default=disabled) The maximum rejection wick size compared to the body as a percentage
engulfWick (bool) : (default=false) Does the engulfing candle require the wick to be engulfed as well?
Returns: A boolean - true if the current bar matches the requirements of a bullish engulfing candle
isBearishEC(allowance, rejectionWickSize, engulfWick)
Checks if the current bar is a bearish engulfing candle
Parameters:
allowance (float) : (default=0) How many POINTS to allow the open to be off by (useful for markets with micro gaps)
rejectionWickSize (float) : (default=disabled) The maximum rejection wick size compared to the body as a percentage
engulfWick (bool) : (default=false) Does the engulfing candle require the wick to be engulfed as well?
Returns: A boolean - true if the current bar matches the requirements of a bearish engulfing candle
isInsideBar()
Detects inside bars
Returns: Returns true if the current bar is an inside bar
isOutsideBar()
Detects outside bars
Returns: Returns true if the current bar is an outside bar
barInSession(sess, useFilter)
Determines if the current price bar falls inside the specified session
Parameters:
sess (simple string) : The session to check
useFilter (bool) : (default=true) Whether or not to actually use this filter
Returns: A boolean - true if the current bar falls within the given time session
barOutSession(sess, useFilter)
Determines if the current price bar falls outside the specified session
Parameters:
sess (simple string) : The session to check
useFilter (bool) : (default=true) Whether or not to actually use this filter
Returns: A boolean - true if the current bar falls outside the given time session
dateFilter(startTime, endTime)
Determines if this bar's time falls within date filter range
Parameters:
startTime (int) : The UNIX date timestamp to begin searching from
endTime (int) : the UNIX date timestamp to stop searching from
Returns: A boolean - true if the current bar falls within the given dates
dayFilter(monday, tuesday, wednesday, thursday, friday, saturday, sunday)
Checks if the current bar's day is in the list of given days to analyze
Parameters:
monday (bool) : Should the script analyze this day? (true/false)
tuesday (bool) : Should the script analyze this day? (true/false)
wednesday (bool) : Should the script analyze this day? (true/false)
thursday (bool) : Should the script analyze this day? (true/false)
friday (bool) : Should the script analyze this day? (true/false)
saturday (bool) : Should the script analyze this day? (true/false)
sunday (bool) : Should the script analyze this day? (true/false)
Returns: A boolean - true if the current bar's day is one of the given days
atrFilter(atrValue, maxSize)
Parameters:
atrValue (float)
maxSize (float)
tradeCount()
Calculate total trade count
Returns: Total closed trade count
isLong()
Check if we're currently in a long trade
Returns: True if our position size is positive
isShort()
Check if we're currently in a short trade
Returns: True if our position size is negative
isFlat()
Check if we're currentlyflat
Returns: True if our position size is zero
wonTrade()
Check if this bar falls after a winning trade
Returns: True if we just won a trade
lostTrade()
Check if this bar falls after a losing trade
Returns: True if we just lost a trade
maxDrawdownRealized()
Gets the max drawdown based on closed trades (ie. realized P&L). The strategy tester displays max drawdown as open P&L (unrealized).
Returns: The max drawdown based on closed trades (ie. realized P&L). The strategy tester displays max drawdown as open P&L (unrealized).
totalPipReturn()
Gets the total amount of pips won/lost (as a whole number)
Returns: Total amount of pips won/lost (as a whole number)
longWinCount()
Count how many winning long trades we've had
Returns: Long win count
shortWinCount()
Count how many winning short trades we've had
Returns: Short win count
longLossCount()
Count how many losing long trades we've had
Returns: Long loss count
shortLossCount()
Count how many losing short trades we've had
Returns: Short loss count
breakEvenCount(allowanceTicks)
Count how many break-even trades we've had
Parameters:
allowanceTicks (float) : Optional - how many ticks to allow between entry & exit price (default 0)
Returns: Break-even count
longCount()
Count how many long trades we've taken
Returns: Long trade count
shortCount()
Count how many short trades we've taken
Returns: Short trade count
longWinPercent()
Calculate win rate of long trades
Returns: Long win rate (0-100)
shortWinPercent()
Calculate win rate of short trades
Returns: Short win rate (0-100)
breakEvenPercent(allowanceTicks)
Calculate break even rate of all trades
Parameters:
allowanceTicks (float) : Optional - how many ticks to allow between entry & exit price (default 0)
Returns: Break-even win rate (0-100)
averageRR()
Calculate average risk:reward
Returns: Average winning trade divided by average losing trade
unitsToLots(units)
(Forex) Convert the given unit count to lots (multiples of 100,000)
Parameters:
units (float) : The units to convert into lots
Returns: Units converted to nearest lot size (as float)
getFxPositionSize(balance, risk, stopLossPips, fxRate, lots)
(Forex) Calculate fixed-fractional position size based on given parameters
Parameters:
balance (float) : The account balance
risk (float) : The % risk (whole number)
stopLossPips (float) : Pip distance to base risk on
fxRate (float) : The conversion currency rate (more info below in library documentation)
lots (bool) : Whether or not to return the position size in lots rather than units (true by default)
Returns: Units/lots to enter into "qty=" parameter of strategy entry function
EXAMPLE USAGE:
string conversionCurrencyPair = (strategy.account_currency == syminfo.currency ? syminfo.tickerid : strategy.account_currency + syminfo.currency)
float fx_rate = request.security(conversionCurrencyPair, timeframe.period, close )
if (longCondition)
strategy.entry("Long", strategy.long, qty=zen.getFxPositionSize(strategy.equity, 1, stopLossPipsWholeNumber, fx_rate, true))
skipTradeMonteCarlo(chance, debug)
Checks to see if trade should be skipped to emulate rudimentary Monte Carlo simulation
Parameters:
chance (float) : The chance to skip a trade (0-1 or 0-100, function will normalize to 0-1)
debug (bool) : Whether or not to display a label informing of the trade skip
Returns: True if the trade is skipped, false if it's not skipped (idea being to include this function in entry condition validation checks)
fillCell(tableID, column, row, title, value, bgcolor, txtcolor, tooltip)
This updates the given table's cell with the given values
Parameters:
tableID (table) : The table ID to update
column (int) : The column to update
row (int) : The row to update
title (string) : The title of this cell
value (string) : The value of this cell
bgcolor (color) : The background color of this cell
txtcolor (color) : The text color of this cell
tooltip (string)
Returns: Nothing.

Digital Clock with Market Status and AlertsDigital Clock with Market Status and Alerts - 日本語解説は下記
Overview:
The Digital Clock with Market Status and Alerts indicator is designed to display the current time in various global time zones while also providing the status of major financial markets such as Tokyo, London, and New York. This indicator helps traders monitor the open and close times of different markets and alerts them when a market opens. Customizable options are provided for table positioning, background, text colors, and font size.
Key Features:
Real-Time Digital Clock: The indicator shows the current time in your selected time zone (Asia/Tokyo, America/New_York, Europe/London, Australia/Sydney). The time updates in real-time and includes hours, minutes, and seconds, providing a convenient and accurate way to monitor time across different trading sessions.
Global Market Status: Displays the open or closed status of major financial markets.
・Tokyo Market: Open from 9:00 AM to 3:00 PM (JST).
・London Market: Open from 16:00 to 24:00 during summer time and from 17:00 to 1:00 during winter time (JST).
・New York Market: Open from 21:00 to 5:00 during summer time and from 22:00 to 6:00 during winter time (JST).
Customizable Display:
・Background Color: The indicator allows you to set the background color for the clock display, while the leftmost empty cell can be independently customized with its own background color for table alignment.
・Clock and Market Status Colors: Separate color options are available for the clock text, market status during open, and market status during closed periods.
・Text Size: You can adjust the size of the text (small, normal, large) to fit your preferences.
・Table Position: You can position the digital clock and market status table in different locations on the chart: top left, top center, top right, bottom left, bottom center, and bottom right.
Alerts for Market Opening: The indicator will trigger alerts when a market (Tokyo, London, or New York) opens, notifying traders in real-time. This can help ensure that you don't miss any important market openings.
How to Use:
Setup:
Apply the Indicator: Add the Digital Clock with Market Status and Alerts indicator to your chart. Customize the time zone, text size, background colors, and table position based on your preferences.
Monitor Market Status: Watch the market status displayed for Tokyo, London, and New York to keep track of market openings and closings in real-time.
Receive Alerts: The indicator provides built-in alerts for market openings, helping you stay informed when a key market opens for trading.
Time Monitoring:
・Real-Time Clock: The current time is displayed with hours, minutes, and seconds for accurate tracking. The clock updates every second and reflects the selected time zone.
・Global Time Zones: Choose your desired time zone (Tokyo, New York, London, Sydney) to monitor the time most relevant to your trading strategy.
Market Status:
・Tokyo Market: The status will display "Tokyo OPEN" when the Tokyo market is active, and "Tokyo CLOSED" when it is outside of trading hours.
・London Market: Similarly, the indicator will show "London OPEN" or "London CLOSED" depending on whether the London market is currently active.
・New York Market: The New York market status follows the same structure, showing "NY OPEN" or "NY CLOSED."
Customization:
・Table Positioning: Easily move the table to the desired location on the chart to avoid overlap with other chart elements. The leftmost empty cell helps with alignment.
・Text and Background Color: Adjust the text and background colors to suit your personal preferences. You can also set independent colors for open and closed market statuses to easily distinguish between them.
Cautions and Disclaimer:
・Indicator Modifications: This indicator may be updated without prior notice, which could change or remove certain features.
・Trade Responsibility: This indicator is a tool to assist your trading, but responsibility for all trades remains with you. No guarantee of profit or success is implied, and losses can occur. Use it alongside your own analysis and strategy.
Digital Clock with Market Status and Alerts - 解説と使い方
概要:
Digital Clock with Market Status and Alerts インジケーターは、さまざまな世界のタイムゾーンで現在の時刻を表示し、東京、ロンドン、ニューヨークなどの主要な金融市場のステータスを提供します。このインジケーターにより、複数の市場のオープンおよびクローズ時間をリアルタイムで監視でき、市場がオープンする際にアラートを受け取ることができます。テーブルの位置、背景色、テキストカラー、フォントサイズなどのカスタマイズが可能です。
主な機能:
リアルタイムデジタル時計: 選択したタイムゾーン(東京、ニューヨーク、ロンドン、シドニー)の現在時刻を表示します。リアルタイムで更新され、時間、分、秒を正確に表示します。
世界の市場ステータス: 主要な金融市場のオープン/クローズ状況を表示します。
・東京市場: 午前9時~午後3時(日本時間)。
・ロンドン市場: 夏時間では16時~24時、冬時間では17時~1時(日本時間)。
・ニューヨーク市場: 夏時間では21時~5時、冬時間では22時~6時(日本時間)。
カスタマイズ可能な表示設定:
・背景色: 時計表示の背景色を設定できます。また、テーブルの左側に空白のセルを配置し、独立した背景色を設定することでテーブルの配置調整が可能です。
・時計と市場ステータスの色: 時計テキスト、オープン市場、クローズ市場の色を個別に設定できます。
・テキストサイズ: 小、標準、大から選択し、テキストサイズをカスタマイズ可能です。
・テーブル位置: デジタル時計と市場ステータスのテーブルをチャートのさまざまな場所(左上、中央上、右上、左下、中央下、右下)に配置できます。
市場オープン時のアラート: 市場(東京、ロンドン、ニューヨーク)がオープンするときにアラートを発し、リアルタイムで通知されます。これにより、重要な市場のオープン時間を逃さないようサポートします。
使い方:
セットアップ:
インジケーターを適用: チャートに「Digital Clock with Market Status and Alerts」インジケーターを追加し、タイムゾーン、テキストサイズ、背景色、テーブル位置を好みに応じてカスタマイズします。
市場ステータスを確認: 東京、ロンドン、ニューヨークの市場ステータスをリアルタイムで表示し、オープン/クローズ時間を把握できます。
アラートを受け取る: 市場オープン時のアラート機能により、重要な市場のオープンを見逃さないように通知が届きます。
時間管理:
・リアルタイム時計: 現在の時刻が秒単位で表示され、選択したタイムゾーンに基づいて正確に追跡できます。
・グローバルタイムゾーン: 東京、ニューヨーク、ロンドン、シドニーなど、トレードに関連するタイムゾーンを選択して監視できます。
市場ステータス:
・東京市場: 東京市場が開いていると「Tokyo OPEN」と表示され、閉じている場合は「Tokyo CLOSED」と表示されます。
・ロンドン市場: 同様に、「London OPEN」または「London CLOSED」が表示され、ロンドン市場のステータスを確認できます。
・ニューヨーク市場: ニューヨーク市場も「NY OPEN」または「NY CLOSED」で現在の状況が表示されます。
カスタマイズ:
・テーブル位置の調整: テーブルの位置を簡単に調整し、チャート上の他の要素と重ならないように配置できます。左側の空白セルで位置調整が可能です。
・テキストと背景色のカスタマイズ: テキストと背景の色を自分の好みに合わせて調整できます。また、オープン時とクローズ時の市場ステータスを区別するため、独立した色設定が可能です。
注意事項と免責事項:
・インジケーターの変更: このインジケーターは、予告なく変更や機能の削除が行われる場合があります。
・トレード責任: このインジケーターはトレードをサポートするツールであり、トレードに関する全責任はご自身にあります。利益を保証するものではなく、損失が発生する可能性があります。自分の分析や戦略と組み合わせて使用してください。

Composite Momentum█ Introduction
The Composite Momentum Indicator is a tool we came across that we found to be useful at detecting implied tops and bottoms within quick market cycles. Its approach to analyzing momentum through a combination of moving averages and summation techniques makes it a useful addition to the range of available indicators on TradingView.
█ How It Works
This indicator operates by calculating the difference between two moving averages—one fast and one slow, which can be customized by the user. The difference between these two averages is then expressed as a percentage of the fast moving average, forming the core momentum value which is then smoothed with an Exponential Moving Average is applied. The smoothed momentum is then compared across periods to identify directional changes in direction
Furthermore, the script calculates the absolute differences between consecutive momentum values. These differences are used to determine periods of momentum acceleration or deceleration, aiming to establish potential reversals.
In addition to tracking momentum changes, the indicator sums positive and negative momentum changes separately over a user-defined period. This summation is intended to provide a clearer picture of the prevailing market bias—whether it’s leaning towards strength or weakness.
Finally, the summed-up values are normalized to a percentage scale. This normalization helps in identifying potential tops and bottoms by comparing the relative strength of the momentum within a given cycle.
█ Usage
This indicator is primarily useful for traders who focus on detecting quick cycle tops and bottoms. It provides a view of momentum shifts that can signal these extremes, though it’s important to use it in conjunction with other tools and market analysis techniques. Given its ability to highlight potential reversals, it may be of interest to those who seek to understand short-term market dynamics.
█ Disclaimer
This script was discovered without any information about its author or original intent but was nonetheless ported from its original format that is available publicly. It’s provided here for educational purposes and should not be considered a guaranteed method for market analysis. Users are encouraged to test and understand the indicator thoroughly before applying it in real trading scenarios.
StyleLibraryLibrary "StyleLibrary"
A small library of Pine Script functions that return built-in style variables.
method sizeStyle(size)
Takes a `string` that returns the corresponding built-in size style variable.
Namespace types: series string, simple string, input string, const string
Parameters:
size (string) : A `string` representing a built-in size style: `"Tiny"`, `"Small"`, `"Normal"`, `"Large"`,
`"Huge"`, `"Auto"`.
Returns: The respective built-in size style variable.
method sizeStyle(size)
Takes a `sizeStyle` that returns the corresponding built-in size style variable.
Namespace types: series sizeStyle
Parameters:
size (series sizeStyle) : A `sizeStyle` representing a built-in size style variable.
Returns: The respective built-in size style variable.
method lineStyle(style)
Takes a `string` that returns the corresponding built-in line style variable.
Namespace types: series string, simple string, input string, const string
Parameters:
style (string) : A `string` representing a built-in line style: `"Dashed"`, `"Dotted"`, `"Solid"`.
Returns: The respective built-in line style variable.
method lineStyle(style)
Takes a `lineStyle` that returns the corresponding built-in line style variable.
Namespace types: series lineStyle
Parameters:
style (series lineStyle) : A `lineStyle` representing a built-in line style variable.
Returns: The respective built-in line style variable.
method labelStyle(style)
Takes a `string` that returns the corresponding built-in label style variable.
Namespace types: series string, simple string, input string, const string
Parameters:
style (string) : A `string` representing a built-in label style:
`"Arrow Down"`, `"Arrow Up"`, `"Circle"`, `"Cross"`, `"Diamond"`, `"Flag"`,
`"Label Center"`, `"Label Down"`, `"Label Left"`, `"Label Lower Left"`,
`"Label Lower Right"`, `"Label Right"`, `"Label Up"`, `"Label Upper Left"`,
`"Label Upper Right"`, `"None"`, `"Square"`, `"Text Outline"`, `"Triangle Down"`,
`"Triangle Up"`, `"XCross"`.
Returns: The respective built-in label style variable.
method labelStyle(style)
Takes a `labelStyle` that returns the corresponding built-in label style variable.
Namespace types: series labelStyle
Parameters:
style (series labelStyle) : A `labelStyle` representing a built-in label style variable.
Returns: The respective built-in label style variable.
method fontStyle(font)
Takes a `string` that returns the corresponding built-in font style variable.
Namespace types: series string, simple string, input string, const string
Parameters:
font (string) : A `string` representing a built-in font style: `"Default"`, `"Monospace"`.
Returns: The respective built-in font style variable.
method positionStyle(position)
Takes a `string` that returns the corresponding built-in position style variable.
Namespace types: series string, simple string, input string, const string
Parameters:
position (string) : A `string` representing a built-in position style:
`"Bottom Center", `"Bottom Left", `"Bottom Right", `"Middle Center", `"Middle Left",
`"Middle Right", `"Top Center", `"Top Left", `"Top Right".
Returns: The respective built-in position style variable.
method displayStyle(display)
Takes a `simple string` that returns the corresponding built-in display style variable.
Namespace types: simple string, input string, const string
Parameters:
display (simple string) : A `simple string` representing a built-in display style: `"All"`, `"Data Window"`,
`"None"`, `"Pane"`, `"Price Scale"`, `"Status Line"`.
Returns: The respective built-in display style variable.

Magic Linear Regression Channel [MW]Introduction
The Magic Linear Regression Channel indicator provides users with a way to quickly include a linear regression channel ANYWHERE on their chart, in order to find channel breakouts and bounces within any time period. It uses a novel method that allows users to adjust the start and end period of the regression channel in order to quickly make adjustments faster, with fewer steps, and with more precision than with any other linear regression channel tool. It includes Fibonacci bands AND a horizontal mode in order for users to quickly define significant price levels based on the high, low, open, and close prices defined by the start period.
Settings
Start Time: This is initially MANUALLY SELECTED ON THE CHART when the indicator is first loaded.
End time: This is also initially MANUALLY SELECTED ON THE CHART when the indicator is first loaded.
Horizontal Line: This forces the baseline to be horizontal. The band distance is defined by the maximum price distance from the band.
Horizontal Line Type: This snaps the horizontal line to the close, high, low, or open price. Or, it can also use a regression calculation for the selected time period to define the y-position of the line.
Extend Line N Bars: How many bars to the left in which to extend the baseline and bands.
Show Baseline ONLY!!: Removes all lines except the baseline and it’s extension.
Add Half Band: Includes a band that is half the distance between the baseline and the top and bottom bands
Add Outer Fibonacci Band: Includes a band that is 1.618 (phi) times the default band distance
Add Inner Fibonacci Band - Upper: Includes a band that is 0.618 (1/phi) times the default band distance
Add Inner Fibonacci Band - Lower: Includes a band that is 0.382 (1 - 1/phi) times the default band distance
Calculations
This indicator uses the least squares approach for generating a straight regression line, which can be reviewed at Wikipedia’s “Simple Linear Regression” page. It sums all of the x-values, and y-values, as well as the sum of the product of corresponding x and y values, and the sum of the squares of the x-values. These values are used to calculate the slope and intercept using the following equations:
slope = (n * sum_xy - sum_x * sum_y) / (n * sum_xx - sum_x * sum_x)
And
intercept = (sum_y - slope * sum_x) / n
The slope and intercept are then used to generate the baseline and the corresponding bands using the user-selected offsets.
How to Use
When the Magic Linear Regression Channel indicator is first added to the chart, there will be a blue prompt behind the “Indicators, Metrics & Strategies” window. Close the window, then select a START POINT by clicking at a desired location on the chart. Next, you will be prompted to select an END POINT. The end point MUST be placed after the START POINT. At this time a channel will be generated. Once you’ve selected the START POINT and END POINT, you can adjust them by dragging them anywhere on the chart. Each adjustment will generate a new channel making it easier for you to quickly visualize and recognize any channel exits and bounces.
The Magic Linear Regression Channel indicator works great at identifying wave patterns. Place the start line at a top or bottom pivot point. Place the end line at the next respective top or bottom pivot. This will give you a complete wave form to work with. When price reaches a band and rejects, it can be a strong indication that price may move back to one of the bands in the channel. If price exits the channel with volume that supports the exit, it may be an indication of a breakout.
You can also use the horizontal mode to identify key levels, then add Fibonacci bands based on regression calculations for the given time period to provide more meaningful areas of support and resistance.
Other Usage Notes and Limitations
Occasionally, off-by-1 errors appear which makes the extended lines protrude at a slightly incorrect angle. This is a known bug and will be addressed in the next release.
It's important for traders to be aware of the limitations of any indicator and to use them as part of a broader, well-rounded trading strategy that includes risk management, fundamental analysis, and other tools that can help with reducing false signals, determining trend direction, and providing additional confirmation for a trade decision. Diversifying strategies and not relying solely on one type of indicator or analysis can help mitigate some of these risks.
