FOREX MASTER PATTERN Value Lines by nnamThe Forex Master Pattern is form of technical analysis that provides a framework for spotting hidden price patterns that reveal the true movement of the market. The Forex Master Pattern Value Lines Indicator helps to identify this Phase 1 contraction of the Forex Master Pattern cycle.
HOW THIS INDICATOR WORKS
This indicator looks for a sustained contraction in price initially indicated by TWO contraction bars in a row, thus detecting a contraction point and a potential new master pattern origin point.
Once a contraction point is detected, a blue box will appear on the chart with a thick solid blue line projecting from its center. These are potential "Points of Origin" and "Value Lines" that institutional traders use to balance their books.
As shown above, when price begins to move (detected by engulfing and/or expansion candles), an Arrow is plotted to the chart identifying a possible expansion.
As shown above, previous Value Lines typically serve as future support / resistance points, however, due to the unique location of these lines, they are not typically identified as support or resistance levels on standard S/R indicators.
Color Coded Candles assist the user in quickly identifying contraction and expansion areas as well as trends away from the value-line. The expansion candles, Up/Down candles, and contraction BARS are all inspired by the STRAT (Rob Smith) and are specifically incorporated into this indicator to assist the user in finding potential reversals during the expansion phase. This helps to avoid the whiplash typically associated with the first phase of Forex Master Pattern.
USER DEFINED SETTINGS
- Line Settings Section -
#Max Lines to Show
This limits or extends the total number of lines shown on the chart. The Default is 12 (minimum is 1, maximum is 499).
#Show Lines on Chart
This setting turns all lines ON or OFF on the chart
#Show Value-Lines on Chart
This setting turns the Value Lines ON or OFF on the chart
#Set Value-Line Width
This setting sets the width of the value-line displayed on the chart
#Only show last value-line on the chart
This setting removes all but the most recent value-line from the chart
- Box Settings Section -
#Show Last Box Only
This setting turns OFF all previous boxes and only shows the most recent contraction box on the chart
- Expansion Area Settings Section -
#Show Expansion Area
This setting turns ON or OFF the expansion area fill
#Show Expansion Guidelines on Chart
This setting turns ON or OFF the guidelines that show the current direction of the price via an extended line.
- Candle Colors Section -
#Color Code the Candles
This setting turns on Color Coding for the Candles which changes the colors of each candle type:
1. Contraction Candle
2. Expansion Candle
3. Up Candle
4. Down Candle
5. Engulfing Candles (engulfing candles override other candle settings if turned ON)
- Engulfing Patterns Section -
#Show Engulfing Patterns
This setting turns ON or OFF engulfing candle plots globally
#Show Bullish Engulfing Candles
This setting allows the user to turn Bullish Engulfing signals ON or OFF
#Show Bearish Engulfing Candles
This setting allows the user to turn Bearish Engulfing signals ON or OFF
I hope you enjoy this indicator and that it provides some value. Please reach out to me with any suggestions or need training on the indicator.
ค้นหาในสคริปต์สำหรับ "the strat"

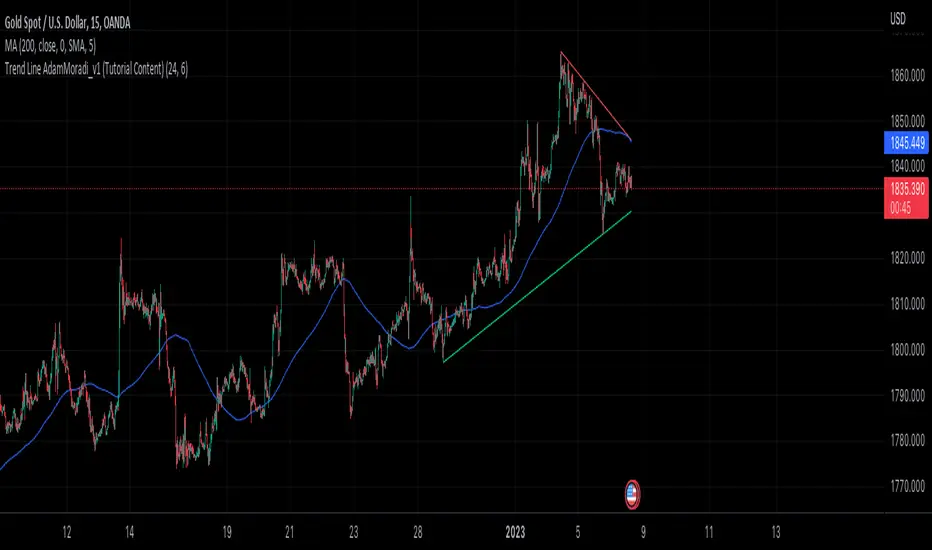
Trend Line Adam Moradi v1 (Tutorial Content)
The Pine Script strategy that plots pivot points and trend lines on a chart. The strategy allows the user to specify the period for calculating pivot points and the number of pivot points to be used for generating trend lines. The user can also specify different colors for the up and down trend lines.
The script starts by defining the input parameters for the strategy and then calculates the pivot high and pivot low values using the pivothigh() and pivotlow() functions. It then stores the pivot points in two arrays called trend_top_values and trend_bottom_values. The script also has two arrays called trend_top_position and trend_bottom_position which store the positions of the pivot points.
The script then defines a function called add_to_array() which takes in three arguments: apointer1, apointer2, and val. This function adds val to the beginning of the array pointed to by apointer1, and adds bar_index to the beginning of the array pointed to by apointer2. It then removes the last element from both arrays.
The script then checks if a pivot high or pivot low value has been calculated, and if so, it adds the value and its position to the appropriate arrays using the add_to_array() function.
Next, the script defines two arrays called bottom_lines and top_lines which will be used to store trend lines. It also defines a variable called starttime which is set to the current time.
The script then enters a loop to calculate and plot the trend lines. It first deletes any existing trend lines from the chart. It then enters two nested loops which iterate over the pivot points stored in the trend_bottom_values and trend_top_values arrays. For each pair of pivot points, the script calculates the slope of the line connecting them and checks if the line is a valid trend line by iterating over the price bars between the two pivot points and checking if the line is above or below the close price of each bar. If the line is found to be a valid trend line, it is plotted on the chart using the line.new() function.
Finally, the script colors the trend lines using the colors specified by the user.
Tutorial Content
'PivotPointNumber' is an input parameter for the script that specifies the number of pivot points to consider when calculating the trend lines. The value of 'PivotPointNumber' is set by the user when they configure the script. It is used to determine the size of the arrays that store the values and positions of the pivot points, as well as the number of pivot points to loop through when calculating the trend lines.
'up_trend_color' is an input parameter for the script that specifies the color to use for drawing the trend lines that are determined to be upward trends. The value of 'up_trend_color' is set by the user when they configure the script and is passed to the color parameter of the line.new() function when drawing the upward trend lines. It determines the visual appearance of the upward trend lines on the chart.
'down_trend_color' is an input parameter for the script that specifies the color to use for drawing the trend lines that are determined to be downward trends. The value of 'down_trend_color' is set by the user when they configure the script and is passed to the color parameter of the line.new() function when drawing the downward trend lines. It determines the visual appearance of the downward trend lines on the chart.
'pivothigh' is a variable in the script that stores the value of the pivot high point. It is calculated using the pivothigh() function, which returns the highest high over a specified number of bars. The value of 'pivothigh' is used in the calculation of the trend lines.
'pivotlow' is a variable in the script that stores the value of the pivot low point. It is calculated using the pivotlow() function, which returns the lowest low over a specified number of bars. The value of 'pivotlow' is used in the calculation of the trend lines.
'trend_top_values' is an array in the script that stores the values of the pivot points that are determined to be at the top of the trend. These are the pivot points that are used to calculate the upward trend lines.
'trend_top_position' is an array in the script that stores the positions (i.e., bar indices) of the pivot points that are stored in the 'trend_top_values' array. These positions correspond to the locations of the pivot points on the chart.
'trend_bottom_values' is an array in the script that stores the values of the pivot points that are determined to be at the bottom of the trend. These are the pivot points that are used to calculate the downward trend lines.
'trend_bottom_position' is an array in the script that stores the positions (i.e., bar indices) of the pivot points that are stored in the 'trend_bottom_values' array. These positions correspond to the locations of the pivot points on the chart.
apointer1 and apointer2 are variables used in the add_to_array() function, which is defined in the script. They are both pointers to arrays, meaning that they hold the memory addresses of the arrays rather than the arrays themselves. They are used to manipulate the arrays by adding new elements to the beginning of the arrays and removing elements from the end of the arrays.
apointer1 is a pointer to an array of floating-point values, while apointer2 is a pointer to an array of integers. The specific arrays that they point to depend on the arguments passed to the add_to_array() function when it is called. For example, if add_to_array(trend_top_values, trend_top_posisiton, pivothigh) is called, then apointer1 would point to the tval array and apointer2 would point to the tpos array.
'bottom_lines' (short for "Bottom Lines") is an array in the script that stores the line objects for the downward trend lines that are drawn on the chart. Each element of the array corresponds to a different trend line.
'top_lines' (short for "Top Lines") is an array in the script that stores the line objects for the upward trend lines that are drawn on the chart. Each element of the array corresponds to a different trend line.
Both 'bottom_lines' and 'top_lines' are arrays of type "line", which is a data type in PineScript that represents a line drawn on a chart. The line objects are created using the line.new() function and are used to draw the trend lines on the chart. The variables are used to store the line objects so that they can be manipulated and deleted later in the script.
Loops
maxline is a variable in the script that specifies the maximum number of trend lines that can be drawn on the chart. It is used to determine the size of the bottom_lines and top_lines arrays, which store the line objects for the trend lines.
The value of maxline is set to 3 at the beginning of the script, meaning that at most 3 trend lines can be drawn on the chart at a time. This value can be changed by the user if desired by modifying the assignment statement "maxline = 3".
'count_line_low' (short for "Count Line Low") is a variable in the script that keeps track of the number of downward trend lines that have been drawn on the chart. It is used to ensure that the maximum number of trend lines (as specified by the maxline variable) is not exceeded.
'count_line_high' (short for "Count Line High") is a variable in the script that keeps track of the number of upward trend lines that have been drawn on the chart. It is used to ensure that the maximum number of trend lines (as specified by the maxline variable) is not exceeded.
Both 'count_line_low' and 'count_line_high' are initialized to 0 at the beginning of the script and are incremented each time a new trend line is drawn. If either variable exceeds the value of maxline, then no more trend lines are drawn.
'pivot1', 'up_val1', 'up_val2', up1, and up2 are variables used in the loop that calculates the downward trend lines in the script. They are used to store intermediate values during the calculation process.
'pivot1' is a loop variable that is used to iterate through the pivot points (stored in the trend_bottom_values and trend_bottom_position arrays) that are being considered for use in the trend line calculation.
'up_val1' and 'up_val2' are variables that store the values of the pivot points that are used to calculate the downward trend line.
up1 and up2 are variables that store the positions (i.e., bar indices) of the pivot points that are stored in 'up_val1' and 'up_val2', respectively. These positions correspond to the locations of the pivot points on the chart.
'value1' and 'value2' are variables that are used to store the values of the pivot points that are being compared in the loop that calculates the trend lines in the script. They are used to determine whether a trend line can be drawn between the two pivot points.
For example, if 'value1' is the value of a pivot point at the top of the trend and 'value2' is the value of a pivot point at the bottom of the trend, then a trend line can be drawn between the two points if 'value1' is greater than 'value2'. The values of 'value1' and 'value2' are used in the calculation of the slope and intercept of the trend line.
'position1' and 'position2' are variables that are used to store the positions (i.e., bar indices) of the pivot points that are being compared in the loop that calculates the trend lines in the script. They are used to determine the distance between the pivot points, which is necessary for calculating the slope of the trend line.
For example, if 'position1' is the position of a pivot point at the top of the trend and 'position2' is the position of a pivot point at the bottom of the trend, then the distance between the two points is given by 'position1' - 'position2'. This distance is used in the calculation of the slope of the trend line.
'different', 'high_line', 'low_location', 'low_value', and 'valid' are variables that are used in the loop that calculates the downward trend lines in the script. They are used to store intermediate values during the calculation process.
'different' is a variable that stores the slope of the downward trend line being calculated. It is calculated as the difference in value between the two pivot points (stored in up_val1 and up_val2) divided by the distance between the pivot points (calculated using their positions, stored in up1 and up2).
'high_line' is a variable that stores the current value of the trend line being calculated at a given point in the loop. It is initialized to the value of the second pivot point (stored in up_val2) and is updated on each iteration of the loop using the value of different.
'low_location' is a variable that stores the position (i.e., bar_index) on the chart of the point where the trend line being calculated first touches the low price. It is initialized to the position of the second pivot point (stored in up2) and is updated on each iteration of the loop if the trend line touches a lower low.
'low_value' is a variable that stores the value of the trend line at the point where it first touches the low price. It is initialized to the value of the second pivot point (stored in up_val2) and is updated on each iteration of the loop if the trend line touches a lower low.
'valid' is a Boolean variable that is used to indicate whether the trend line being calculated is valid. It is initialized to true and is set to false if the trend line does not pass through all the lows between the pivot points. If valid is still true after the loop has completed, then the trend line is considered valid and is drawn on the chart.
d_value1, d_value2, d_position1, and d_position2 are variables that are used in the loop that calculates the upward trend lines in the script. They are used to store intermediate values during the calculation process.
d_value1 and d_value2 are variables that store the values of the pivot points that are used to calculate the upward trend line.
d_position1 and d_position2 are variables that store the positions (i.e., bar indices) of the pivot points that are stored in d_value1 and d_value2, respectively. These positions correspond to the locations of the pivot points on the chart.
The variables d_value1, d_value2, d_position1, and d_position2 have the same function as the variables uv1, uv2, up1, and up2, respectively, but for the calculation of the upward trend lines rather than the downward trend lines. They are used in a similar way to store intermediate values during the calculation process.
thank you.
Musashi_Fractal_Dimension === Musashi-Fractal-Dimension ===
This tool is part of my research on the fractal nature of the markets and understanding the relation between fractal dimension and chaos theory.
To take full advantage of this indicator, you need to incorporate some principles and concepts:
- Traditional Technical Analysis is linear and Euclidean, which makes very difficult its modeling.
- Linear techniques cannot quantify non-linear behavior
- Is it possible to measure accurately a wave or the surface of a mountain with a simple ruler?
- Fractals quantify what Euclidean Geometry can’t, they measure chaos, as they identify order in apparent randomness.
- Remember: Chaos is order disguised as randomness.
- Chaos is the study of unstable aperiodic behavior in deterministic non-linear dynamic systems
- Order and randomness can coexist, allowing predictability.
- There is a reason why Fractal Dimension was invented, we had no way of measuring fractal-based structures.
- Benoit Mandelbrot used to explain it by asking: How do we measure the coast of Great Britain?
- An easy way of getting the need of a dimension in between is looking at the Koch snowflake.
- Market prices tend to seek natural levels of ranges of balance. These levels can be described as attractors and are determinant.
Fractal Dimension Index ('FDI')
Determines the persistence or anti-persistence of a market.
- A persistent market follows a market trend. An anti-persistent market results in substantial volatility around the trend (with a low r2), and is more vulnerable to price reversals
- An easy way to see this is to think that fractal dimension measures what is in between mainstream dimensions. These are:
- One dimension: a line
- Two dimensions: a square
- Three dimensions: a cube.
--> This will hint you that at certain moment, if the market has a Fractal Dimension of 1.25 (which is low), the market is behaving more “line-like”, while if the market has a high Fractal Dimension, it could be interpreted as “square-like”.
- 'FDI' is trend agnostic, which means that doesn't consider trend. This makes it super useful as gives you clean information about the market without trying to include trend stuff.
Question: If we have a game where you must choose between two options.
1. a horizontal line
2. a vertical line.
Each iteration a Horizontal Line or a Square will appear as continuation of a figure. If it that iteration shows a square and you bet vertical you win, same as if it is horizontal and it is a line.
- Wouldn’t be useful to know that Fractal dimension is 1.8? This will hint square. In the markets you can use 'FD' to filter mean-reversal signals like Bollinger bands, stochastics, Regular RSI divergences, etc.
- Wouldn’t be useful to know that Fractal dimension is 1.2? This will hint Line. In the markets you can use 'FD' to confirm trend following strategies like Moving averages, MACD, Hidden RSI divergences.
Calculation method:
Fractal dimension is obtained from the ‘hurst exponent’.
'FDI' = 2 - 'Hurst Exponent'
Musashi version of the Classic 'OG' Fractal Dimension Index ('FDI')
- By default, you get 3 fast 'FDI's (11,12,13) + 1 Slow 'FDI' (21), their interaction gives useful information.
- Fast 'FDI' cross will give you gray or red dots while Slow 'FDI' cross with the slowest of the fast 'FDI's will give white and orange dots. This are great to early spot trend beginnings or trend ends.
- A baseline (purple) is also provided, this is calculated using a 21 period Bollinger bands with 1.618 'SD', once calculated, you just take midpoint, this is the 'TDI's (Traders Dynamic Index) way. The indicator will print purple dots when Slow 'FDI' and baseline crosses, I see them as Short-Term cycle changes.
- Negative slope 'FDI' means trending asset.
- Positive most of the times hints correction, but if it got overextended it might hint a rocket-shot.
TDI Ranges:
- 'FDI' between 1.0≤ 'FDI' ≤1.4 will confirm trend following continuation signals.
- 'FDI' between 1.6≥ 'FDI' ≥2.0 will confirm reversal signals.
- 'FDI' == 1.5 hints a random unpredictable market.
Fractal Attractors
- As you must know, fractals tend orbit certain spots, this are named Attractors, this happens with any fractal behavior. The market of course also shows them, in form of Support & Resistance, Supply Demand, etc. It’s obvious they are there, but now we understand that they’re not linear, as the market is fractal, so simple trendline might not be the best tool to model this.
- I’ve noticed that when the Musashi version of the 'FDI' indicator start making a cluster of multicolor dots, this end up being an attractor, I tend to draw a rectangle as that area as price tend to come back (I still researching here).
Extra useful stuff
- Momentum / speed: Included by checking RSI Study in the indicator properties. This will add two RSI’s (9 and a 7 periods) plus a baseline calculated same way as explained for 'FDI'. This gives accurate short-term trends. It also includes RSI divergences (regular and hidden), deactivate with a simple check in the RSI section of the properties.
- BBWP (Bollinger Bands with Percentile): Efficient way of visualizing volatility as the percentile of Bollinger bands expansion. This line varies color from Iced blue when low volatility and magma red when high. By default, comes with the High vols deactivated for better view of 'FDI' and RSI while all studies are included. DDWP is trend agnostic, just like 'FDI', which make it very clean at providing information.
- Ultra Slow 'FDI': I noticed that while using BBWP and RSI, the indicator gets overcrowded, so there is the possibility of adding only one 'FDI' + its baseline.
Final Note: I’ve shown you few ways of using this indicator, please backtest before using in real trading. As you know trading is more about risk and trade management than the strategy used. This still a work in progress, I really hope you find value out of it. I use it combination with a tool named “Musashi_Katana” (also found in TradingView).
Best!
Musashi

S&P 500 Quandl Data & RatiosTradingView has a little-known integration that allows you to pull in 3rd party data-sets from Nasdaq Data Link, also known as Quandl. Today, I am open-sourcing for the community an indicator that uses the Quandl integration to pull in historical data and ratios on the S&P500. I originally coded this to study macro P/E ratios during peaks and troughs of boom/bust cycles.
The indicator pulls in each of the following datasets, as defined and provided by Quandl. The user can select which datasets to pull in using the indicator settings:
Dividend Yield : S&P 500 dividend yield (12 month dividend per share)/price. Yields following June 2022 (including the current yield) are estimated based on 12 month dividends through June 2022, as reported by S&P. Sources: Standard & Poor's for current S&P 500 Dividend Yield. Robert Shiller and his book Irrational Exuberance for historic S&P 500 Dividend Yields.
Price Earning Ratio : Price to earnings ratio, based on trailing twelve month as reported earnings. Current PE is estimated from latest reported earnings and current market price. Source: Robert Shiller and his book Irrational Exuberance for historic S&P 500 PE Ratio.
CAPE/Shiller PE Ratio : Shiller PE ratio for the S&P 500. Price earnings ratio is based on average inflation-adjusted earnings from the previous 10 years, known as the Cyclically Adjusted PE Ratio (CAPE Ratio), Shiller PE Ratio, or PE 10 FAQ. Data courtesy of Robert Shiller from his book, Irrational Exuberance.
Earnings Yield : S&P 500 Earnings Yield. Earnings Yield = trailing 12 month earnings divided by index price (or inverse PE) Yields following March, 2022 (including current yield) are estimated based on 12 month earnings through March, 2022 the latest reported by S&P. Source: Standard & Poor's
Price Book Ratio : S&P 500 price to book value ratio. Current price to book ratio is estimated based on current market price and S&P 500 book value as of March, 2022 the latest reported by S&P. Source: Standard & Poor's
Price Sales Ratio : S&P 500 Price to Sales Ratio (P/S or Price to Revenue). Current price to sales ratio is estimated based on current market price and 12 month sales ending March, 2022 the latest reported by S&P. Source: Standard & Poor's
Inflation Adjusted SP500 : Inflation adjusted SP500. Other than the current price, all prices are monthly average closing prices. Sources: Standard & Poor's Robert Shiller and his book Irrational Exuberance for historic S&P 500 prices, and historic CPIs.
Revenue Per Share : Trailing twelve month S&P 500 Sales Per Share (S&P 500 Revenue Per Share) non-inflation adjusted current dollars. Source: Standard & Poor's
Earnings Per Share : S&P 500 Earnings Per Share. 12-month real earnings per share inflation adjusted, constant August, 2022 dollars. Sources: Standard & Poor's for current S&P 500 Earnings. Robert Shiller and his book Irrational Exuberance for historic S&P 500 Earnings.
Disclaimer: This is not financial advice. Open-source scripts I publish in the community are largely meant to spark ideas that can be used as building blocks for part of a more robust trade management strategy. If you would like to implement a version of any script, I would recommend making significant additions/modifications to the strategy & risk management functions. If you don’t know how to program in Pine, then hire a Pine-coder. We can help!

Stripped Baseline [Loxx]Stripped Baseline is a stripped down version of Loxx's Baseline indicator. This version includes the core baseline only to reduce processing overhead.
What is Baseline?
A core moving average used as part of a volatility-based trading system. This baseline includes 41 moving average types to choose from. See details here:
Also included are 35 different source types for price input. Read more about these source types here:
The full Baseline trading system can be found here:
v1.0 Included Moving Averages
Adaptive Moving Average - AMA
ADXvma - Average Directional Volatility Moving Average
Ahrens Moving Average
Alexander Moving Average - ALXMA
Double Exponential Moving Average - DEMA
Double Smoothed Exponential Moving Average - DSEMA
Exponential Moving Average - EMA
Fast Exponential Moving Average - FEMA
Fractal Adaptive Moving Average - FRAMA
Hull Moving Average - HMA
IE /2 - Early maout by Tim Tilson
Integral of Linear Regression Slope - ILRS
Instantaneous Trendline
Kalman Filter
Kaufman Adaptive Moving Average - KAMA
Laguerre Filter
Leader Exponential Moving Average
Linear Regression Value - LSMA ( Least Squares Moving Average )
Linear Weighted Moving Average - LWMA
McGinley Dynamic
McNicholl EMA
Non-Lag Moving Average
Parabolic Weighted Moving Average
Recursive Moving Trendline
Simple Moving Average - SMA
Sine Weighted Moving Average
Smoothed Moving Average - SMMA
Smoother
Super Smoother
T3
Three-pole Ehlers Butterworth
Three-pole Ehlers Smoother
Triangular Moving Average - TMA
Triple Exponential Moving Average - TEMA
Two-pole Ehlers Butterworth
Two-pole Ehlers smoother
Variable Index Dynamic Average - VIDYA
Volume Weighted EMA - VEMA
Zero-Lag DEMA - Zero Lag Double Exponential Moving Average
Zero-Lag Moving Average
Zero Lag TEMA - Zero Lag Triple Exponential Moving Average
Volatility Types
v1.0 Included Volatility
Average True Range (ATR)
True Range Double ( TRD )
Trading Rules
Post Baseline Cross Qualifier (PBCQ): If price crosses the baseline but the trade is invalid due to additional qualifiers, then the strategy doesn't enter a trade on that candle. This setting allows you override this disqualification in the following manner: If price crosses XX bars ago and is now qualified by other qualifiers, then the strategy enters a trade.
Volatility: If price crosses the baseline, we check to see how far it has moved in terms of multiples of volatility denoted in price (ATR x multiple). If price has moved by at least "Qualifier multiplier" and less than "Range Multiplier", then the strategy enters a trade. This range is shown on the chart with yellow area that tracks price above/blow the baseline. Also, see the dots at the top of the chart. If the dots are green, then price passes the volatility test for a long. If the dots are red, then price passes the volatility test for a short.
Additional moving averages, volatility types, qualifiers, and other advanced features will be added in future releases.
Baseline Backtest

[blackcat] L3 RMI Trading StrategyLevel 3
Background
My view of correct usage of RSI and the relationship between RMI and RSI. A proposed RMI indicator with features is introduced
Descriptions
The Relative Strength Index (RSI) is a technical indicator that many people use. Its focus indicates the strength or weakness of a stock. In the traditional usage of this point, when the RSI is above 50, it is strong, otherwise it is weak. Above 80 is overbought, below 20 is oversold. This is what the textbook says. However, if you follow the principles in this textbook and enter the actual trading, you would lose a lot and win a little! What is the reason for this? When the RSI is greater than 50, that is, a stock enters the strong zone. At this time, the emotions of market may just be brewing, and as a result, you run away and watch others win profit. On the contrary, when RSI<20, that is, a stock enters the weak zone, you buy it. At this time, the effect of losing money is spreading. You just took over the chips that were dumped by the whales. Later, you thought that you had bought at the bottom, but found that you were in half mountainside. According to this cycle, there is a high probability that a phenomenon will occur: if you sell, price will rise, and if you buy, price will fall, who have similar experiences should quickly recall whether their RSI is used in this way. Technical indicators are weapons. It can be either a tool of bull or a sharp blade of bear. Don't learn from dogma and give it away. Trading is a game of people. There is an old saying called “people’s hearts are unpredictable”. Do you really think that there is a tool that can detect the true intentions of people’s hearts 100% of the time?
For the above problems, I suggest that improvements can be made in two aspects (in other words, once the strategy is widely spread, it is only a matter of time before it fails. The market is an adaptive and complex system, as long as it can be fully utilized under the conditions that can be used, it is not easy to use. throw or evolve):
1. RSI usage is the opposite. When a stock has undergone a deep adjustment from a high level, and the RSI has fallen from a high of more than 80 to below 50, it has turned from strong to weak, and cannot be bought in the short term. But when the RSI first moved from a low to a high of 80, it just proved that the stock was in a strong zone. There are funds in the activity, put into the stock pool.
Just wait for RSI to intervene in time when it shrinks and pulls back (before it rises when the main force washes the market). It is emphasized here that the use of RSI should be combined with trading volume, rising volume, and falling volume are all healthy performances. A callback that does not break an important moving average is a confirmed buying point or a second step back on an important moving average is a more certain buying point.
2. The RSI is changed to a more stable and adjustable RMI (Relative Momentum Indicator), which is characterized by an additional momentum parameter, which can not only be very close to the RSI performance, but also adjust the momentum parameter m when the market environment changes to ensure more A good fit for a changing market.
The Relative Momentum Index (RMI) was developed by Roger Altman and described its principles in his article in the February 1993 issue of the journal Technical Analysis of Stocks and Commodities. He developed RMI based on the RSI principle. For example, RSI is calculated from the close to yesterday's close in a period of time compared to the ups and downs, while the RMI is compared from the close to the close of m days ago. Therefore, in principle, when m=1, RSI should be equal to RMI. But it is precisely because of the addition of this m parameter that the RMI result may be smoother than the RSI.
Not much more to say, the below picture: when m=1, RMI and RSI overlap, and the result is the same.
The Shanghai 50 Index is from TradingView (m=1)
The Shanghai 50 Index is from TradingView (m=3)
The Shanghai 50 Index is from TradingView (m=5)
For this indicator function, I also make a brief introduction:
1. 50 is the strength line (white), do not operate offline, pay attention online. 80 is the warning line (yellow), indicating that the stock has entered a strong area; 90 is the lightening line (orange), once it is greater than 90 and a sell K-line pattern appears, the position will be lightened; the 95 clearing line (red) means that selling is at a climax. This is seen from the daily and weekly cycles, and small cycles may not be suitable.
2. The purple band indicates that the momentum is sufficient to hold a position, and the green band indicates that the momentum is insufficient and the position is short.
3. Divide the RMI into 7, 14, and 21 cycles. When the golden fork appears in the two resonances, a golden fork will appear to prompt you to buy, and when the two periods of resonance have a dead fork, a purple fork will appear to prompt you to sell.
4. Add top-bottom divergence judgment algorithm. Top_Div red label indicates top divergence; Bot_Div green label indicates bottom divergence. These signals are only for auxiliary judgment and are not 100% accurate.
5. This indicator needs to be combined with VOL energy, K-line shape and moving average for comprehensive judgment. It is still in its infancy, and open source is published in the TradingView community. A more complete advanced version is also considered for subsequent release (because the K-line pattern recognition algorithm is still being perfected).
Remarks
Feedbacks are appreciated.

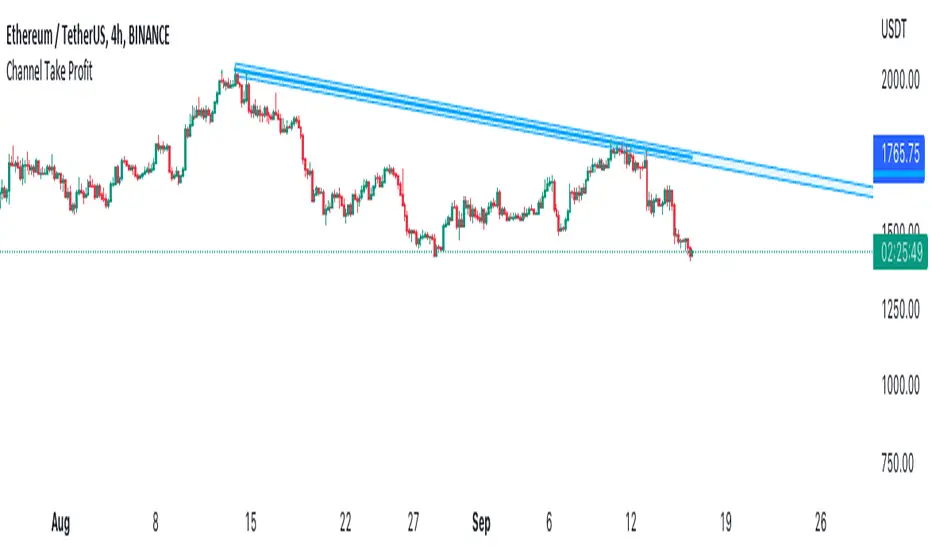
Channel Take Profit Tool for AlertatronWhat is this for
This tool is designed as a companion to an automated strategy running on Alertatron. Sometimes when a strategy opens a trade, you decide that based on TA you would like to close all or or a portion of your trade at a support or resistance level. The strategy may already be programmed to take profit but this tool allows you to add additional take profit criteria that can trigger an alert to Alertatron if it happens before the strategy closes.
How to use it
When you add the indicator to your chart, it will ask you to select two points on the chart. These two points will be connected by a line and create the parallel channel that will be used for triggering a take profit alert. The offset is how wide you want the channel to be. When the high or low of a candle enters the channel from either direction, the alert will be fired. AFTER you add the indicator to the chart and configure ALL of the settings, you need to create an alert on the indicator for "All Alert Functions" and paste your incoming alert webhook from Alertatron into the webhook input.
Alertatron Setup
You will need to provide the API name that you have configured in Alertatron that matches the account the trade is open in. This tool supports ByBit and FTX.us by may work with other exchanges too (this option just chooses which currency/pair divider is used in the alert message).
J-AutomationJust a simple automation for FX trading.
This strategy goes long if the MACD histogram and the MACD momentum are both above zero and the fast MACD moving average is above the slow MACD moving average. As additional long filter the recent price has to be above the SMA 200. If the inverse logic is true, the strategy goes short.
Unicorn X-AlgoUnicorn X-Algo is a multifunctional trading indicator. It is designed to help traders make real-time decisions using quantitative models.
Its core is a trend trading strategy based on our enhanced Trailing Stop-Loss algorithm. This strategy provides the user with position entry and exit signals. It is customizable and has a built-in instant backtesting feature.
For those who have difficulty with finding the good settings the indicator has the Automatic Mode. In this mode, there is no need for the user to adjust any settings. The indicator calculates optimized trading signals automatically.
In addition, the indicator provides a number of useful tools that aim to provide additional confirmation to the trading signals. They include: support and resistance levels forecast, price range prediction and institutional activity detection.
The script can send real-time alerts to the user’s Email and to the cell phone via notifications in the TradingView app.
The indicator can be used for various types of trend and swing trading, including positional trading, day trading and scalping.
Unicorn X-Algo allows users to:
forecast direction of trends with BUY and SELL signals;
determine the right time to close a position;
detect institutional activity in the market;
forecast key support and resistance levels;
predict the future price range for any market;
customize any settings and do a backtest with one click;
see historical trades on the chart;
use the fully Automatic Mode where the algorithm optimizes all its settings itself.
When using this script, keep in mind that past results do not necessarily reflect future results and that many factors influence trading results.
FEATURES
Trading signals
The feature calculates trend or swing entry and exit signals. The underlying strategy does not use fixed Take-Profit levels. It trails the price with a Trailing Stop-Loss to get as many pips as possible from price movements.
The feature is based on our custom Volatility Stop algorithm. It uses linear regressions instead of averaging. As our practice shows, this helps to reduce signal lag while keeping the number of false signals low.
Trading signals are customizable with Sensitivity and Trade Length parameters which determine the trading signals frequency and width of the Trailing-Stop levels, respectively.
Automatic Mode
The Trading Signals function has an automatic mode. When it is turned on, you do not need to adjust the trading signals settings. The algorithm tries to calculate the best settings automatically using an optimization algorithm.
In this mode, Buy and Sell signals are displayed as green and red triangles respectively. There are two types of exit signals displayed as circles and crosses. A circle signal means that a price reversal is expected and you can partially close the position. A cross signal means that a trading signal in the opposite direction is expected soon and you can partially or completely close your position.
Support and Resistance Levels
Support/Resistance levels forecasting model. The forecasted levels are non-repainting. Once calculated for a specified period in the future (day, week, month, etc.), they don't change during this period.
The feature allows the trader to plan trades and use the forecasted levels as entry levels and targets for opening and closing positions. Both intraday and higher timeframes are supported.
The forecasting model analyses the distribution of the price time series to find clusters in the data. These clusters are then used to make the key price levels forecast.
Big Money Activity detection
The Big Money Activity tool identifies areas on the price chart associated with instructional traders' activity in the market.
Institutional activity in a trending market can be a leading signal for upcoming reversal. Institutions could be fixing their profit, causing the price to move against the current trend.
Institutional activity in a sideways market can be due to positions accumulation and signal a new trend formation.
The algorithm uses tick volume, volume, and volatility data to forecast activity of institutional investors. The method develops the idea described in the Daigler & Wiley (2015) and Shalen (1993) works. It says that when institutional traders actively open or close their positions in the market, a divergence between volume and volatility time-series arises. It can be due to their use of position-splitting algorithms that reduce the impact of their positions on the market.
Trading Range Forecast
Trading Range Forecast feature predicts the price range of an asset for a selected period of time in the future, called Forecast Horizon. It can be the next day or 12-hour trading session. This function works if your chart timeframe is intraday (i.e. the timeframe below "D"). It shows the upper and lower bounds between which the price is going to stay in the upcoming Forecast Horizon period.
Instant Backtesting
After changing any settings, you can immediately see the performance of the strategy on the Instant Backtesting panel. Two metrics are displayed there - the percentage of profitable trades and the total return. This information, as well as the historical trades shown on the chart, will help you quickly and easily evaluate any settings you make.
SETTINGS
TRADING SIGNALS
Trade Length - defines the length of the trades the algorithm tries to make. Recommended values are from 1.0 to 6.0.
Sensitivity - controls the sensitivity of the trading signals algorithm. The sensitivity determines the density of trading signals and how close the trailing-stop levels follow the price. The higher the value of this parameter is, the less sensitive the algorithm is. High values of the Sensitivity parameters (100-500) can help to withstand large price swings to stay in longer price moves. Lower values (10-100) work well for short- and medium-term trades.
TRADING TOOLS
Big Money Activity - turns on and off the identification of the areas associated with institutional traders activity.
SUPPORТ AND RESISTANCЕ LEVELS
Show Support And Resistance Levels - turns on and off support and resistance levels calculation.
TRADING RANGE FORECAST
Show Trading Range Forecast - turns on/off trading range forecasting
Forecast Horizon - sets the period for which the trading range forecast is made
Forecasting Method - allows to choose a forecasting algorithm for the trading range forecast.
BACKTESTING
Use Starting Date - turns on/off the starting date for the strategy and backtests. When off, all available historical data is used.
Starting Date - sets the starting date for the strategy and backtests.
Show Instant Backtesting Dashboard - turns on/off a dashboard that shows the current strategy performance: the percentage of profitable trades and total return.
Leverage - sets the leverage that the strategy uses.

Unicorn QuantDeeply customizable trading algorithm with instant backtesting. It emulates real trading and displays all the actions it takes on the chart. For example, it shows when to enter or partially close a position, move Stop-Loss to breakeven, etc. The user can replicate these actions in their trading terminal in real time. The algorithm uses up to three Take-Profit levels, and a Stop-Loss level that can move in a trade to protect the floating profit.
The script can send real-time alerts to the user’s Email and to the cell phone via notifications in the TradingView app.
The indicator is designed to be used on all timeframes, including lower ones for intraday trading and scalping.
HOW TO USE
Set the Stop-Loss and up to three Take-Profit levels. Choose the rules for moving the Stop-Loss level in a trade. Adjust the sensitivity of the trading signals. And check the backtest result in the Instant Backtesting dashboard. If the performance of the strategy satisfies you, proceed with the forward testing or live trading.
When using this script, please, keep in mind that past results do not necessarily reflect future results and there are many factors that influence trading results.
FEATURES
Trading Signals
The feature calculates Buy and Sell signals for trend or swing trading. The user can change the Sensitivity parameter to control the frequency of the signals. This allows them to be adjusted for different markets and timeframes.
Position Manager
To make the Position Manager setup as easy as possible, the algorithm calculates Stop-Loss and Take-Profit levels in Average True Range (ATR) units. They are self-adjusting for any market and timeframe, since they account for its average volatility .
You don't have to worry about what market you are trading - Forex, Stocks, Crypto, etc. With the self-adjusting Stop-Loss and Take-Profit, you can find settings that work for one market and use the same numerical values as a starting point for a completely different market.
Instant Backtesting
After changing any settings, you can immediately see the performance of the strategy on the Instant Backtesting panel. Two metrics are displayed there - the percentage of profitable trades and the total return. This information, as well as the historical trades shown on the chart, will help you quickly and easily evaluate the settings.
SETTINGS
TRADING SIGNALS
Sensitivity - controls the sensitivity of the trading signals algorithm. It determines the frequency of the trading signals. The higher the value of this parameter, the less trading signals you get and the longer trends the algorithm tries to catch. The lower the sensitivity value, the more signals you receive. This can be useful if you want to profit from small price movements.
POSITION MANAGER
SL - sets the Stop-Loss level measured in ATR units.
TP1, TP2, TP3 - set the Take-Profit levels measured in the ATR units.
Close % at TP1, Close % at TP2, Close % at TP3 - set portions of the open position (as a percentage of the initial order size) to close at each of the TP levels.
At TP1 move SL to, At TP2 move SL to - set the rules for moving the Stop-Loss level in an open trade to protect the floating profit.
Show Open Position Dashboard - turns on/off a dashboard that shows the current Stop-Loss and Take-Profit levels for the open position.
BACKTESTING
Use Starting Date - turns on/off the starting date for the strategy and backtests. When off, all available historical data is used.
Starting Date - sets the starting date for the strategy and backtests.
Show Instant Backtesting Dashboard - turns on/off a dashboard that shows the current strategy performance: the percentage of profitable trades and total return.
Leverage - sets the leverage that the strategy uses.

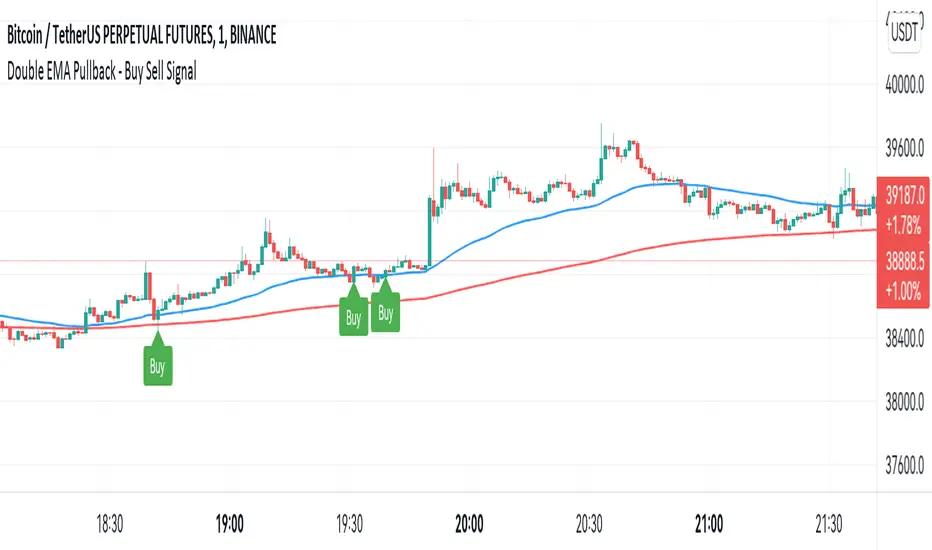
2 EMA PullbackHi everyone!
CAUTION... This is only an indicator. Do not rely 100% on it.
I made this indicator hoping to help everyone with this specific Pull Back Scalping Strategy.
RULES:
Time Chart of 5minuts
Long Condition - "EMA Red Line" below the "EMA Blue Line" and wait for a green long signal.
Short Condition - "EMA Red Line" below the "EMA Blue Line" and wait for a red short signal
Feel free to add any adjustments or give feedback so we can improve.
The strategy idea and guidelines came from the "Master Juan Luis"
Autor: © Germangroa
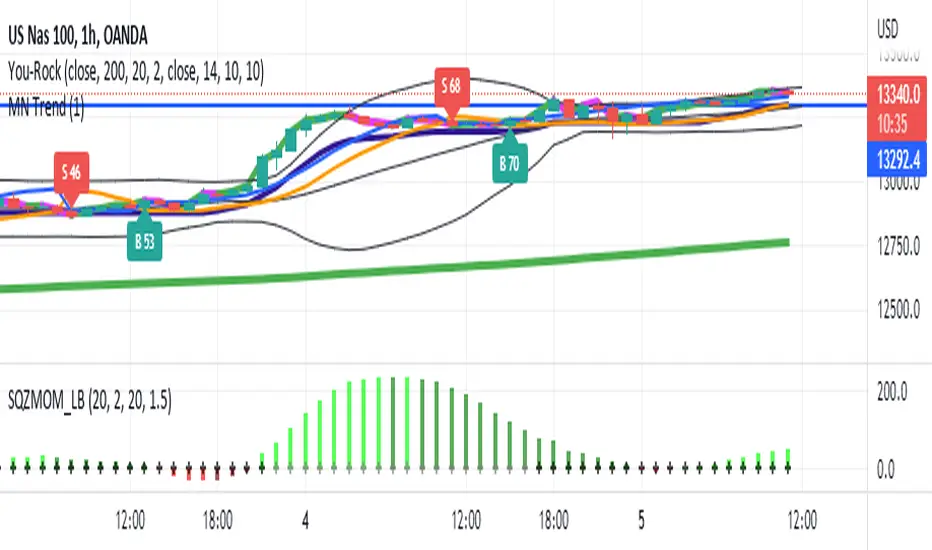
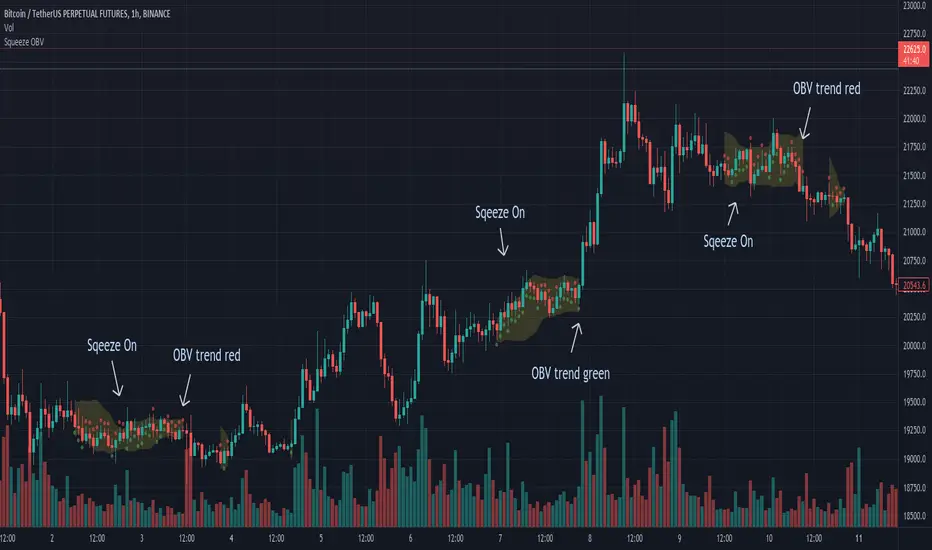
Squeeze OBVThe concept comes from "TTM Squeeze", this indicator visualizes the squeeze on the price movement.
Yellow band overlay on the candles shows that entered a squeeze on with low volatility, market preparing itself for an large move (up or down).
Dots of OBV change every bar, green means potential up, red is the opposite.
Prepare a breakout order with the direction of OBV.
If potential up, the strategy is a breakout order above the squeezed Bollinger Band and the stop loss is below the Bollinger Band.
It's a pity that it cannot write breakout order strategy in Tradingview.
My experience that use CVD instead of OBV will have better performance, but it needs the historical evolution of the order book.
----
概念來自於 "TTM Squeeze",將擠壓的過程視覺化在價格走勢上。
k線上的黃色帶覆蓋表明進入了低波動性的擠壓,市場為大幅波動(向上或向下)做準備。
OBV 的點每根bar都會變化,綠色表示可能向上,紅色則相反。
搭配 OBV 可以判斷走勢,使用突破單策略能夠有效獲利,
假設可能向上,突破單在擠壓布林帶上方,止損在布林帶下方。
可惜 Tradingview 無法寫突破單策略回測。
經驗上搭配 CVD 更有效,需要交易所訂單簿的歷史紀錄,故 Tradingview 也無法製作 CVD。
Diversified Investment EMA Cross Strategy SimulatorThis simulating indicator proves that even if you use a simple strategy, you can reduce your risk by diversifying your investments.
The strategy itself is simple.(only long)
Buy when 50 days EMA crosses over 200 days EMA.
Sell when 50 days EMA crosses under 200 days EMA.
Or, stop loss when the asset falls by 2% (eg).
Using this simple strategy on an asset is just a test of your luck.
However, this capital change graph shows that risk can be reduced by diversifying investment into eight assets rather than one asset.
Options
Total Assets Capital Change represents the sum of capital changes for 8 assets. The gray line is the initial capital.
Each Asset Capital Change represents all eight asset capital changes. In this case, the gray line is displayed as the initial capital divided by 8.
The rest of the options show a graph of capital change for each asset, showing when buys and sells occurred.
And set the start date, initial capital, stop loss %, and commission.
And select the 8 assets you want to invest in and you are ready to go. To effectively reduce risk, uncoupled assets would be better if possible.
The table in the lower right shows the selected asset and color.
Please enjoy the simulation.

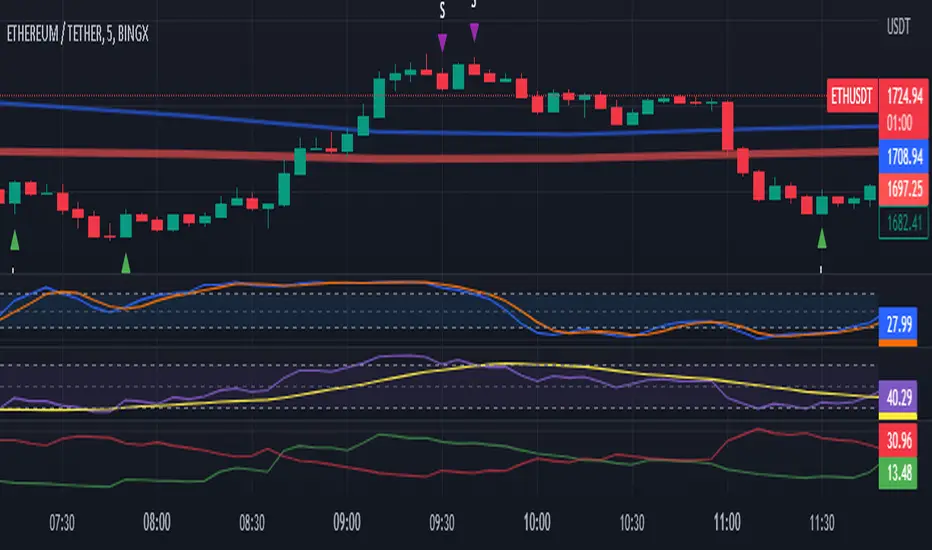
Cipher Twister - Long and ShortINTRO / NOTES:
This script is based on Market Cipher B Oscillator by Falcon
The difference in this script is that only the useful points are printed on the indicator, namely Long and Short Trade Execution signals to be used by a bot, namely the PT Bot.
The script also differs from the original that it has been upgraded to Pinescript v4
This oscillator can be used with ALL time frames, but generally works the best on 15 minute and 1 hour charts on ANY market, no matter, stock, forex, crypto, spot, futures, derivatives, Nasdaq etc...
DEFINITIONS:
This oscillator forms the foundation of Buy and Exit of Long and Short Trades.
There are 2 'Red' Lines at the top of the channel and 2 Green Lines at the bottom of the channel.
These two channels are set at default to be +53 / -53 and +60 / -60 respectively. These two lines will serve as the threshold point if one is to make cautious trades only.
There is a center line which divides the Oscillator into two parts. Above the center line, the market is in over bought territory and Below the center line is in over sold territory.
'Red' dots are drawn by the indicator to represent a potential Short (or a signal to exit from a Long position)
'Green' dots are drawn by the indicator to represent a potential Long (or a signal to exit from a Short position)
The 'Red' and 'Green' dots are draw when a Cross between both wt1 & wt2 cross, thus providing a fantastic indication of potential trend reversal and entry/exit of a position.
STRATEGY NOTES:
The strategy to use this indicator with for realistic and proper results would be to use it with an automated Trading Bot such as Profit Trailer (PT-BOT)
You could use this strategy manually, however it would mean you would need to sit in front of the screen all day and night long and activate the trades immediately after the 'red'/'green' dots are drawn. Usually this will result in non-optimal entries and exits as well as loss on various instances when a 'red' and 'green' dot are printed close together (which is usually when the market goes into correction/consolidation) and slow entries/exits will result in a loss rather than a small profit or exit at BE (Break Even)
ACTUAL STRATEGY (For use with automated bot)
To be used in conjunction with Heikin Ashi Candles for added cautionary measures
For LONGs ONLY
--------------------
1/ When 'Green' dot is drawn, ACTIVATE Long Position
(Use 1.5% Risk Management for each trade)
(Use Lot size based on 1.5% risk management and xLeverage (if any))
2/ Make sure bot Opens an SL (Stop Loss) value based on 1.5% Risk Management
3/ When 'Red' dot is drawn, CLOSE Long Position.
*If you want to add extra caution to your trade, only activate the trade if the 'Green' dot is BELOW the 'Green' Markers
*For added caution, use color coded Heikin Ashi candles to 'confirm' Activation and Closing of a trade in the bot configuration
---------------------------------------------------------------------------------------------------
For SHORTs ONLY
--------------------
1/ When 'Red' dot is drawn, ACTIVATE Short Position
(Use 1.5% Risk Management for each trade)
(Use Lot size based on 1.5% risk management and xLeverage (if any))
2/ Make sure bot Opens an SL (Stop Loss) value based on 1.5% Risk Management
3/ When 'Green' dot is drawn, CLOSE Short Position
*If you want to add extra caution to your trade, only activate the trade if the 'Red' dot is Above the Red Markers
*For added caution, use color coded Heikin Ashi candles to 'confirm' Activation and Closing of a trade in the bot configuration
---------------------------------------------------------------------------------------------------
Supplementary Notes:
Make sure that your bot configuration will only activate ONE TRADE when the 'Green'/'Red' dot appears.
Occasionally during high volatility , 'red'/'green' dots will appear intermittently before remaining drawn, thus the oscillator 'redraws' the dots during market movement.
There will be times where occasionally a 'green' dot or a 'red' dot will appear, the trade will be opened, but the trade will fail due to the market manipulation (algorithm/market maker bots/fake volume etc), to wipe out those trading on derivatives and futures markets using leverage. Do not worry about this, no bot can make 100% wins, no strategy will achieve 100% win ratio and one necessarily doesn't need a high win ratio when using strict money management practices with your trading for SL and lot size.
If you use this method, you will see great results, but again I must stress, using this method with a fully automated bot is the only way to achieve proper results.

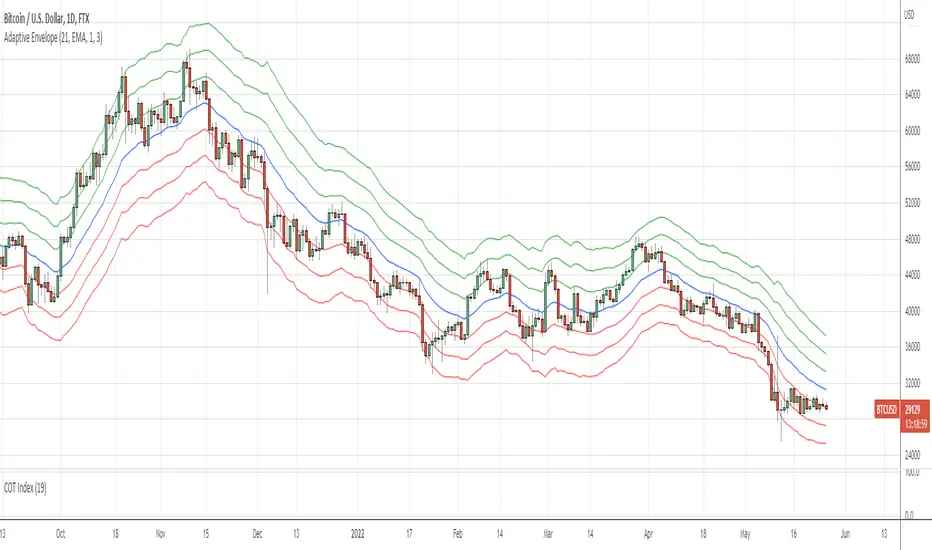
Adaptive EnvelopeI bring to your attention a dynamic indicator Adaptive Envelope .
The main qualitative characteristic of the technical indicator is adaptability. This means that it does not need to be adjusted for each tool. The adaptive envelope itself dynamically adjusts to the volatility of each individual instrument, or even timeframe.
And thanks to a wide range of settings, the indicator can be adjusted to your needs. Let's consider an example of the use of the indicator in trading.
Option #1. The envelope shows the "stretch" of the market - that is, the price of the asset beyond normal volatility. And it is at such moments that the probability of returning to the average is highest. That is, for such a signal, we wait for the exit to the moving average, and when returning with a stop order, we enter the averaging direction.
Option #2. Another option for trading is to buy at the lower level, as well as additional purchases along the lines of the envelope. Exit - on the middle line of the envelope (for shorts on the contrary) - so we have a full adaptability of the strategy. I repeat that due to adaptability, there will be no need to reconfigure when changing market characteristics.
Thank you for attention. Sincerely, Oleksandr Yanchak. Capitalizator.UA
TWAP + MA crossover Study [Dynamic Signal Lab]Dear TV'ers,
Hereby the study for the TWAP/moving average crossover, with taking profit options.
moving averages include: EMA , WMA , DEMA , TEMA , VAR, WWMA, ZLEMA , TSF , HULL, TILL
It is also possible to gradually take profit, using:
* minimum consecutive green/red candles
* minimum amount of green/red candles in the last 2-8 candles
* both of the above criteria
The slightly transparent green fill shows how much you are in profit from your entry point
The current default properties should be modified to make this strategy cost-effective, but typically 15 minutes and higher timeframes (up to 6hr) seem to work well for larger (top10 cap) crypto projects. Don't use this script for small-caps as it will get you rekt, due to wild volatility.
Additionally, you'll also be able to continuously take profit, making sure you lock in all those sweet profits. For backtesting: use the strategy version of this script

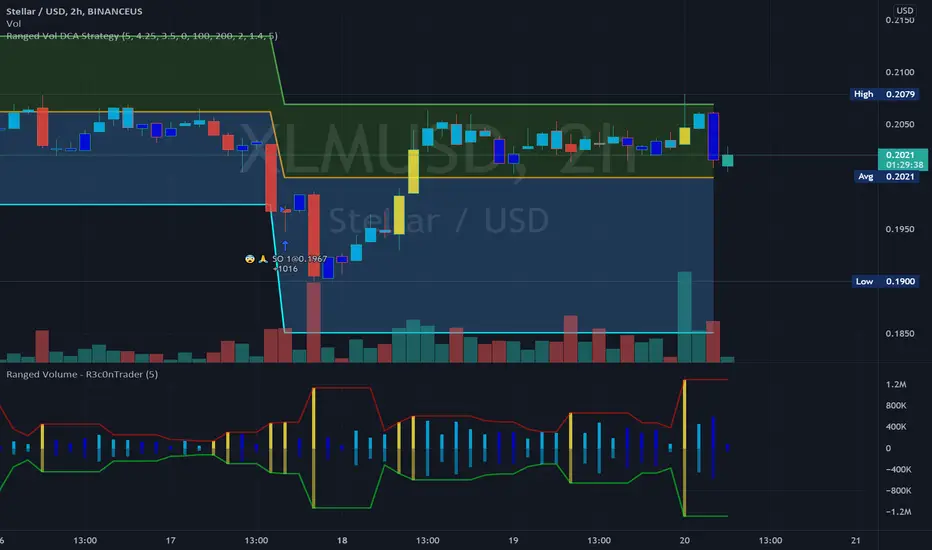
Ranged Volume Study - R3c0nTraderCredits:
Thank you "EvoCrypto" for granting me permission to use "Ranged Volume" to create this version of it.
What is this and What does this do?
This study shows the ranged volume, and it can be used to produce buy signals for a 3Commas bot.
What’s different about this script?
I added code so that negative volume has its own color settings and lower opacity than the positive volume.
I changed the color scheme from Yellow, Red, Green, and Black to Yellow, Red, Light Blue, and Dark Blue.
How to Use
1. On the “Inputs” tab:
a. Set your “Volume Range Length” (number of bars to look back)
b. “Heikin Ashi” – Usually I leave this enabled. Make sure this matches what you have in your strategy!
c. “Show Bar Colors” – Leave disabled. Let the Strategy script color the bars in the price chart.
d. “Show Break-Out” – Leave enabled. Highlights the volume breakout in yellow and breakdowns in red.
e. “Show Range” – Leave enabled
Inflation Rate of ChangeInflation and the Fed interest rate impacts all corners of the economy. Today I am releasing to the community an indicator that measures the rate of change of inflation with historical data back to ~1950. I built this to study the historical market impacts of inflation and changes to the Fed rate (see separate indicator I published for Fed Funds Rate here ).
What this indicator does:
This indicator pulls in Consumer Price Index data and applies a rate of change formula to it. The output is measured as a percentage. I.e. 7 would mean a 7% rate of change over the look-back period.
Options in the indicator:
You can change the amount of bars back it uses to calculate rate of change. By default it is set to 253, which would be looking 1 year back on a normal stock market day chart. If you are on a month chart, you would input 12 there to look 1 year back, etc.
There are also different versions of the CPI that you can select with a drop-down input to pull in different inflation measures:
FRED:CPIAUCSL = Urban Consumers, All Items (this is the default data it pulls, and is a common way to measure inflation)
FRED:CPIUFDNS = Food
FRED:CPIHOSNS = Housing
FRED:CPIENGSL = Energy
Disclaimer: Open-source scripts I publish in the community are largely meant to spark ideas that can be used as building blocks for part of a more robust trade management strategy. If you would like to implement a version of any script, I would recommend making significant additions/modifications to the strategy & risk management functions. If you don’t know how to program in Pine, then hire a Pine-coder. We can help!
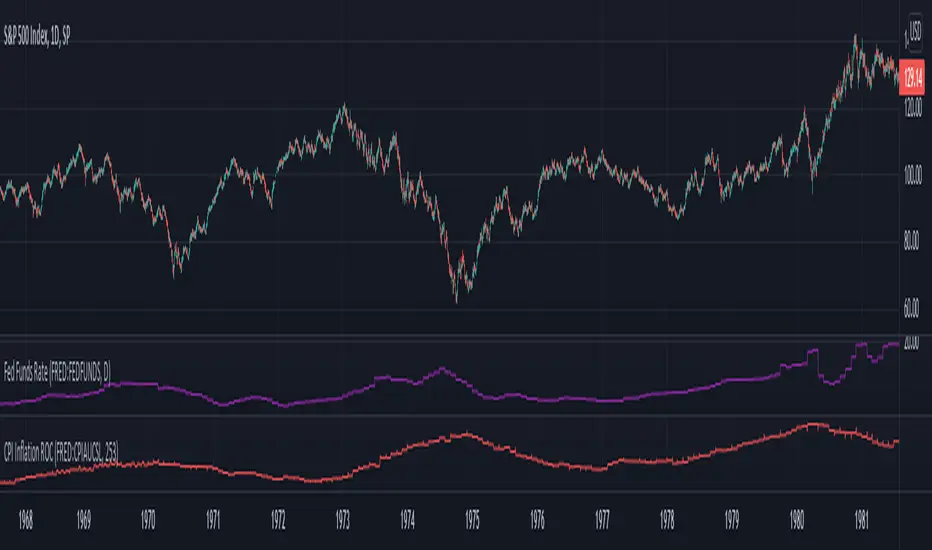
Fed Funds Rate IndicatorWith the current level of inflation and the Fed outlook on interest rates, it inspired some studying on the relationship between Fed rate increases and stock market performance over periods of inflation. Today I am releasing to the community an indicator that will show you the Fed Funds Rate historically. You can add it to any chart or index to study the impact of Fed Funds Rate changes.
There are 2 options for the indicator data source you can select in the indicator settings. FRED:EFFR data updates daily but only goes back ~20 years. FRED:FEDFUNDS data only updates monthly but goes back to 1947.
Disclaimer: Open-source scripts I publish in the community are largely meant to spark ideas that can be used as building blocks for part of a more robust trade management strategy. If you would like to implement a version of any script, I would recommend making significant additions/modifications to the strategy & risk management functions. If you don’t know how to program in Pine, then hire a Pine-coder. We can help!

Backtesting- IndicatorFor anyone interested, Here is an example of how to put backtesting results into an Indicator. This calculates the same values as you find in the Summary Screen of the built in Strategy backtester. This will use the same result size as the standard backtester i.e. 5 minute chart grabs roughly 1 month of data, 1 minute chart grabs 1 week of data, etc... I tried to keep this as self-contained as possible so I put most of the code for the results in the bottom of the Indicator. The results stop at the last completed trade signal i.e. a Buy has a Sell to it. This is the same indicator I posted earlier with the PCT Trailing StopLoss so you will see that code in here as well. As said in my previous posting, the indicator is just a simple EMA crossover to give it something to do and I would not recommend using this indicator on its own, but instead copy the code to your own indicator if you find it useful. I also left the code in so that you can switch back to a Strategy if you want to verify the results.
Additional Notes:
- The results are within an acceptable margin of error due to the fact that the Indicator is having to calculate based on when the Buy and Sell Signal occur as opposed to when actual trades occur like in the Strategy Backtester
- I was trying to find a way to set the number of Buy Signals to use i.e. show me the results from the past 100 trades but couldn't sort out the logic. I am open to suggestions. Also keep in mind I am not a coder by profession so if you have any ideas on that front, please explain it to me as though I am a 5 year old child and provide code examples if possible :)
- I included the Strategy results in the Screen Shots so that you can see where the results line up.
Additional Additional Note:
This is not financial advice. Use at your own risk.

Double EMA WIth Pullback Buy Sell Signal - Smarter AlgoBuilt with love "Double EMA With Pullback Buy Sell Signal "
This indiator will help you to find a Double EMA Pullback Signal
You can combine with your own strategy, or use this purely
DISCLAIMER :
Measure the risk first before use it in real market
Backtest The Strategy was very important, so you know the probability
Fundamentally Logical :
Pullback (Some Previous candle is Red for Bull Pullback vice versa)
the Entry candle must be a Candlestick Pattern
Features :
1. Double EMA
2. Pullback Signal
How to use it :
1. Adjust the Pullback Backstep
2. Adjust the EMA Period
3. Adjust the Style to your preferences
Regards,
Hanabil
Smarter Pullback + Candlestick Pattern (Steven Hart)Built with love "Smarter Pullback + Candlestick Pattern"
This indiator will help you to find a Pullback + Candlestick Pattern, inspirated by Steven Hart
You can combine with your own strategy, or use this purely
DISCLAIMER :
Measure the risk first before use it in real market
Backtest The Strategy was very important, so you know the probability
Fundamentally Logical :
Pullback (Some Previous candle is Red for Bull Pullback vice versa)
the Entry candle must be a Candlestick Pattern
Features :
1. Engulfing
2. Hammer & Shooting Star
3. Doji
How to use it :
1. Adjust the Pullback Period
2. Check and Uncheck the Pattern you want to see
3. Adjust the style to your favourite
Regards,
Hanabil

Smarter SNR (Support and Ressistance, Trendline, MTF OSC)Built with love "Smarter SNR (Support and Ressistance, Trendline, MTF OSC) "
This indiator will show you Support & Ressistance, Good Trendline, and Multi-timeframe analyzing of Oscillator (Stochastic and RSI)
You can combine with your own strategy, or use this purely
DISCLAIMER :
Measure the risk first before use it in real market
Backtest The Strategy was very important, so you know the probability
Fundamentally Logical :
SNR -> Last 3 Zigzag Pivot
Trendline -> Using two last pivot for calculating the slope
Features :
1. SNR
2. Trendline
3. MTF Oscillator Analyzing
How to use it :
1. All Label, Table & Line can be turned on/off in settings
2. Pivot Period can be Adjusted in settings
3. All Label, Table & Line style can be adjusted in settings
Regards,
Hanabil
