TradingIQ - Counter Strike IQIntroducing "Counter Strike IQ" by TradingIQ
Counter Strike IQ is an exclusive trading algorithm developed by TradingIQ, designed to trade upside/downside breakouts of varying significance. By integrating artificial intelligence and IQ Technology, Counter Strike IQ analyzes historical and real-time price data to construct a dynamic trading system adaptable to various asset and timeframe combinations.
Philosophy of Counter Strike IQ
Counter Strike IQ operates on a single premise: Support and resistance levels cannot hold forever. At some point either side must break for the underlying asset to exhibit trends; otherwise, prices would be confined to an infinitely narrowing range.
Counter Strike IQ is designed to work straight out of the box. In fact, its simplicity requires just four user settings to manage output, making it incredibly straightforward to manage.
Minimum ATR Profit, Minimum ATR Stop, EMA Filter and EMA Filter Length are the only settings that manage the performance of Counter Strike IQ!
Traders don’t have to spend hours adjusting settings and trying to find what works best - Counter Strike IQ handles this on its own.
Key Features of Counter Strike IQ
Self-Learning Breakout Detection
Employs AI and IQ Technology to identify notable breakouts in real-time.
AI-Generated Trading Signals
Provides breakout trading signals derived from self-learning algorithms.
Comprehensive Trading System
Offers clear entry and exit labels.
Performance Tracking
Records and presents trading performance data, easily accessible for user analysis.
Self-Learning Trading Exits
Counter Strike IQ learns where to exit positions.
Long and Short Trading Capabilities
Supports both long and short positions to trade various market conditions.
Strike Channel
The Strike Channel represents what Counter Strike IQ considers a tradable long opportunity or a tradable short opportunity. The Strike Channel is dynamic and adjusts from chart to chart.
IQ Graph Gradient
Introduces the IQ Graph Gradient, designed to classify extreme values in price on a grand scale.
How It Works
Counter Strike IQ operates on a straightforward heuristic: go long during significant upside price moves that break established resistance levels and go short during significant downside price moves that break established support levels.
IQ Technology, TradingIQ's proprietary AI algorithm, defines what constitutes a “significant price move” and what’s considered a tradable breakout. For Counter Strike IQ, this algorithm evaluates all historical support/resistance breaks and any subsequent breakouts. For instance, the price move following up to a breakout is measured and learned from, including the significance of the identified support/resistance level (how long it’s been active, how far price moved away from it, etc). By analyzing these patterns, Counter Strike IQ adapts to identify and trade similar future breakout sequences.
In simple terms, Counter Strike IQ learns from violations of historical support/resistance levels to identify potential entry points at currently established support/resistance levels. Using this knowledge, it determines the optimal, current support/resistance price level where a breakout has a higher chance of occurring.
For long positions, Counter Strike IQ places a stop-market order at the AI-identified resistance point. If price violates this level a market order will be placed and a long position entered. Of course, this is how the algorithm trades, users can elect to use a stop-limit order amongst other order types for position entry. After the position is entered TP1 is placed (identifiable on the price chart). TP1 has a twofold purpose:
Acts as a legitimate profit target to exit 50% of the position.
Once TP1 is closed over, the initial stop loss is converted to a trailing stop, and the long position remains active so long as price continues to uptrend.
For short positions, Counter Strike IQ places a stop-market order at the AI-identified support point. If price violates this level a market order will be placed and a short position entered. Again, this is how the algorithm trades, users can elect to use a stop-limit order amongst other order types for position entry. Upon entry TP1 is placed (identifiable on the price chart). TP1 has a twofold purpose:
Acts as a legitimate profit target to exit 50% of the position.
Once TP1 is closed over, the initial stop loss is converted to a trailing stop, and the short position remains active so long as price continues to downtrend.
As a trading system, Counter Strike IQ exits TP1 using a limit order, with all stop losses exited as stop market orders.
What Classifies As a Tradable Upside Breakout or Tradable Downside Breakout?
For Counter Strike IQ, tradable price breakouts are not manually set but are instead learned by the system. What qualifies as a significant upside or downside breakout in one market might not hold the same significance in another. Counter Strike IQ continuously analyzes historical and current support/resistance levels, how far price has extended from those levels, the raw-dollar price move leading up to a violation of those levels, their longevity, and more, to determine which future levels have a higher chance of breaking out when retested!
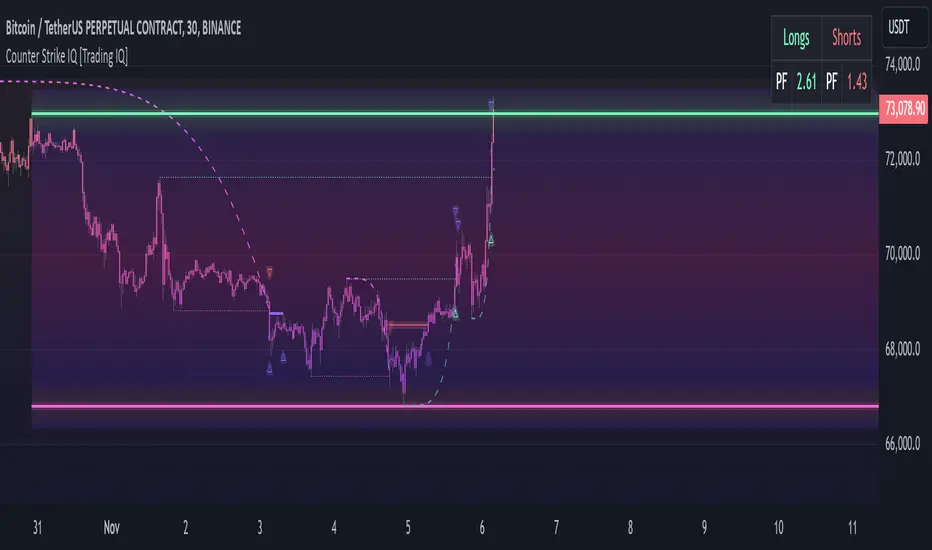
The image above illustrates the Strike Channel and explains the corresponding prices and levels
The green upper line represents the Long Breakout Point.
The pink lower line represents the Short Breakout Point.
Any price between the two deviation points is considered “Acceptable”.
The image above shows a long position being entered after the Upside Breakout Point was reached.
Green arrows indicate that the strategy entered a long position at the highlighted price level.
Blue arrows indicate that the strategy exited a position, whether at TP1, the initial stop loss, or at the trailing stop.
Blue lines indicate the TP1 level for the current trade. Red lines indicate the initial stop loss price.
If price closes above TP1, the initial stop loss will be replaced with a trailing stop. A blue line (similar to the blue line shown for TP1) will trail price and correspond to the trailing stop price of the trade.
The image above shows the trailing stop price, represented by a blue line, used for the long position!
You can also hover over the trade labels to get more information about the trade—such as the entry price and exit price.
The image above shows a short position being entered after the Downside Breakout Point was reached.
Red arrows indicate that the strategy entered a short position at the highlighted price level.
Blue arrows indicate that the strategy exited a position, whether at TP1, the initial stop loss, or at the trailing stop.
Blue lines indicate the TP1 level for the current trade. Red lines indicate the initial stop loss price.
If price closes below TP1, the initial stop loss will be replaced with a trailing stop. A blue line (similar to the blue line shown for TP1) will trail price and correspond to the trailing stop price of the trade.
The image above shows the trailing stop price, represented by a blue line, used for the short position!
You can also hover over the trade labels to get more information about the trade—such as the entry price and exit price.
IQ Gradient Graph
The IQ Gradient Graph provides a macro characterization of extreme prices.
The lower macro extremity of the IQ Gradient Graph is colored green, while the upper macro extremity is colored red.
Minimum Profit Target And Stop Loss
The Minimum ATR Profit Target and Minimum ATR Stop Loss setting control the minimum allowed profit target and stop loss distance. On most timeframes users won’t have to alter these settings; however, on very-low timeframes such as the 1-minute chart, users can increase these values so gross profits exceed commission.
After changing either setting, Counter Strike IQ will retrain on historical data - accounting for the newly defined minimum profit target or stop loss.
AI Direction
The AI Direction setting controls the trade direction Counter Strike IQ is allowed to take.
“Trade Longs” allows for long trades.
“Trade Shorts” allows for short trades.
EMA Filter
The EMA Filter setting controls whether the AI should implement an EMA trading filter. Simply, if the EMA Filter is active, long trades can only initiate if price is trading above the user-defined EMA. Conversely, short trades can only initiate if price is trading below the user-defined EMA.
The image above shows the EMA Filter in action!
Verifying Counter Strike IQ’s Effectiveness
Counter Strike IQ automatically tracks its performance and displays the profit factor for the long strategy and the short strategy it uses. This information can be found in the table located in the top-right corner of your chart showing.
This table shows the long strategy profit factor and the short strategy profit factor.
The image above shows the long strategy profit factor and the short strategy profit factor for Counter Strike IQ.
A profit factor greater than 1 indicates a strategy profitably traded historical price data.
A profit factor less than 1 indicates a strategy unprofitably traded historical price data.
A profit factor equal to 1 indicates a strategy did not lose or gain money when trading historical price data.
Using Counter Strike IQ
While Counter Strike IQ is a full-fledged trading system with entries and exits - manual traders can certainly make use of its on chart indications and visualizations.
The hallmark feature of Counter Strike IQ is its ability to signal a breakout near its origin point. Long entries are often signaled near the start of a large upside price move; short entries are often signaled near the start of a large downside price move.
For live analysis, the Strike Channel serves as a valuable tool for identifying breakout points.
The further price moves toward the Upside Breakout Point (green), the stronger the indication that price might breakout to the upside. Conversely, the deeper price reaches toward the Downside Breakout Point (red), the stronger the indication that price might breakout to the downside.
Of course, should buying or selling pressure stall, price may fail to breakout at the identified breakout level. This is a natural consequence of any breakout trading strategy!
With this information at hand, traders can quickly switch between charts and timeframes to identify optimized areas of interest.
ค้นหาในสคริปต์สำหรับ "the strat"
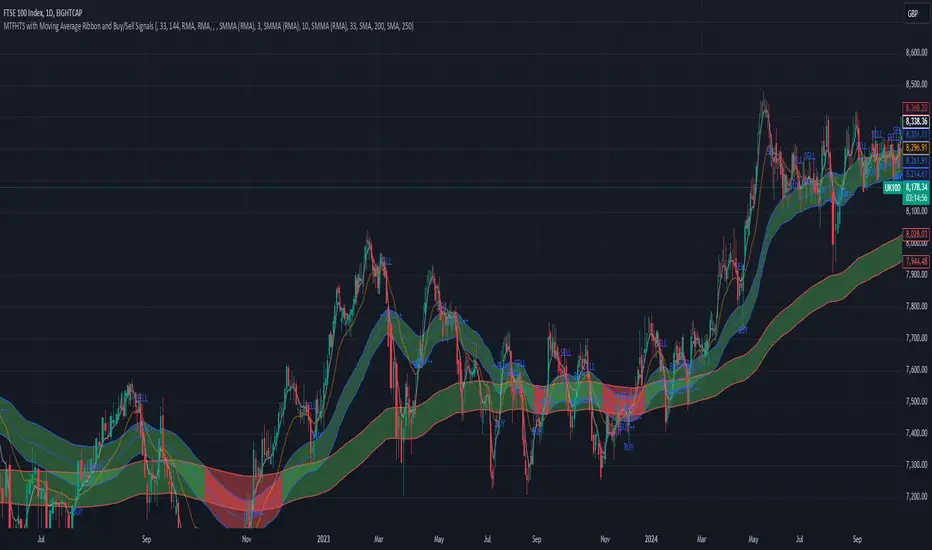
MTFHTS with Moving Average Ribbon and Buy/Sell Signals 3.2Multi-Timeframe Moving Average Strategy with Buy and Sell Signals
Purpose
This strategy is designed to provide clear, data-driven buy and sell signals based on moving average crossovers across multiple timeframes. It aims to help traders identify potential trend reversals and entry/exit points using a systematic approach.
How it Works
Moving Averages Across Multiple Timeframes:
Five customizable moving averages (MA №1 to MA №5) are calculated using different lengths and types, including SMA, EMA, WMA, and VWMA, to suit various trading styles.
The MAs are plotted on different timeframes, allowing traders to visualize trend alignment and identify market momentum across short, medium, and long terms.
Signals for Buying and Selling:
Buy Signals: When the shorter-term MA (MA №1) crosses above a longer-term MA (MA №2 or MA №3), the strategy triggers a buy signal, indicating potential upward momentum.
Sell Signals: When MA №1 crosses below a longer-term MA (MA №2 or MA №3), a sell signal is triggered, suggesting potential downward movement.
Visual Aids and Alerts:
The strategy uses color fills between MAs to indicate bullish (green) or bearish (red) trends, helping traders assess market conditions at a glance.
Alerts for buy and sell signals keep traders notified in real-time, helping to avoid missed opportunities.
Important Note
This strategy is purely educational and does not constitute investment advice. It serves as a tool to help traders understand how multi-timeframe moving averages and crossovers can be used in technical analysis. As with any trading strategy, we recommend testing in a simulated environment and exercising caution.
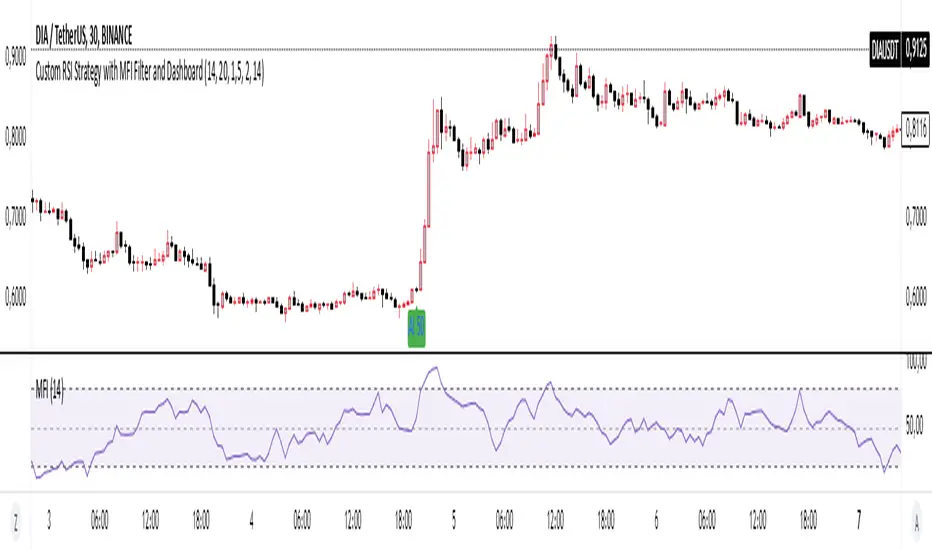
Basic RSI Strategy with MFI Description: This Pine Script is a custom trading strategy that combines the power of the RSI (Relative Strength Index) and MFI (Money Flow Index) indicators with additional signal filters and a user-friendly dashboard. The strategy is designed to identify potential entry and exit points based on dynamic conditions, providing an advanced approach to technical analysis and decision-making in trading.
Key Features:
RSI-Based Signals:
Generates buy signals when the RSI-based moving average crosses above specific thresholds (29 and 50).
Generates sell signals when the RSI-based moving average crosses below specific thresholds (50 and 69).
MFI Filtering:
Signals are validated only if the MFI value is within the specified range of 20 to 80, ensuring that signals are generated only when market conditions are favorable.
Dynamic Signal Thresholds:
The script includes adjustable thresholds for the percentage difference between consecutive bars, as well as the range between high and low prices, to refine signal accuracy.
Dashboard:
Displays real-time statistics in the top right corner of the chart, including the total number of signals, the count of buy and sell signals, and the time duration over which these signals were generated.
How to Use:
Settings: Customize the RSI and MFI lengths, along with thresholds for price movement and MFI range. This flexibility allows the strategy to be tailored to different market conditions and timeframes.
Dashboard Insight: Track the strategy's performance in real-time, with an intuitive overview of generated signals and their time distribution on the chart.
Ideal For:
This script is suitable for traders seeking a robust, customizable, and real-time signal generation strategy that combines momentum and volume indicators. The strategy’s unique filtering mechanism provides a higher level of precision, making it an excellent tool for those who prioritize signal accuracy and clarity.
Ping Pong Bot StrategyOverview:
The Ping Pong Bot Strategy is designed for traders who focus on scalping and short-term opportunities using support and resistance levels. This strategy identifies potential buy entries when the price reaches a key support area and shows bullish momentum (a green bar). It aims to capitalize on small price movements with predefined risk management and take profit levels, making it suitable for active traders looking to maximize quick trades in trending or ranging markets.
How It Works:
Support & Resistance Calculation:
The strategy dynamically identifies support and resistance levels using the lowest and highest price points over a user-defined period. These levels help pinpoint potential price reversal areas, guiding traders on where to enter or exit trades.
Buy Entry Criteria:
A buy signal is triggered when the closing price is at or below the support level, and the bar is green (i.e., the closing price is higher than the opening price). This ensures that entries are made when prices show signs of upward momentum after hitting support.
Risk Management:
For each trade, a stop loss is calculated based on a user-defined risk percentage, helping to protect against significant drawdowns. Additionally, a take profit level is set at a ratio relative to the risk, ensuring a disciplined approach to exit points.
0.5% Take Profit Target:
The strategy also includes a 0.5% quick take profit target, indicated by an orange arrow when reached. This feature helps traders lock in small gains rapidly, making it ideal for volatile market conditions.
Customizable Inputs:
Length: Adjusts the period for calculating support and resistance levels.
Risk-Reward Ratio: Allows traders to set the desired risk-to-reward ratio for each trade.
Risk Percentage: Defines the risk tolerance for stop loss calculations.
Take Profit Target: Enables the customization of the quick take profit target.
Ideal For:
Traders who prefer an active trading style and want to leverage support and resistance levels for precise entries and exits. This strategy is particularly useful in markets that experience frequent price bounces between support and resistance, allowing traders to "ping pong" between these levels for profitable trades.
Note:
This strategy is developed mainly for the 5-minute chart and has not been tested on longer time frames. Users should perform their own testing and adjustments if using it on different time frames.

Judas Swing ICT 01 [TradingFinder] New York Midnight Opening M15🔵 Introduction
The Judas Swing (ICT Judas Swing) is a trading strategy developed by Michael Huddleston, also known as Inner Circle Trader (ICT). This strategy allows traders to identify fake market moves designed by smart money to deceive retail traders.
By concentrating on market structure, price action patterns, and liquidity flows, traders can align their trades with institutional movements and avoid common pitfalls. It is particularly useful in FOREX and stock markets, helping traders identify optimal entry and exit points while minimizing risks from false breakouts.
In today's volatile markets, understanding how smart money manipulates price action across sessions such as Asia, London, and New York is essential for success. The ICT Judas Swing strategy helps traders avoid common pitfalls by focusing on key movements during the opening time and range of each session, identifying breakouts and false breakouts.
By utilizing various time frames and improving risk management, this strategy enables traders to make more informed decisions and take advantage of significant market movements.
In the Judas Swing strategy, for a bullish setup, the price first touches the high of the 15-minute range of New York midnight and then the low. After that, the price returns upward, breaks the high, and if there’s a candlestick confirmation during the pullback, a buy signal is generated.
bearish setup, the price first touches the low of the range, then the high. With the price returning downward and breaking the low, if there’s a candlestick confirmation during the pullback to the low, a sell signal is generated.
🔵 How to Use
To effectively implement the Judas Swing strategy (ICT Judas Swing) in trading, traders must first identify the price range of the 15-minute window following New York midnight. This range, consisting of highs and lows, sets the stage for the upcoming movements in the London and New York sessions.
🟣 Bullish Setup
For a bullish setup, the price first moves to touch the high of the range, then the low, before returning upward to break the high. Following this, a pullback occurs, and if a valid candlestick confirmation (such as a reversal pattern) is observed, a buy signal is generated. This confirmation could indicate the presence of smart money supporting the bullish movement.
🟣 Bearish Setup
For a bearish setup, the process is the reverse. The price first touches the low of the range, then the high. Afterward, the price moves downward again and breaks the low. A pullback follows to the broken low, and if a bearish candlestick confirmation is seen, a sell signal is generated. This confirmation signals the continuation of the downward price movement.
Using the Judas Swing strategy enables traders to avoid fake breakouts and focus on strong market confirmations. The strategy is versatile, applying to FOREX, stocks, and other financial instruments, offering optimal trading opportunities through market structure analysis and time frame synchronization.
To execute this strategy successfully, traders must combine it with effective risk management techniques such as setting appropriate stop losses and employing optimal risk-to-reward ratios. While the Judas Swing is a powerful tool for predicting price movements, traders should remember that no strategy is entirely risk-free. Proper capital management remains a critical element of long-term success.
By mastering the ICT Judas Swing strategy, traders can better identify entry and exit points and avoid common traps from fake market movements, ultimately improving their trading performance.
🔵 Setting
Opening Range : High and Low identification time range.
Extend : The time span of the dashed line.
Permit : Signal emission time range.
🔵 Conclusion
The Judas Swing strategy (ICT Judas Swing) is a powerful tool in technical analysis that helps traders identify fake moves and align their trades with institutional actions, reducing risk and enhancing their ability to capitalize on market opportunities.
By leveraging key levels such as range highs and lows, fake breakouts, and candlestick confirmations, traders can enter trades with more precision. This strategy is applicable in forex, stocks, and other financial markets and, with proper risk management, can lead to consistent trading success.

Pip hunter 1-Minute Scalping Strategy [manesisnet]NOTE: This is my first attempt to write an indicator using pine script and it's not recommended for serious trading, just use it for your own research or feel free to create your own versions based on the below.
Overview: The "1-Minute Scalping Strategy" is a custom TradingView indicator designed for short-term traders looking to capitalize on quick price movements in the 1-minute timeframe. This strategy combines moving averages and the Relative Strength Index (RSI) to generate buy and sell signals while filtering out potential false entries by confirming trends on a higher timeframe.
How It Works:
Moving Averages:
The indicator uses two Simple Moving Averages (SMAs):
A fast SMA (5-period) for short-term price movements.
A slow SMA (20-period) to identify the overall trend.
Buy signals are generated when the fast SMA crosses above the slow SMA, indicating bullish momentum.
Sell signals occur when the fast SMA crosses below the slow SMA, indicating bearish momentum.
Higher Time Frame Confirmation:
To enhance the accuracy of the signals, the strategy checks the trend on a higher timeframe (default is 5 minutes).
A buy signal is only valid if the current price is above the higher timeframe SMA, confirming that the overall trend is bullish.
A sell signal is only valid if the current price is below the higher timeframe SMA, confirming a bearish trend.
This confirmation helps avoid false breakouts and ensures that trades are aligned with the prevailing market direction.
Relative Strength Index (RSI):
The RSI is used to assess market momentum and potential reversal points.
The indicator calculates a 14-period RSI to identify overbought and oversold conditions.
For buy signals, the RSI must be below 60 (indicating the market is not overbought).
For sell signals, the RSI must be above 40 (indicating the market is not oversold).
This helps to filter out trades that might occur during extreme market conditions.
Visual Representation:
The fast SMA (5-period) is plotted in blue, the slow SMA (20-period) in red, and the higher timeframe SMA in orange.
Buy signals are indicated with a green label below the bar, while sell signals are indicated with a red label above the bar.
This visual representation allows traders to quickly identify potential entry points.
Alerts:
The script includes alert conditions for buy and sell signals, enabling traders to receive notifications when the conditions for entering trades are met.

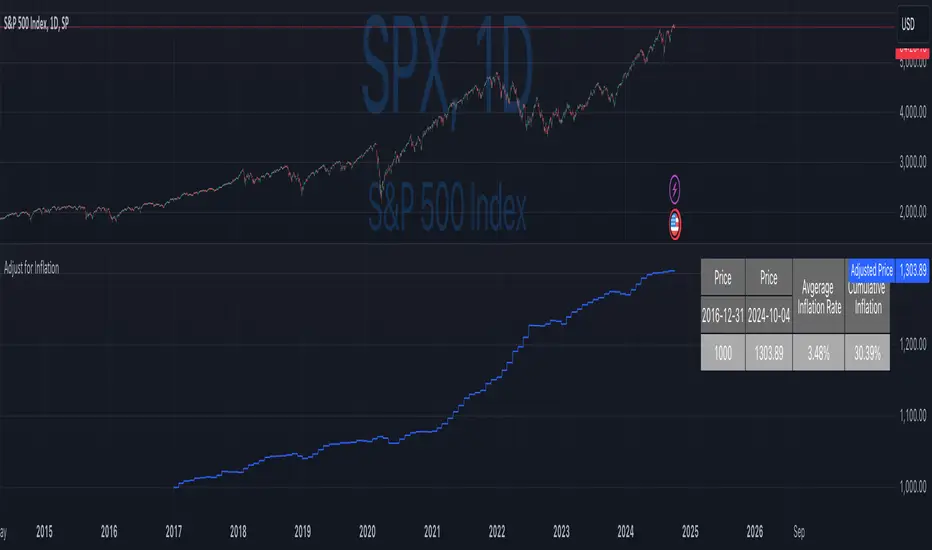
Inflation-Adjusted Price IndicatorThis indicator allows traders to adjust historical prices for inflation using customizable CPI data. The script computes the adjusted price by selecting a reference date, the original price, and the CPI source (US CPI or custom input) and plots it as a line on the chart. Additionally, a table summarizes the adjusted price values and average and total inflation rates.
While the indicator serves as a standalone tool to understand inflation's impact on prices, it is a supportive element in more advanced trading strategies requiring accurate analysis of inflation-adjusted data.
Disclaimer
Please remember that past performance may not be indicative of future results.
Due to various factors, including changing market conditions, the strategy may no longer perform as well as in historical backtesting.
This post and the script don’t provide any financial advice.
V20 with Prices- Ashish SinghV20 with Prices
The V20 with Prices strategy is a unique tool designed to assist traders in identifying potential buy and sell levels by analyzing continuous bullish price movements (green candles). This strategy tracks streaks of green candles and calculates key price levels based on the highest and lowest points during the streak. It highlights potential reversal points, giving traders insights into where they could consider buying or selling based on price movement thresholds.
Key Features:
Tracking Green Candle Streaks: The V20 with Prices strategy identifies sequences of continuous green candles and captures the lowest price and highest price within the streak, helping traders identify potential turning points in an uptrend.
Next Buy and Sell Levels: After a streak of green candles ends, the strategy highlights:
Next Buy at: The lowest price of the streak, indicating a potential re-entry point if the price revisits this level.
Next Sell at: The highest price of the streak, indicating a potential profit-taking point if the price reaches this level again.
Both of these price levels are displayed on the chart, and traders can choose whether to show these levels via customizable input settings.
Movement Percentage Highlight: The strategy calculates the percentage movement between the lowest and highest prices in the streak. If the movement exceeds the user-defined threshold (default is 20%), it highlights these candles with a green background, allowing traders to quickly identify significant price movements.
Customizable Price Display: Users can toggle the display of the Next Buy at and Next Sell at price levels through input settings, providing full control over what is shown on the chart.
How It Works:
Green Candle Tracking: The strategy identifies a streak of green candles where the close price is higher than the open price. During this streak, the lowest low and highest high are tracked.
Price Movement Threshold: If the movement between the lowest low and highest high exceeds the user-defined threshold, the candles are highlighted with a green background.
Key Levels: After a streak of green candles ends (when a red candle appears), the Next Buy at and Next Sell at levels are stored and displayed, giving traders clear reference points for future price action.
How to Use:
Movement Threshold: Customize the movement threshold to filter significant price moves. A higher threshold reduces sensitivity to small movements, while a lower threshold increases sensitivity.
Customizable Price Display: Toggle the display of key price levels to match your trading style.
Ideal Use Cases:
Trend-following: The strategy is perfect for traders looking to identify potential re-entry points during an uptrend or take-profit points as the price reaches new highs.
Retracement Trading: Traders can monitor the Next Buy at level to capitalize on price retracements after strong upward movements.
Important Notes:
Disclaimer: This strategy is for informational purposes only and is not intended as financial advice or a buy/sell recommendation. Traders should always perform their own analysis before making any trading decisions.
Non-Repainting: This strategy does not repaint, ensuring that all displayed levels are based on actual price action.
Open Source: The logic and source code are transparent, allowing traders to modify the strategy if needed.

RSI with Swing Trade by Kelvin_VAlgorithm Description: "RSI with Swing Trade by Kelvin_V"
1. Introduction:
This algorithm uses the RSI (Relative Strength Index) and optional Moving Averages (MA) to detect potential uptrends and downtrends in the market. The key feature of this script is that it visually changes the candle colors based on the market conditions, making it easier for users to identify potential trend swings or wave patterns.
The strategy offers flexibility by allowing users to enable or disable the MA condition. When the MA condition is enabled, the strategy will confirm trends using two moving averages. When disabled, the strategy will only use RSI to detect potential market swings.
2. Key Features of the Algorithm:
RSI (Relative Strength Index):
The RSI is used to identify potential market turning points based on overbought and oversold conditions.
When the RSI exceeds a predefined upper threshold (e.g., 60), it suggests a potential uptrend.
When the RSI drops below a lower threshold (e.g., 40), it suggests a potential downtrend.
Moving Averages (MA) - Optional:
Two Moving Averages (Short MA and Long MA) are used to confirm trends.
If the Short MA crosses above the Long MA, it indicates an uptrend.
If the Short MA crosses below the Long MA, it indicates a downtrend.
Users have the option to enable or disable this MA condition.
Visual Candle Coloring:
Green candles represent a potential uptrend, indicating a bullish move based on RSI (and MA if enabled).
Red candles represent a potential downtrend, indicating a bearish move based on RSI (and MA if enabled).
3. How the Algorithm Works:
RSI Levels:
The user can set RSI upper and lower bands to represent potential overbought and oversold levels. For example:
RSI > 60: Indicates a potential uptrend (bullish move).
RSI < 40: Indicates a potential downtrend (bearish move).
Optional MA Condition:
The algorithm also allows the user to apply the MA condition to further confirm the trend:
Short MA > Long MA: Confirms an uptrend, reinforcing a bullish signal.
Short MA < Long MA: Confirms a downtrend, reinforcing a bearish signal.
This condition can be disabled, allowing the user to focus solely on RSI signals if desired.
Swing Trade Logic:
Uptrend: If the RSI exceeds the upper threshold (e.g., 60) and (optionally) the Short MA is above the Long MA, the candles will turn green to signal a potential uptrend.
Downtrend: If the RSI falls below the lower threshold (e.g., 40) and (optionally) the Short MA is below the Long MA, the candles will turn red to signal a potential downtrend.
Visual Representation:
The candle colors change dynamically based on the RSI values and moving average conditions, making it easier for traders to visually identify potential trend swings or wave patterns without relying on complex chart analysis.
4. User Customization:
The algorithm provides multiple customization options:
RSI Length: Users can adjust the period for RSI calculation (default is 4).
RSI Upper Band (Potential Uptrend): Users can customize the upper RSI level (default is 60) to indicate a potential bullish move.
RSI Lower Band (Potential Downtrend): Users can customize the lower RSI level (default is 40) to indicate a potential bearish move.
MA Type: Users can choose between SMA (Simple Moving Average) and EMA (Exponential Moving Average) for moving average calculations.
Enable/Disable MA Condition: Users can toggle the MA condition on or off, depending on whether they want to add moving averages to the trend confirmation process.
5. Benefits of the Algorithm:
Easy Identification of Trends: By changing candle colors based on RSI and MA conditions, the algorithm makes it easy for users to visually detect potential trend reversals and trend swings.
Flexible Conditions: The user has full control over the RSI and MA settings, allowing them to adapt the strategy to different market conditions and timeframes.
Clear Visualization: With the candle color changes, users can quickly recognize when a potential uptrend or downtrend is forming, enabling faster decision-making in their trading.
6. Example Usage:
Day traders: Can apply this strategy on short timeframes such as 5 minutes or 15 minutes to detect quick trends or reversals.
Swing traders: Can use this strategy on longer timeframes like 1 hour or 4 hours to identify and follow larger market swings.

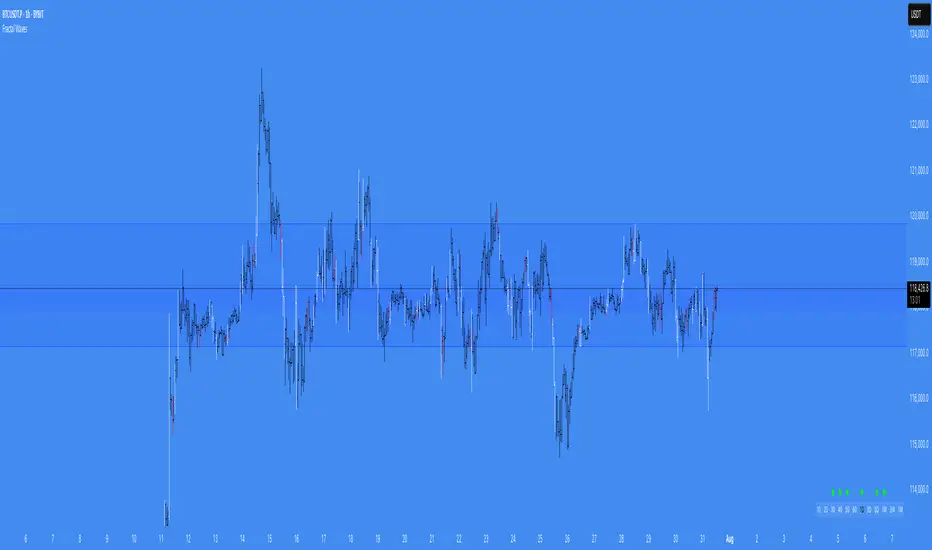
Fractal WavesSummary of the "Fractal Waves" Indicator
The "Fractal Waves" indicator is a multifaceted trading tool designed for TradingView that combines various technical analysis methods to help traders identify potential market trends and trading opportunities. It overlays multiple analyses directly onto price charts, providing a comprehensive visual representation of market dynamics.
Key Features:
Fractal Wave Detection and Visualization:
Purpose: Identifies fractal highs and lows to signal potential trend reversals or continuations.
Functionality: Calculates fractal highs, lows, and midpoints on both the current and an additional user-selected timeframe. Plots lines at these fractal points with color coding to distinguish between bullish and bearish trends. Fills areas between fractal highs and lows with background colors to enhance visual cues. Updates fractal lines dynamically as new fractals are identified. Multiple Time Frame Moving Averages (MTF MA):
Purpose: Provides insight into trend directions across different timeframes.
Functionality: Allows plotting of up to three customizable moving averages from different timeframes on the current chart. Users can select the type of MA (SMA, EMA, DEMA, VWMA, RMA, WMA), length, resolution, and color. Optionally displays labels showing MA details like type, length, and resolution for clarity. Bar Pattern Identification (Inside and Outside Bars):
Purpose: Highlights specific bar patterns that may indicate market indecision or breakout potential.
Functionality: Detects inside bars (where the current bar's range is within the previous bar) and outside bars (where the current bar's range exceeds the previous bar). Colors bars based on whether they are bullish or bearish inside/outside bars using user-defined colors. Utilizes "The Strat" methodology to assign numbers (1 for inside bars, 2 for directional bars, 3 for outside bars) and plots them above the bars. Wicked Wicks Visualization:
Purpose: Highlights significant wicks that may indicate rejection at certain price levels.
Functionality: Identifies long upper wicks (top wicks) and lower wicks (bottom wicks) relative to previous bars. Plots custom candles to emphasize these wicks with specific background and border colors. Aids in recognizing potential reversals or strong buying/selling pressure. Volume Weighted Average Price (VWAP):
Purpose: Helps identify the average trading price weighted by volume, acting as dynamic support or resistance.
Functionality: Calculates and plots the daily VWAP, updating at the start of each session. Changes VWAP line color at session start for visual differentiation. Applicable primarily to intraday charts (60-minute timeframe or lower). Volume and Extreme Volume Reversal (EVR) Analysis:
Purpose: Detects areas of unusually high volume that may precede price reversals.
Functionality: Tracks the highest volume bars of the current and previous day. Plots boxes and lines to highlight extreme volume areas. Changes candle colors for high-volume bars to draw attention. Calculates and plots potential reversal levels based on extreme volume. Rate of Change (ROC) and Average True Range (ATR) Ratio Analysis:
Purpose: Assesses price momentum relative to volatility to predict trend changes.
Functionality: Calculates the ROC and ATR over specified lengths. Computes the ratio of ROC to ATR to gauge momentum. Plots bullish or bearish dots on the chart when ROC-ATR ratio aligns with the fractal trend, indicating potential trend shifts. Provides alerts when a new bullish or bearish trend is detected. Average Volume Weighted Average Price (AVWAP) with Dynamic Lookback Periods:
Purpose: Identifies key price levels based on volume-weighted averages over specific lookback periods.
Functionality: Calculates AVWAPs from the highest and lowest points over dynamic or manual lookback periods. Adjusts lookback periods automatically based on the current chart timeframe or uses user-defined periods. Plots AVWAP lines and fills the area between them, highlighting overlaps which may signify significant support/resistance levels. Fractal Wave Table Across Multiple Timeframes:
Purpose: Provides a quick overview of fractal trends and inside bar patterns across various timeframes.
Functionality: Displays a table at the bottom of the chart showing fractal wave values and inside bar statuses for timeframes from 5 minutes to monthly. Uses color coding to indicate bullish or bearish trends and whether the price is above or below the fractal wave. Indicates inside bars with symbols and colors to quickly identify consolidation periods. Alert Conditions:
Purpose: Keeps traders informed of significant market events without constant monitoring.
Functionality: Triggers alerts for: Bullish or bearish trend changes when the ROC-ATR ratio aligns with the fractal trend. Price crossing above a fractal high or below a fractal low. Formation of new bullish or bearish fractals. EVR-based potential long or short opportunities.
Usage Notes:
Customization: The indicator offers extensive customization options, allowing users to adjust colors, timeframes, calculation periods, and display preferences to suit their trading style. Timeframe Considerations: Some features, like EVR analysis and intraday VWAP, are optimized for intraday timeframes (up to 60 minutes). The indicator adjusts calculations and visualizations based on the current chart's timeframe. Comprehensive Analysis: By combining multiple technical analysis tools—such as fractals, moving averages, volume analysis, and bar patterns—the indicator provides a holistic view of market conditions. Visual Clarity: The use of color coding, labels, and symbols enhances visual interpretation, making it easier for traders to identify patterns and trends at a glance. Alerts and Notifications: Built-in alert conditions help traders stay informed of key market developments, enabling timely decision-making without the need for constant chart monitoring.
Conclusion:
The "Fractal Waves" indicator serves as an advanced analytical tool that synthesizes various technical indicators to support traders in market analysis. By overlaying fractal patterns, moving averages from multiple timeframes, volume analysis, and bar patterns onto price charts, it aids in identifying potential trading opportunities and understanding market dynamics across different timeframes. The combination of visual cues and alert notifications makes it a valuable asset for traders seeking deeper insight into market behavior.
Demand and Supply Conditions with SignalsIntroduction:
This document outlines a trading strategy that utilizes price action analysis and color signals to make informed trading decisions. The strategy focuses on identifying demand and supply conditions, curve patterns, and generating signals based on historical price data. The colors associated with each condition and signal serve as visual indicators to assist in decision-making.
I. Strategy Overview:
Objective:
The objective of this trading strategy is to identify potential trading opportunities based on price action analysis and color signals.
Key Components:
Demand Condition: A green upward-facing triangle indicates a potential demand condition.
Supply Condition: A red downward-facing triangle indicates a potential supply condition.
Curve Pattern Condition: A blue upward-facing triangle indicates a potential curve pattern condition.
Signal Condition: A yellow upward-facing triangle indicates a potential buy signal.
II. Understanding the Colors:
* Green: Represents the demand condition, which suggests potential buying pressure in the market. A green upward-facing triangle is plotted on the chart when the demand condition is met at a specific candle or bar.
* Red: Represents the supply condition, which suggests potential selling pressure in the market. A red downward-facing triangle is plotted on the chart when the supply condition is met at a specific candle or bar.
* Blue: Represents the curve pattern condition, which suggests the presence of a specific pattern based on price action analysis. A blue upward-facing triangle is plotted on the chart when the curve pattern condition is met at a specific candle or bar.
* Yellow: Represents the signal condition, which is a combination of the demand condition and the curve pattern condition. A yellow upward-facing triangle is plotted on the chart when the signal condition is met at a specific candle or bar, indicating a potential buy signal.
III. Decision-Making Process:
* Demand and Supply Conditions: Identify potential buying opportunities when a green demand condition is present. Consider potential selling opportunities when a red supply condition is present. Use these conditions to assess the overall market sentiment and potential price reversals.
* Curve Patterns: Analyze the presence of blue curve pattern conditions to identify specific price patterns. These patterns can provide additional confirmation for potential trading decisions.
* Signal Condition: Pay attention to the yellow signal condition, which indicates a potential buy signal. Evaluate the overall market context and consider entering a buy position when the signal condition is met.
* Risk Management: Implement proper risk management techniques such as setting stop-loss orders and position sizing to protect against potential losses.
IV. Conclusion:
This trading strategy leverages price action analysis and color signals to identify potential trading opportunities. The colors associated with each condition and signal serve as visual aids to highlight specific points on the chart. It's important to thoroughly backtest and validate the strategy before applying it to real-world trading scenarios. Additionally, always consider market conditions, risk management, and individual trading preferences when making trading decisions.
Disclaimer: Trading involves risks, and this document does not guarantee profitable outcomes. Traders should exercise caution and perform their own due diligence before engaging in any trading activity.
Remember to continually review and adapt your trading strategy based on market conditions and personal experiences to enhance its effectiveness.

Grandfather-Father-Son RSI Buy Indicator-only for daily TFGrandfather-Father-Son RSI Buy and Sell Indicator
This script identifies buy and sell opportunities by combining RSI values across multiple timeframes to capture market trends and reversals. The "Grandfather-Father-Son" concept breaks down RSI analysis into three key timeframes:
Grandfather (Monthly): Represents the long-term trend, helping to filter trades that align with the overall market direction.
Father (Weekly): Provides intermediate-term momentum, confirming market conditions before signaling entry or exit points.
Son (Daily): Tracks short-term corrections and movements to pinpoint precise buy and sell opportunities.
Key Features:
Buy Signal: A buy signal is triggered when:
Monthly RSI (Grandfather) and Weekly RSI (Father) are both above 70.
Daily RSI (Son) is between 40 and 45, signaling a potential market pullback before resuming the upward trend.
The indicator checks for alignment across these timeframes to generate a reliable buy signal.
Sell Signal: A sell signal occurs when the Daily RSI (Son) crosses above 70, indicating a potential overbought condition.
Multi-Timeframe Analysis: The script pulls data from higher timeframes (monthly and weekly) to ensure that signals reflect larger market trends rather than short-term fluctuations.
Instructions:
Optimal Timeframe: This script works best on the Daily timeframe, as it uses Monthly and Weekly RSI for trend confirmation. The indicator will display a warning if applied to other timeframes to ensure it is used optimally.
Trend Alignment: The strategy ensures that buy signals are triggered only when there is a strong uptrend in both the Grandfather (Monthly) and Father (Weekly) RSI, while sell signals are based on potential overbought conditions in the Son (Daily) RSI.
Limitations:
Timeframe Dependency: Signals are based on higher timeframe data (Weekly and Monthly), which may only update at the close of those respective time periods. Therefore, it is designed to work in real-time but will be most reliable when trading in alignment with these longer-term trends.
Replay Mode: The script has been optimized to function correctly during live market conditions, with no reliance on future data (no lookahead). This ensures signals appear accurately during both backtesting and live trading.
Disclaimer:
This script is for educational purposes and should be used with caution. Always backtest before using in live trading and adjust parameters to fit your trading strategy and risk management plan.

FloWave Oscillator [StabTrading]The FloWave Oscillator is a powerful trading tool designed to identify market trends and reversals by analysing reversal zones based on momentum and fear algorithms.
Serving as the first stage in a comprehensive trading system, it is intentionally straightforward, allowing traders to clearly see potential entry points across all charts and timeframes.
By inputting their own market sentiment, traders can customize the algorithm to align with their trading style. This flexibility helps traders navigate complex market environments with greater precision, whether they are seeking to capitalize on short-term opportunities or ride longer-term trends.
💡 Features
Reversal Zones - The FloWave Oscillator identifies key reversal zones driven by momentum and fear dynamics. Lighter green zones signal the initial stages of a potential reversal, while darker green zones indicate that a trend flip is imminent.
Trading Style Customization - The indicator allows traders to adjust their trading style with sensitivity settings ranging from Very Aggressive to Very Conservative. This flexibility lets traders tailor the indicator to their preferred time horizon—whether they seek to scalp short-term opportunities or capture long-term reversals.
🔥 Sensitivity Settings
Very Aggressive/Aggressive - These settings increase the indicator's sensitivity, generating more frequent signals, ideal for traders focused on short-term gains or those navigating choppy markets.
Neutral - Offers a balanced approach, combining both aggressive and conservative elements. It's a starting point for traders to evaluate performance before adjusting to more specific styles.
Conservative/Very Conservative - These settings reduce signal frequency, focusing on stronger, more reliable reversals. Best suited for long-term traders aiming to minimize risk and avoid premature market entries or exits.
🛠️ Usage/Practice
In the above example we’ll analysis how the indicator accurately predicts both the tops and bottoms of a market cycle.
Top of the Bull Market - The trendline initially shows two light red reversal zones, signalling a potential weakening in the upward momentum. As the trend progresses, a dark red zone emerges, confirming that a more substantial trend reversal to the downside is likely. This sequence provides an early warning, allowing traders to prepare for a possible market shift.
First Bull Signal - In the following phase, the indicator mirrors the previous action but in the opposite direction, identifying a reversal towards the upside. This behaviour demonstrates the indicator's ability to adapt to changing market conditions.
Bottom of the Bear Market - As the market continues its downward trajectory, the indicator presents two dark green reversal zones, highlighting areas where the selling pressure may be easing. These dark green zones offer three distinct opportunities to dollar-cost average (DCA) into the asset, allowing traders to build or enhance their positions during the end of the bear cycle. The indicator’s sensitivity in this phase ensures that traders can navigate the bearish market with confidence.
Continuation of Bull Cycle - In this segment, the indicator does not display any dark green reversal zones, implying that the uptrend remains robust. The absence of these zones suggests that the upward momentum is likely to continue, providing traders with another opportunity to add to their long positions. This scenario underscores the indicator’s capacity to identify when a trend is strong enough to warrant additional investment.
Potential Correction in an Uptrend - A light red zone appears, signalling a possible correction within the ongoing uptrend. However, the absence of a dark red zone indicates that the correction may be minor and that the overall trend is still upward. Traders might view this as a conservative point to take some profits off the table, managing risk while staying aligned with the broader bull market.
Bearish Signal - Eventually, a dark red reversal zone emerges, indicating that the trend has lost its upward momentum. This signal serves as a strong indicator that the uptrend may be concluding, prompting traders to consider exiting their positions or taking a more defensive stance. As the market enters a sideways phase, the trader can switch to a more aggressive trading style, seeking opportunities to scalp within the range while navigating the flat market conditions.
In this example, we demonstrate how to identify scalp trading opportunities by combining the Very Conservative and Very Aggressive settings. The key strategy is to use the Very Conservative trend to confirm the validity of reversal zones identified by the Very Aggressive setting.
The VC trend doesn’t indicate a buy reversal zone, but it shows an upward divergence. This suggests that the reversal buy zone on the VA chart is a potential entry point due to the supportive VC trend.
Multiple sell zones appear on the VA chart, but the VC trend shows a strong and steady uptrend. This suggests that we should wait for confirmation from the VC trend before considering a sell position, as the market is still moving upward strongly.
The VA chart shows several buy zones, but the VC trend indicates a strong downtrend, and no buy zone appears on the conservative setting. This suggests waiting for the next VA buy zone, confirmed by an upward divergence on the VC trend, before entering a trade.
Similar to Point 3 but in the opposite direction, the VA chart shows sell zones, but the VC trend indicates caution. The strategy would be to wait for confirmation from the VC trend before making a move.
🔶Conclusion
When used in conjunction with other indicators like the MeanRevert Matrix, the FloWave Oscillator becomes an integral part of a comprehensive trading system. It helps traders make informed decisions by providing clear signals that are aligned with the current market sentiment and broader economic trends. By following the implementation guidelines and adjusting the indicator settings as market conditions change, traders can effectively enhance their trading performance.

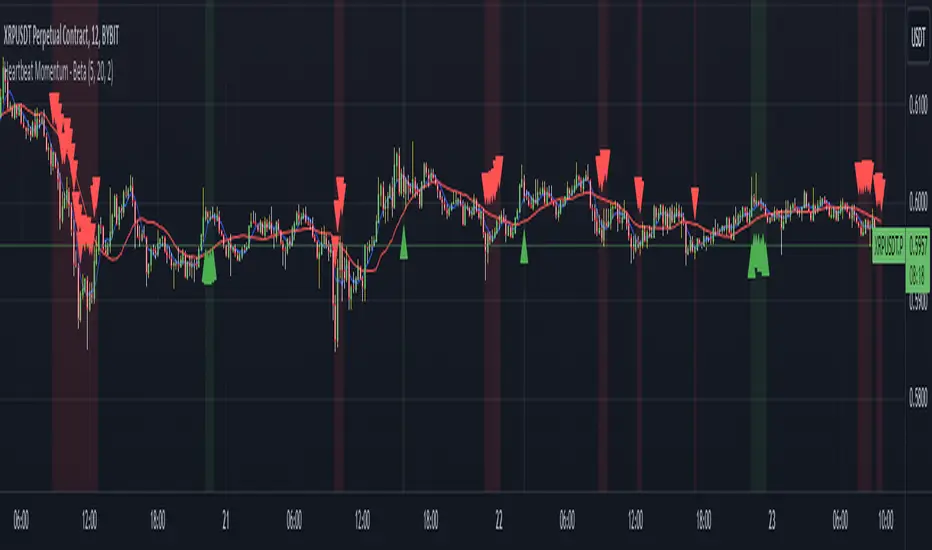
Heartbeat Momentum Strategy BetaHeartbeat Momentum Strategy Beta
Overview
The Heartbeat Momentum Strategy is an innovative approach to market analysis that draws inspiration from the rhythmic patterns of a heartbeat. This strategy aims to identify significant momentum shifts in the market by comparing short-term and long-term moving averages, analogous to detecting irregularities in a heartbeat.
Key Concepts
Market Heartbeat: The difference between short-term and long-term moving averages, representing the market's current 'pulse'.
Heartbeat Volatility: Measured by the standard deviation of the market heartbeat.
Momentum Signals: Generated when the heartbeat deviates significantly from its normal range.
How It Works
Calculates a short-term moving average (default 5 periods) and a long-term moving average (default 20 periods) of the closing price.
Computes the 'heartbeat' by subtracting the long-term MA from the short-term MA.
Measures the volatility of the heartbeat using its standard deviation over the long-term period.
Generates buy signals when the heartbeat exceeds 2 standard deviations above its mean.
Generates sell signals when the heartbeat falls 2 standard deviations below its mean.
Indicator Components
Blue Line: Short-term moving average
Red Line: Long-term moving average
Green Triangles: Buy signals
Red Triangles: Sell signals
Background Color: Light green during buy signals, light red during sell signals
Strategy Parameters
Short MA Window: The period for the short-term moving average (default: 5)
Long MA Window: The period for the long-term moving average (default: 20)
Standard Deviation Threshold: The number of standard deviations to trigger a signal (default: 2.0)
Interpretation
Buy Signal: Indicates a potential strong upward momentum shift. Consider opening long positions or closing short positions.
Sell Signal: Suggests a potential strong downward momentum shift. Consider opening short positions or closing long positions.
No Signal: The market is moving within its normal rhythm. Maintain current positions or look for other entry opportunities.
Customization
Users can adjust the strategy parameters to suit different assets, timeframes, or trading styles:
Decrease the MA windows for more frequent signals (more suitable for shorter timeframes).
Increase the MA windows for fewer, potentially more significant signals (better for longer timeframes).
Adjust the Standard Deviation Threshold to fine-tune sensitivity (lower for more signals, higher for fewer but potentially stronger signals).
Risk Management
While this strategy can provide valuable insights into market momentum, it should not be used in isolation:
Always use stop-loss orders to manage potential losses.
Consider the overall market context and other technical/fundamental factors.
Be aware of potential false signals, especially in ranging or highly volatile markets.
Backtest and forward-test the strategy with different parameters before live trading.
Conclusion
The Heartbeat Momentum Strategy offers a unique perspective on market movements by treating price action like a heartbeat. By identifying significant deviations from the normal market rhythm, it aims to capture strong momentum shifts while filtering out market noise. As with any trading strategy, use it as part of a comprehensive trading plan and always practice sound risk management.
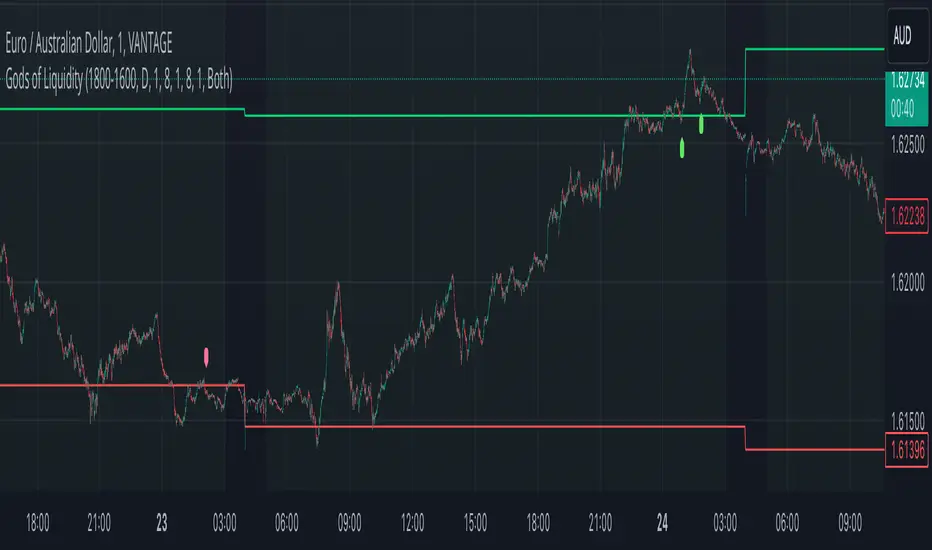
God's of LiquidityHere’s a detailed description for your script, following the guidelines for clarity and originality:
---
**Title:** God's of Liquidity
**Description:**
The "Gods of Liquidity" script is a comprehensive trading tool designed to help traders identify high-probability buy and sell opportunities based on a combination of liquidity levels, RSI-based sentiment analysis, and session-specific filters.
**Key Features:**
1. **Liquidity Zones Identification:**
- The script dynamically calculates the previous day's high and low levels, which serve as critical liquidity zones. Traders can use these levels to spot potential breakout points and reversals.
2. **RSI-Based Sentiment Analysis:**
- The script incorporates a sophisticated RSI-based sentiment model that differentiates between institutional (Banker) and retail (Hot Money) activity. This dual RSI approach allows traders to gauge market sentiment and anticipate shifts in momentum.
- **Banker RSI:** Measures the sentiment of institutional traders, with customizable sensitivity and period parameters.
- **Hot Money RSI:** Measures retail trader sentiment, with its own adjustable settings to tailor the script to various market conditions.
3. **Session and Day Filters:**
- Traders can restrict signals to specific trading sessions and days of the week, providing greater control and precision in executing trades. This feature is particularly useful for aligning trading activity with market conditions that best suit the strategy.
4. **Breakout and Reversal Signals:**
- The script generates buy signals when the price breaks above the previous day's high, accompanied by bullish RSI sentiment from institutional traders. Conversely, sell signals are generated when the price breaks below the previous day's low, with bearish institutional sentiment.
- These signals are visually marked on the chart, making it easier for traders to identify potential trading opportunities.
5. **Customizable Moving Averages:**
- The script allows users to customize the moving averages used in the RSI calculations, giving traders the flexibility to adapt the tool to their specific trading style and market conditions.
6. **Alert System:**
- Alerts are integrated to notify traders when buy or sell conditions are met, ensuring that traders can react promptly to potential trading opportunities without constantly monitoring the charts.
**How It Works:**
- The script uses the previous day's high and low as key liquidity levels. The price crossing these levels, combined with RSI-based signals, indicates potential buy or sell opportunities.
- The sentiment analysis is derived from the RSI values, with separate calculations for institutional and retail activities. The crossover points of these RSI values against their respective moving averages trigger buy or sell signals.
- The session and day filters allow traders to focus on the most relevant times for trading, enhancing the effectiveness of the strategy.
**Usage:**
- This indicator is designed for Forex traders who want to integrate liquidity zones and sentiment analysis into their trading strategy. It is particularly effective on daily or higher timeframes where liquidity levels and RSI-based sentiment analysis can provide strong indications of market direction.
- The script's flexibility in adjusting session times, days, and RSI parameters makes it suitable for a wide range of trading styles, from day trading to swing trading.
---
**License:**
This source code is subject to the terms of the Mozilla Public License 2.0 at (mozilla.org).
© bankbaguitarcrazy
---
This description should provide sufficient detail to comply with the publication guidelines, offering clear insight into how the script works and its unique features.
AB_Bnf_Selling_5minThe Mathematical Level Reversal Strategy is designed to identify potential reversal points in the market using mathematical levels combined with price action on a 5-minute chart. This strategy is particularly effective for intraday traders who seek to capitalize on precise entry and exit points based on calculated levels rather than traditional indicators like moving averages or Bollinger Bands.
Creators' Mathematical Levels Explanation
Mathematical levels are predetermined price points calculated based on various factors such as previous high/low points, Fibonacci retracements, or other arithmetic calculations. These levels are used to anticipate areas where the price might reverse or experience significant support or resistance.
higher threshold: A predefined level where the price is expected to experience resistance, leading to a potential reversal downward.
Lower Threshold: A predefined level where the price might find support, leading to a potential upward reversal.
In this strategy, we focus on price movements around the upper mathematical level, where prices are likely to reverse downwards.
Strategy Logic
Setup:
The strategy is applied on a 5-minute chart.
Mathematical levels are calculated based on your preferred method, such as Fibonacci levels, pivot points, or custom calculations. For this strategy, let's assume we are using a specific predefined upper level.
Sell Signal Criteria:
A 5-minute candle must cross above the predefined upper mathematical level or close entirely above it (open and close both above the level).
The following candle must break below the low of the candle that crossed the upper level and close below that low. This confirms a bearish reversal.
Once these conditions are met, a sell signal is triggered.
Stop Loss:
The stop loss is placed at the high of the candle that crossed above the upper mathematical level.
This level represents the point where the trade setup would be invalidated.
Take Profit:
Target 1: The first take profit is set at a level that offers a 1:5 risk-to-reward ratio.
Target 2: An alternative take profit level is set at a 1:3 risk-to-reward ratio, providing flexibility based on market conditions.
Trade Management:
Once a trade is initiated, no new trades will be taken until the current trade hits either the stop loss or the first take profit level. This prevents overlapping signals and helps in managing risk effectively.
Originality and Usefulness
This strategy offers a unique approach by using mathematical levels instead of traditional indicators. It provides traders with a clear framework for identifying and executing high-probability reversal trades, particularly in intraday markets.
Originality:
The strategy's originality lies in its reliance on mathematical levels combined with a multi-candle confirmation pattern. This approach reduces the chances of false signals and offers a robust method for identifying potential reversals.
Usefulness:
The strategy is particularly useful for traders who prefer a more quantitative approach, relying on calculated price levels rather than indicators. The clear rules for entry, stop loss, and take profit make it easier to execute consistently.
The inclusion of both 1:5 and 1:3 risk-to-reward targets allows for flexibility depending on market conditions, ensuring that traders can adapt to varying levels of volatility.
Chart Signals and Examples
To demonstrate the effectiveness of this strategy, let's look at a few hypothetical examples on a 5-minute chart:
Example 1: Clear Reversal Signal
The price steadily rises and crosses above the predefined upper mathematical level. The next candle breaks below the low of this candle and closes lower, triggering a sell signal.
A red dotted line is drawn at the stop loss level (the high of the candle that crossed the upper level).
Two green dashed lines are drawn to indicate the first and second take profit levels.
Example 2: No Signal Due to Ongoing Trade
After an initial sell signal is triggered, the price fluctuates but does not hit either the stop loss or the first take profit target. During this period, the strategy refrains from issuing any new signals, adhering to the trade management rule.
Example 3: Trade Reaches Target 1
In another scenario, the price moves sharply in favor of the trade after the signal is triggered. The first take profit level is hit, securing a profit. The trade is then considered closed, and the strategy is ready to issue a new signal when conditions are met.

ChartArt-Bankniftybuying5minName: ChartArt-BankNifty Buying Strategy (5-Minute)
Timeframe: 5-Minute Candles
Asset: BankNifty (Indian Stock Market Index)
Trading Hours: 9:30 AM - 2:45 PM IST (Indian Standard Time)
This strategy is designed for BankNifty intraday traders who want to capitalize on short-term price movements within a defined trading window. It combines technical indicators like Simple Moving Averages (SMA), Relative Strength Index (RSI), and candlestick patterns to identify potential buy signals during intraday downtrends. The strategy employs specific entry, stop-loss, and target conditions to manage trades effectively and minimize risk.
Technical Indicators Used
Simple Moving Averages (SMA):
EMA7: 7-period SMA on closing price.
EMA5: 5-period SMA on closing price.
Purpose: Used to identify the intraday trend by comparing short-term moving averages. The strategy focuses on situations where the market is in a minor downtrend, indicated by EMA5 being below EMA7.
Relative Strength Index (RSI):
RSI14: 14-period RSI, a momentum oscillator that measures the speed and change of price movements.
SMA14: 14-period SMA of the RSI.
Purpose: RSI is used to identify potential reversal points. The strategy looks for situations where the RSI is below its own moving average, suggesting weakening momentum in the downtrend.
Candlestick Patterns:
Relaxed Hammer or Doji (2nd Candle): A pattern where the second candle in a 3-candle sequence shows a potential reversal signal (Hammer or Doji), indicating indecision or a potential turning point.
Bearish 1st Candle: The first candle is bearish, setting up the context for a potential reversal.
Bullish 3rd Candle: The third candle must be bullish with specific characteristics (closing near the high, surpassing the previous high), confirming the reversal.
Strategy Conditions
Time Condition:
The strategy is only active during specific hours (9:30 AM to 2:45 PM IST). This ensures that trades are only taken during the most liquid hours of the trading day, avoiding potential volatility or lack of liquidity towards market close.
Intraday Downtrend Condition:
EMA5 < EMA7: Indicates that the market is in a minor downtrend. The strategy looks for reversal opportunities within this trend.
RSI Condition:
RSI14 <= SMA14: Indicates that the current RSI value is below its 14-period SMA, suggesting potential weakening momentum, which can precede a reversal.
Candlestick Patterns:
1st Candle: Must be bearish, setting up the context for a potential reversal.
2nd Candle: Must either be a Hammer or Doji, indicating a potential reversal pattern.
3rd Candle: Must be bullish, with specific characteristics (closing near the high, breaking the previous high, etc.), confirming the reversal.
RSI Crossover Condition:
A crossover of the RSI over its SMA in the last 5 periods is also checked, adding further confirmation to the reversal signal.
Entry and Exit Rules
Entry Signal:
A buy signal is generated when all the conditions (time, intraday downtrend, bearish 1st candle, hammer/doji 2nd candle, bullish 3rd candle, and RSI condition) are met. The trade is entered at the high of the bullish third candle.
Stop Loss:
The stop loss is calculated based on the difference between the entry price and the low of the second candle. If this difference is greater than 90 points, the stop loss is placed at the midpoint of the second candle's range (average of high and low). Otherwise, it is placed at the low of the second candle.
Target 1:
The first target is set at 1.8 times the difference between the entry price and the stop loss. When this target is hit, half of the position is exited to lock in partial profits.
Target 2:
The second target is set at 3 times the difference between the entry price and the stop loss. The remaining position is exited at this point, or if the price hits the stop loss.
Originality and Usefulness
This strategy is original in its combination of multiple technical indicators and candlestick patterns to identify potential reversals in a specific intraday timeframe. By focusing on minor downtrends and utilizing a 3-candle reversal pattern, the strategy seeks to capture quick price movements with a structured approach to risk management.
Key Benefits:
High Precision: The strategy’s multi-step filtering process (time condition, trend confirmation, candlestick pattern analysis, and momentum evaluation via RSI) increases the likelihood of accurate trade signals.
Risk Management: The use of a dynamic stop-loss based on candle characteristics, combined with partial profit-taking, allows traders to lock in profits while still giving the trade room to develop further.
Structured Approach: The strategy provides a clear, rule-based system for entering and exiting trades, which can help remove emotional decision-making from the trading process.
Charts and Signals
The strategy produces signals in the form of labels on the chart:
Buy Signal: A green label is plotted below the candle that meets all entry conditions, indicating a potential buy opportunity.
Stop Loss (SL): A red dashed line is drawn at the stop-loss level with a label indicating "SL".
Target 1 (1st TG): A blue dashed line is drawn at the first target level with a label indicating "1st TG".
Target 2 (2nd TG): Another blue dashed line is drawn at the second target level with a label indicating "2nd TG".
These visual aids help traders quickly identify entry points, stop loss levels, and target levels on the chart, making the strategy easy to follow and implement.
Backtesting and Optimization
Backtesting: The strategy can be backtested on TradingView using historical data to evaluate its performance. Traders should consider testing across different market conditions to ensure the strategy's robustness.
Optimization: Parameters such as the RSI period, moving averages, and target multipliers can be optimized based on backtesting results to refine the strategy further.
Conclusion
The ChartArt-BankNifty Buying Strategy offers a well-rounded approach to intraday trading, focusing on capturing reversals in minor downtrends. With a strong emphasis on technical analysis, precise entry and exit rules, and robust risk management, this strategy provides a solid framework for traders looking to engage in intraday trading on BankNifty.

Configurable Level Trading StrategyThe Dynamic Level Reversal Strategy is a trading approach designed to capitalize on price movements between key support and resistance levels. This strategy leverages configurable levels the trader determines, allowing for flexibility and adaptation to different market conditions.
Key Features:
Configurable Levels:
The strategy uses three key levels: Level 1 (Support), Level 2 (Middle), and Level 3 (Resistance). These levels can be adjusted directly within the script settings, making the strategy adaptable to various trading scenarios.
Buy and Sell Signals:
A buy signal is triggered when the price touches Level 1 and shows signs of reversal. The trader enters a position and sets an initial stop-loss just below Level 1.
As the price moves upward, the stop-loss is dynamically adjusted to just below Level 2 and Level 3, locking in profits while managing risk.
A sell signal is generated if the price reverses and crosses below the current stop-loss level, ensuring the trader exits the position with minimized losses.
Iterative Process:
The strategy allows for iterative trades, where the trader re-enters positions at Level 1 or Level 2 if the price revisits these levels, continually adjusting stop-losses and take-profit targets as the price oscillates between the defined levels.
Ideal Use Cases:
Range-Bound Markets: The strategy is particularly effective in markets where the price tends to oscillate between well-defined support and resistance levels.
Volatile Markets: The dynamic adjustment of stop-loss levels helps protect against sudden price reversals, making it suitable for volatile market conditions.
How to Use:
Set the desired levels (Level 1, Level 2, Level 3) based on your market analysis.
The script will automatically generate buy and sell signals, and adjust stop-loss levels as the price moves through the levels.
Monitor the signals and execute trades according to the strategy's guidelines.
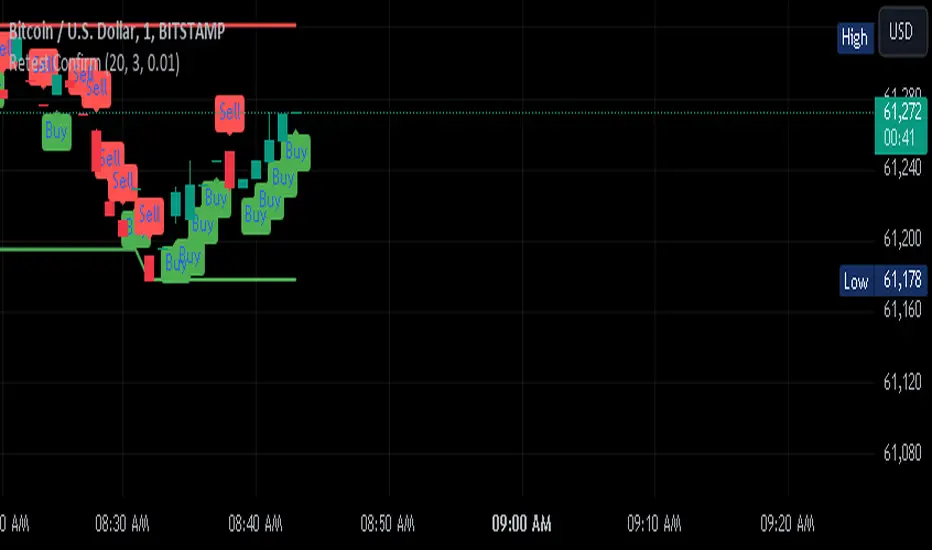
Retest Confirm Point TibbuCreating a "Retest Confirm Point" indicator that generates buy and sell signals involves defining criteria to confirm that a price retest is valid before issuing a trade signal. This generally requires identifying a key level (such as support, resistance, or a trendline), detecting a retest of this level, and then confirming the validity of the retest.
Here’s a Pine Script example to help you create such an indicator. This script identifies and confirms retests of previous highs and lows, and generates buy and sell signals based on those retests: Explanation:
Recent High and Low:
The script identifies the highest and lowest prices over a specified lookback period.
These levels are plotted on the chart as reference points.
Retest Conditions:
Retest High: The closing price is within a buffer range around the recent high.
Retest Low: The closing price is within a buffer range around the recent low.
Confirmation:
Confirm High: The closing price reaches a new high over a set number of bars after the retest condition.
Confirm Low: The closing price reaches a new low over a set number of bars after the retest condition.
Signals:
Buy Signal: Issued when a confirmed retest of the recent high occurs.
Sell Signal: Issued when a confirmed retest of the recent low occurs.
Customization:
Lookback Period: Adjust to determine the historical range for finding recent highs and lows.
Confirmation Bars: Change the number of bars used to confirm the retest.
Retest Buffer: Adjust the percentage buffer to fine-tune the retest conditions.
Testing and Optimization:
Backtest: Always backtest the strategy on historical data to ensure it behaves as expected.
Adjust Parameters: Modify parameters based on the asset, timeframe, and market conditions.
Feel free to modify this script further based on your specific trading strategy and needs. If you need help with any additional features or further customization, let me know!
ChatGPT can make mistakes. Check important info.
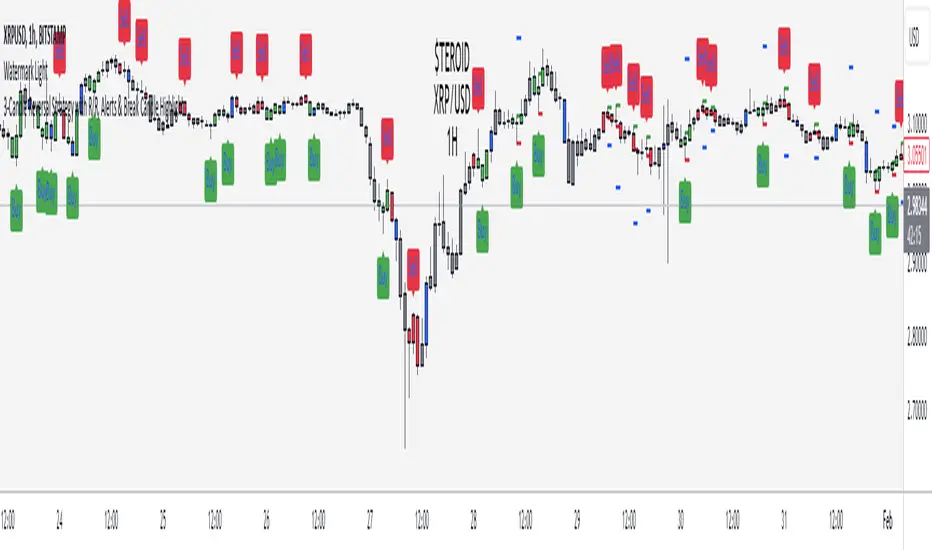
3-Candle Reversal Strategy with R/R & AlertsThe "Steroid: 3-Candle Reversal Strategy with R/R & Alerts" indicator is designed to detect and highlight three-candle reversal patterns, which signal potential trend changes. This tool is versatile and highly effective, making it an essential addition to any trader's toolkit.
Features:
Pattern Detection:
Bullish Reversal: The indicator identifies a bullish reversal pattern when the second candle forms a new low, and the third candle closes above the high of the second candle. This setup suggests a potential upward trend reversal.
Bearish Reversal: Conversely, a bearish reversal pattern is detected when the second candle forms a new high, and the third candle closes below the low of the second candle, indicating a potential downward trend reversal.
Customizable Entry Points:
For bullish patterns, you can select the entry point based on the high of the 1st, 2nd, or 3rd candle.
For bearish patterns, you can choose the entry point based on the low of the 1st, 2nd, or 3rd candle.
This flexibility allows traders to tailor the strategy to their specific trading style and market conditions.
Risk/Reward Calculation:
The indicator automatically calculates and plots entry, stop-loss, and take-profit levels based on the selected risk/reward ratio. This feature helps traders quickly assess the potential risk and reward of each trade setup.
Alerts:
Custom alerts can be set up to notify you when a bullish or bearish pattern is detected. This ensures you never miss a potential trading opportunity.
Visualization:
The indicator colors the candles involved in the pattern (green for bullish and red for bearish) and plots the corresponding entry, stop-loss, and take-profit levels on the chart. This visual aid makes it easy to see and evaluate potential trades.
Settings:
Candle to place the sign: Choose which candle (1st, 2nd, or 3rd) will be marked when a pattern is detected.
Show Entry Level: Toggle the display of the entry level on the chart.
Show Stop-Loss Level: Toggle the display of the stop-loss level on the chart.
Show Take-Profit Level: Toggle the display of the take-profit level on the chart.
Risk-Reward Ratio: Adjust the risk-reward ratio used in calculating the take-profit level.
Enable Bullish Scenario: Turn on or off the detection of bullish reversal patterns.
Enable Bearish Scenario: Turn on or off the detection of bearish reversal patterns.
How to Use:
Customize Settings: Adjust the settings according to your trading strategy and preferences.
Enable Alerts: Set up alerts to be notified when a pattern is detected, ensuring you stay informed about potential trade setups.
Analyze Patterns: Use the visual cues and calculated levels to evaluate the strength and potential of the detected patterns.
Backtest: Use the strategy on historical data to see how it performs over different market conditions.
This indicator is ideal for traders looking for an automated, reliable way to identify potential trend reversals in any market and on any timeframe. It combines technical analysis with customizable risk management, making it a powerful tool for both novice and experienced traders.
Disclaimer:
This script is for educational purposes only. Trading involves substantial risk and is not suitable for every investor.
Bollinger Bands & SuperTrend Strategy by Tradinggg HubThis TradingView Pinescript combines Bollinger Bands and a custom SuperTrend indicator to generate trading signals.
Bollinger Bands:
Bollinger Bands are a popular volatility indicator that consists of three lines:
* Basis: A simple moving average (SMA) of the price (default length is 20 periods).
* Upper Band: The basis plus a standard deviation multiplier (default is 2).
* Lower Band: The basis minus a standard deviation multiplier (default is 2).
These bands expand and contract as volatility increases or decreases, helping traders identify potential overbought and oversold conditions.
SuperTrend:
The SuperTrend indicator is a trend-following tool that aims to identify the direction of the price trend. It uses the Average True Range (ATR) to determine the volatility of the market and sets levels above and below the price to indicate potential trend reversals.
How the Strategy Works:
1. Bollinger Bands: The script plots Bollinger Bands around the price, providing insight into the current volatility and potential overbought or oversold conditions.
2. SuperTrend: The script calculates and plots a custom SuperTrend indicator based on user-defined ATR period and factor. It helps visualize the current trend direction and potential trend reversals.
3. Buy Signals: A buy signal is generated when the following conditions are met:
- The price crosses above the SuperTrend line.
- The price is above the Bollinger Bands basis line.
4. Sell Signals: A sell signal is generated when one of the following conditions is met:
- The price crosses below the SuperTrend line.
- The price is below the Bollinger Bands basis line.
Key Parameters:
* Bollinger Bands Length: The number of periods used to calculate the basis (SMA) of the Bollinger Bands.
* Bollinger Bands Multiplier: The factor used to calculate the standard deviation for the upper and lower bands.
* SuperTrend ATR Period: The number of periods used to calculate the Average True Range (ATR) for the SuperTrend.
* SuperTrend Factor: The factor used to determine the distance of the SuperTrend levels from the price.
Customization:
Feel free to experiment with different parameter values to optimize the strategy for your preferred asset and time frame.
Disclaimer:
This script is intended for educational and informational purposes only. It should not be considered as financial advice. Always conduct thorough research and consider your own risk tolerance before making any trading decisions.
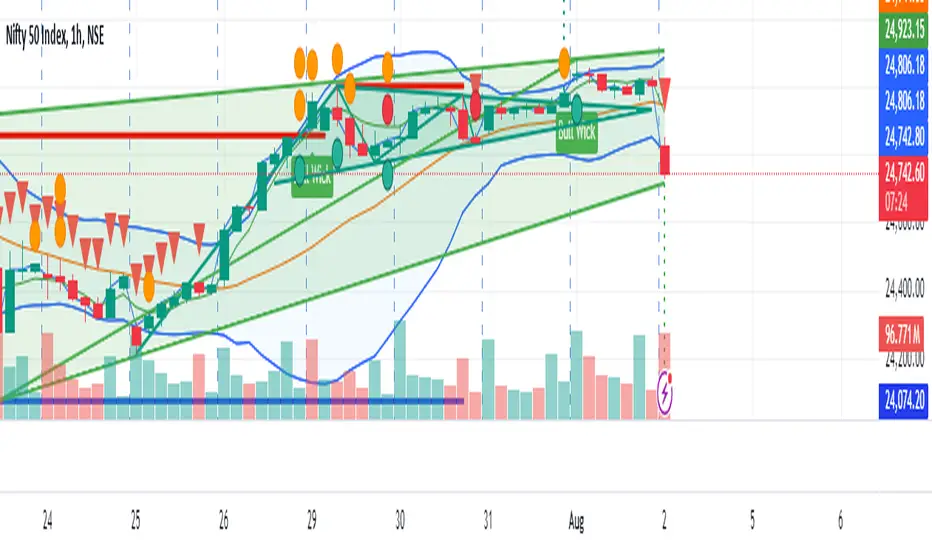
Support and resistance levels (Day, Week, Month) + EMAs + SMAs(ENG): This Pine 5 script provides various tools for configuring and displaying different support and resistance levels, as well as moving averages (EMA and SMA) on charts. Using these tools is an essential strategy for determining entry and exit points in trades.
Support and Resistance Levels
Daily, weekly, and monthly support and resistance levels play a key role in analyzing price movements:
Daily levels: Represent prices where a cryptocurrency has tended to bounce within the current trading day.
Weekly levels: Reflect strong prices that hold throughout the week.
Monthly levels: Indicate the most significant levels that can influence price movement over the month.
When trading cryptocurrencies, traders use these levels to make decisions about entering or exiting positions. For example, if a cryptocurrency approaches a weekly resistance level and fails to break through it, this may signal a sell opportunity. If the price reaches a daily support level and starts to bounce up, it may indicate a potential long position.
Market context and trading volumes are also important when analyzing support and resistance levels. High volume near a level can confirm its significance and the likelihood of subsequent price movement. Traders often combine analysis across different time frames to get a more complete picture and improve the accuracy of their trading decisions.
Moving Averages
Moving averages (EMA and SMA) are another important tool in the technical analysis of cryptocurrencies:
EMA (Exponential Moving Average): Gives more weight to recent prices, allowing it to respond more quickly to price changes.
SMA (Simple Moving Average): Equally considers all prices over a given period.
Key types of moving averages used by traders:
EMA 50 and 200: Often used to identify trends. The crossing of the 50-day EMA with the 200-day EMA is called a "golden cross" (buy signal) or a "death cross" (sell signal).
SMA 50, 100, 150, and 200: These periods are often used to determine long-term trends and support/resistance levels. Similar to the EMA, the crossings of these averages can signal potential trend changes.
Settings Groups:
EMA Golden Cross & Death Cross: A setting to display the "golden cross" and "death cross" for the EMA.
EMA 50 & 200: A setting to display the 50-day and 200-day EMA.
Support and Resistance Levels: Includes settings for daily, weekly, and monthly levels.
SMA 50, 100, 150, 200: A setting to display the 50, 100, 150, and 200-day SMA.
SMA Golden Cross & Death Cross: A setting to display the "golden cross" and "death cross" for the SMA.
Components:
Enable/disable the display of support and resistance levels.
Show level labels.
Parameters for adjusting offset, display of EMA and SMA, and their time intervals.
Parameters for configuring EMA and SMA Golden Cross & Death Cross.
EMA Parameters:
Enable/disable the display of 50 and 200-day EMA.
Color and style settings for EMA.
Options to use bar gaps and the "LookAhead" function.
SMA Parameters:
Enable/disable the display of 50, 100, 150, and 200-day SMA.
Color and style settings for SMA.
Options to use bar gaps and the "LookAhead" function.
Effective use of support and resistance levels, as well as moving averages, requires an understanding of technical analysis, discipline, and the ability to adapt the strategy according to changing market conditions.
(RUS) Данный Pine 5 скрипт предоставляет разнообразные инструменты для настройки и отображения различных уровней поддержки и сопротивления, а также скользящих средних (EMA и SMA) на графиках. Использование этих инструментов является важной стратегией для определения точек входа и выхода из сделок.
Уровни поддержки и сопротивления
Дневные, недельные и месячные уровни поддержки и сопротивления играют ключевую роль в анализе движения цен:
Дневные уровни: Представляют собой цены, на которых криптовалюта имела тенденцию отскакивать в течение текущего торгового дня.
Недельные уровни: Отражают сильные цены, которые сохраняются в течение недели.
Месячные уровни: Указывают на наиболее значимые уровни, которые могут влиять на движение цены в течение месяца.
При торговле криптовалютами трейдеры используют эти уровни для принятия решений о входе в позицию или закрытии сделки. Например, если криптовалюта приближается к недельному уровню сопротивления и не удается его преодолеть, это может стать сигналом для продажи. Если цена достигает дневного уровня поддержки и начинает отскакивать вверх, это может указывать на возможность открытия длинной позиции.
Контекст рынка и объемы торговли также важны при анализе уровней поддержки и сопротивления. Высокий объем при приближении к уровню может подтвердить его значимость и вероятность последующего движения цены. Трейдеры часто комбинируют анализ различных временных рамок для получения более полной картины и улучшения точности своих торговых решений.
Скользящие средние
Скользящие средние (EMA и SMA) являются еще одним важным инструментом в техническом анализе криптовалют:
EMA (Exponential Moving Average): Экспоненциальная скользящая средняя, которая придает большее значение последним ценам. Это позволяет более быстро реагировать на изменения в ценах.
SMA (Simple Moving Average): Простая скользящая средняя, которая равномерно учитывает все цены в заданном периоде.
Основные виды скользящих средних, которые используются трейдерами:
EMA 50 и 200: Часто используются для выявления трендов. Пересечение 50-дневной EMA с 200-дневной EMA называется "золотым крестом" (сигнал на покупку) или "крестом смерти" (сигнал на продажу).
SMA 50, 100, 150 и 200: Эти периоды часто используются для определения долгосрочных трендов и уровней поддержки/сопротивления. Аналогично EMA, пересечения этих средних могут сигнализировать о возможных изменениях тренда.
Группы настроек:
EMA Golden Cross & Death Cross: Настройка для отображения "золотого креста" и "креста смерти" для EMA.
EMA 50 & 200: Настройка для отображения 50-дневной и 200-дневной EMA.
Уровни поддержки и сопротивления: Включает настройки для дневных, недельных и месячных уровней.
SMA 50, 100, 150, 200: Настройка для отображения 50, 100, 150 и 200-дневных SMA.
SMA Golden Cross & Death Cross: Настройка для отображения "золотого креста" и "креста смерти" для SMA.
Компоненты:
Включение/отключение отображения уровней поддержки и сопротивления.
Показ ярлыков уровней.
Параметры для настройки смещения, отображения EMA и SMA, а также их временных интервалов.
Параметры для настройки EMA и SMA Golden Cross & Death Cross.
Параметры EMA:
Включение/отключение отображения 50 и 200-дневных EMA.
Настройки цвета и стиля для EMA.
Опции для использования разрыва баров и функции "LookAhead".
Параметры SMA:
Включение/отключение отображения 50, 100, 150 и 200-дневных SMA.
Настройки цвета и стиля для SMA.
Опции для использования разрыва баров и функции "LookAhead".
Эффективное использование уровней поддержки и сопротивления, а также скользящих средних, требует понимания технического анализа, дисциплины и умения адаптировать стратегию в зависимости от изменяющихся условий рынка.

EMA Cross Fibonacci Entry with RetracementThe EMA Cross Fibonacci Entry with Retracement is a trading strategy that combines two popular technical analysis tools: Exponential Moving Averages (EMAs) and Fibonacci retracement levels. Here's a brief overview of how this strategy typically works:
### Exponential Moving Averages (EMAs)
1. **EMAs Calculation**: EMAs give more weight to recent price data, making them more responsive to price changes. Commonly used periods for EMAs in this strategy are the 50-period and 200-period EMAs.
2. **EMA Cross**: The strategy looks for a "golden cross" (short-term EMA crosses above the long-term EMA) as a potential buy signal, and a "death cross" (short-term EMA crosses below the long-term EMA) as a potential sell signal.
### Fibonacci Retracement Levels
1. **Fibonacci Retracement**: This tool is used to identify potential support and resistance levels based on the Fibonacci sequence. The key retracement levels are 23.6%, 38.2%, 50%, 61.8%, and 78.6%.
2. **Drawing Retracement Levels**: Traders draw Fibonacci retracement levels from a significant peak to a significant trough (or vice versa) to identify potential retracement levels where the price might reverse.
### Combining EMA Cross with Fibonacci Retracement
1. **Identify EMA Cross**: First, traders look for an EMA cross. For example, a golden cross where a shorter EMA (e.g., 50 EMA) crosses above a longer EMA (e.g., 200 EMA) suggests a bullish trend.
2. **Wait for Retracement**: After identifying a cross, traders wait for the price to retrace to a Fibonacci level. The key levels to watch are 38.2%, 50%, and 61.8%.
3. **Entry Point**: The entry point is when the price retraces to a Fibonacci level and shows signs of reversal (e.g., bullish candlestick patterns, support at Fibonacci levels). This is typically when traders enter a long position.
4. **Confirmation with EMA**: Ensure that the EMAs support the trend. For a buy entry, the short-term EMA should remain above the long-term EMA.
### Example of a Bullish Entry
1. **Golden Cross**: 50 EMA crosses above 200 EMA.
2. **Retracement**: Price retraces to the 38.2% Fibonacci level.
3. **Entry Signal**: At the 38.2% level, a bullish candlestick pattern (e.g., hammer) forms, indicating potential support.
4. **Entry Point**: Enter a long position at the close of the bullish candlestick.
### Risk Management
1. **Stop Loss**: Place a stop loss below the next Fibonacci retracement level or below the recent swing low to limit potential losses.
2. **Take Profit**: Set a take profit target based on a risk-reward ratio, previous resistance levels, or further Fibonacci extensions.
### Conclusion
The EMA Cross Fibonacci Entry with Retracement strategy is a systematic approach to identifying entry points in a trending market. By combining the responsiveness of EMAs with the predictive power of Fibonacci retracement levels, traders aim to enter trades at optimal points, increasing their chances of success while managing risk effectively.
