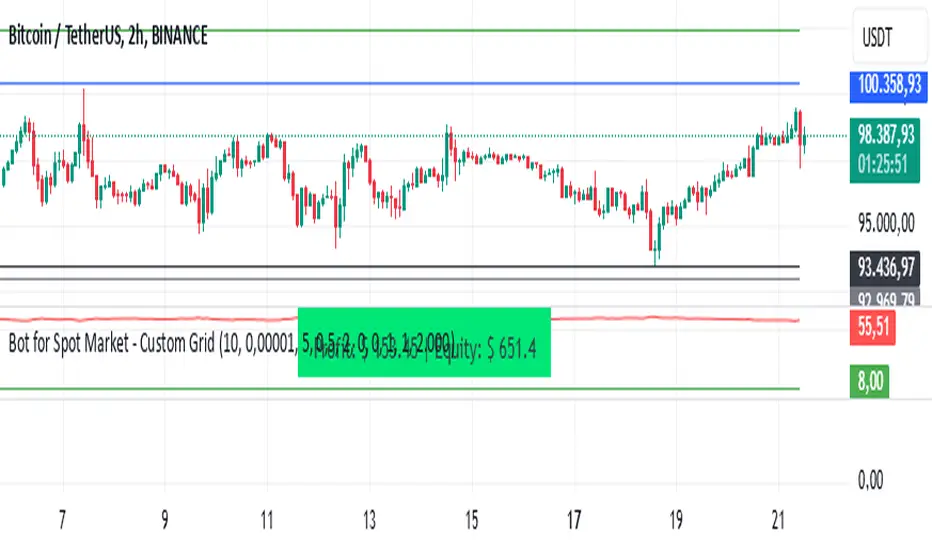
Bot for Spot Market - Custom GridThis script is designed to create a trading bot for the spot market, specifically for buying and selling bitcoins profitably. Recommended for timeframes above two hours. Here are the main functions and features of the script:
Strategy Setup: The bot is set up with a custom grid strategy, defining parameters like pyramiding (allowed number of simultaneous trades), margin requirements, commission, and initial capital.
Order Requirements: It calculates the order price and amount based on the minimum requirements set by the exchange and rounds them appropriately.
Entry Conditions: The bot makes new entries if the closing price falls a certain percentage below the last entry price. It continues to make entries until the closing price rises a certain percentage above the average entry price.
Targets and Plots:
It calculates and plots the target profit level.
It plots the average entry price and the last entry price.
It plots the next entry price based on the defined conditions.
It plots the maximum number of orders allowed based on equity and the number of open orders.
Timerange: The bot can start trading from a specific date and time defined by the user.
Entries: It places orders if the timerange conditions are met. It also places new orders if the closing price is below the last entry price by a defined percentage.
Profit Calculation: The script calculates open profit or loss for the open positions.
Exit Conditions: It closes all positions if the open profit is positive and the closing price is above the target profit level.
Performance Table: The bot maintains and displays statistics like the number of open and closed trades, net profit, and equity in a table format.
The script is customizable, allowing users to adjust parameters like initial capital, commission, order values, and profit targets to fit their specific trading needs and exchange requirements.
ค้นหาในสคริปต์สำหรับ "the script"
Bitcoin Momentum StrategyThis is a very simple long-only strategy I've used since December 2022 to manage my Bitcoin position.
I'm sharing it as an open-source script for other traders to learn from the code and adapt it to their liking if they find the system concept interesting.
General Overview
Always do your own research and backtesting - this script is not intended to be traded blindly (no script should be) and I've done limited testing on other markets beyond Ethereum and BTC, it's just a template to tweak and play with and make into one's own.
The results shown in the strategy tester are from Bitcoin's inception so as to get a large sample size of trades, and potential returns have diminished significantly as BTC has grown to become a mega cap asset, but the script includes a date filter for backtesting and it has still performed solidly in recent years (speaking from personal experience using it myself - DYOR with the date filter).
The main advantage of this system in my opinion is in limiting the max drawdown significantly versus buy & hodl. Theoretically much better returns can be made by just holding, but that's also a good way to lose 70%+ of your capital in the inevitable bear markets (also speaking from experience).
In saying all of that, the future is fundamentally unknowable and past results in no way guarantee future performance.
System Concept:
Capture as much Bitcoin upside volatility as possible while side-stepping downside volatility as quickly as possible.
The system uses a simple but clever momentum-style trailing stop technique I learned from one of my trading mentors who uses this approach on momentum/trend-following stock market systems.
Basically, the system "ratchets" up the stop-loss to be much tighter during high bearish volatility to protect open profits from downside moves, but loosens the stop loss during sustained bullish momentum to let the position ride.
It is invested most of the time, unless BTC is trading below its 20-week EMA in which case it stays in cash/USDT to avoid holding through bear markets. It only trades one position (no pyramiding) and does not trade short, but can easily be tweaked to do whatever you like if you know what you're doing in Pine.
Default parameters:
HTF: Weekly Chart
EMA: 20-Period
ATR: 5-period
Bar Lookback: 7
Entry Rule #1:
Bitcoin's current price must be trading above its higher-timeframe EMA (Weekly 20 EMA).
Entry Rule #2:
Bitcoin must not be in 'caution' condition (no large bearish volatility swings recently).
Enter at next bar's open if conditions are met and we are not already involved in a trade.
"Caution" Condition:
Defined as true if BTC's recent 7-bar swing high minus current bar's low is > 1.5x ATR, or Daily close < Daily 20-EMA.
Trailing Stop:
Stop is trailed 1 ATR from recent swing high, or 20% of ATR if in caution condition (ie. 0.2 ATR).
Exit on next bar open upon a close below stop loss.
I typically use a limit order to open & exit trades as close to the open price as possible to reduce slippage, but the strategy script uses market orders.
I've never had any issues getting filled on limit orders close to the market price with BTC on the Daily timeframe, but if the exchange has relatively low slippage I've found market orders work fine too without much impact on the results particularly since BTC has consistently remained above $20k and highly liquid.
Cost of Trading:
The script uses no leverage and a default total round-trip commission of 0.3% which is what I pay on my exchange based on their tier structure, but this can vary widely from exchange to exchange and higher commission fees will have a significantly negative impact on realized gains so make sure to always input the correct theoretical commission cost when backtesting any script.
Static slippage is difficult to estimate in the strategy tester given the wide range of prices & liquidity BTC has experienced over the years and it largely depends on position size, I set it to 150 points per buy or sell as BTC is currently very liquid on the exchange I trade and I use limit orders where possible to enter/exit positions as close as possible to the market's open price as it significantly limits my slippage.
But again, this can vary a lot from exchange to exchange (for better or worse) and if BTC volatility is high at the time of execution this can have a negative impact on slippage and therefore real performance, so make sure to adjust it according to your exchange's tendencies.
Tax considerations should also be made based on short-term trade frequency if crypto profits are treated as a CGT event in your region.
Summary:
A simple, but effective and fairly robust system that achieves the goals I set for it.
From my preliminary testing it appears it may also work on altcoins but it might need a bit of tweaking/loosening with the trailing stop distance as the default parameters are designed to work with Bitcoin which obviously behaves very differently to smaller cap assets.
Good luck out there!

Bullish Divergence Short-term Long Trade FinderThis script is a Bullish divergence trade finder built to find small periods where Bitcoin will likely rise from. It looks for bullish divergence followed by a higher low as long as the hour RSI value is below the 40 mark, if then it will enter an long. It marks out Buy signals on the RSI if the value dips below 'RSI Bull Condition Minimum' (Default 40) on the current time frame in view. It also marks out Sell signals found when the RSI is above the 'RSI Bearish Condition Minimum' (Default 50). The sell signals are bearish divergence that has occurred recently on the RSI. When a long is in play it will sell if it finds bearish divergence or the time frame in view reaches RSI value higher than the 'RSI Sell Value'(Default 75). You can set your stop loss value with the 'Stop loss Percentage' (default 5).
Available inputs:
RSI Period: relative strength measurement length(Typically 14)
RSI Oversold Level: the bottom bar of the RSI (Typically 30)
RSI Overbought Level: the top bar of the RSI (Typically 70)
RSI Bearish Condition Minimum: The minimum value the script will use to look for a pivot high that starts the Bearish condition to Sell (Default 50)
RSI Bearish Condition Sell Min: the minimum value the script will accept a bearish condition (Default 60)
RSI Bull Condition Minimum: the minimum value it will consider a pivot low value in the RSI to find a divergence buy (Default 40)
Look Back this many candles: the amount of candles thee script will look back to find a low value in the RSI (Default 25)
RSI Sell Value: The RSI value of the exit condition for a long when value is reached (Default 75)
Stop loss Percentage: Percentage value for amount to lose (Default 5)
The formula to enter a long is stated below:
If price finds a lower low and there is a higher low found following a lower low and price has just made another dip and price closes lower than the last divergence and Relative strength index hour value is less than 40 enter a long.
The formula to exit a long is stated below:
If the value drops below the stop loss percentage OR (the RSI value is greater than the value of the parameter 'RSI Sell Value' or bearish divergence is found greater than the parameter 'RSI Bearish Condition Minimum' )
This script was built from much strategy testing on BTC but works with alts (occasionally) also. It is most successful to my knowledge using the 15 min and 7 min time frames with default values. Hope it helps! Follow for further possible updates to this script or other entry or exit strategies.
snapshot:
I only have a Pro trading view account so I cannot share a larger data set about this script because the buy signals happen pretty rarely. The most amount that I could find within a view for me was 40 trades within a viewable time. The suggested/default parameters that I have do not occur very often so it limits the data set. Adjustments can be made to the parameters so that trades can be entered more often. The scripts success is dependent on the values of the parameters set by the user. This script was written to be used for BTC/USD or BTC/USDT trading. I am unable to share a larger dataset without putting out results that are intended to fail or having a premium account so reaching the 100 trade minimum is not possible with my account.

Simple SuperTrend Strategy for BTCUSD 4HHello guys!, If you are a swing trader and you are looking for a simple trend strategy, you should check this one. Based in the supertrend indicator, this strategy will help you to catch big movements in BTCUSD 4H and avoid losses as much as possible in consolidated situations of the market
This strategy was designed for BTCUSD in 4H timeframe
Backtesting context: 2020-01-02 to 2023-01-05 (The strategy has also worked in previous years)
Trade conditions:
Rules are actually simple, the most important thing is the risk and position management of this strategy
For long:
Once Supertrend changes from a downtrend to a uptrend, you enter into a long position. The stop loss will be defined by the atr stop loss
The first profit will be of 0.75 risk/reward ratio where half position will be closed. When this happens, you move the stop loss to break even.
Now, just will be there two situations:
Once Supertrend changes from a uptrend to a downtrend, you close the other half of the initial long position.
If price goes againts the position, the position will be closed due to breakeven.
For short:
Once Supertrend changes from a uptrend to a downtrend, you enter into a short position. The stop loss will be defined by the atr stop loss
The first profit will be of 0.75 risk/reward ratio where half position will be closed. When this happens, you move the stop loss to break even.
Like in the long position, just will be there two situations:
Once Supertrend changes from a downtrend to a uptrend, you close the other half of the initial short position.
If price goes againts the position, the position will be closed due to breakeven.
Risk management
For calculate the amount of the position you will use just a small percent of your initial capital for the strategy and you will use the atr stop loss for this.
Example: You have 1000 usd and you just want to risk 2,5% of your account, there is a long signal at price of 20,000 usd. The stop loss price from atr stop loss is 19,000. You calculate the distance in percent between 20,000 and 19,000. In this case, that distance would be of 5,0%. Then, you calculate your position by this way: (initial or current capital * risk per trade of your account) / (stop loss distance).
Using these values on the formula: (1000*2,5%)/(5,0%) = 500usd. It means, you have to use 500 usd for risking 2.5% of your account.
We will use this risk management for apply compound interest.
Script functions
Inside of settings, you will find some utilities for display atr stop loss, supertrend or positions.
You will find the settings for risk management at the end of the script if you want to change something. But rebember, do not change values from indicators, the idea is to not over optimize the strategy.
If you want to change the initial capital for backtest the strategy, go to properties, and also enter the commisions of your exchange and slippage for more realistic results.
Signals meanings:
L for long position. CL for close long position.
S for short position. CS for close short position.
Tp for take profit (it also appears when the position is closed due to stop loss, this due to the script uses two kind of positions)
Exit due to break even or due to stop loss
Some things to consider
USE UNDER YOUR OWN RISK. PAST RESULTS DO NOT REPRESENT THE FUTURE.
DEPENDING OF % ACCOUNT RISK PER TRADE, YOU COULD REQUIRE LEVERAGE FOR OPEN SOME POSITIONS, SO PLEASE, BE CAREFULL AND USE CORRECTLY THE RISK MANAGEMENT
The amount of trades closed in the backtest are not exactly the real ones. If you want to know the real ones, go to settings and change % of trade for first take profit to 100 for getting the real ones. In the backtest, the real amount of opened trades was of 194.
Indicators used:
Supertrend
Atr stop loss by garethyeo
This is the fist strategy that I publish in tradingview, I will be glad with you for any suggestion, support or advice for future scripts. Do not doubt in make any question you have and if you liked this content, leave a boost. I plan to bring more strategies and useful content for you!

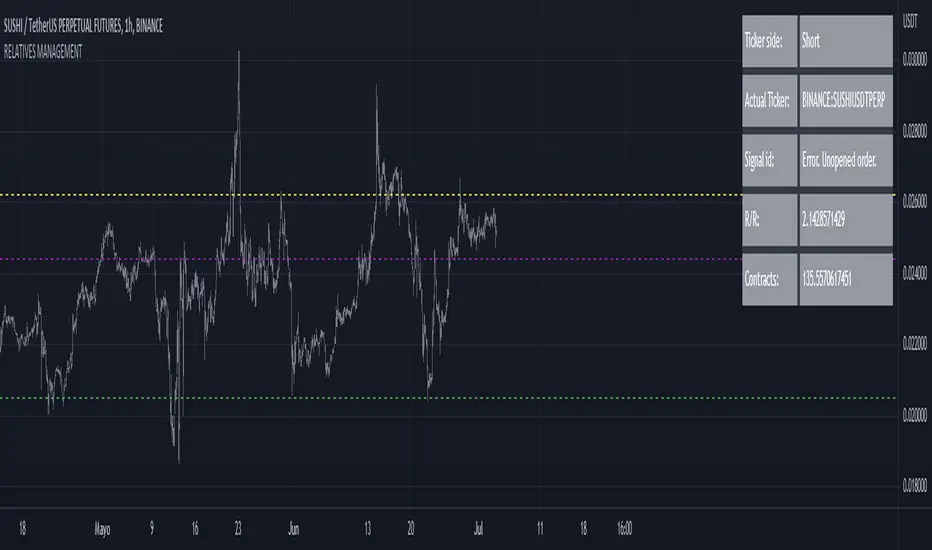
RELATIVE VALUE TRADE MANAGEMENT WEBHOOKThis script it's created to send open-close signals via webhook. It allows you to open a relative value position based in the relative graph. You can set the TP and SL levels and the script will send the signal to your exchange.
Due a pine limitations it is necessary apply the script in the 2 different actives and set the alerts. You can just do the relative analysis and then go to the first asset and set the script. Create your alert and then just go to the other asset and create the alert. It doesn't necessary to change anything in the script because the levels are the same.
It is also possible to do the analysis using the script, deploying the relative graph, but could be annoying sometimes due scales.
Positions will be placed at close always.
THIS IS IMPORTANT: I use Zignaly as a exhange so if you are using Binance or other YOU MUST CHANGE the code. If you know the JSON format that It requires would be easy.
Here is tips in all the important imputs. But let me explain the most important.
The MANDATORY fields are:
Ticker IDs: Here you must write the EXACT ID code for the active. Caps included.
Example : BINANCE:SUSHIUSDTPERP
It is also important select the correct market side. If you want to be long of ANY active you must write that ID in the LONG ID. For short positions is the same.
Time frame: Here you can select the time frame of the graph (not the current active graph, I mean the relative one.) The orders will be send using that time frame. I recommend to do the analysis in other window and then use the script to trigger the order in the time frame that you want.
Money management: In these fields you can select the qty that you will lose if the SL level is reach. Based in a determinated amount of currency or in a % of your capital.
Dates: It is important to select the start date. If the order is already open, we must look for the moment where the activation price was reached. If the order is unopened it is better to select the current date, so the order will be triggered when the entry level is reached.
Ids: If you have current open position you can set here that ID to send the correct order to the exchange.
To set the alert just call the function {{{strategy.order.alert_message}}}
Instrument-Z (3Commas Bot)Instrument-Z is what I am currently using as my 3Commas Bot.
It allows you to customize signals from 3 indicators; Crossing MA's, Stochastic RSI, and WaveTrend.
Better yet, it allows you to setup these signals separately depending on whether the Trend MA is going up or down.
So there are 2 sets of inputs for everything, Uptrend inputs and Downtrend inputs.
I have realized that we can't expect a strategy to work the same way in an uptrend vs downtrend, so the inputs should be separated too.
In my testing, separating increased the net profit by 60% on average.
You can select whether you are trading Long or Short.
You can choose your stop loss and take profit levels as well as trade expiration.
You can choose if you only want to trade with the trend (making the opposing signals irrelevant).
The trend is based on the Trend MA.
This script is specifically for cryptocurrencies.
I've noticed that MA crosses on other asset classes are unreliable because the fluctuations are not strong enough to push the MA's across each other in a meaningful way.
If you want to use this as a 3Commas Bot, then you will have to copy the code of the strategy and paste it into your own personal script.
Then you have to change the alert messages at the bottom of the script.
Make sure to change your alert message from this;
{"message_type": "bot", "bot_id": 0000000, "email_token": "0b000a0a-0aa0-00aa-0aa0-000a00000a0a", "delay_seconds": 0}
To this;
{\n\"message_type\": \"bot\",\n\"bot_id\": 0000000,\n\"email_token\": \"0a000a0a-0aa0-00aa-0aa0-000a00000a0a\",\n\"delay_seconds\": 0\n}
With \n after each new line and \ before each quotation.
In the Alert setup, select "alert() function calls only".
This indicator is like a middle ground of complexity between the Juicy Trend indicator and the Instrument-A indicator.
And because it does not feature my neural network project, I have made it open script.
Enjoy!

TradingGroundhog - Strategy & Fractal V1#-- Public Strategy - No Repaint - Fractals -- Short term
Here I come with another script, more simple than Wavetrend V1. You will love it.
#-- Synopsis --
Another simple idea, on a small time frame (15 min) we buy when the opening price goes below a Bottom fractals and sell when it goes over a Top fractals, but as this script do not use Wavetrends. You should stop by your self to use the script during long lasting downtrends.
I developed the strategy using BTC /EUR 3 MIN BINANCE but it can be applied to many other cryptos, I don't know for forex or others. You can use it for short term (to a month of uptrend) and automated trading.
#-- Graph reading --
And now, how to read it ?
Fractals:
Yellow Flags occur when the opening price goes below a Bottom fractal , it means Buy.
White Flags appear when the opening price goes over a Top fractal , it means Sell.
#-- Parameters --
*** Parameters have been intensively optimized using 10 cryptocurrency markets in order to have potent efficiency for each of them. I would recommend to only change the Can Be touch parameter. For the others, I don't recommend any modifications. The idea behind the script is to be able to switch between markets without having to optimize parameters, less work, easy to target active crypto and therefor limit the risks. ***
Can be touch :
'Filter fractals' : Activate or Disable the filtering fractal operation. If Enable, buy during less risky periods. (Activate is often better)
Can be touch but not necessary :
'VolumeMA' : The Volume corrector used by the fractals
'Extreme window' : The number of price individuals to look for if we want to remove extreme fractals.
Not to touch :
'Long Sop Loss (%)' : The minimal difference of price between a Fractal bottom and the opening price to buy.
#-- Time frame --
Should be used with the following time frames depending on the necessity:
1 MIN
3 MIN (Preferred with the parameters set)
5 MIN
#-- Last words --
The script can be set up to send Tradingview signals to 3comma just by adding comment = " " in strategy.close_all() and strategy.entry().
Good trades !
Disclaimer (As it should always be one to any script)
***
This script is intended for and only to be used for personal purposes only. No such information provided by it constitutes advice or a recommendation for any investment or trading strategy for any specific person. There is no guarantee presented or implied as to the accuracy of specific forecasts, projections, or predictive statements offered by the script. Users of the script agree that its original developer does not take responsibility for any of your investment decisions. Please seek professional advice before trading.
***
# Here are the results from the 20rst of September 2021 with 100% of equity on the BTC /EUR 3 Min and with a capital of 10 000 EUR. So almost, one month.
# As I saw, it goes from +30% to more than +160% (the great SHIB) depending on the selected crypto. It may be negative if you spot a downtrend.

TradingGroundhog - Strategy & Wavetrend V2#-- Public Strategy - No Repaint - Fractals - Wavetrend --
Here I come with another script, a nice and simple strategy based on fractals and Wavetrends.
#-- Synopsis --
A simple idea, on a small time frame (15 min) we buy when the opening price goes below a Bottom fractals and sell when it goes over a Top fractals, but in order to avoid bad and evil downtrends, we use Wavetrends based on a Daily time frame. From it, Tops and Bottoms are extracted. If the opening price goes above Wavetrend Tops, no trades will be conducted during the day. If the price goes below Wavetrend bottoms, no trades will be executed from 1 to N days, until a new Wavetrend bottom is generated.
I developed the strategy using BTC /EUR 15 MIN BINANCE but it can be applied to many other cryptos, I don't know for forex or others. You can use it for long term and automated trading, I implemented the Wavetrend indicator to do so, or for short term if you have spot a long coming uptrend. Test it, look at its profit and long or short period on your crypto of choice.
#-- Graph reading --
And now, how to read it ?
Wavetrends:
Red Backgrounds are associated to No Trade periods. These periods occur when the price goes below a Wavetrend bottom or above a Wavetrend Top. They are here to limit the loss.
Blue Gradient lines represent the past Tops. For each bar, only the increasing values of the Wavetrend tops are acquired. Going from light to dark blue based on the age of the Tops. Thus, if on line goes from dark to light, this means the price is approaching a previous Wavetrend top. In the opposite, if it darken, thus the price say 'buy buy' and go dropping.
Yellow Gradient lines represent the past Bottoms. They are based on the same principe that the blue lines.
Fractals:
Yellow Flags occur when the opening price goes below a Bottom fractal , it means Buy.
White Flags appear when the opening price goes over a Top fractal , it means Sell.
#-- Parameters --
*** Parameters have been intensively optimized using 10 cryptocurrency markets in order to have potent efficiency for each of them. I would recommend to only change the Can Be touch parameter. For the others, I don't recommend any modifications. The idea behind the script is to be able to switch between markets without having to optimize parameters, less work, easy to target active crypto and therefor limit the risks. ***
Can be touch :
'Combined Smoothness' : The number of open individuals used by the Wavetrend. (6 or 9, often 9 is better but with less volatile crypto it will be 6)
'Filter fractals' : Activate or Disable the filtering fractal operation. If Enable, buy during less risky periods. (Disable is often better)
Can be touch but not necessary :
'VolumeMA' : The Volume corrector used by the fractals
'Extreme window' : The number of price individuals to look for if we want to remove extreme fractals.
Not to touch :
'Limit_candle to look on' : Number of candles to use to compute the Wavetrend Tops and Bottoms.
'Length top bottom drawn' : Size of the lines
'Long Sop Loss (%)' : The minimal difference of price between a Fractal bottom and the opening price to buy.
#-- Time frame --
Should be used with the following time frames depending on the necessity:
1 MIN
3 MIN (Interesting for short term profit, may need some parameter ajustements)
5 MIN
15 MIN (Preferred for long term profit, the script was developed on it)
#-- Last words --
The script can be set up to send Tradingview signals to 3comma just by adding comment = " " in strategy.close_all() and strategy.entry().
Good trades !
Disclaimer (As it should always be one to any script)
***
This script is intended for and only to be used for personal purposes only. No such information provided by it constitutes advice or a recommendation for any investment or trading strategy for any specific person. There is no guarantee presented or implied as to the accuracy of specific forecasts, projections, or predictive statements offered by the script. Users of the script agree that its original developer does not take responsibility for any of your investment decisions. Please seek professional advice before trading.
***
# Here are the results from the 1rst of July 2021 with 100% of equity on the BTC /EUR 15 Min and with a capital of 1 000 EUR.
# As I saw, it goes from +20% to more than +100% depending on the selected crypto. Sometimes it's negative but it's quite rare on crypto using the EUR.

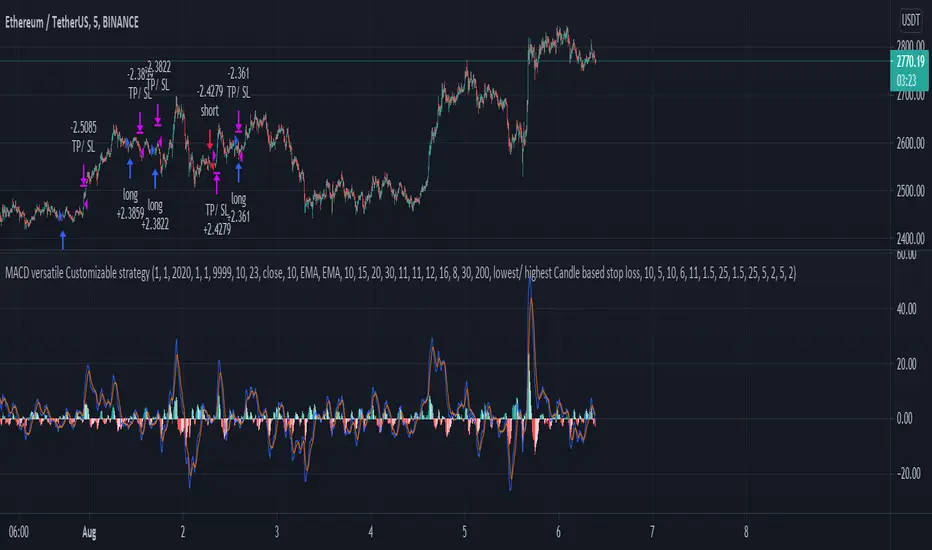
MACD, EMA, Know sure thing, Chopy Market - high adaptabilityHey there :)
This is the free version of the script. The following indicators / settings are missing:
- Support and resistance zones
- dynamic textboxes for alarms when using bots (3 Commas, Alertatron, etc.)
- a table showing the current position, indicators and other important information
With this script there is the possibility to completely customize the MACD . Starting with the MACD and signal line, the histogram and the color of the histogram.
Since the Pinecoders team has previously deleted the script, I will mention the fee settings in a bit more detail:
In this script a fee of 0.01% and a slipage of 15 was used. With each trade the total capital (100%) is used with a risk reward of 1 to 1.5.
The total capital, i.e. the risk, can be changed at any time under the "Settings" tab at "Equity".
I also added an EMA , the Know sure thing indicator and the Chopy Market indicator (by TradingRush) to the script to filter out bad trades.
The EMA:
Since the EMA is very reliable and shows whether there is an upward or downward trend, it should be used with the indicators in any case. It prevents long trades in downward movements and vice versa.
The KST Indicator:
The KST indicator has a similar movement as the MACD, but is by and large a bit more time delayed. It filters out false swings of the MACD and thus prevents bad trades.
The Chopy Market Indicator by Tradingrush:
The Chopy Market indicator, which was introduced by TradingRush in one of its videos, has the ability to detect sideways markets and block zones below this line for trades by means of a fixed value (the line).
To exit the trades, I added the following options:
ATR Exits. Exits based on past candles (lowest low, highest high).
Static exits based on set percentages.
In the next days I will create a tutorial for the script, just have a look on my profile.
If you have any questions about the script, let me know.
SuperTrend - Custom Screener and Dynamic AlertsTrading View today published a desktop Bad Internet connection indicator ?! which set me thinking…
Despite recently introduced Dynamic Alerts many scripts do not leverage the information available for active traders and traders on the GO!
So decided to share this script totally ALERT focused on one of the most popular DAY trading indicators.
Of course no more BAD internet problem as long your TV APP is configured , you will have enough data for a mental picture of the chart..
The Alerts give you the BAR Close , %percent gain or loss over previous day CLOSE ++ Previous Day High and Low to effectively plan your trade without a chart!(just in case)
2 additions in the way Alerts are delivered over the last script :
1. You get SUMMARY alerts or concatenated alerts by default , however if you uncomment or activate code lines 48 and 55 you will get individual Stock alerts Too!
2. Summary Alerts will come only if there is some Buy or Sell signal NO more empty Alerts!
Few useful EXTRAS in the code :
1. Flexible code can convert any indicator to screener or Alert function.
2. You will NOT get Mutable Variable error while converting any indicator to screener as long as the function is in "GLOBAL" scope..
3. Many Custom Screeners are available but few give OHLC data in output so easily…and very difficult for traders to MODIFY hundreds of lines of code..
4. For UP or DOWN on SCREEN Stock monitoring copy /paste functions in line 41 and 42 in lieu of CROSS functions in 44 and 51 respectively..
5. You can also uncomment/activate lines 66 and 67 for labels in monitoring.
6. The default mode of the scripts is set to Alerts!
Max Stocks only 20!
Finally idea is to help traders to use the great features that TV works so hard to create and constantly improvise.
Enjoy Profitable Trading on the Fly !!

CHOP Zone Entry Strategy + DMI/PSAR ExitThis is a Strategy with associated visual indicators and Long/Short and Reverse/Close Position Alerts for the Choppiness Index (CHOP) . It is used to determine if the market is choppy (trading sideways) or not choppy (trading within a trend in either direction). CHOP is not directional, so a DMI script was ported into this strategy to allow for trend confirmation and direction determination; it consists of an Average Directional Index (ADX) , Plus Directional Indicator (+DI) and Minus Directional Indicator (-DI) . In addition, a Parabolic SAR is also included to act as a trailing stop during any strong trends.
Development Notes
---------------------------
This indicator, and most of the descriptions below, were derived largely from the TradingView reference manual. Feedback and suggestions for improvement are more than welcome, as well are recommended Input settings and best practices for use.
www.tradingview.com
www.tradingview.com
www.tradingview.com
Recommend using the below DMI and PSAR indicators in conjunction with this script to fully visualize and understand how entry and exit conditions are chosen. Variable inputs should correlate between the scripts for uniformity and visual compatibility.
THANKS to LazyBear and his Momentum Squeeze script for helping me quickly develop a momentum state model for coloring the Chop line by trend.
Strategy Description
---------------------------
CHOP produces values that determine whether the market is choppy or trending . The closer the value is to 100 , the higher the choppiness levels , while the closer it is to 0 , the stronger the market is trending . Territories for both levels, and their associated upper and lower thresholds, are popularly defined using the Fibonacci Retracements, 61.8 and 38.2.
Basic Use
---------------------------
CHOP is often used to confirm the market condition to help you stay out of sideways markets and only enter when there is movement or imminent explosions. When readings are above the upper threshold, continued sideways movement may be expected, while readings below the lower threshold are typically indicative of a continuing trend. It is also used to anticipate upcoming trendiness changes, with the general belief that extended periods of consolidation (sideways movement) are followed by extended periods of strong, trending, directional movement, and vice versa.
One limitation in this index is that you must be cautious in deciding whether the range or trend will likely continue, or if it will reverse.
Confidence in price action and trend is higher when two or more indicators are in agreement -- while this strategy combines CHOP with both DMI and PSAR, we would still recommend pairing with other indicators to determine entry or exit trade opportunities.
Recommend also choosing 'Once Per Bar Close' when creating alerts.
Inputs
---------------------------
Strategy Direction - an option to only trade Short, Long, Both, or only in the direction of the Trend (Follow Trend is the Default).
Sensitivity - an incremental variable to test whether the past n candles are in the same trend state before triggering a delayed long or short alert (1 is the Default). Can help filter out noise and reduces active alerts.
Show Chop Index - two visual styles are provided for user preference, a visible Chop line with a background overlay, or a compact column and label only view.
Chop Lookback Period - the time period to be used in calculating CHOP (14 is the Default).
Chop Offset - changing this number will move the CHOP either forwards or backwards relative to the current market (0 is the Default).
Smooth Chop Line and Length - if enabled, the entered time period will be used in calculating a smooth average of the index (Enabled and 4 are the Defaults).
Color Line to Trend Direction - toggles whether the index line is colored to visually depict the current trend direction (Enabled is the Default).
Color Background - toggles the visibility of a background color based on the index state (Enabled is the Default).
Enable DMI Option - if enabled, then entry will be confirmed by and dependent on the ADX Key Level, with any close or reversal confirmed by both ADX and +/-DI to determine whether there is a strong trend present or not (Enabled is the Default).
ADX Smoothing - the time period to be used in calculating the ADX which has a smoothing component (14 is the Default).
DI Length - the time period to be used in calculating the DI (14 is the Default).
ADX Key Level - any trade with the ADX above the key level is a strong indicator that it is trending (23 to 25 is the suggested setting).
Enable PSAR Option - enables trailing stop loss orders (Enabled is the Default).
PSAR Start - the starting value for the Acceleration Force (0.015 is our chosen Default, 0.02 is more common).
PSAR Increment - the increment in which the Acceleration Force will move (0.001 is our chosen Default, 0.02 is more common).
PSAR Max Value - the maximum value of the Acceleration Factor (0.2 is the Default).
Color Candles Option - an option to transpose the CHOP condition levels to the main candle bars. Note that the outer red and green border will still be distinguished by whether each individual candle is bearish or bullish during the specified timeframe.
Note too that if both DMI and PSAR are deselected, then close determinations will default to a CHOP reversal strategy (e.g., close long when below 38.2 and close short when above 61.8). Though if either DMI or PSAR are enabled, then the CHOP reversal for close determination will automatically be disabled.
Indicator Visuals
---------------------------
For the candle colors, black indicates tight chop (45 to 55), yellow is loose chop (38.2 to 45 and 55 to 61.8), dark purple is trending down (< 38.2), and dark blue is trending up (> 61.8).
The background color has additional shades to differentiate a wider range of more levels…
• < 30 is dark purple
• 30 to 38.2 is purple
• 38.2 to 45 is light purple
• 45 to 55 is black
• 55 to 61.8 is light blue
• 61.8 to 70 is blue
• > 70 is dark blue
Long, Short, Close, and Reverse labels are plotted on the Chop line, which itself can be colored based on the trend. The chop line can also be hidden for a clean and compact, columnar view, which is my preferred option (see example image below).
Visual cues are intended to improve analysis and decrease interpretation time during trading, as well as to aid in understanding the purpose of this strategy and how its inclusion can benefit a comprehensive trading plan.
DMI and Trend Strength
---------------------------
To analyze trend strength, the focus should be on the ADX line and not the +DI or -DI lines. An ADX reading above 25 indicates a strong trend , while a reading below 20 indicates a weak or non-existent trend . A reading between those two values would be considered indeterminable. Though what is truly a strong trend or a weak trend depends on the financial instrument being examined; historical analysis can assist in determining appropriate values.
DMI exits trade when ADX is below the user selected key level (e.g., default is 25) and when the +/- DI lines cross (e.g., -DI > +DI exits long position and +DI > -DI exits short position).
PSAR and Trailing Stop
---------------------------
PSAR is a time and price based indicator that excels at measuring direction and duration, though not the actual strength of a trend, which is why we use this in conjunction with DMI. It is also included in this script as a trailing stop option to maximize gains during strong trends and to mitigate any false ADX strengthening signals.
This creates a parabola that is located below the candle during a Bullish trend and above during a Bearish trend. A buy or reversal is signaled when the price crosses above or below the Parabolic SAR.
Long/Short Entry
---------------------------
1. CHOP must be over 61.8 (long) or under 38.2 (short).
2. If DMI is enabled, then the ADX signal line must be above the user selected Key Level (default is 25).
3. If Sensitivity is selected, then that past candle must meet the criteria in step 1, as well as all the intermediate candles in between.
4. If "Follow Trend" is selected and PSAR is enabled, then a long position can only open when the momentum and PSAR are in an uptrend, or short when both are in a downtrend, to include all intermediate candles if the Sensitivity option is set on a past candle.
Close/Reverse
---------------------------
1. If DMI is enabled, then a close flag will be raised when the ADX signal drops below the Key Level (of 25), and -DI crosses over +DI (if long), or +DI crosses over -DI (if short).
2. If PSAR is enabled, then a close flag will be raised when the current trend state is opposite the last state.
3. If both DMI and PSAR are disabled, then a close flag will be raised if the Chop line drops under 38.2 (if long) or goes over 61.8 (if short).
4. If a Long or Short Entry is triggered on the same candle as any of the above close flags, then the position will be reversed, else the position will be closed.
Strategy Alerts
---------------------------
1. Long Entry
2. Short Entry
3. Reverse
4. Close
The provided backtest result is based on a position sizing of 10% equity with 100k initial capital. When testing SPX, disabling the DMI performed the best, but EURUSD performed poorly without it enabled, and TSLA had a small reduction in net profit. Timeframe likewise differed between commodities with TSLA performing best at 30M, SPX at 15M, and EURUSD at 4H. I do not plan on using this as a standalone strategy, but I also was expecting better results with the inclusion of EMI and PSAR to compliment the CHOP. Key elements of this script will likely be included in future, more holistic strategies.
Disclaimer
---------------------------
Past performance may not be indicative of future results. Due to various factors, including changing market conditions, the strategy may no longer perform as well as in historical backtesting. This post and the script are not intended to provide any financial advice. Trade at your own risk.
No known repainting, though there may be if an offset is introduced in the Inputs. I did my best not to code any other variables that repaint, but cannot fully attest to this fact.

Strategy: HMA 50 + Supertrend SniperHMA 50 + Supertrend Confluence Strategy (Trend Following with Noise Filtering)
Description:
Introduction and Concept This strategy is designed to solve a common problem in trend-following trading: Lag vs. False Signals. Standard Moving Averages often lag too much, while price action indicators can generate false signals during choppy markets. This script combines the speed of the Hull Moving Average (HMA) with the volatility-based filtering of the Supertrend indicator to create a robust "Confluence System."
The primary goal of this script is not just to overlay two indicators, but to enforce a strict rule where a trade is only taken when Momentum (HMA) and Volatility Direction (Supertrend) are in perfect agreement.
Why this combination? (The Logic Behind the Mashup)
Hull Moving Average (HMA 50): We use the HMA because it significantly reduces lag compared to SMA or EMA by using weighted calculations. It acts as our primary Trend Direction detector. However, HMA can be too sensitive and "whipsaw" during sideways markets.
Supertrend (ATR-based): We use the Supertrend (Factor 3.0, Period 10) as our Volatility Filter. It uses Average True Range (ATR) to determine the significant trend boundary.
How it Works (Methodology) The strategy uses a boolean logic system to filter out low-quality trades:
Bullish Confluence: The HMA must be rising (Slope > 0) AND the Close Price must be above the Supertrend line (Uptrend).
Bearish Confluence: The HMA must be falling (Slope < 0) AND the Close Price must be below the Supertrend line (Downtrend).
The "Choppy Zone" (Noise Filter): This is a unique feature of this script. If the HMA indicates one direction (e.g., Rising) but the Supertrend indicates the opposite (e.g., Downtrend), the market is considered "Choppy" or indecisive. In this state, the script paints the candles or HMA line Gray and exits all positions (optional setting) to preserve capital.
Visual Guide & Signals To make the script easy to interpret for traders who do not read Pine Script, I have implemented specific visual cues:
Green Cross (+): Indicates a LONG entry signal. Both HMA and Supertrend align bullishly.
Red Cross (X): Indicates a SHORT entry signal. Both HMA and Supertrend align bearishly.
Thick Line (HMA): The main line changes color based on the trend.
Green: Bullish Confluence.
Red: Bearish Confluence.
Gray: Divergence/Choppy (No Trade Zone).
Thin Step Line: This is the Supertrend line, serving as your dynamic Trailing Stop Loss.
Strategy Settings
HMA Length: Default is 50 (Mid-term trend).
ATR Factor/Period: Default is 3.0/10 (Standard for trend catching).
Exit on Choppy: A toggle switch allowing users to decide whether to hold through noise or exit immediately when indicators disagree.
Risk Warning This strategy performs best in trending markets (Forex, Crypto, Indices). Like all trend-following systems, it may experience drawdown during prolonged accumulation/distribution phases. Please backtest with your specific asset before using it with real capital.

Super-AO with Risk Management Strategy Template - 11-29-25Super-AO Strategy with Advanced Risk Management Template
Signal Lynx | Free Scripts supporting Automation for the Night-Shift Nation 🌙
1. Overview
Welcome to the Super-AO Strategy. This is more than just a buy/sell indicator; it is a complete, open-source Risk Management (RM) Template designed for the Pine Script community.
At its core, this script implements a robust swing-trading strategy combining the SuperTrend (for macro direction) and the Awesome Oscillator (for momentum). However, the real power lies under the hood: a custom-built Risk Management Engine that handles trade states, prevents repainting, and manages complex exit conditions like Staged Take Profits and Advanced Adaptive Trailing Stops (AATS).
We are releasing this code to help traders transition from simple indicators to professional-grade strategy structures.
2. Quick Action Guide (TL;DR)
Best Timeframe: 4 Hours (H4) and above. Designed for Swing Trading.
Best Assets: "Well-behaved" assets with clear liquidity (Major Forex pairs, BTC, ETH, Indices).
Strategy Type: Trend Following + Momentum Confirmation.
Key Feature: The Risk Management Engine is modular. You can strip out the "Super-AO" logic and insert your own strategy logic into the template easily.
Repainting: Strictly Non-Repainting. The engine calculates logic based on confirmed candle closes.
3. Detailed Report: How It Works
A. The Strategy Logic: Super-AO
The entry logic is based on the convergence of two classic indicators:
SuperTrend: Determines the overall trend bias (Green/Red).
Awesome Oscillator (AO): Measures market momentum.
The Signal:
LONG (+2): SuperTrend is Green AND AO is above the Zero Line AND AO is Rising.
SHORT (-2): SuperTrend is Red AND AO is below the Zero Line AND AO is Falling.
By requiring momentum to agree with the trend, this system filters out many false signals found in ranging markets.
B. The Risk Management (RM) Engine
This script features a proprietary State Machine designed by Signal Lynx. Unlike standard strategies that simply fire orders, this engine separates the Signal from the Execution.
Logic Injection: The engine listens for a specific integer signal: +2 (Buy) or -2 (Sell). This makes the code a Template. You can delete the Super-AO section, write your own logic, and simply pass a +2 or -2 to the RM_EngineInput variable. The engine handles the rest.
Trade States: The engine tracks the state of the trade (Entry, In-Trade, Exiting) to prevent signal spamming.
Aggressive vs. Conservative:
Conservative Mode: Waits for a full trend reversal before taking a new trade.
Aggressive Mode: Allows for re-entries if the trend is strong and valid conditions present themselves again (Pyramiding Type 1).
C. Advanced Exit Protocols
The strategy does not rely on a single exit point. It employs a "Layered Defense" approach:
Hard Stop Loss: A fixed percentage safety net.
Staged Take Profits (Scaling Out): The script allows you to set 3 distinct Take Profit levels. For example, you can close 10% of your position at TP1, 10% at TP2, and let the remaining 80% ride the trend.
Trailing Stop: A standard percentage-based trailer.
Advanced Adaptive Trailing Stop (AATS): This is a highly sophisticated volatility stop. It calculates market structure using Hirashima Sugita (HSRS) levels and Bollinger Bands to determine the "floor" and "ceiling" of price action.
If volatility is high: The stop loosens to prevent wicking out.
If volatility is low: The stop tightens to protect profit.
D. Repainting Protection
Many Pine Script strategies look great in backtesting but fail in live trading because they rely on "real-time" price data that disappears when the candle closes.
This Risk Management engine explicitly pulls data from the previous candle close (close , high , low ) for its calculations. This ensures that the backtest results you see match the reality of live execution.
4. For Developers & Modders
We encourage you to tear this code apart!
Look for the section titled // Super-AO Strategy Logic.
Replace that block with your own RSI, MACD, or Price Action logic.
Ensure your logic outputs a 2 for Buy and -2 for Sell.
Connect it to RM_EngineInput.
You now have a fully functioning Risk Management system for your custom strategy.
5. About Signal Lynx
Automation for the Night-Shift Nation 🌙
This code has been in action since 2022 and is a known performer in PineScript v5. We provide this open source to help the community build better, safer automated systems.
If you are looking to automate your strategies, please take a look at Signal Lynx in your search.
License: Mozilla Public License 2.0 (Open Source). If you make beneficial modifications, please release them back to the community!

VWAP & Band Cross Strategy v6 - AdvancedThese are a few updates made to the original script. The daily take profit and stop loss functions correctly for 1 contract but because of the pyramiding input even if not used you'll need to multiply the values by the number of contracts to keep consistent results. I have been unable to correct that function. Let me know if you test the script and have any recommendations for improvement. If trading an actual account I do recommend setting hard daily limits with your provider because there is still slippage from the original exit alerts even with the daily stop loss in place.
1. Real-Time Execution & Hard PnL Limits (The Focus)
The most critical changes were implemented to ensure the daily profit and loss limits act as hard, real-time barriers instead of waiting for the candle to close.
• Intrabar Tick Execution: The parameter calc_on_every_tick=true was added to the strategy() declaration. This forces the entire script to re-evaluate its logic on every single price update (tick), enabling immediate action.
• Real-Time PnL Tracking: The PnL calculation was updated to track the total_daily_pnl by summing the realized profit/loss (from closed trades) and the unrealized profit/loss (strategy.openprofit) on every tick.
• Immediate Closure: The script now checks the total_daily_pnl against the user-defined limits (daily_take_profit_value, daily_stop_loss_value) and immediately executes strategy.close_all() the moment the threshold is breached, preventing further trading.
• Combined Risk Enforcement: The user-defined "Max Intraday Risk ($)" and the "Daily Stop Loss (Value)" are compared, and the script enforces the tighter of the two limits.
2. Visibility and External Alerting
To address the unavoidable issue of slippage (which causes price overshoot in fast markets even with tick execution), dedicated alert mechanisms were added.
• Dedicated Alert Condition: An alertcondition named DAILY PNL LIMIT REACHED was added. This allows you to set up a TradingView alert that triggers the instant the daily_limit_reached variable turns true, giving you the fastest possible notification.
• Visual Marker: A large red triangle (\u25b2) is plotted on the chart using plotchar at the exact moment the daily limit condition is met, providing a clear visual confirmation of the trigger bar.
3. Strategy Features and Input Flexibility
Several user-requested features were integrated to make the strategy more robust and customizable.
• Trailing Stop / Breakeven (TSL/BE): A new exit option, Fixed Ticks + TSL, was added, allowing you to set a fixed profit target while also deploying a trailing stop or breakeven level based on points/ticks gained.
• Multiple Exit Types: The exit strategy was expanded to include logic for several types: Fixed Ticks, ATR-based, Capped ATR-based, VWAP Cross, and Price/Band Crosses.
• Pyramiding Control: An input Max Pyramiding Entries was introduced to control how many positions the strategy can have open at the same time.
• Confirmation Logic Toggle: Added an input to choose how multiple confirmation indicators (RSI, SMMA, MACD) are combined: "AND" (all must be true) or "OR" (at least one must be true).
• Indicator Confirmations: Logic for three external indicators—RSI, SMMA (EMA), and MACD—was fully integrated to act as optional filters for entry.
• VWAP Reset Anchors: Logic was corrected to properly reset the VWAP calculation based on the selected period ("Daily", "Weekly", or "Session") by using Pine Script v6's required anchor series.
Trading Day Filters: Inputs were added to select which specific days of the week the strategy is allowed to trade.

MicuRobert EMA Cross StrategyThis is a repost of a old strategy that cant be updated anymore, it was a request for a user made in Oct, 6, 2015
Here's a possible engaging description for the tradingview script:
**MicuRobert EMA Cross V2: A Powerful Trading Strategy**
Join the ranks of successful traders with this advanced strategy, designed to help you profit from market trends. The MicuRobert EMA Cross V2 combines two essential indicators - Exponential Moving Average (EMA) and Divergence EMA (DEMA) - to generate buy and sell signals.
**Key Features:**
* **Trading Session Filter**: Only trade during your preferred session, ensuring you're in sync with market conditions.
* **Trailing Stop**: Automatically adjust stop-loss levels to lock in profits or limit losses.
* **Customizable Trade Size**: Set the size of each trade based on your risk tolerance and trading goals.
**How it Works:**
The script uses two EMAs (5-period and 34-period) to identify trends. When the shorter EMA crosses above the longer one, a buy signal is generated. Conversely, when the shorter EMA falls below the longer one, a sell signal is triggered. The strategy also incorporates divergence analysis between price action and the EMAs.
**Visual Aids:**
* **EMA Plots**: Visualize the two EMAs on your chart to gauge market momentum.
* **Buy/Sell Signals**: See when buy or sell signals are generated, along with their corresponding entry prices.
* **Trailing Stop Lines**: Monitor stop-loss levels as they adjust based on price action.
**Get Started:**
Download this script and start trading like a pro! With its robust features and customizable settings, the MicuRobert EMA Cross V2 is an excellent addition to any trader's arsenal.
~Llama3

STRATEGY Fibonacci Levels with High/Low Criteria - AYNET
Here is an explanation of the Fibonacci Levels Strategy with High/Low Criteria script:
Overview
This strategy combines Fibonacci retracement levels with high/low criteria to generate buy and sell signals based on price crossing specific thresholds. It utilizes higher timeframe (HTF) candlesticks and user-defined lookback periods for high/low levels.
Key Features
Higher Timeframe Integration:
The script calculates the open, high, low, and close values of the higher timeframe (HTF) candlestick.
Users can choose to calculate levels based on the current or the last HTF candle.
Fibonacci Levels:
Fibonacci retracement levels are dynamically calculated based on the HTF candlestick's range (high - low).
Users can customize the levels (0.000, 0.236, 0.382, 0.500, 0.618, 0.786, 1.000).
High/Low Lookback Criteria:
The script evaluates the highest high and lowest low over user-defined lookback periods.
These levels are plotted on the chart for visual reference.
Trade Signals:
Long Signal: Triggered when the close price crosses above both:
The lowest price criteria (lookback period).
The Fibonacci level 3 (default: 0.5).
Short Signal: Triggered when the close price crosses below both:
The highest price criteria (lookback period).
The Fibonacci level 3 (default: 0.5).
Visualization:
Plots Fibonacci levels and high/low criteria on the chart for easy interpretation.
Inputs
Higher Timeframe:
Users can select the timeframe (default: Daily) for the HTF candlestick.
Option to calculate based on the current or last HTF candle.
Lookback Periods:
lowestLookback: Number of bars for the lowest low calculation (default: 20).
highestLookback: Number of bars for the highest high calculation (default: 10).
Fibonacci Levels:
Fully customizable Fibonacci levels ranging from 0.000 to 1.000.
Visualization
Fibonacci Levels:
Plots six customizable Fibonacci levels with distinct colors and transparency.
High/Low Criteria:
Plots the highest and lowest levels based on the lookback periods as reference lines.
Trading Logic
Long Condition:
Price must close above:
The lowest price criteria (lowcriteria).
The Fibonacci level 3 (50% retracement).
Short Condition:
Price must close below:
The highest price criteria (highcriteria).
The Fibonacci level 3 (50% retracement).
Use Case
Trend Reversal Strategy:
Combines Fibonacci retracement with recent high/low criteria to identify potential reversal or breakout points.
Custom Timeframe Analysis:
Incorporates higher timeframe data for multi-timeframe trading strategies.

Zero-Lag MA Trend FollowingScript Name: Zero-Lag MA Trend Following Auto-Trading
Purpose and Unique Features:
This script is designed to implement a trend-following auto-trading strategy by combining the Zero-Lag Moving Average (ZLMA), Exponential Moving Average (EMA), and ATR Bands. To differentiate it from similar scripts, the following key aspects are emphasized:
Zero-Lag MA (ZLMA):
Responds quickly to price changes, minimizing lag compared to EMA.
Detects crossovers with EMA and generates Diamond Signals to indicate trend reversals.
ATR Bands:
Measures market volatility to set stop-loss levels.
Helps optimize entry points and manage risk effectively.
Diamond Signals:
A vital visual cue indicating the early stages of trend reversals.
Green diamonds signal an uptrend, while red diamonds signal a downtrend.
Each component plays a distinct role, working synergistically to enhance trend detection and risk management. This system doesn’t merely combine indicators but optimizes them for comprehensive trend-following and risk control.
Usage Instructions:
Entry Conditions:
Long Entry:
Enter when a green Diamond Signal appears (ZLMA crosses above EMA).
Short Entry:
Enter when a red Diamond Signal appears (ZLMA crosses below EMA).
Exit Conditions:
Stop Loss:
Set at the lower boundary of the ATR band for BUY or the upper boundary for SELL at entry.
Take Profit:
Automatically executed based on a 1:2 risk-reward ratio.
Account Size: ¥100,0000
Commissions and Slippage: Assumed commission of 90 pips per trade and slippage of 1 pip.
Risk per Trade: 10% of account equity (adjustable based on risk tolerance).
Improvements and Original Features:
While based on open-source code, this script incorporates the following critical enhancements:
Diamond Signals from ZLMA and EMA Integration:
Improves entry accuracy with a proprietary trend detection strategy.
ATR Bands Utilization:
Adds a volatility-based risk management function.
Optimized Visual Entry Signals:
Includes plotted triangles (▲, ▼) to clearly indicate trend-following entry points.
Credits:
This script builds upon indicators developed by ChartPrime, whose innovative approach and insights have enabled a more advanced trend-following strategy. We extend our gratitude for their foundational work.
Additionally, it integrates technical methods based on Zero-Lag Moving Average (ZLMA), EMA, and ATR Bands, leveraging insights from the trading community.
Chart Display Options:
The script offers options to toggle the visual signals (Diamond Signals, trend lines, and entry points) on or off, keeping the chart clean while maximizing analytical efficiency.
Disclaimer:
This script is provided for educational purposes and past performance does not guarantee future results.
Use it responsibly with proper risk management.

Dual Chain StrategyDual Chain Strategy - Technical Overview
How It Works:
The Dual Chain Strategy is a unique approach to trading that utilizes Exponential Moving Averages (EMAs) across different timeframes, creating two distinct "chains" of trading signals. These chains can work independently or together, capturing both long-term trends and short-term price movements.
Chain 1 (Longer-Term Focus):
Entry Signal: The entry signal for Chain 1 is generated when the closing price crosses above the EMA calculated on a weekly timeframe. This suggests the start of a bullish trend and prompts a long position.
bullishChain1 = enableChain1 and ta.crossover(src1, entryEMA1)
Exit Signal: The exit signal is triggered when the closing price crosses below the EMA on a daily timeframe, indicating a potential bearish reversal.
exitLongChain1 = enableChain1 and ta.crossunder(src1, exitEMA1)
Parameters: Chain 1's EMA length is set to 10 periods by default, with the flexibility for user adjustment to match various trading scenarios.
Chain 2 (Shorter-Term Focus):
Entry Signal: Chain 2 generates an entry signal when the closing price crosses above the EMA on a 12-hour timeframe. This setup is designed to capture quicker, shorter-term movements.
bullishChain2 = enableChain2 and ta.crossover(src2, entryEMA2)
Exit Signal: The exit signal occurs when the closing price falls below the EMA on a 9-hour timeframe, indicating the end of the shorter-term trend.
exitLongChain2 = enableChain2 and ta.crossunder(src2, exitEMA2)
Parameters: Chain 2's EMA length is set to 9 periods by default, and can be customized to better align with specific market conditions or trading strategies.
Key Features:
Dual EMA Chains: The strategy's originality shines through its dual-chain configuration, allowing traders to monitor and react to both long-term and short-term market trends. This approach is particularly powerful as it combines the strengths of trend-following with the agility of momentum trading.
Timeframe Flexibility: Users can modify the timeframes for both chains, ensuring the strategy can be tailored to different market conditions and individual trading styles. This flexibility makes it versatile for various assets and trading environments.
Independent Trade Logic: Each chain operates independently, with its own set of entry and exit rules. This allows for simultaneous or separate execution of trades based on the signals from either or both chains, providing a robust trading system that can handle different market phases.
Backtesting Period: The strategy includes a configurable backtesting period, enabling thorough performance assessment over a historical range. This feature is crucial for understanding how the strategy would have performed under different market conditions.
time_cond = time >= startDate and time <= finishDate
What It Does:
The Dual Chain Strategy offers traders a distinctive trading tool that merges two separate EMA-based systems into one cohesive framework. By integrating both long-term and short-term perspectives, the strategy enhances the ability to adapt to changing market conditions. The originality of this script lies in its innovative dual-chain design, providing traders with a unique edge by allowing them to capitalize on both significant trends and smaller, faster price movements.
Whether you aim to capture extended market trends or take advantage of more immediate price action, the Dual Chain Strategy provides a comprehensive solution with a high degree of customization and strategic depth. Its flexibility and originality make it a valuable tool for traders seeking to refine their approach to market analysis and execution.
How to Use the Dual Chain Strategy
Step 1: Access the Strategy
Add the Script: Start by adding the Dual Chain Strategy to your TradingView chart. You can do this by searching for the script by name or using the link provided.
Select the Asset: Apply the strategy to your preferred trading pair or asset, such as #BTCUSD, to see how it performs.
Step 2: Configure the Settings
Enable/Disable Chains:
The strategy is designed with two independent chains. You can choose to enable or disable each chain depending on your trading style and the market conditions.
enableChain1 = input.bool(true, title='Enable Chain 1')
enableChain2 = input.bool(true, title='Enable Chain 2')
By default, both chains are enabled. If you prefer to focus only on longer-term trends, you might disable Chain 2, or vice versa if you prefer shorter-term trades.
Set EMA Lengths:
Adjust the EMA lengths for each chain to match your trading preferences.
Chain 1: The default EMA length is 10 periods. This chain uses a weekly timeframe for entry signals and a daily timeframe for exits.
len1 = input.int(10, minval=1, title='Length Chain 1 EMA', group="Chain 1")
Chain 2: The default EMA length is 9 periods. This chain uses a 12-hour timeframe for entries and a 9-hour timeframe for exits.
len2 = input.int(9, minval=1, title='Length Chain 2 EMA', group="Chain 2")
Customize Timeframes:
You can customize the timeframes used for entry and exit signals for both chains.
Chain 1:
Entry Timeframe: Weekly
Exit Timeframe: Daily
tf1_entry = input.timeframe("W", title='Chain 1 Entry Timeframe', group="Chain 1")
tf1_exit = input.timeframe("D", title='Chain 1 Exit Timeframe', group="Chain 1")
Chain 2:
Entry Timeframe: 12 Hours
Exit Timeframe: 9 Hours
tf2_entry = input.timeframe("720", title='Chain 2 Entry Timeframe (12H)', group="Chain 2")
tf2_exit = input.timeframe("540", title='Chain 2 Exit Timeframe (9H)', group="Chain 2")
Set the Backtesting Period:
Define the period over which you want to backtest the strategy. This allows you to see how the strategy would have performed historically.
startDate = input.time(timestamp('2015-07-27'), title="StartDate")
finishDate = input.time(timestamp('2026-01-01'), title="FinishDate")
Step 3: Analyze the Signals
Understand the Entry and Exit Signals:
Buy Signals: When the price crosses above the entry EMA, the strategy generates a buy signal.
bullishChain1 = enableChain1 and ta.crossover(src1, entryEMA1)
Sell Signals: When the price crosses below the exit EMA, the strategy generates a sell signal.
bearishChain2 = enableChain2 and ta.crossunder(src2, entryEMA2)
Review the Visual Indicators:
The strategy plots buy and sell signals on the chart with labels for easy identification:
BUY C1/C2 for buy signals from Chain 1 and Chain 2.
SELL C1/C2 for sell signals from Chain 1 and Chain 2.
This visual aid helps you quickly understand when and why trades are being executed.
Step 4: Optimize the Strategy
Backtest Results:
Review the strategy’s performance over the backtesting period. Look at key metrics like net profit, drawdown, and trade statistics to evaluate its effectiveness.
Adjust the EMA lengths, timeframes, and other settings to see how changes affect the strategy’s performance.
Customize for Live Trading:
Once satisfied with the backtest results, you can apply the strategy settings to live trading. Remember to continuously monitor and adjust as needed based on market conditions.
Step 5: Implement Risk Management
Use Realistic Position Sizing:
Keep your risk exposure per trade within a comfortable range, typically between 1-2% of your trading capital.
Set Alerts:
Set up alerts for buy and sell signals, so you don’t miss trading opportunities.
Paper Trade First:
Consider running the strategy in a paper trading account to understand its behavior in real market conditions before committing real capital.
This dual-layered approach offers a distinct advantage: it enables the strategy to adapt to varying market conditions by capturing both broad trends and immediate price action without one chain's activity impacting the other's decision-making process. The independence of these chains in executing transactions adds a level of sophistication and flexibility that is rarely seen in more conventional trading systems, making the Dual Chain Strategy not just unique, but a powerful tool for traders seeking to navigate complex market environments.

BollingerBands Strat + pending order alerts via TradingConnectorSoftware part of algotrading is simpler than you think. TradingView is a great place to do this actually. To present it, I'm publishing each of the default strategies you can find in Pinescript editor's "built-in" list with slight modification - I'm only adding 2 lines of code, which will trigger alerts, ready to be forwarded to your broker via TradingConnector and instantly executed there. Alerts added in this script: 14, 17, 20 and 23.
SCRIPT INCLUDES PENDING ORDERS AND ALERTS! Alert will be sent to MetaTrader when order is triggered, but not yet filled. That means if market conditions change and order does not get filled, it needs to be cancelled as well, and there are alerts for that in the script as well.
How it works:
1. TradingView alert fires.
2. TradingConnector catches it and forwards to MetaTrader4/5 you got from your broker.
3. Trade gets executed inside MetaTrader within 1 second of fired alert.
When configuring alert, make sure to select "alert() function calls only" in CreateAlert popup. One alert per ticker is required.
Adding stop-loss, take-profit, trailing-stop, break-even or executing pending orders is also possible. These topics have been covered in other example posts.
This routing works for Forex, indices, stocks, crypto - anything your broker offers via their MetaTrader4 or 5.
Disclaimer: This concept is presented for educational purposes only. Profitable results of trading this strategy are not guaranteed even if the backtest suggests so. By no means this post can be considered a trading advice. You trade at your own risk.
If you are thinking to execute this particular strategy, make sure to find the instrument, settings and timeframe which you like most. You can do this by your own research only.

Double EMA CROSS
Double EMA CROSS (DEC)
Useful for identifying and receiving alerts about uptrends and downtrends.
This script uses two Exponential Moving Averages (EMAs) to find price uptrends and downtrends.
An Exponential Moving Average ( EMA ) is a type of moving average that places a greater weight and significance on the most recent data points.
The script produces uptrend and downtrend signals based on crossovers and divergences between the two EMAs,
the user will be able to spot a trend change (when the EMAs crossover) and to determine the strength of the current trend (when the EMAs diverge).
It is also posible to get alerts for uptrends and downtrends on the web and mobile app with sound and pop-ups as well as via email.
The optimal time to enter and exit the market can be concluded from this trend changes.
The user can set their own EMAs, by default they are set to 25 and 75 periods for medium and long term respectively.
When the medium term EMA crosses below the long term EMA the asset is in a downtrend and the price will decline, and when the
medium term EMA crosses above the long term EMA the asset is in an uptrend and price will increase.
This scripts plots the following indicators and signals on the chart to help the user to identify trends:
1.- Medium and long term EMAs as lines overlaid on the price chart.
2.- Up green triangles above bars when the price is on an uptrend and down red triangles below bars when the price is on a downtrend.
3.- Arrows with text to indicate the start of an uptrend or downtrend.
The user can enable and disable the indicators and signals as well as set colors and shapes to their liking.
This script also lets the user create alerts for uptrends and downtrends. To create a new alert using this script follow this instructions:
1.- Once you added this script to your chart, go to the alerts panel (right on web or bottom tool bar on the mobile app) and add a new alert (alarm clock icon with a plus sign).
2.- A modal window will open. On the “Condition” dropdown menu select “DEC”.
3.- On the next dropdown menu (right below the “Condition” one) you can select.
4.- Lastly you can set all the normal alert options and create the alert.

eha Moving Averages StrategyMoving Average based strategies are very popular ones among both long-term investors and short-term traders as they can be tailored to any time frame. One of the main moving average strategies are crossovers. The very simple type is a price crossover , which is when the price crosses above or below a moving average to signal a potential change in trend.
Another strategy is to apply two moving averages to a chart: one longer (or slow) and one shorter (or fast). When the shorter-term MA crosses above the longer-term MA, it's a buy signal, as it indicates that the trend is shifting up (also known as “ Golden Cross ”). Meanwhile, when the shorter-term MA crosses below the longer-term MA, it's a sell signal, as it indicates that the trend is shifting down (which is also known as “ Dead/Death Cross ”).
This is a study to find a suitable trading strategy for 4-6 hour time frames. As you can see the performance is currently very poor. It has just generated almost 90 trades in a very long period from January 2017 to the time of publishing the study for the first time.
Moving averages work quite well in strong trending conditions but poorly in choppy or ranging conditions. Adjusting the time frame can correct this problem temporarily, although, at some point, these issues are likely to occur regardless of the time frame chosen for the moving average(s).
I am working on this basic strategy to make its performance better and I will update the post in the future. So keep in touch by following the post.
Why have I republished my study?
It sounds like TradingView stores and indexes scripts based on the title of the post rather than the actual title of the scripts and if one chose general terms as the title of the post, the TradingView script search engine may be unable to find it. So I decided to repost the strategy with a more searchable and unique prefix of " eha ".
Please provide me with your precious feedback.

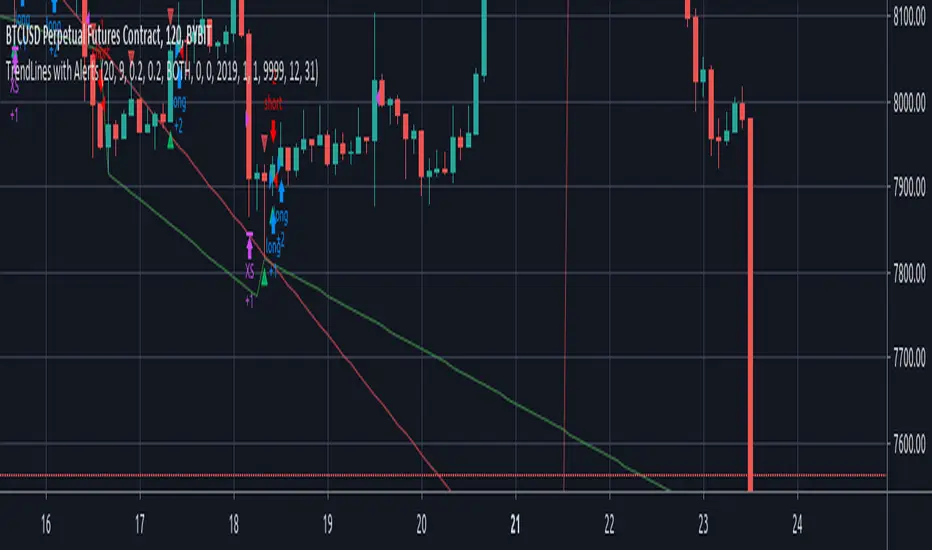
TrendLines with AlertsThis isn't my own work, hence giving it in Open Source library for others to benefit from it too.
I have tried to refin the output of trendlines in this Strategy
The original Code is available at
The script needs some modifications, so I'll be making further updates in future, but for now I'm publishing this because most people don't know how to track trandlines, moreover, some use Line.New() by tradingview Pinescript, which again is a bit difficult to deal with.
This script is a basic version of trendlines on a certain angle (anglecheck was provided by the original author in his script).
Nothing fancy in this script.
Also Converted the original Script to Pinescript v4.
Bollinger and Tendencies (Bollinger e Tendências )The strategy consists of buying when the price breaks up (crossover) the bottom line of the Bollinger and selling when the price breaks down (crossunder) to your top line.
The chart still shows trends clearly, with the fill between the exponential average and the closing value of the canlestick, green at high, red at low (this part of the script is based on the code: "Pivot Daily Price Color" by Rimko).
It also places notes on the high and low candlesticks (based on the code: "Candlesticks Pattern Identified" by Repo32).
It is recommended to use it in conjunction with the "IFR and Storage" script (also available to me), and some volume script.
A estratégia consiste em comprar quando o preço rompe para cima (crossover) a linha inferior do Bollinger e vender quando o preço rompe para baixo (crossunder) a sua linha superior.
O gráfico ainda mostra as tendências de forma clara, com o preenchimento entre a média exponencial e o valor de fechamento do canlestick, verde em alta, vermelho em baixa (essa parte do script é baseada no código: "Pivot Daily Price Color" do usuário: Rimko).
Também, coloca apontamentos nos candlesticks de alta e de baixa (baseado no código: "Candlesticks Pattern Identified" do usuário Repo32).
Recomenda-se a utilização em conjunto com o script "IFR e Estocagem" (também por mim disponibilizado), e algum script de volume.
