Multi-Timeframe SFP (Swing Failure Pattern)How to Use
1. Set Pivot Timeframe: Choose the timeframe for identifying major swing points (e.g., 'D' for Daily pivots).
2. Set SFP Timeframe: Choose the timeframe to find the SFP candle (e.g., '240' for the 4-Hour chart).
3. Set Confirmation Bars: Set how many SFP Timeframe bars must pass without invalidating the level. A value of '0' confirms immediately on the SFP bar's close. A value of '1' waits for one more bar to close.
4. Adjust Filters (Optional): Enable the 'Wick % Filter' to add a quality check for strong rejections.
5. Watch & Wait: The indicator will draw lines and labels and fire alerts for fully confirmed signals.
In-Depth Explanation
1. Overview
The Dynamic Pivot SFP Engine is a multi-timeframe tool designed to identify and validate Swing Failure Patterns (SFPs) at significant price levels.
An SFP is a common price action pattern where price briefly trades beyond a previous swing high or low (sweeping liquidity) but then fails to hold those new prices, closing back inside the previous range. This "failure" often signals a reversal.
This indicator enhances SFP detection by separating the Pivot (Liquidity) from the SFP (Rejection), allowing you to monitor them on different timeframes.
2. The Core Multi-Timeframe Logic
The indicator's power comes from two key inputs:
• Pivot Timeframe (Pivot Timeframe)
This is the "high timeframe" used to establish significant support and resistance levels. The script finds standard pivots (swing highs and lows) on this timeframe based on the Pivot Left Strength and Pivot Right Strength inputs. These pivots are the "liquidity" levels the SFP will target. The Pivot Lookback input controls how long (in Pivot Timeframe bars) a pivot remains active and monitored.
• SFP Timeframe (SFP Timeframe)
This is the "execution timeframe" where the script looks for the actual SFP. On every new bar of this timeframe, the script checks if price has swept and rejected any of the active pivots.
Example Setup:
You might set Pivot Timeframe to 'D' (Daily) to find major daily swing points. You then set SFP Timeframe to '240' (4-Hour) to find a 4-hour candle that sweeps a daily pivot and closes back below/above it.
3. The SFP Confirmation Process
An SFP is not confirmed instantly. It must pass a rigorous, multi-step validation process.
Step 1: The SFP Candle (The Sweep)
A potential SFP is identified when an SFP Timeframe bar does the following:
• Bearish SFP: The bar's high trades above an active pivot high, but the bar closes below that same pivot high.
• Bullish SFP: The bar's low trades below an active pivot low, but the bar closes above that same pivot low.
Step 2: The Wick Filter (Optional Quality Check)
If Enable Wick % Filter is checked, the SFP candle from Step 1 is also measured.
• For a bearish SFP, the upper wick (from the high to the open/close) must be at least Min. Wick % of the entire candle's range (high-to-low).
• For a bullish SFP, the lower wick (from the low to the open/close) must meet the same percentage requirement.
If the SFP candle fails this test, it is discarded, even if it met the sweep/close criteria.
Step 3: The Validation Window (The Confirmation)
This is the most critical feature, controlled by Confirmation Bars.
• If Confirmation Bars = 0: The SFP is confirmed immediately on the SFP candle's close (assuming it passed the optional wick check). The label, line, and alert are triggered at this moment.
• If Confirmation Bars > 0: The SFP enters a "pending" state. The script will wait for $N$ more SFP Timeframe bars to close.
o Invalidation: If, during this waiting period, any bar closes back across the pivot (e.g., a close above the pivot for a bearish SFP), the SFP is considered failed and invalidated. All pending plots are deleted.
o Confirmation: If the $N$ confirmation bars all complete without invalidating the level, the SFP is finally confirmed. The label, line, and alert are only triggered after this entire process is complete. This adds a significant layer of robustness, ensuring the rejection holds for a period of time.
4. Visuals & Alerts
• Lines: A horizontal line is drawn from the original pivot to the SFP bar, showing which level was targeted. Note: These lines will only be drawn on chart timeframes equal to or lower than the 'SFP Timeframe'.
• Labels: A label is placed at the SFP's extreme (the high/low of the SFP bar). The label text conveniently includes the Ticker, Pivot TF, SFP TF, and Confirmation bar settings (e.g., "Bearish SFP BTCUSD / Pivot: 1D / SFP: 4H | Conf: 1").
• MTF Boxes (Show SFP Box, Show Conf. Boxes): These boxes highlight the SFP and confirmation bars. Crucially, they are only visible when your chart timeframe is lower than the SFP Timeframe. For example, if your SFP Timeframe is '240' (4H), you will only see these boxes on the 1H, 15M, 5M, etc., charts. This allows you to see the higher-timeframe SFP unfolding on your lower-timeframe chart.
• Alerts (Enable Alerts): An alert is fired only when an SFP is fully confirmed (i.e., after the Confirmation Bars have passed successfully). For efficient, real-time monitoring, it is highly recommended to run this indicator server-side by creating an alert on TradingView set to trigger on "Any alert() function call".
ค้นหาในสคริปต์สำหรับ "text"

Experimental Supertrend [CHE]Experimental Supertrend — Combines EMA crossovers for trend regime detection with an adaptive ATR-based hull that selects the narrowest band to contain recent highs and lows, minimizing false breaks in varying volatility.
Summary
This indicator overlays a dynamic supertrend boundary around a midline derived from dual EMAs, using EMA crossovers to switch between bullish and bearish regimes. The hull adapts by evaluating multiple ATR periods and selecting the tightest one that fully encloses price action over a specified window, which helps in creating more stable trend lines that hug price without excessive gaps or breaches. Fills between the midline and hull provide visual cues for trend strength, darkening temporarily after regime changes to highlight transitions. Alerts trigger on crossovers, and markers label entry points, making it suitable for trend-following setups where standard supertrends might whipsaw. Overall, it offers robustness through auto-adjustment, reducing sensitivity to noise while maintaining responsiveness to genuine shifts.
Motivation: Why this design?
Standard supertrend indicators often flip prematurely in choppy markets due to fixed multipliers that do not account for localized volatility patterns, leading to frequent false signals and eroded confidence in trends. This design addresses that by incorporating an EMA-based regime filter for directional bias and an auto-adaptive hull that dynamically tunes the band width based on recent price containment needs. By prioritizing the narrowest effective enclosure, it avoids over-wide bands in calm periods that cause lag or under-wide ones in volatility spikes that invite breaks, providing a more consistent trailing reference without manual tweaking.
What’s different vs. standard approaches?
- Reference baseline: Diverges from the classic ATR-multiplier supertrend, which uses a single fixed period and constant factor applied to close or high/low deviations.
- Architecture differences:
- Auto-selection from candidate ATR lengths to find the optimal period for current conditions.
- Dynamic multiplier clamped between floor and cap values, adjusted by padding to ensure reliable containment.
- Regime-gated rendering, where hull position flips based on EMA relative positioning.
- Post-transition visual fading to emphasize change points without altering core logic.
- Practical effect: Charts show tighter, more reactive bands that rarely breach during trends, reducing visual clutter from flips; the adaptive nature means less intervention across assets, as the hull self-adjusts to volatility clusters rather than applying a one-size-fits-all scale.
How it works (technical)
The indicator first computes two EMAs from close prices using lengths derived from a preset pair or manual inputs, establishing a midline as their average. This midline serves as the central reference for the hull. True range values are then smoothed into multiple ATR candidates using exponential weighting over the specified lengths. For each candidate, deviations of recent highs and lows from the midline are ratioed against the ATR to determine a required multiplier that would enclose all extremes in the containment window—the highest ratio plus padding sets the base, clamped to user-defined bounds. Among valid candidates (those with sufficient history), the one yielding the narrowest overall band width is selected. The hull boundaries are then offset from the midline by this multiplier times the chosen ATR, and further smoothed with a fixed EMA to reduce jitter. Regime direction from EMA comparison gates which boundary acts as support or resistance, with initialization seeding arrays on the first bar to handle state persistence. No higher timeframe data is used, so all logic runs on the chart's native bars without lookahead.
Parameter Guide
EMA Pair — Selects preset lengths for fast and slow EMAs, influencing regime sensitivity and midline stability. Default: "21/55". Trade-offs/Tips: Faster pairs like "9/21" increase cross frequency for scalping but raise false signals; slower like "50/200" smooths for swings, potentially missing early turns. Use Manual for fine control.
Manual Fast — Sets fast EMA length when Manual mode is active; shorter values make regime switches quicker. Default: 21. Trade-offs/Tips: Lower than 10 risks over-reactivity; pair with slow at least double for clear separation.
Manual Slow — Sets slow EMA length when Manual mode is active; longer values anchor the midline more firmly. Default: 55. Trade-offs/Tips: Above 100 adds lag in trends; balance with fast to avoid perpetual neutrality.
ATR Lengths (comma-separated) — Defines candidate periods for ATR smoothing; more options allow finer auto-selection. Default: "7,10,14,21,28,35". Trade-offs/Tips: Fewer candidates speed computation but may miss optimal fits; keep under 10 for efficiency.
Containment Window — Number of recent bars the hull must fully enclose highs/lows of; larger windows favor stability. Default: 50. Trade-offs/Tips: Shorter (under 20) adapts faster to breaks but increases breach risk; longer smooths but delays response.
Min Multiplier Floor — Lowest allowed multiplier for hull width; prevents overly tight bands in low volatility. Default: 0.5. Trade-offs/Tips: Raise to 0.75 for conservative enclosures; too low allows pinches that flip easily.
Max Multiplier Cap — Highest allowed multiplier; caps expansion in spikes to avoid wide, lagging bands. Default: 1.0. Trade-offs/Tips: Lower to 0.75 tightens overall; higher permits more room but risks detachment from price.
Padding (+) — Adds buffer to the auto-multiplier for safer containment without exact touches. Default: 0.05. Trade-offs/Tips: Increase to 0.10 in gappy markets; minimal values hug closer but may still breach on outliers.
Fill Between (Mid ↔ Supertrend) — Toggles shaded area between midline and active hull for trend visualization. Default: true. Trade-offs/Tips: Disable for cleaner charts; pairs well with transparency tweaks.
Base Fill Transparency (0..100) — Sets default opacity of fills; higher values make them subtler. Default: 80. Trade-offs/Tips: Under 50 overwhelms price action; adjust with darken boost for emphasis.
Darken on Trend Change — Enables temporary opacity increase after regime shifts to spotlight transitions. Default: true. Trade-offs/Tips: Off for steady visuals; on aids spotting reversals in real-time.
Darken Fade Bars — Duration in bars for the darken effect to ramp back to base; longer prolongs highlight. Default: 8. Trade-offs/Tips: Shorter (4-6) for fast-paced charts; longer holds attention on changes.
Darken Boost at Change (Δ transp) — Intensity of opacity reduction at crossover; higher values make shifts more prominent. Default: 50. Trade-offs/Tips: Cap at 70 to avoid blackout; tune down if fades obscure details.
Show Supertrend Line — Displays the active hull boundary as a line. Default: true. Trade-offs/Tips: Hide for fill-only views; linewidth fixed at 3 for visibility.
Show EMA Cross Markers — Places circles and labels at crossover points for entry cues. Default: true. Trade-offs/Tips: Disable in clutter; labels show "Buy"/"Sell" at absolute positions.
Alert: EMA Cross Up (Long) — Triggers notification on bullish crossover. Default: true. Trade-offs/Tips: Pair with filters; once-per-bar frequency.
Alert: EMA Cross Down (Short) — Triggers notification on bearish crossover. Default: true. Trade-offs/Tips: Use for exits; ensure broker integration.
Show Debug — Reveals internal diagnostics like selected ATR details (if implemented). Default: false. Trade-offs/Tips: Enable for troubleshooting selections; minimal overhead.
Reading & Interpretation
Bullish regime shows a green line below price as support, with upward fill from midline; bearish uses red line above as resistance, downward fill. Crossovers flip the active boundary, marked by tiny green/red circles and "Buy"/"Sell" labels at the hull level. Fills start at base transparency but darken sharply at changes, fading over the specified bars to signal fresh momentum. If the hull rarely breaches during trends, containment is effective; frequent touches without flips indicate tight adaptation. Debug mode (when enabled) overlays text or plots for selected length and multiplier, helping verify auto-choices.
Practical Workflows & Combinations
- Trend following: Enter long on green "Buy" label above prior low structure; confirm with higher high. Trail stops along the green hull line, tightening as fills stabilize post-fade.
- Exits/Stops: Conservative exit on opposite crossover or hull breach; aggressive hold until fade completes if volume supports. Use darken boost as a volatility cue—high delta suggests waiting for confirmation.
- Multi-asset/Multi-TF: Defaults suit forex/stocks on 15m-4h; for crypto, widen containment to 75 for gaps. Layer on volume oscillator for cross filters; avoid on low-liquidity assets where ATR candidates skew.
Behavior, Constraints & Performance
Closed-bar logic ensures signals confirm at bar end, with live bars updating hull adaptively but no repaints since no future data or security calls are used. Arrays persist ATR states across bars, initialized once with candidates parsed from string. Small fixed loops (over 6 lengths max, inner up to 50) run per bar, capped by max_bars_back=500 for history needs. Resources stay low with 500 labels/lines limits, but dense charts may hit on markers. Known limits include initial lag until containment history builds (50+ bars), potential wide bands on gaps, and suboptimal selections if candidates omit ideal lengths.
Sensible Defaults & Quick Tuning
Start with "21/55" pair, 50-window, 0.5-1.0 multipliers, and 80% transparency for balanced responsiveness on daily charts. For too many flips, raise min floor to 0.75 or add lengths like "42"; for sluggishness, shorten window to 30 or pick faster pair. In high-vol environments, boost padding to 0.10; for smoother visuals, extend fade bars to 12.
What this indicator is—and isn’t
This is a visualization and signal layer for trend regime and adaptive boundaries, aiding entry/exit timing in directional markets. It is not a standalone system—pair with price structure, risk sizing, and broader context. Not predictive of turns, just reactive to containment and crosses.
Disclaimer
The content provided, including all code and materials, is strictly for educational and informational purposes only. It is not intended as, and should not be interpreted as, financial advice, a recommendation to buy or sell any financial instrument, or an offer of any financial product or service. All strategies, tools, and examples discussed are provided for illustrative purposes to demonstrate coding techniques and the functionality of Pine Script within a trading context.
Any results from strategies or tools provided are hypothetical, and past performance is not indicative of future results. Trading and investing involve high risk, including the potential loss of principal, and may not be suitable for all individuals. Before making any trading decisions, please consult with a qualified financial professional to understand the risks involved.
By using this script, you acknowledge and agree that any trading decisions are made solely at your discretion and risk.
Do not use this indicator on Heikin-Ashi, Renko, Kagi, Point-and-Figure, or Range charts, as these chart types can produce unrealistic results for signal markers and alerts.
Happy trading
Chervolino

Swing Points & Liquidity — ENHANCED PRO (Dark/Light Mode)This indicator — “Swing Points & Liquidity — ENHANCED PRO (Dark/Light Mode)” — automatically detects and visualizes swing highs, swing lows, and liquidity levels on the chart with rich analytics and customizable visuals.
🔍 Core Features
Smart Swing Detection: Identifies pivot highs/lows based on adjustable left/right bar settings.
Liquidity Visualization: Draws dynamic boxes and lines for liquidity pools and swing zones.
Volume & OI Integration: Filters and colors levels using volume and Open Interest Δ (change).
Strength Meter: Highlights strong liquidity levels with color gradients based on OI + volume intensity.
Automatic Trendlines: Connects swing points with selectable style and width.
Fibonacci Mapping: Automatically projects fib retracements (23.6%, 38.2%, 50%, 61.8%, 78.6%) from swing-to-swing for confluence zones.
Statistics Panel: Displays live metrics — total levels, active/filled count, success rate, and average strength.
Alerts System: Alerts for new swing formations and when price touches or breaks a level.
Multi-Timeframe Option: Analyze swing structures from higher timeframes on any chart.
Dual Theme Mode: Fully optimized for both Dark and Light interface preferences.
⚙️ Advanced Options
Adjustable lookback range
Hide or extend filled levels
Configurable volume and OI thresholds
Supports multiple OI data sources (Binance, BitMEX, Kraken)
Fully dynamic text, color, and label alignment settings
💡 Use Case
Perfect for Smart Money Concept (SMC) and ICT-style analysis, liquidity sweeps, and swing-based trading.
Traders can quickly visualize where liquidity sits, track how it gets filled, and monitor structure shifts in real time.

USDJPY Fair Value Gap + Session Strategy🎯 Overview
This strategy combines Fair Value Gaps (FVGs) with session-based order flow analysis, specifically optimized for USDJPY. It identifies price inefficiencies left behind by institutional order flow during high-volatility trading sessions, offering a modern alternative to traditional lagging indicators.
🔬 What Are Fair Value Gaps?
Fair Value Gaps represent areas where aggressive institutional buying or selling created "gaps" in the market structure:
Bullish FVG: Price moves up so aggressively that it leaves unfilled buy orders behind
Bearish FVG: Price moves down so quickly that it leaves unfilled sell orders behind
Research shows approximately 80% of FVGs get "filled" (price returns to the gap) within 20-60 bars, making them highly predictable trading zones.
(see the generated image above)
(see the generated image above)
FVG Detection Logic:
text
// Bullish FVG: Gap between high and current low
bullishFVG = low > high and high > high
// Bearish FVG: Gap between low and current high
bearishFVG = high < low and low < low
🌏 Session-Based Trading
Why Sessions Matter for USDJPY
(see the generated image above)
Tokyo Session (00:00-09:00 UTC)
Highest volatility during first hour (00:00-01:00 UTC)
Average movement: 51-60 pips
Best for breakout strategies
London/NY Overlap (13:00-16:00 UTC)
Maximum liquidity and institutional participation
Tightest spreads and most reliable FVG formations
Optimal for continuation trades
Monday Premium Effect
USDJPY moves 120+ pips on Mondays due to weekend positioning
Enhanced FVG formation during session opens
📊 Strategy Components
(see the generated image above)
1. Fair Value Gap Detection
Identifies bullish and bearish FVGs automatically
Age limit: FVGs expire after 20 bars to avoid stale setups
Size filter: Minimum gap size to filter out noise
2. Session Filtering
Tokyo Open focus: Trades during first hour of Asian session
London/NY Overlap: Captures high-liquidity institutional flows
Weekend gap strategy: Enhanced signals on Monday opens
3. Volume Confirmation
Requires 1.5x average volume spike
Confirms institutional participation
Reduces false signals
4. Trend Alignment
50 EMA filter ensures trades align with higher timeframe trend
Long trades above EMA, short trades below
Prevents costly counter-trend trades
5. Risk Management
2:1 Risk/Reward minimum ensures profitability with 40%+ win rate
Percentage-based stops adapt to USDJPY volatility (0.3% default)
Configurable position sizing
🎯 Entry Conditions
(see the generated image above)
Long Entry (BUY)
✅ Bullish FVG detected in previous bars
✅ Price returns to FVG zone during active trading session
✅ Volume spike above 1.5x average
✅ Price above 50 EMA (trend confirmation)
✅ Bullish candle closes within FVG zone
✅ Trading during Tokyo open OR London/NY overlap
Short Entry (SELL)
✅ Bearish FVG detected in previous bars
✅ Price returns to FVG zone during active trading session
✅ Volume spike above 1.5x average
✅ Price below 50 EMA (trend confirmation)
✅ Bearish candle closes within FVG zone
✅ Trading during Tokyo open OR London/NY overlap
📈 Expected Performance
Backtesting Results (Based on Similar Strategies):
Win Rate: 44-59% (profitable due to high R:R ratio)
Average Winner: 60-90 pips during London/NY sessions
Average Loser: 30-40 pips (tight stops at FVG boundaries)
Risk/Reward: 2:1 minimum, often 3:1 during strong trends
Best Performance: Monday Tokyo opens and Wednesday London/NY overlaps
Why This Works for USDJPY:
90% correlation with US-Japan bond yield spreads
High volatility provides sufficient pip movement
Heavy institutional/central bank participation creates clear FVGs
Consistent volatility patterns across trading sessions
⚙️ Configurable Parameters
Session Settings:
Trade Tokyo Session (Enable/Disable)
Trade London/NY Overlap (Enable/Disable)
FVG Settings:
FVG Minimum Size (Filter small gaps)
Maximum FVG Age (20 bars default)
Show FVG Markers (Visual display)
Volume Settings:
Use Volume Filter (Enable/Disable)
Volume Multiplier (1.5x default)
Volume Average Period (20 bars)
Trend Settings:
Use Trend Filter (Enable/Disable)
Trend EMA Period (50 default)
Risk Management:
Risk/Reward Ratio (2.0 default)
Stop Loss Percentage (0.3% default)
🎨 Visual Indicators
🟡 Yellow Line: 50 EMA trend filter
🟢 Green Triangles: Long entry signals
🔴 Red Triangles: Short entry signals
🟢 Green Dots: Bullish FVG zones
🔴 Red Dots: Bearish FVG zones
🟦 Blue Background: Tokyo open session
🟧 Orange Background: London/NY overlap
📊 Recommended Settings
Optimal Timeframes:
Primary: 5-minute charts (scalping)
Secondary: 15-minute charts (swing trading)
Parameter Optimization:
Conservative: Stop Loss 0.2%, R:R 2:1, Volume 2.0x
Balanced: Stop Loss 0.3%, R:R 2:1, Volume 1.5x (default)
Aggressive: Stop Loss 0.4%, R:R 1.5:1, Volume 1.2x
Risk Management:
Maximum 1-2% of account per trade
Daily loss limit: Stop after 3-5 consecutive losses
Use fixed percentage position sizing
⚠️ Important Considerations
Avoid Trading During:
Major news events (BOJ interventions, NFP, FOMC)
Holiday periods with reduced liquidity
Low volatility Asian afternoon sessions
When US-Japan yield differential narrows sharply
Best Practices:
Limit to 2-3 trades per session maximum
Always respect the 50 EMA trend filter
Never risk more than planned per trade
Paper trade for 2-4 weeks before live implementation
Track performance by session and day of week
🚀 How to Use
Add the script to your USDJPY chart
Set timeframe to 5-minute or 15-minute
Adjust parameters based on your risk tolerance
Enable strategy alerts for automated notifications
Wait for visual signals (triangles) to appear
Enter trades according to your risk management rules
📚 Strategy Foundation
This strategy is based on:
Smart Money Concepts (SMC): Institutional order flow tracking
Market Microstructure: Understanding how FVGs form in electronic trading
Quantified Risk Management: Statistical edge through proper R:R ratios
Session Liquidity Patterns: Exploiting predictable volatility cycles

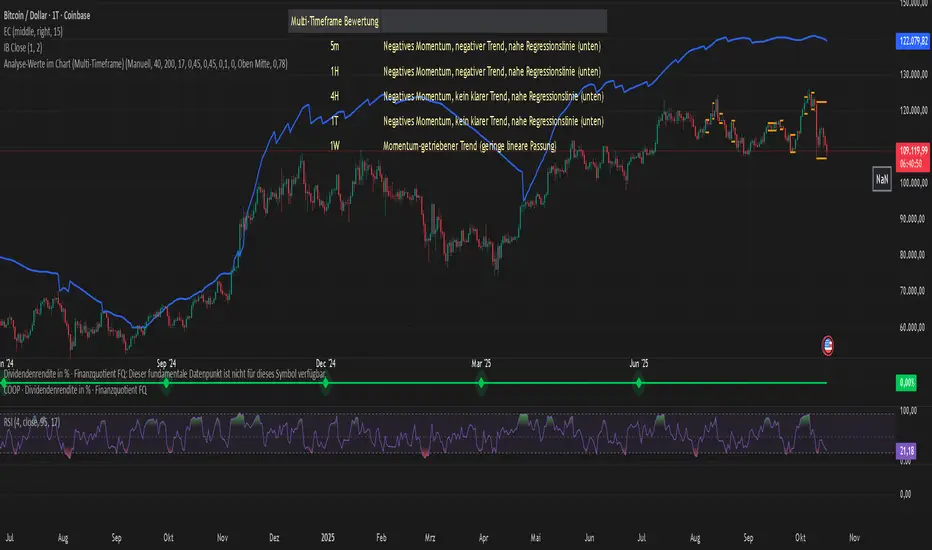
Analyse-Werte im Chart (Multi-Timeframe)Core Components
The indicator evaluates a trend based on four main pillars, which are combined into an overall score:
Momentum (Rate of Change / Standard Deviation): Measures the strength and speed of the current price movement. High momentum indicates a strong, directional move.
Trend Stability (R² - R-Squared): This is the heart of the analysis. The indicator searches for the best-fitting linear regression line within a user-defined period. The R² value (0-100%) indicates how well the price action fits this straight line. A high value signals a very stable, "clean" trend.
Stability/Risk (Rate of Change / Ulcer Index): Compares the trend strength to the pullbacks (drawdowns) it has experienced. A trend that rises steadily without suffering deep declines receives a high rating here.
RSI Proximity to 60: A small bonus factor based on the assumption that strong uptrends often use the 60 RSI level as support.
## The Output Table
The result of this analysis is displayed in a clear table:
Score Value: An overall grade from 0 to 100 that provides a weighted summary of the four components mentioned above.
R2 Value (%): Indicates the percentage of "linearity" of the identified trend.
Regression Length: The number of candles over which the most stable trend was found.
Channel Z-Value: Measures how many standard deviations the current price is away from the trend line. A high positive value (> 1.8) can indicate an over-extended or "overheated" condition.
Evaluation: An auto-generated text that translates the mathematical values into a human-readable assessment. It distinguishes between stable trends, momentum-driven (unstable) trends, corrections, and sideways phases.
Multi-Timeframe Analysis: Shows the "Evaluation" for various timeframes (from 5 minutes to 1 week), allowing for a quick overview of the asset's overall picture.
## Flexibility through Profiles and Manual Control
One of the indicator's greatest strengths is its customizability:
Profiles: You can switch between three predefined analysis profiles with a single click:
Short-Term: Focuses on high momentum for day trading.
Mid-Term: A balanced setting for swing trading (Standard).
Long-Term: Focuses on the stability of the primary trend for investors.
Manual Mode: Allows you to adjust every single setting (R2 lengths, score weights) yourself to perfectly tailor the indicator to your own strategy and the specific chart.
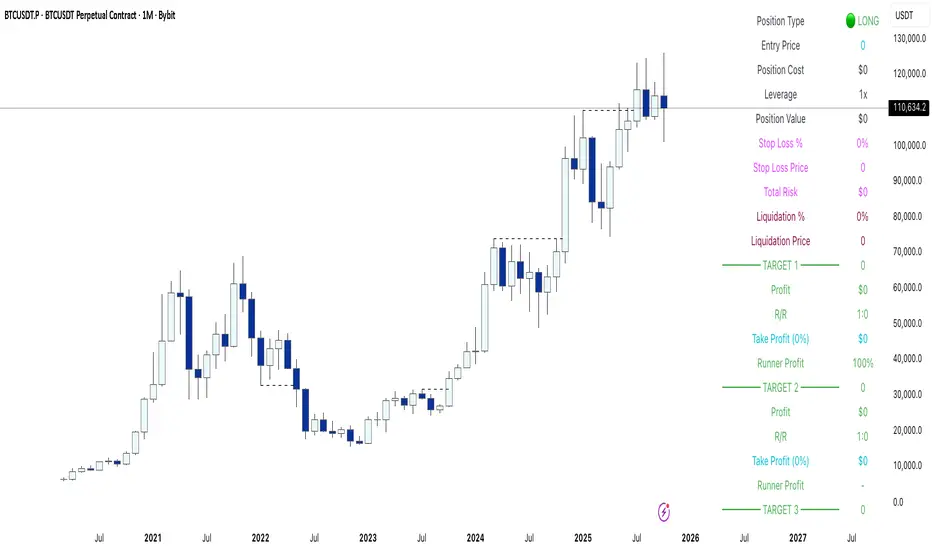
Yuki Leverage RR Calculator**YUKI LEVERAGE RR CALCULATOR**
A professional-grade risk/reward calculator for leveraged crypto or forex trades.
Instantly visualizes entry, stop loss, targets, leverage, and risk-to-reward ratios — helping you plan precise positions with confidence.
──────────────────────────────
**WHAT IT DOES**
Calculates position value, quantity, stop-loss price, liquidation estimate, and per-target profit.
Displays everything in an on-chart table with optional price tags and alerts.
──────────────────────────────
**KEY FEATURES**
• Long / Short toggle (only one active at a time)
• Leverage-aware position sizing based on Position Cost ($) and Leverage
• Dynamic Stop Loss: input % → auto price + $ risk
• Up to 3 Take-Profit Targets with scaling logic
• Instant R:R ratios per target
• Liquidation estimate (approximation only)
• ENTRY / SL / T1 / T2 / T3 / LIQ visual tags
• Dark/Light mode, adjustable table and tag size
• Built-in alerts for Targets and Stop Loss
──────────────────────────────
**INPUTS**
• Long or Short selection
• Entry Price, Stop Loss %
• Target 1 / Target 2 / Target 3 + Take Profit %
• Position Cost ($), Leverage
• Visual preferences: show/hide table, table corner, font size, tag offset, text size
──────────────────────────────
**TABLE OUTPUTS**
Position Info: Type, Entry, Position Cost, Leverage, Value
Risk Section: Stop Loss %, Stop Loss Price, Total Risk ($), Liquidation % & Price
Targets 1–3: Profit ($), R:R, Take Profit ($), Runner % or PnL
──────────────────────────────
**ALERTS**
• Target 1 Hit – when price crosses T1
• Target 2 Hit – when price crosses T2
• Target 3 Hit – when price crosses T3
• Stop Loss Hit – triggers based on direction
(Use TradingView Alerts → Condition → Indicator → select desired alert)
──────────────────────────────
**HOW TO USE**
1. Choose Long or Short
2. Enter Entry Price, Stop Loss %, Position Cost, and Leverage
3. Add Targets 1–3 with optional Take Profit %
4. Adjust visuals as desired
5. Monitor table + alerts for live trade planning
──────────────────────────────
**NOTES**
• Liquidation values are estimates only
• Fees, slippage, and funding not included
• Designed for educational and planning purposes
──────────────────────────────
⚠️ **DISCLAIMER**
For educational use only — not financial advice.
Trading leveraged products involves high risk of loss.
Always confirm calculations with your exchange and trade responsibly.
X Feigenbaumplots forward “projection zones” derived from a user-defined Feigenbaum Deterministic Range (FDR). Starting from two anchor prices (p01a, p01b) that define the initial condition, the tool computes successive expansion zones above and below that range using fixed scale factors. Each zone is rendered as a shaded box with optional edge outlines, an auto-midline, and an optional label—giving you an at-a-glance map of where price may propagate next.
This indicator is a visual framework, not a signal generator. It’s meant to be combined with your existing structure/flow reads (order flow, VWAPs, ORs, HTF levels, etc.) to plan scenarios, targets, and invalidation.
Key ideas (context)
Initial condition → expansions: You define a deterministic base range (FDR) from which the script projects outward “echoes.”
Bidirectional mapping: Zones are drawn symmetrically as +1, +2, +3, +4 (above) and −1, −2, −3, −4 (below) to reflect potential propagation in either direction.
Diminishing confidence with distance: Farther zones are for scenario planning/targets; nearer zones are more actionable for risk placement and management.
How the levels are built
Feigenbaum Deterministic Range (FDR):
Inputs p01a and p01b define the initial range (FDR = p01a − p01b).
Category “F Range” draws that base box.
Projection Zones:
The script computes zone pairs by offsetting from the initial range using fixed multipliers of FDR. In code, these are the pre-set coefficients:
±1: 0.6714 and 1.5029
±2: 2.5699 and 3.6692
±3: 6.1398 and 8.3384
±4: 13.2796 and 17.6768
Each zone is two prices (a, b) forming a band; the same logic mirrors below the range for the negative side.
Rendering & midlines:
Each enabled category draws a filled box from the anchor bar to the right edge (current bar + extend_len).
Optional outlines (solid/dashed/dotted) for top/bottom/left/right edges.
Optional midline (always dashed) bisects each zone for quick reference.
Anchoring & timeframe logic
Anchor refresh: interval1 sets an HTF “clock” (e.g., Daily). On each new HTF bar, all categories re-anchor at that bar’s index so new projections start cleanly with the fresh session/period.
Extend control: extend_len nudges the right boundary beyond the latest bar for label/edge clarity.
Inputs & styling
Settings group:
Anchor 1 Timeframe (e.g., D) defines the refresh cadence.
Label toggles: show/hide, size, text color, and background.
Feigenbaum DR group:
Enable the base F range, set p01a/p01b, choose fill/line colors, outline style, and the mid toggle.
Ranger Factors groups (Zones ±1…±4):
Each zone can be enabled/disabled, inherits its computed prices, and has independent fill/line color, outline style, and mid toggle.
Practical usage
Scenario mapping: Use +/−1 zones for near-term impulse tracking and intraday targets; treat +/−3 and +/−4 as stretch objectives or “if trend persists” waypoints.
Confluence first: Prioritize trades when a Feigenbaum zone aligns with a known liquidity pool, session level (e.g., OR, ETH/RTH AVWAP), HTF pivot, or key option-derived levels.
Risk & invalidation: The base FDR and nearest zone edges provide clean invalidation references and partial-take structures.
Notes & limitations
The coefficients are fixed in this version (you can expose them as inputs if you want to calibrate per market).
Projections are descriptive, not predictive; treat farther zones as lower-confidence context.
Because anchors reset on the selected HTF, choose interval1 consistent with your playbook (e.g., Daily for RTH framing, Weekly for swing maps).
Output summary
Boxes: FDR (base), Zones +1/−1, +2/−2, +3/−3, +4/−4
Edges: Optional top/bottom/left/right per zone (styleable)
Midlines: Optional dashed mid per zone
Labels: Optional, style-controlled, positioned just beyond the right edge

RSI VWAP v1 [JopAlgo]RSI VWAP v1.1 made stronger by volume-aware!
We know there's nothing new and the original RSI already does an excellent job. We're just working on small, practical improvements – here's our take: The same basic idea, clearer display, and a single, specially developed rolling line: a VWAP of the RSI that incorporates volume (participation) into the calculation.
Do you prefer the pure classic?
You can still use Wilder or Cutler engines –
but the star here is the VW-RSI + rolling line.
This RSI also offers the possibility of illustrating a possible
POC (Point of Control - or the HAL or VAL) level.
However, the indicator does NOT plot any of these levels itself.
We have included an illustration in the chart for this!
We hope this version makes your decision-making easier.
What you’ll see
The RSI line with a 50 midline and optional bands: either static 70/30 or adaptive μ±k·σ of the Rolling Line.
One smoothing concept only: the Rolling Line (light blue) = VWAP of RSI.
Shadow shading between RSI and the Rolling Line (green when RSI > line, red when RSI < line).
A lighter tint only on the parts of that shadow that sit above the upper band or below the lower band (quick overbought/oversold context).
Simple divergence lines drawn from RSI pivots (green for regular bullish, red for regular bearish). No labels, no buy/sell text—kept deliberately clean.
What’s new, and why it helps
VW-RSI engine (default):
RSI can be computed from volume-weighted up/down moves, so momentum reflects how much traded when price moved—not just the direction.
Rolling Line (VWAP of RSI) with pure VWAP adaptation:
Low volume: blends toward a faster VWAP so early, thin starts aren’t missed.
Volume spikes: blends toward a slower VWAP so a single heavy bar doesn’t whip the curve.
You can reveal the Base Rolling (pre-adaptation) line to see exactly how much adaptation is happening.
Adaptive bands (optional):
Instead of fixed 70/30, use mean ± k·stdev of the Rolling Line over a lookback. Levels breathe with the market—useful in strong trends where static bounds stay pinned.
Minimal, readable panel:
One smoothing, one story. The shadow tells you who’s in control; the lighter highlight shows stretch beyond your lines.
How to read it (fast)
Bias: RSI above 50 (and a rising Rolling Line) → bullish bias; below 50 → bearish bias.
Trigger: RSI crossing the Rolling Line with the bias (e.g., above 50 and crossing up).
Stretch: Near/above the upper band, avoid chasing; near/below the lower band, avoid panic—prefer a cross back through the line.
Divergence lines: Use as context, not as standalone signals. They often help you wait for the next cross or avoid late entries into exhaustion.
Settings that actually matter
RSI Engine: VW-RSI (default), Wilder, or Cutler.
Rolling Line Length: the VWAP length on RSI (higher = calmer, lower = earlier).
Adaptive behavior (pure VWAP):
Speed-up on Low Volume → blends toward fast VWAP (factor of your length).
Dampen Spikes (volume z-score) → blends toward slow VWAP.
Fast/Slow Factors → how far those fast/slow variants sit from the base length.
Bands: choose Static 70/30 or Adaptive μ±k·σ (set the lookback and k).
Visuals: show/hide Base Rolling (ref), main shadow, and highlight beyond bands.
Signal gating: optional “ignore first bars” per day/session if you dislike open noise.
Starter presets
Scalp (1–5m): RSI 9–12, Rolling 12–18, FastFactor ~0.5, SlowFactor ~2.0, Adaptive on.
Intraday (15m–1H): RSI 10–14, Rolling 18–26, Bands k = 1.0–1.4.
Swing (4H–1D): RSI 14–20, Rolling 26–40, Bands k = 1.2–1.8, Adaptive on.
Where it shines (and limits)
Best: liquid markets where volume structure matters (majors, indices, large caps).
Works elsewhere: even with imperfect volume, the shadow + bands remain useful.
Limits: very thin/illiquid assets reduce the benefit of volume-weighting—lengthen settings if needed.
Attribution & License
Based on the concept and baseline implementation of the “Relative Strength Index” by TradingView (Pine v6 built-in).
Released as Open-source (MPL-2.0). Please keep the license header and attribution intact.
Disclaimer
For educational purposes only; not financial advice. Markets carry risk. Test first, use clear levels, and manage risk. This project is independent and not affiliated with or endorsed by TradingView.

ICT Killzones & MacrosICT Killzones & Macros (v1.1.5) — configurable ICT session windows + refined “macro” windows with live High/Low levels, optional extensions, next-window previews, and lightweight opening-price lines. Built to be clock-robust, timezone-aware, and performant on intraday charts.
Tip: All times are interpreted in your chosen IANA timezone (default: America/New_York) and auto-handle DST. You can rename, recolor, enable/disable, and retime every window.
What it plots
- Killzones (5) : Asia (19:00–02:00), London (02:00–05:00), NY AM (07:00–09:30), London Close (10:00–12:00), NY PM (13:30–16:00) — full-height boxes with optional header.
- Macros (8) (defaults tailored for common ICT “refined” windows): Asia-1 (18:00–21:00), Asia-2 (21:00–00:00), London-1 (01:00–04:00), AM-1 (09:45–10:15), AM-2 (10:45–11:15), Lunch (12:00–13:00), PM-1 (13:30–14:30), Power Hour (15:10–16:00).
- Live High/Low lines for the current Macro/Killzone window.
- Optional HL extension to the right until price crosses or the trading day rolls (style selectable).
- “Next” previews : earliest upcoming Macro and Killzone header; optional next-window background band.
- Opening Prices (3 lightweight time lines) : defaults 00:00, 08:30, 09:30 with right-edge labels, scoped to a session you choose (auto-cleans at session end).
- Key inputs & styling
- General : Timezone (IANA), “Sessions to show” (per window) to keep only the last N completed windows.
- Header : height (ticks), gap (ticks), fill opacity, border width/style, text size/color, toggle “Next Macro/Killzone” headers.
- Boxes : global fill opacity, global border width/style (used by both Macros & Killzones).
- High/Low : show HL, HL line style, extend on/off + extension style, optional extension labels.
- Opening Prices : enable Time 1/2/3, set HH:MM for each, session window, per-line colors, style (dotted/dashed/solid), width.
- Per-window controls : each Macro/Killzone has Enable, Session (HHMM-HHMM), Label, Fill color.
How to use (quick start)
- Set Timezone to your preference (default America/New_York).
- Toggle on the Macros and Killzones you trade. Adjust session times if needed.
- (Optional) Turn on Extend High/Low to project levels until crossed/day-roll.
- (Optional) Enable Next… headers to see the next upcoming window at a glance.
- (Optional) Configure Opening Prices (00:00 / 08:30 / 09:30 by default) and the session over which they appear.
Behavior & notes
- Time windows are computed by clock, not by guessing bar timestamps, making them robust across brokers and timeframes.
- With HL extension on, the current window’s levels extend until crossed or the end of the trading day (in your timezone). With it off, completed windows keep static HL markers (limited by “Sessions to show”).
- “Sessions to show” applies per Macro/Killzone to automatically prune older windows and keep charts snappy.
- Opening-price lines exist only within the chosen “Opening Prices Session” and are removed when it ends (keeps charts clean).
Defaults (color cues)
Killzones: Asia (blue), London (purple), NY AM (green), London Close (yellow), NY PM (orange).
Macros: neutral greys with Lunch and PM accents out of the box (all customizable).
Performance tips
- Reduce “Sessions to show” if you scroll far back in history.
- Disable “Next…” previews and/or extension labels on very slow machines.
- Narrow the “Opening Prices Session” window to exactly when you need those lines.
Changelog highlights
- v1.1.5 : Internal refinements and stability.
- v1.1.3 : Live High/Low lines for current windows + optional extension.
- v1.1.2 : Added “next Killzone” preview (to match “next Macro”).
- v1.1.0 : Defaults updated (5 KZ, 8 Macros). Removed “snap-to-killzone” behavior.
- v1.0.0 : Independent Macro vs. Killzone rendering; cleaner header logic.
- Known limitations
If your chart warns about drawings, trim “Sessions to show”.
If your broker session times differ from NY hours, adjust the sessions or change the indicator timezone.
Credits & intent
Inspired by ICT timing concepts; provided for education/mark-up, not financial advice.
Built to be flexible so you can mirror your personal playbook and journaling workflow.

Zark CRT Line/Marker Color & Style Meaning
Previous Candle CRT Green (bullish) / Red (bearish) solid line Sweep confirmed on the previous candle
Current Candle CRT Green (bullish) / Red (bearish) dashed line Sweep currently happening on the current candle
Higher Timeframe CRT Orange dotted line Sweep from higher timeframe shown on lower timeframe chart
Target Line Blue dashed line Opposite side of liquidity for potential price target
Breaker Confirmed Aqua solid line (over previous/current CRT) Sweep confirmed with a break of a small swing
CRT Invalidated Gray line Sweep no longer valid (price closed beyond sweep level)
Full-Height HTF Divider Yellow vertical line Marks each higher timeframe bar for visual separation
Labels White text on colored background Shows type (Prev/Curr/HTF) and exact price

Squeeze Weekday Frequency [CHE] Squeeze Weekday Frequency — Tracks historical frequency of low-volatility squeezes by weekday to inform timing of low-risk setups.
Summary
This indicator monitors periods of unusually low volatility, defined as when the average true range falls below a percentile threshold, and tallies their occurrences across each weekday. By aggregating these counts over the chart's history, it reveals patterns in squeeze frequency, helping traders avoid or target specific days for reduced noise. The approach uses persistent counters to ensure accurate daily tallies without duplicates, providing a robust view of weekday biases in volatility regimes.
Motivation: Why this design?
Traders often face inconsistent signal quality due to varying volatility patterns tied to the trading calendar, such as quieter mid-week sessions or busier Mondays. This indicator addresses that by binning low-volatility events into weekday buckets, allowing users to spot recurring low-activity days where trends may develop with less whipsaw. It focuses on historical aggregation rather than real-time alerts, emphasizing pattern recognition over prediction.
What’s different vs. standard approaches?
- Reference baseline: Traditional volatility trackers like simple moving averages of range or standalone Bollinger Band squeezes, which ignore temporal distribution.
- Architecture differences:
- Employs array-based persistent counters for each weekday to accumulate events without recounting.
- Includes duplicate prevention via day-key tracking to handle sparse data.
- Features on-demand sorting and conditional display modes for focused insights.
- Practical effect: Charts show a persistent table of ranked weekdays instead of transient plots, making it easier to glance at biases like higher squeezes on Fridays, which reduces the need for manual logging and highlights calendar-driven edges.
How it works (technical)
The indicator first computes the average true range over a specified lookback period to gauge recent volatility. It then ranks this value against its own history within a sliding window to identify squeezes when the rank drops below the threshold. Each bar's timestamp is resolved to a weekday using the selected timezone, and a unique day identifier is generated from the date components.
On detecting a squeeze and valid price data, it checks against a stored last-marked day for that weekday to avoid multiple counts per day. If it's a new occurrence, the corresponding weekday counter in an array increments. Total days and data-valid days are tracked separately for context.
At the chart's last bar, it sums all counters to compute shares, sorts weekdays by their squeeze proportions, and populates a table with the selected subset. The table alternates row colors and highlights the peak weekday. An info label above the final bar summarizes totals and the top day. Background shading applies a faint red to squeeze bars for visual confirmation. State persists via variable arrays initialized once, ensuring counts build incrementally without resets.
Parameter Guide
ATR Length — Sets the lookback for measuring average true range, influencing squeeze sensitivity to short-term swings. Default: 14. Trade-offs/Tips: Shorter values increase responsiveness but raise false positives in chop; longer smooths for stability, potentially missing early squeezes.
Percentile Window (bars) — Defines the history length for ranking the current ATR, balancing recent relevance with sample size. Default: 252. Trade-offs/Tips: Narrower windows adapt faster to regime shifts but amplify noise; wider ones stabilize ranks yet lag in fast markets—aim for 100-500 bars on daily charts.
Squeeze threshold (PR < x) — Determines the cutoff for low-volatility classification; lower values flag rarer, tighter squeezes. Default: 10.0. Trade-offs/Tips: Tighter thresholds (under 5) yield fewer but higher-quality signals, reducing clutter; looser (over 20) captures more events at the cost of relevance.
Timezone — Selects the reference for weekday assignment; exchange default aligns with asset's session. Default: Exchange. Trade-offs/Tips: Use custom for cross-market analysis, but verify alignment to avoid offset errors in global pairs.
Show — Toggles the results table visibility for quick on/off of the display. Default: true. Trade-offs/Tips: Disable in multi-indicator setups to save screen space; re-enable for periodic reviews.
Pos — Positions the table on the chart pane for optimal viewing. Default: Top Right. Trade-offs/Tips: Bottom options suit long-term charts; test placements to avoid overlapping price action.
Font — Adjusts text size in the table for readability at different zooms. Default: normal. Trade-offs/Tips: Smaller fonts fit more data but strain eyes on small screens; larger for presentations.
Dark — Applies a dark color scheme to the table for contrast against chart backgrounds. Default: true. Trade-offs/Tips: Toggle false for light themes; ensures legibility without manual recoloring.
Display — Filters table rows to show all, top three, or bottom three weekdays by squeeze share. Default: All. Trade-offs/Tips: Use "Top 3" for focus on high-frequency days in active trading; "All" for full audits.
Reading & Interpretation
Red-tinted backgrounds mark individual squeeze bars, indicating current low-volatility conditions. The table's summary row shows the highest squeeze count, its percentage of total events, and the associated weekday in teal. Detail rows list selected weekdays with their absolute counts, proportional shares, and a left arrow for the peak day—higher percentages signal days where squeezes cluster, suggesting potential for calmer trend development. The info label reports overall days observed, valid data days, and reiterates the top weekday with its count. Drifting counts toward zero on a weekday imply rarity, while elevated ones point to habitual low-activity sessions.
Practical Workflows & Combinations
- Trend following: Scan for squeezes on high-frequency weekdays as entry filters, confirming with higher highs or lower lows in the structure; pair with momentum oscillators to time breaks.
- Exits/Stops: On low-squeeze days, widen stops for breathing room, tightening them during peak squeeze periods to guard against false breaks—use the table's percentages as a regime proxy.
- Multi-asset/Multi-TF: Defaults work across forex and indices on hourly or daily frames; for stocks, adjust percentile window to 100 for shorter histories. Scale thresholds up by 5-10 points for high-vol assets like crypto to maintain signal sparsity.
Behavior, Constraints & Performance
- Repaint/confirmation: Counts update only on confirmed bars via day-key changes, with no future references—live bars may shade red tentatively but tallies finalize at session close.
- security()/HTF: Not used, so no higher-timeframe repaint risks; all computations stay in the chart's resolution.
- Resources: Relies on a fixed-size array of seven elements and small loops for sorting and table fills, capped at 5000 bars back—efficient for most charts but may slow on very long intraday histories.
- Known limits: Ignores weekends and holidays implicitly via data presence; early chart bars lack full percentile context, leading to initial undercounting; assumes continuous sessions, so gaps in data (e.g., news halts) skew totals.
Sensible Defaults & Quick Tuning
Start with the built-in values for broad-market daily charts: ATR at 14, window at 252, threshold at 10. For noisier environments, lower the threshold to 5 and shorten the window to 100 to prioritize rare squeezes. If too few events appear, raise the threshold to 15 and extend ATR to 20 for broader capture. To combat overcounting in sparse data, widen the window to 500 while keeping others stock—monitor the info label's data-days count before trusting patterns.
What this indicator is—and isn’t
This serves as a statistical overlay for spotting calendar-based volatility biases, aiding in session selection and filter design. It is not a standalone signal generator, predictive model, or risk manager—integrate it with price action, volume, and broader strategy rules for decisions.
Disclaimer
The content provided, including all code and materials, is strictly for educational and informational purposes only. It is not intended as, and should not be interpreted as, financial advice, a recommendation to buy or sell any financial instrument, or an offer of any financial product or service. All strategies, tools, and examples discussed are provided for illustrative purposes to demonstrate coding techniques and the functionality of Pine Script within a trading context.
Any results from strategies or tools provided are hypothetical, and past performance is not indicative of future results. Trading and investing involve high risk, including the potential loss of principal, and may not be suitable for all individuals. Before making any trading decisions, please consult with a qualified financial professional to understand the risks involved.
By using this script, you acknowledge and agree that any trading decisions are made solely at your discretion and risk.
Do not use this indicator on Heikin-Ashi, Renko, Kagi, Point-and-Figure, or Range charts, as these chart types can produce unrealistic results for signal markers and alerts.
Best regards and happy trading
Chervolino

Squeeze Hour Frequency [CHE]Squeeze Hour Frequency (ATR-PR) — Standalone — Tracks daily squeeze occurrences by hour to reveal time-based volatility patterns
Summary
This indicator identifies periods of unusually low volatility, defined as squeezes, and tallies their frequency across each hour of the day over historical trading sessions. By aggregating counts into a sortable table, it helps users spot hours prone to these conditions, enabling better scheduling of trading activity to avoid or target specific intraday regimes. Signals gain robustness through percentile-based detection that adapts to recent volatility history, differing from fixed-threshold methods by focusing on relative lowness rather than absolute levels, which reduces false positives in varying market environments.
Motivation: Why this design?
Traders often face uneven intraday volatility, with certain hours showing clustered low-activity phases that precede or follow breakouts, leading to mistimed entries or overlooked calm periods. The core idea of hourly squeeze frequency addresses this by binning low-volatility events into 24 hourly slots and counting distinct daily occurrences, providing a historical profile of when squeezes cluster. This reveals time-of-day biases without relying on real-time alerts, allowing proactive adjustments to session focus.
What’s different vs. standard approaches?
- Reference baseline: Classical volatility tools like simple moving average crossovers or fixed ATR thresholds, which flag squeezes uniformly across the day.
- Architecture differences:
- Uses persistent arrays to track one squeeze per hour per day, preventing overcounting within sessions.
- Employs custom sorting on ratio arrays for dynamic table display, prioritizing top or bottom performers.
- Handles timezones explicitly to ensure consistent binning across global assets.
- Practical effect: Charts show a persistent table ranking hours by squeeze share, making intraday patterns immediately visible—such as a top hour capturing over 20 percent of total events—unlike static overlays that ignore temporal distribution, which matters for avoiding low-liquidity traps in crypto or forex.
How it works (technical)
The indicator first computes a rolling volatility measure over a specified lookback period. It then derives a relative ranking of the current value against recent history within a window of bars. A squeeze is flagged when this ranking falls below a user-defined cutoff, indicating the value is among the lowest in the recent sample.
On each bar, the local hour is extracted using the selected timezone. If a squeeze occurs and the bar has price data, the count for that hour increments only if no prior mark exists for the current day, using a persistent array to store the last marked day per hour. This ensures one tally per unique trading day per slot.
At the final bar, arrays compile counts and ratios for all 24 hours, where the ratio represents each hour's share of total squeezes observed. These are sorted ascending or descending based on display mode, and the top or bottom subset populates the table. Background shading highlights live squeezes in red for visual confirmation. Initialization uses zero-filled arrays for counts and negative seeds for day tracking, with state persisting across bars via variable declarations.
No higher timeframe data is pulled, so there is no repaint risk from external fetches; all logic runs on confirmed bars.
Parameter Guide
ATR Length — Controls the lookback for the volatility measure, influencing sensitivity to short-term fluctuations; shorter values increase responsiveness but add noise, longer ones smooth for stability — Default: 14 — Trade-offs/Tips: Use 10-20 for intraday charts to balance quick detection with fewer false squeezes; test on historical data to avoid over-smoothing in trending markets.
Percentile Window (bars) — Sets the history depth for ranking the current volatility value, affecting how "low" is defined relative to past; wider windows emphasize long-term norms — Default: 252 — Trade-offs/Tips: 100-300 bars suit daily cycles; narrower for fast assets like crypto to catch recent regimes, but risks instability in sparse data.
Squeeze threshold (PR < x) — Defines the cutoff for flagging low relative volatility, where values below this mark a squeeze; lower thresholds tighten detection for rarer events — Default: 10.0 — Trade-offs/Tips: 5-15 percent for conservative signals reducing false positives; raise to 20 for more frequent highlights in high-vol environments, monitoring for increased noise.
Timezone — Specifies the reference for hourly binning, ensuring alignment with market sessions — Default: Exchange — Trade-offs/Tips: Set to "America/New_York" for US assets; mismatches can skew counts, so verify against chart timezone.
Show Table — Toggles the results display, essential for reviewing frequencies — Default: true — Trade-offs/Tips: Disable on mobile for performance; pair with position tweaks for clean overlays.
Pos — Places the table on the chart pane — Default: Top Right — Trade-offs/Tips: Bottom Left avoids candle occlusion on volatile charts.
Font — Adjusts text readability in the table — Default: normal — Trade-offs/Tips: Tiny for dense views, large for emphasis on key hours.
Dark — Applies high-contrast colors for visibility — Default: true — Trade-offs/Tips: Toggle false in light themes to prevent washout.
Display — Filters table rows to focus on extremes or full list — Default: All — Trade-offs/Tips: Top 3 for quick scans of risky hours; Bottom 3 highlights safe low-squeeze periods.
Reading & Interpretation
Red background shading appears on bars meeting the squeeze condition, signaling current low relative volatility. The table lists hours as "H0" to "H23", with columns for daily squeeze counts, percentage share of total squeezes (summing to 100 percent across hours), and an arrow marker on the top hour. A summary row above details the peak count, its share, and the leading hour. A label at the last bar recaps total days observed, data-valid days, and top hour stats. Rising shares indicate clustering, suggesting regime persistence in that slot.
Practical Workflows & Combinations
- Trend following: Scan for hours with low squeeze shares to enter during stable regimes; confirm with higher highs or lower lows on the 15-minute chart, avoiding top-share hours post-news like tariff announcements.
- Exits/Stops: Tighten stops in high-share hours to guard against sudden vol spikes; use the table to shift to conservative sizing outside peak squeeze times.
- Multi-asset/Multi-TF: Defaults work across crypto pairs on 5-60 minute timeframes; for stocks, widen percentile window to 500 bars. Combine with volume oscillators—enter only if squeeze count is below average for the asset.
Behavior, Constraints & Performance
Logic executes on closed bars, with live bars updating counts provisionally but finalizing on confirmation; table refreshes only at the last bar, avoiding intrabar flicker. No security calls or higher timeframes, so no repaint from external data. Resources include a 5000-bar history limit, loops up to 24 iterations for sorting and totals, and arrays sized to 24 elements; labels and table are capped at 500 each for efficiency. Known limits: Skips hours without bars (e.g., weekends), assumes uniform data availability, and may undercount in sparse sessions; timezone shifts can alter profiles without warning.
Sensible Defaults & Quick Tuning
Start with ATR Length at 14, Percentile Window at 252, and threshold at 10.0 for broad crypto use. If too many squeezes flag (noisy table), raise threshold to 15.0 and narrow window to 100 for stricter relative lowness. For sluggish detection in calm markets, drop ATR Length to 10 and threshold to 5.0 to capture subtler dips. In high-vol assets, widen window to 500 and threshold to 20.0 for stability.
What this indicator is—and isn’t
This is a historical frequency tracker and visualization layer for intraday volatility patterns, best as a filter in multi-tool setups. It is not a standalone signal generator, predictive model, or risk manager—pair it with price action, news filters, and position sizing rules.
Disclaimer
The content provided, including all code and materials, is strictly for educational and informational purposes only. It is not intended as, and should not be interpreted as, financial advice, a recommendation to buy or sell any financial instrument, or an offer of any financial product or service. All strategies, tools, and examples discussed are provided for illustrative purposes to demonstrate coding techniques and the functionality of Pine Script within a trading context.
Any results from strategies or tools provided are hypothetical, and past performance is not indicative of future results. Trading and investing involve high risk, including the potential loss of principal, and may not be suitable for all individuals. Before making any trading decisions, please consult with a qualified financial professional to understand the risks involved.
By using this script, you acknowledge and agree that any trading decisions are made solely at your discretion and risk.
Do not use this indicator on Heikin-Ashi, Renko, Kagi, Point-and-Figure, or Range charts, as these chart types can produce unrealistic results for signal markers and alerts.
Best regards and happy trading
Chervolino
Thanks to Duyck
for the ma sorter

Event Marking [zidaniee]This is not a technical analysis indicator, but a visual tool designed to mark important global events using vertical lines on your chart.
By placing a single marker at the exact time an event occurred, you can compare how different assets reacted to that global event — before, during, and after it happened.
In the example provided, the marking corresponds to the moment when U.S. President Donald Trump announced a 100% tariff on goods from China, which was immediately reflected in market reactions worldwide.
The indicator includes full customization features for:
• Event label text
• Label size and position
• Line color, style, and width
Enjoy

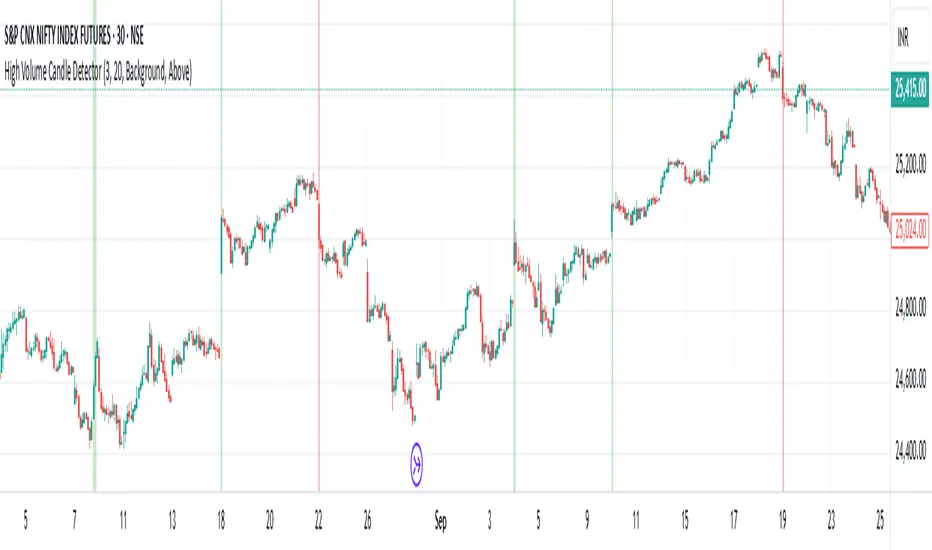
High Volume Candle Detector by Ravi Shinde📊 High Volume Candle Detector
🎯 Overview
Identify exceptional volume spikes that signal institutional activity, breakouts, and reversals. Detects candles with volume exceeding a customizable threshold (default: 3x average volume over 20 periods).
✨ Key Features
🔧 Customizable Settings
Volume Multiplier (default: 3.0x) - Define your threshold
Average Period (default: 20) - Adapt to any timeframe
Bullish/Bearish Detection - Automatic color coding (green/red)
🎨 Visual Styles
Background - Subtle colored highlighting
Border - Yellow box outline
Shape - Triangle markers with "HV" text
All - Combined display
🔔 Smart Alerts
Bullish High Volume 🟢
Bearish High Volume 🔴
Any High Volume ⚠️
📈 Derivatives Trading Method
High-volume candle highs and lows mark key breakout levels. Break above = Go Long. Break below = Go Short. Trail your stop-loss with a moving average of your choice for optimal risk management. Optimal performance on 15-minute or higher timeframes. Lower timeframes may generate excessive noise.
Orderflow Label with OffsetThis Pine Script automatically displays orderflow labels on the chart to visualize the current market structure and potential breakout or reversal zones.
It compares the current candle’s high and low with those of the previous cycle (e.g., 90 minutes) and places descriptive labels that highlight possible bullish or bearish behavior.
Functionality & Logic (Step-by-step explanation)
Inputs:
cycleLength: Defines the duration of one “cycle” in minutes (for example, 90 minutes).
labelXOffset: Moves the label a few bars to the right, so it doesn’t overlap the current candle.
labelStyleOffset: Controls whether labels appear pointing to the right or left side of the chart.
Previous Cycle:
The script uses request.security to retrieve the high and low from the previous cycle timeframe.
These act as reference points (similar to key levels or market structure highs/lows).
Current Candle:
The script reads the current bar’s high, low, and close values for comparison.
Orderflow Conditions:
bullSupport: The current high and close are both above the previous high → bullish breakout (strong continuation).
bullReject: The high breaks above the previous high but closes below → bullish rejection / possible top.
bearRes: The low and close are both below the previous low → bearish breakdown (continuation to downside).
bearReclaim: The low goes below the previous low but closes above → bearish reclaim / possible reversal.
Label Logic:
Before creating a new label, the previous one is deleted (label.delete(flowLbl)) to avoid clutter.
The label’s X position is shifted using xPos = bar_index + labelXOffset.
The style (left/right) is set based on the user’s preference.
Displayed Labels:
🟢 Bullish Breakout → price closes above the previous cycle high.
🟠 Bullish Rejection → fake breakout or possible top.
🔴 Bearish Breakdown → price closes below the previous cycle low.
🟡 Bearish Reclaim → failed breakdown or potential trend reversal.
⚪ Neutral (Wait) → no clear signal, advises patience and watching for setups (like CHoCH or FVGs).
Visual Behavior:
The labels appear slightly to the right of the bar for better visibility.
The color and text alignment dynamically adjust depending on whether the label is pointing left or right.

3-1-2 Strat Combo by NaturalBelleThe 3-1-2 Strat Combo by NaturalBelle automatically detects and highlights one of The Strat’s most powerful reversal patterns — the 3-1-2 setup.
When a 3 (outside bar) is followed by a 1 (inside bar) and then a 2 that breaks direction, this script plots yellow triangles and draws yellow box zones across the sequence, giving traders a clean visual cue for potential reversals or continuations.
Features:
Highlights both bullish (3-1-2-Up) and bearish (3-1-2-Down) sequences
Draws yellow boxes covering the 3-1-2 structure for easy zone recognition
Optional text labels for clarity
Adjustable box extension and transparency
Built-in alert conditions for both up and down setups
This clean, no-clutter version focuses purely on price action — no indicators, no noise. Just the pattern.
🟡 Best used on: Any timeframe
🟡 Strategy: Combine with market structure, EMAs, or supply & demand zones for confirmation
Created by NaturalBelle — keeping Strat analysis simple, visual, and precise.

ORDER BLCOK custom strategy# OB Matrix Strategy - Documentation
**Version:** 1.0
**Author:** HPotter
**Date:** 31/07/2017
The **OB Matrix Strategy** is based on the identification of **bullish and bearish Order Blocks** and the management of conditional orders with multiple Take Profit (TP) and Stop Loss (SL) levels. It uses trend filters, ATR, and percentage-based risk management.
---
## 1. Main Parameters
### Strategy
- `initial_capital`: 50
- `default_qty_type`: percentage of capital
- `default_qty_value`: 10
### Money Management
- `rr_threshold`: minimum Risk/Reward threshold to open a trade
- `risk_percent`: percentage of capital to risk per trade (default 2%)
- `maxPendingBars`: maximum number of bars for a pending order
- `maxBarsOpen`: maximum number of bars for an open position
- `qty_tp1`, `qty_tp2`, `qty_tp3`: quantity percentages for multiple TPs
---
## 2. Order Block Identification
### Order Block Parameters
- `obLookback`: number of bars to identify an Order Block
- `obmode`: method to calculate the block (`Full` or `Breadth`)
- `obmiti`: method to determine block mitigation (`Close`, `Wick`, `Avg`)
- `obMaxBlocks`: maximum number of Order Blocks displayed
### Main Variables
- `bullBlocks`: array of bullish blocks
- `bearBlocks`: array of bearish blocks
- `last_bull_volume`, `last_bear_volume`: volume of the last block
- `dom_block`: dominant block type (Bullish/Bearish/None)
- `block_strength`: block strength (normalized volume)
- `price_distance`: distance between current price and nearest block
---
## 3. Visual Parameters
- `Width`: line thickness for swing high/low
- `amountOfBoxes`: block grid segments
- `showBorder`: show block borders
- `borderWidth`: width of block borders
- `showVolume`: display volume inside blocks
- `volumePosition`: vertical position of volume text
Customizable colors:
- `obHighVolumeColor`, `obLowVolumeColor`, `obBearHighVolumeColor`, `obBearLowVolumeColor`
- `obBullBorderColor`, `obBearBorderColor`
- `obBullFillColor`, `obBearFillColor`
- `volumeTextColor`
---
## 4. Screener Table
- `showScreener`: display the screener table
- `tablePosition`: table position (`Top Left`, `Top Right`, `Bottom Left`, `Bottom Right`)
- `tableSize`: table size (`Small`, `Normal`, `Large`)
The table shows:
- Symbol, Timeframe
- Type and status of Order Block
- Number of retests
- Bullish and bearish volumes
---
## 5. Trend Filters
- EMA as a trend filter (`emaPeriod`, default 223)
- `bullishTrend` if close > EMA
- `bearishTrend` if close < EMA
---
## 6. ATR and Swing Points
- ATR calculated with a customizable period (`atrLength`)
- Swing High/Low for SL/TP calculation
- `f_getSwingTargets` function to calculate SL and TP based on direction
---
## 7. Trade Logic
### Buy Limit on Bullish OB
- Conditions:
- New bullish block
- Uptrend
- RR > threshold (`rr_threshold`)
- SL: `bullishOBPrice * (1 - atr * atrMultiplier)`
- Multiple TPs: TP1 (50%), TP2 (80%), TP3 (100% max)
- Quantity calculation based on percentage risk
### Sell Limit on Bearish OB
- Conditions:
- New bearish block
- Downtrend
- RR > threshold (`rr_threshold`)
- SL: `bearishOBPrice * (1 + atr * atrMultiplier)`
- Multiple TPs: TP1 (50%), TP2 (80%), TP3 (100% max)
- Quantity calculation based on percentage risk
---
## 8. Order Management and Timeout
- Close pending orders after `maxPendingBars` bars
- Close open positions after `maxBarsOpen` bars
- Label management for open orders
---
## 9. Alert Conditions
- `bull_touch`: price inside maximum bullish volume zone
- `bear_touch`: price inside maximum bearish volume zone
- `bull_reject`: confirmation of bullish zone rejection
- `bear_reject`: confirmation of bearish zone rejection
- `new_bull`: new bullish block
- `new_bear`: new bearish block
---
## 10. Level Calculation
- Swing levels based on selected timeframe (`SelectPeriod`)
- `xHigh` and `xLow` for S1 and R1 calculation
- Levels plotted on chart
---
## 11. Take Profit / Stop Loss
- Extended horizontal lines (`extendBars`) to visualize TP and SL
- Customizable colors (`tpColor`, `slColor`)
---
## 12. Notes
- Complete script based on Pine Script v5
- Advanced graphical management with boxes, lines, labels
- Dynamically displays volumes and Order Blocks
- Integrated internal screener
---
### End of Documentation

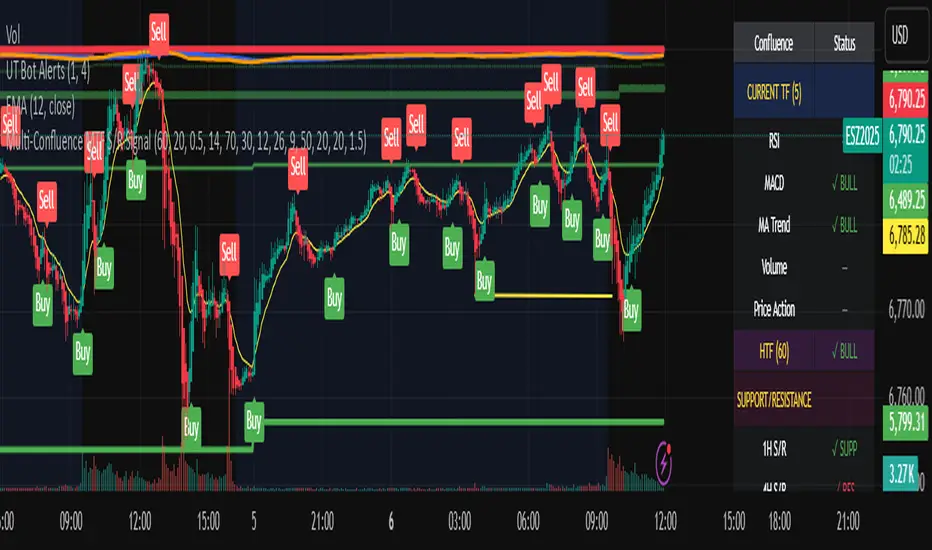
MTF Market Bias+ (Smart Multi-Timeframe Trend Dashboard)The MTF Market Bias+ indicator provides a clear, data-driven view of market direction across multiple timeframes — from scalper to swing trader level.
It automatically calculates the bullish / bearish / neutral bias for each selected timeframe using various configurable methods such as EMA slope, price vs EMA, or EMA50 vs EMA200.
This tool gives you an instant overview of market alignment and helps you identify when lower and higher timeframes are in sync — the most powerful condition for high-probability trades.
🔍 Core Features
✅ Multi-Timeframe Bias Dashboard: Visual table showing bullish/bearish sentiment across your chosen timeframes (from 3m to 1W).
⚙️ Customizable Methods: Choose between
EMA Slope (default) → detects trend direction by EMA momentum
Price vs EMA → shows short-term strength or weakness
EMA50 vs EMA200 → classic golden cross vs death cross structure
🎨 Configurable Colors, Size & Layout: Adjust background, text, and label sizes for any chart style.
📊 Summary Row: Displays the majority trend (bullish, bearish, or neutral) with real-time score.
🧩 Adaptive Background Mode (optional): Automatically colors your chart background according to overall bias.
💡 Method Info Panel: Clearly shows which method and parameters are active (e.g. “EMA Slope | EMA=50”).
📈 How to Use
Add the indicator to your chart.
Select the timeframes you want to monitor (e.g. 3m, 5m, 15m, 1h, 4h, D, W).
Watch for alignment between lower and higher timeframes:
When all turn green → strong bullish alignment → consider longs.
When all turn red → strong bearish alignment → consider shorts.
Mixed colors indicate consolidation or correction phases.
Combine it with your favorite Fair Value Gap, CHOCH/BOS, or Liquidity Sweep strategy to significantly improve trade timing and confidence.
🧩 Author’s Note
This indicator is designed for traders who want fast, visual confirmation of multi-timeframe structure without cluttering their charts.
It’s simple, lightweight, and highly adaptable — whether you’re scalping on 3-minute charts or swing trading daily candles.

Session-Conditioned Regime ATRWhy this exists
Classic ATR is great—until the open. The first few bars often inherit overnight gaps and 24-hour noise that have nothing to do with the intraday regime you actually trade. That inflates early ATR, scrambles thresholds, and invites hyper-recency bias (“today is crazy!”) when it’s just the open being the open.
This tool was built to:
Separate session reality from 24h noise. Measure volatility only inside your defined session (e.g., NYSE 09:30–16:00 ET).
Judge candles against the current regime, not the last 2–3 bars. A rolling statistic from the last N completed sessions defines what “typical” means right now.
Label “large” and “small” objectively. Bars are colored only when True Range meaningfully departs from the session regime—no gut feel, no open-bar distortion (gap inclusion optional).
Overview
Purpose: objectively identify unusually big or small candles within the active trading session, compared to the recent session regime.
Use cases: volatility filters, entry/exit confirmation, session bias detection, adaptive sizing.
This indicator replaces generic ATR with a session-conditioned, regime-aware measure. It colors candles only when their True Range (TR) is abnormally large/small versus the last N completed sessions of the same session window.
How it works
Session gating: Only bars inside the selected session are evaluated (presets for NYSE, CME RTH, FX NY; custom supported).
Per-bar TR: TR = max(high, prevRef) − min(low, prevRef).
prevRef is the prior close for in-session bars.
First bar of the session can include the overnight gap (optional; default off).
Regime statistic: For any bar in session k, aggregate all in-session TRs from the previous N completed sessions (k−N … k−1), then compute Median (default) or Mean.
Today’s anchor: Running statistic from today’s session start → current bar (for context and the on-chart ratio).
Color logic:
Big if TR ≥ bigMult × RegimeStat
Small if TR ≤ smallMult × RegimeStat
Colored states: big bull, big bear, small bull, small bear.
Non-triggering bars retain the chart’s native colors.
Panel (top-right by default)
Regime ATR (Nd): session-conditioned statistic over the past N completed sessions.
Today ATR (anchored): running statistic for the current session.
Ratio (Today/Regime): intraday volatility vs regime.
Sample size n: number of bars used in the regime calculation.
Inputs
Session Preset: NYSE (09:30–16:00 ET), CME RTH (08:30–15:00 CT), FX NY (08:00–17:00 ET), Custom (session + IANA timezone).
Regime Window: number of completed sessions (default 5).
Statistic: Median (robust) or Mean.
Include Open Gap: include overnight gap in the first in-session bar’s TR (default off).
Big/Small thresholds: multipliers relative to RegimeStat (defaults: Big=1.5×, Small=0.67×).
Colors: four independent colors for big/small × bull/bear.
Panel position & text size.
Hidden outputs: expose RegimeStat, TodayStat, Ratio, and Z-score to other scripts.
Alerts
RegimeATR: BIG bar — triggers when a bar meets the “Big” condition.
RegimeATR: SMALL bar — triggers when a bar meets the “Small” condition.
Hidden outputs (for strategies/screeners)
RegimeATR_stat, TodayATR_stat, Today_vs_Regime_Ratio, BarTR_Zscore.
Notes & limitations
No look-ahead: calculations only use information available up to that bar. Historical colors reflect what would have been known then.
Warm-up: colors begin once there are at least N completed sessions; before that, regime is undefined by design.
Changing inputs (session window, multipliers, median/mean, gap toggle) recomputes the full series using the same rolling regime logic per bar.
Designed for standard candles. Styling respects existing chart colors when no condition triggers.
Practical tips
For a broader or tighter notion of “unusual,” adjust Big/Small multipliers.
Prefer Median in markets prone to outliers; use Mean if you want Z-score alignment with the panel’s regime mean/std.
Use the Ratio readout to spot compression/expansion days quickly (e.g., <0.7× = compressed session, >1.3× = expanded).
Roadmap
More session presets:
24h continuous (crypto, index CFDs).
23h/Globex futures (CME ETH with a 60-minute maintenance break).
Regional equities (LSE, Xetra, TSE), Asia/Europe/NY overlaps for FX.
Half-day/holiday templates and dynamic calendars.
Multi-regime comparison: track multiple overlapping regimes (e.g., RTH vs ETH for futures) and show separate stats/ratios.
Robust stats options: trimmed mean, MAD/Huber alternatives; optional percentile thresholds instead of fixed multipliers.
Subpanel visuals: rolling TodayATR and Ratio plots; optional Z-score ribbon.
Screener/strategy hooks: export boolean series for BIG/SMALL, plus a lightweight strategy template for backtesting entries/exits conditioned on regime volatility.
Performance/QOL: per-symbol presets, smarter warm-up, and finer control over sample caps for ultra-low TF charts.
Changelog
v0.9b (Beta)
Session presets (NYSE/CME RTH/FX NY/Custom) with timezone handling.
Panel enhancements: ratio + sample size n.
Four-state bar coloring (big/small × bull/bear).
Alerts for BIG/SMALL bars.
Hidden Z-score stream for downstream use.
Gap-in-TR toggle for the first in-session bar.
Disclaimer
For educational purposes only. Not investment advice. Validate thresholds and session settings across symbols/timeframes before live use.

Multi Brownian Forecast📊 Multi Brownian Forecast (Time-Adaptive, Probabilistic)
This indicator uses a sophisticated Geometric Brownian Motion (GBM) Monte Carlo simulation to project future price paths. It adapts to any chart timeframe and provides quantitative, multi-period probability signals.
---
🧠 Core Mathematical Methodology
The model relies on GBM, which is a continuous-time stochastic process that models asset prices.
1. Historical Analysis (Drift & Volatility):
* The script first calculates Logarithmic Returns over a user-defined Historical Lookback (Hours) .
* Drift ($\mu$): Computed as the average of the log returns.
* Volatility ($\sigma$): Computed as the standard deviation of the log returns.
* These values are then time-adapted to an hourly step, compensating for the chart's current timeframe (e.g., 5-minute, 1-hour).
2. Monte Carlo Simulation:
* It runs a specified Number of Simulations (e.g., 1000).
* For each simulation, the price is stepped forward hourly using the GBM formula, which incorporates the calculated drift and a random shock drawn from a normal distribution (generated via the Box-Muller transform ).
---
✨ Key Features
Probabilistic Quartile Forecast: Plots a dynamic "cone" of probability on the chart. It shows key price percentiles (Q1, Q2/Median, Q3, and Q4/Outer Bound) at the forecast's expiration, visualizing the expected range of price outcomes based on the simulations.
Multi-Period Probability Signals: This is the core signal feature. Users can define multiple, independent forecast periods (e.g., 4h, 16h, 48h) in a comma-separated list.
* For each period, a Probability Up and Probability Down is calculated based on hitting a custom Target Price Change (%) (e.g., 2%) at a certain confidence level given a simulation over the historical backlook.
* The probabilities are displayed in a chart table. The cell text turns white if the calculated probability exceeds the user-defined Signal Confidence (%) .
Conditional Fibonacci Retracement: Optionally displays a Fibonacci Retracement on the chart. This feature is only activated when one of the multi-period signals reaches its minimum confidence threshold, providing a contextual technical level when a probabilistic edge is found.

MTF RSI Heatmap)# MTF RSI Heatmap — v2.7.2
**Hybrid Higher-TF Trend + Intraday Impulse Detection + Smart Counters & Alerts**
Turn your lower pane into a **multi-timeframe market bias dashboard**. This heatmap blends classic RSI momentum with a **hybrid Daily/Weekly MA-stack trend** and an **intraday impulse override** that flags fast moves *as they happen*. Clean, configurable, and built for real trading flow.
---
## What it shows
* **6 stacked rows = 6 timeframes** (bottom → top).
* **Colors**: Green = Bull, Red = Bear, Yellow = Neutral.
* **Header counter**: `Bull X/6 | Bear Y/6` = live agreement across visible rows.
* **Impulse markers** ▲/▼ on intraday rows (5m/15m/60m/240m) when a shock move triggers.
* **Signal bar**: A thin column above the top row when at least **N of 6** rows align (configurable).
---
## Why it’s different
* **Impulse Override (intraday)**
Detects sharp moves using % change over the last *N* bars, optionally gated by **volume > SMA × multiplier**. This catches dumps/pops earlier than RSI alone.
* **Hybrid D/W (structure over noise)**
Daily/Weekly rows can use an **MA stack (8/21/55)** instead of RSI for a more stable higher-timeframe trend read. Optional **price > fast MA** filter for stricter confirmation.
* **Intrabar option**
Flip rows **during the bar** for early reads (accepting repaint on TF close), or keep it close-only for no surprises.
---
## Key features
* 🌈 **Theme**: Classic or High-Contrast colors.
* 🧠 **RSI thresholds**: Bull above 55, Bear below 45 (editable).
* 🧲 **RSI smoothing** (EMA) for intraday rows to reduce flicker.
* 🧰 **Compact left legend** with adjustable text size & opacity.
* 🚨 **Alerts**:
* **Impulse-only** (per TF and “any intraday”)
* **N-of-6 confirmation** (bull/bear)
---
## Recommended settings (fast opens & news)
* **Impulse**: `Bars = 1–2`, `Threshold = 0.25–0.35%`, `Vol confirm = ON`, `Multiplier = 1.3–1.5`.
* **Hybrid D/W**: `ON`, `EMA 8/21/55`, `Price filter = ON`.
* **Intrabar**: `ON` if you want intra-bar updates (repaints at TF close).
---
## How to read it
1. **Row scan**: Are the bottom (fast) rows aligning first? That’s early momentum.
2. **Header counter**: Look for 4+/6 agreement as momentum broadens.
3. **Signal bar**: Acts as a “go/no-go” confirmation when your threshold is met.
4. **Impulse ▲/▼**: Use as a **heads-up** for acceleration; then watch if rows cascade in that direction.
---
## Alerts (exact names)
Create alerts with these built-ins:
* **Impulse UP — any intraday**
* **Impulse DOWN — any intraday**
* **Impulse UP — TF1 / TF2 / TF3 / TF4**
* **Impulse DOWN — TF1 / TF2 / TF3 / TF4**
* **Bull confirmation** (N-of-6)
* **Bear confirmation** (N-of-6)
Tip: Use **Once per bar** or **Once per bar close** depending on whether you enabled *Intrabar*.
---
## Inputs overview
* **Timeframes & visibility** per row.
* **RSI**: length, bull/bear thresholds, optional EMA smoothing (intraday only).
* **Impulse**: bars, %, volume confirm, SMA length, multiplier, markers.
* **Hybrid D/W**: MA type (EMA/SMA/HMA), 8/21/55 lengths, price filter.
* **Theme & Legend**: color theme, label size (Tiny/Small/Normal), legend opacity.
* **Signal**: N required for confirmation (default 4).
---
## Pro tips
* Combine with **session opens**, **VWAP**, and **liquidity levels**.
* If you trade breakouts, let **impulse triggers** cue attention, then wait for **N-of-6** confirmation.
* For swing bias, lean on **Hybrid D/W**—it changes slower, but with intent.
---
## Notes & limitations
* **Intrabar = repaint expected** on higher-TF closes—by design for earlier context.
* Colors/thresholds are general guidance, not signals by themselves.
* Past performance ≠ future results; **this is not financial advice**.
---
If you enjoy this, drop a ⭐ and tell me what you want next: background shading on confirmation, tooltips with RSI/ROC per row, or a MACD/RSI hybrid mode. Trade sharp! ✨
Key-Levels - D/W/M High-Low + Fib + MA🧭 Key-Levels – D/W/M High-Low + Fibonacci + Moving Averages
A complete multi-timeframe analysis toolkit that combines Daily, Weekly, and Monthly high/low levels, Fibonacci retracements, and customizable moving averages — all in one clean, efficient display.
Ideal for traders who want to identify key reaction zones, retracement levels, and trend alignment across multiple timeframes.
🔹 Features
1. Prior High/Low Levels
Plots Daily (PDH/PDL), Weekly (PWH/PWL), and Monthly (PMH/PML) key levels
Adjustable colors, styles (Solid / Dashed / Dotted), and line widths
Optional midline display for each timeframe
Displays live labels with price values and % difference from current close
Extend lines rightward to project future price interactions
2. Fibonacci Retracement
Auto-detects swing highs/lows using configurable pivot lengths
Smart pivot logic prioritizes major swings based on % span
Auto-orients retracements depending on trend direction
Customizable visibility and color for each Fibonacci level
Supports 0.236 → 1.618 levels, with optional auto-extension in uptrend scenarios
Displays ratio + price for each level label
3. Pivot Labels
Optionally show pivot high/low labels with customizable text and background colors
Independent control of left/right length and label style
4. Moving Averages
Up to three customizable MAs (default: 8 EMA, 21 EMA, 50 SMA)
Choose between EMA or SMA for each
Toggle individual or all moving averages
Adjustable lengths, colors, and line widths
5. Alerts
Built-in alert condition for price crossing a user-defined level
Clean alert message format with ticker symbol and live price
⚙️ Customization
Flexible style controls for lines, labels, and colors
Adjustable right-extension length for projecting levels
Font size and visibility toggles for all elements
Smart grouping for intuitive settings management
📈 Ideal For
Identifying key reversal or breakout zones
Spotting Fibonacci confluence between retracements and prior highs/lows
Tracking trend structure via multi-timeframe MAs
Swing traders, intraday traders, and technical analysts
💡 Summary
Key-Levels – D/W/M High-Low + Fib + MA is a professional-grade indicator designed to simplify complex multi-timeframe analysis.
It helps you see the bigger picture, find actionable zones, and trade with confidence.
🧩 Compatible with any market and timeframe.

Multi-Confluence MTF S/R Signal5 Confluences:
RSI - Detects oversold/overbought conditions with momentum
MACD - Confirms trend direction and momentum shifts
Moving Average Trend - Validates price position relative to 50 SMA and 20 EMA
Volume - Ensures strong participation (1.5x average volume)
Price Action - Confirms breakout (higher high for buys, lower low for sells)
Features:
Green triangles below bars = BUY signal (all 5 confluences bullish)
Red triangles above bars = SELL signal (all 5 confluences bearish)
Background coloring when signals occur
Real-time dashboard showing each confluence status
Built-in alerts you can enable
Customizable parameters for all indicators
Multi-Timeframe Features:
Higher Timeframe Analysis (Default: 60 min)
HTF Trend - Checks if price is above/below moving averages on higher timeframe
HTF MACD - Confirms momentum direction
HTF RSI - Validates not overbought/oversold
Signal Types:
Strong Signals (Full triangles with text)
✅ All 5 current timeframe confluences aligned
✅ Higher timeframe confirmation (2 of 3 HTF conditions)
GREEN "BUY" or RED "SELL" labels
Weak Signals (Small transparent triangles with "?")
✅ All 5 current timeframe confluences aligned
❌ NO higher timeframe confirmation
Use with caution - may signal counter-trend trades
Dashboard Updates:
Shows Current Timeframe section (all 5 confluences)
Shows HTF status (your chosen higher timeframe)
Displays final signal strength
Customizable Settings:
Enable/Disable MTF - Toggle multi-timeframe confirmation
Higher Timeframe - Choose any timeframe (15m, 60m, 4H, D, etc.)
Require HTF - Force HTF confirmation or allow weak signals
Alerts:
Strong Buy/Sell - Full confirmation
Weak Buy/Sell - No HTF confirmation