Auto Swing TPAutomatic TP generator from recent swing highs and swing lows
Multiple long & short TPs from current price are displayed.
Results will differ by timeframe.
The main parameter is the "cell size" which is the least significant price move for the current asset. The default value of 0.4% is optimized for crypto. You may want to use less for less volatile asset classes.
How it works
We divide price into cells of a certain percent sizes, mainly because this makes the computation a lot easier.
We note in which bar every price cell was last visited. We take the distance to the current bar and then the logarithm of that to a certain base (the "time dimension"). Using a logarithm gives a nice balance of near-term and long-term targets. We call that logarithmic value the "level" of that price cell.
If a price cell has a significantly higher or lower level (at least by +2 or -2) than the cell above or below, this is considered a possible TP area.
Finally we check if the trade makes sense (meaning is of a certain size, at least 10 cells by default). If yes, we reduce the TP by a bit (by default 2 cells) and add it to the chart.
ค้นหาในสคริปต์สำหรับ "swing"

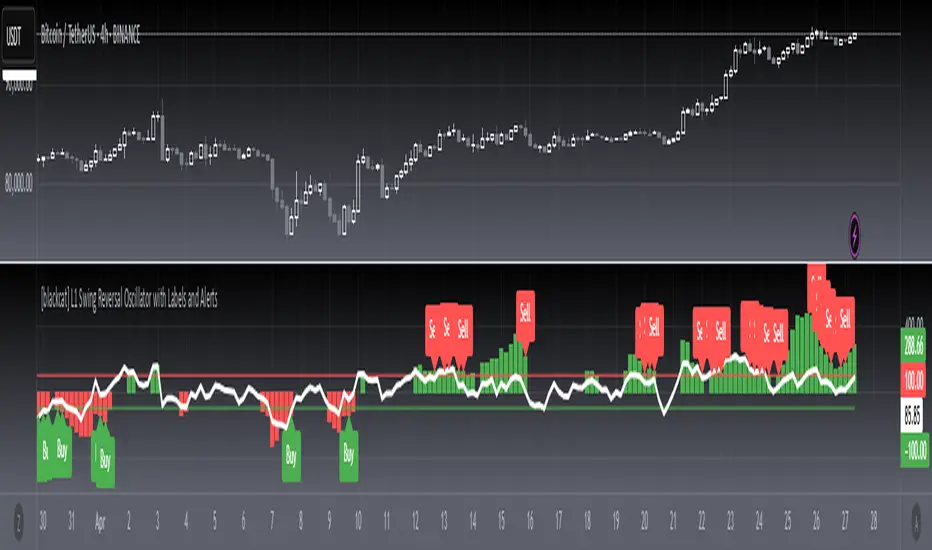
[blackcat] L1 Swing Reversal Oscillator█ OVERVIEW
The script defines a custom indicator called the "L1 Swing Reversal Oscillator," which integrates moving averages and RSI to detect possible swing reversals in market trends. Its core purpose is to produce signals derived from the oscillator's indications of overbought or oversold states.
█ LOGICAL FRAMEWORK
The script comprises multiple key segments:
1 — Custom Functions: Encompasses calculate_weighted_moving_average and calculate_l1_swing_reversal_oscillator.
2 — Input Parameters: Permits customization of moving average lengths and weights alongside RSI settings.
3 — Calculations: Employs predefined functions to determine oscillator readings.
4 — Plot Statements: Depicts oscillator outputs graphically on the chart.
Data processing follows this sequence: initial computation of the typical price, subsequent derivation of the adjusted CC1 metric, additional smoothing operations, and finally, RSI evaluation prior to plotting the resultant oscillator figures.
█ CUSTOM FUNCTIONS
• calculate_weighted_moving_average(source, length, weight) : Generates a weighted moving average from the provided source material utilizing specified duration and coefficient inputs.
– Returns computed weighted moving average.
• calculate_l1_swing_reversal_oscillator(close_price, high_price, low_price, sma_length, sma_weight, rsi_length) : Assesses the L1 Swing Reversal Oscillator leveraging closing, highest, and lowest prices along with defined SMA span, weighting factor, and RSI period.
– Yields an array featuring central CC1, CB1, CB2, and RSI metrics.
█ KEY POINTS AND TECHNIQUES
• Weighted Moving Average: Incorporates bespoke functionality for computing weighted moving averages, distinct from built-in Pine Script methods.
• RSI Calculation: Employs customized logic for calculating Relative Strength Index, offering adaptable computational approaches.
• Plotting Techniques: Implements color coding contingent upon oscillator values to emphasize visual cues regarding overbought and oversold statuses.
• Optimization: Furnishes adjustable parameters including SMA timeframe, weightage, and RSI interval enabling personalized fine-tuning per user requirements.
█ EXTENDED KNOWLEDGE AND APPLICATIONS
• Modifications: Potential enhancements involve integrating supplementary oscillators like MACD or Stochastic Oscillator alongside the existing L1 Swing Reversal Oscillator.
• Application Scenarios: Comparable methodologies can be adopted within various trading frameworks focusing on momentum shifts such as trend-following or mean reversion tactics.
• Related Concepts: Proficiency in crafting custom functions, manipulating moving averages, and interpreting RSI within Pine Script environment proves advantageous when altering or expanding on current script functionalities. Understanding utilization of nz and na functions for managing null data points adds significant depth.
VD Zig Zag with SMAIntroduction
The VD Zig Zag with SMA indicator is a powerful tool designed to streamline technical analysis by combining Zig Zag swing lines with a Simple Moving Average (SMA). It offers traders a clear and intuitive way to analyze price trends, market structure, and potential reversals, all within a customizable framework.
Definition
The Zig Zag indicator is a trend-following tool that highlights significant price movements by filtering out smaller fluctuations. It visually connects swing highs and lows to reveal the underlying market structure. When paired with an SMA, it provides an additional layer of trend confirmation, helping traders align their strategies with market momentum.
Calculations
Zig Zag Logic:
Swing highs and lows are determined using a user-defined length parameter.
The highest and lowest points within the specified range are identified using the ta.highest() and ta.lowest() functions.
Zig Zag lines dynamically connect these swing points to visually map price movements.
SMA Logic:
The SMA is calculated using the closing prices over a user-defined period.
It smooths out price action to provide a clearer view of the prevailing trend.
The indicator allows traders to adjust the Zig Zag length and SMA period to suit their preferred trading timeframe and strategy.
Takeaways
Enhanced Trend Analysis: The Zig Zag lines clearly define the market's structural highs and lows, helping traders identify trends and reversals.
Customizable Parameters: Both the swing length and SMA period can be tailored for short-term or long-term trading strategies.
Visual Clarity: By filtering out noise, the indicator simplifies chart analysis and enables better decision-making.
Multi-Timeframe Support: Adapts seamlessly to the chart's timeframe, ensuring usability across all trading horizons.
Limitations
Lagging Nature: As with any indicator, the Zig Zag and SMA components are reactive and may lag during sudden price movements.
Sensitivity to Parameters: Improper parameter settings can lead to overfitting, where the indicator reacts too sensitively or misses significant trends.
Does Not Predict: This indicator identifies trends and structure but does not provide forward-looking predictions.
Summary
The VD Zig Zag with SMA indicator is a versatile and easy-to-use tool that combines the strengths of Zig Zag swing analysis and moving average trends. It helps traders filter market noise, visualize structural patterns, and confirm trends with greater confidence. While it comes with limitations inherent to all technical tools, its customizable features and multi-timeframe adaptability make it an excellent addition to any trader’s toolkit.
Additional Features
Have an idea or a feature you'd like to see added?
Feel free to reach out or share your suggestions here—I’m always open to updates!

ICT Judas Swing | Flux Charts💎 GENERAL OVERVIEW
Introducing our new ICT Judas Swing Indicator! This indicator is built around the ICT's "Judas Swing" strategy. The strategy looks for a liquidity grab around NY 9:30 session and a Fair Value Gap for entry confirmation. For more information about the process, check the "HOW DOES IT WORK" section.
Features of the new ICT Judas Swing :
Implementation of ICT's Judas Swing Strategy
2 Different TP / SL Methods
Customizable Execution Settings
Customizable Backtesting Dashboard
Alerts for Buy, Sell, TP & SL Signals
📌 HOW DOES IT WORK ?
The strategy begins by identifying the New York session from 9:30 to 9:45 and marking recent liquidity zones. These liquidity zones are determined by locating high and low pivot points: buyside liquidity zones are identified using high pivots that haven't been invalidated, while sellside liquidity zones are found using low pivots. A break of either buyside or sellside liquidity must occur during the 9:30-9:45 session, which is interpreted as a liquidity grab by smart money. The strategy assumes that after this liquidity grab, the price will reverse and move in the opposite direction. For entry confirmation, a fair value gap (FVG) in the opposite direction of the liquidity grab is required. A buyside liquidity grab calls for a bearish FVG, while a sellside grab requires a bullish FVG. Based on the type of FVG—bullish for buys and bearish for sells—the indicator will then generate a Buy or Sell signal.
After the Buy or Sell signal, the indicator immediately draws the take-profit (TP) and stop-loss (SL) targets. The indicator has three different TP & SL modes, explained in the "Settings" section of this write-up.
You can set up alerts for entry and TP & SL signals, and also check the current performance of the indicator and adjust the settings accordingly to the current ticker using the backtesting dashboard.
🚩 UNIQUENESS
This indicator is an all-in-one suit for the ICT's Judas Swing concept. It's capable of plotting the strategy, giving signals, a backtesting dashboard and alerts feature. Different and customizable algorithm modes will help the trader fine-tune the indicator for the asset they are currently trading. Three different TP / SL modes are available to suit your needs. The backtesting dashboard allows you to see how your settings perform in the current ticker. You can also set up alerts to get informed when the strategy is executable for different tickers.
⚙️ SETTINGS
1. General Configuration
Swing Length -> The swing length for pivot detection. Higher settings will result in
FVG Detection Sensitivity -> You may select between Low, Normal, High or Extreme FVG detection sensitivity. This will essentially determine the size of the spotted FVGs, with lower sensitivies resulting in spotting bigger FVGs, and higher sensitivies resulting in spotting all sizes of FVGs.
2. TP / SL
TP / SL Method ->
a) Dynamic: The TP / SL zones will be auto-determined by the algorithm based on the Average True Range (ATR) of the current ticker.
b) Fixed : You can adjust the exact TP / SL ratios from the settings below.
Dynamic Risk -> The risk you're willing to take if "Dynamic" TP / SL Method is selected. Higher risk usually means a better winrate at the cost of losing more if the strategy fails. This setting is has a crucial effect on the performance of the indicator, as different tickers may have different volatility so the indicator may have increased performance when this setting is correctly adjusted.

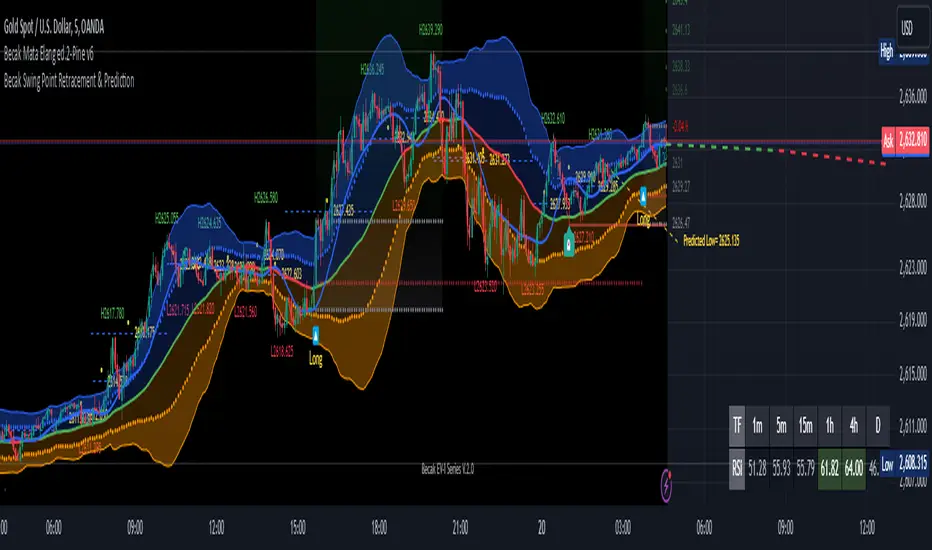
[Becak] - Swing Point Retracement & Prediction" - Swing Point Retracement & Prediction," is designed to identify swing points in price action, calculate retracement levels, and predict potential future price levels. It's a technical analysis tool that can help traders identify potential support and resistance levels, as well as possible reversal points.
HOW IT WORK
Swing Point Detection:
The indicator uses the ta.pivothigh() and ta.pivotlow() functions to identify swing highs and lows within a specified lookback period.
Retracement Levels:
When a new swing point is detected, the indicator calculates a retracement level based on the user-defined retracement percentage. It draws a dashed blue line at the retracement level, along with a yellow circle and a label showing the price.
Swing Point Labeling:
Swing highs are marked with a green "H" label and the price, and Swing lows are marked with a red "L" label and the price.
Price Prediction:
Based on the most recent swing point, the indicator attempts to predict the next potential high or low. It draws a purple dashed line extending into the future, indicating the predicted price level.
HOW TO USE THIS INDICATOR:
adjust the input parameters:
"Swing Point Lookback": Determines how far back the indicator looks to identify swing points. A larger value will result in fewer, more significant swing points.
"Retracement %": Sets the percentage for calculating retracement levels. 50% is a common Fibonacci retracement level, but you can adjust this based on your trading strategy.
"Prediction Length": Determines how far into the future the prediction line extends.
Interpret the results:
Use the swing point labels (H and L) to quickly identify recent highs and lows. The blue dashed lines and yellow circles indicate potential support or resistance levels based on the retracement percentage. The purple dashed line shows a potential future price target. This can be used to set profit targets or identify potential reversal zones.
Combine with other analysis:
This indicator works best when combined with other forms of analysis, such as trend lines, moving averages, or candlestick patterns.
Use the retracement levels and predictions as potential entry or exit points, but always confirm with other indicators or price action signals.
Day & Swing Trading EMA Clouds with Adaptive LevelsDay & Swing Trading EMA Clouds with Adaptive Levels is a tool designed for traders who need a flexible indicator that adapts to both short-term (day trading) and long-term (swing trading) strategies. The indicator blends EMA clouds and adaptive support/resistance levels, making it suitable for analyzing trend strength and key price zones.
How It Works:
EMA Clouds for Trend Detection:
This indicator uses three EMAs (Fast, Intermediate, Slow) to create two clouds:
Fast Cloud: The area between the fast and Intermediate EMAs.
Slow Cloud: The area between the Intermediate and slow EMAs.
The cloud colors change based on trend direction:
Positive (uptrend): When the fast EMA is above the Intermediate EMA (turquoise) or the Intermediate EMA is above the slow EMA (teal).
Negative (downtrend): When the fast EMA is below the Intermediate EMA (pink) or the Intermediate EMA is below the slow EMA (magenta).
Traders can use these clouds to visually gauge market momentum and trend reversals.
Adaptive EMA Settings Based on Trading Mode:
The EMA lengths adjust automatically depending on whether you're in Day Trading or Swing Trading mode:
Day Trading Mode uses shorter periods to capture quick price movements:
Fast EMA: 5-period
Mid EMA: 13-period
Slow EMA: 21-period
Swing Trading Mode uses longer periods to capture broader trends:
Fast EMA: 12-period
Mid EMA: 26-period
Slow EMA: 50-period
This dynamic adjustment allows you to switch between trading styles seamlessly, with the EMAs reflecting the most relevant timeframes for each strategy.
Adaptive Support and Resistance Levels:
Depending on the selected trading mode, the indicator dynamically plots key levels:
Day Trading Mode: Previous day’s high, low, and midpoint, as well as 2-day levels.
Swing Trading Mode: Previous month’s high, low, and midpoint, as well as 2-month levels.
These levels act as dynamic support and resistance zones, giving traders critical areas to monitor for potential reversals or breakouts.
Buy & Sell Signals:
Visual buy/sell signals are generated when the fast EMA crosses above or below the slow EMA. These signals can help traders identify potential trend reversals.
Customization:
You can fully adjust the transparency and colors of the clouds to fit your personal preferences and trading style.
Why This Combination?
Combining EMA clouds with adaptive levels provides traders with a complete picture. The clouds highlight the underlying market momentum and trend strength, while the adaptive levels offer potential entry/exit points based on historical price action. This unique mashup allows traders to follow trends and plan trades around key support and resistance zones.

Historical Swing High-Low Gann IndicatorThe Historical Swing High-Low Gann Indicator is a powerful tool designed to track and visualize key market swing points over time. This indicator identifies significant swing highs and lows within a specified time frame and draws connecting lines between these points, allowing traders to observe the natural ebb and flow of the market.
What sets this indicator apart is its ability to maintain all previously drawn swing lines, creating a comprehensive historical view of market movements. Additionally, the indicator projects Gann-style lines from the most recent swing highs and lows, providing traders with potential future support and resistance levels based on the geometric progression of price action.
Features:
Swing Detection: Automatically detects significant swing highs and lows over a user-defined period (default is 3 hours).
Persistent Historical Lines: Keeps all previously drawn lines, offering a complete visual history of the market's swing points.
Gann-Style Projections: Draws forward-looking lines from the latest swing points to help predict possible future market levels.
Customizable Parameters: Allows users to adjust the swing detection period to suit different trading styles and time frames.
This indicator is ideal for traders who rely on price action, support and resistance levels, and Gann theory for their analysis. Whether used in isolation or as part of a broader strategy, the Historical Swing High-Low Gann Indicator provides valuable insights into the market's behavior over time.

Fibonacci-Only StrategyFibonacci-Only Strategy
This script is a custom trading strategy designed for traders who leverage Fibonacci retracement levels to identify potential trade entries and exits. The strategy is versatile, allowing users to trade across multiple timeframes, with built-in options for dynamic stop loss, trailing stops, and take profit levels.
Key Features:
Custom Fibonacci Levels:
This strategy calculates three specific Fibonacci retracement levels: 19%, 82.56%, and the reverse 19% level. These levels are used to identify potential areas of support and resistance where price reversals or breaks might occur.
The Fibonacci levels are calculated based on the highest and lowest prices within a 100-bar period, making them dynamic and responsive to recent market conditions.
Dynamic Entry Conditions:
Touch Entry: The script enters long or short positions when the price touches specific Fibonacci levels and confirms the move with a bullish (for long) or bearish (for short) candle.
Break Entry (Optional): If the "Use Break Strategy" option is enabled, the script can also enter positions when the price breaks through Fibonacci levels, providing more aggressive entry opportunities.
Stop Loss Management:
The script offers flexible stop loss settings. Users can choose between a fixed percentage stop loss or an ATR-based stop loss, which adjusts based on market volatility.
The ATR (Average True Range) stop loss is multiplied by a user-defined factor, allowing for tailored risk management based on market conditions.
Trailing Stop Mechanism:
The script includes an optional trailing stop feature, which adjusts the stop loss level as the market moves in favor of the trade. This helps lock in profits while allowing the trade to run if the trend continues.
The trailing stop is calculated as a percentage of the difference between the entry price and the current market price.
Multiple Take Profit Levels:
The strategy calculates seven take profit levels, each at incremental percentages above (for long trades) or below (for short trades) the entry price. This allows for gradual profit-taking as the market moves in the trade's favor.
Each take profit level can be customized in terms of the percentage of the position to be closed, providing precise control over exit strategies.
Strategy Backtesting and Results:
Realistic Backtesting:
The script has been backtested with realistic account sizes, commission rates, and slippage settings to ensure that the results are applicable to actual trading scenarios.
The backtesting covers various timeframes and markets to ensure the strategy's robustness across different trading environments.
Default Settings:
The script is published with default settings that have been optimized for general use. These settings include a 15-minute timeframe, a 1.0% stop loss, a 2.0 ATR multiplier for stop loss, and a 1.5% trailing stop.
Users can adjust these settings to better fit their specific trading style or the market they are trading.
How It Works:
Long Entry Conditions:
The strategy enters a long position when the price touches the 19% Fibonacci level (from high to low) or the reverse 19% level (from low to high) and confirms the move with a bullish candle.
If the "Use Break Strategy" option is enabled, the script will also enter a long position when the price breaks below the 19% Fibonacci level and then moves back up, confirming the break with a bullish candle.
Short Entry Conditions:
The strategy enters a short position when the price touches the 82.56% Fibonacci level and confirms the move with a bearish candle.
If the "Use Break Strategy" option is enabled, the script will also enter a short position when the price breaks above the 82.56% Fibonacci level and then moves back down, confirming the break with a bearish candle.
Stop Loss and Take Profit Logic:
The stop loss for each trade is calculated based on the selected method (fixed percentage or ATR-based). The strategy then manages the trade by either trailing the stop or taking profit at predefined levels.
The take profit levels are set at increments of 0.5% above or below the entry price, depending on whether the position is long or short. The script gradually exits the trade as these levels are hit, securing profits while minimizing risk.
Usage:
For Fibonacci Traders:
This script is ideal for traders who rely on Fibonacci retracement levels to find potential trade entries and exits. The script automates the process, allowing traders to focus on market analysis and decision-making.
For Trend and Swing Traders:
The strategy's flexibility in handling both touch and break entries makes it suitable for trend-following and swing trading strategies. The multiple take profit levels allow traders to capture profits in trending markets while managing risk.
Important Notes:
Originality: This script uniquely combines Fibonacci retracement levels with dynamic stop loss management and multiple take profit levels. It is not just a combination of existing indicators but a thoughtful integration designed to enhance trading performance.
Disclaimer: Trading involves risk, and it is crucial to test this script in a demo account or through backtesting before applying it to live trading. Users should ensure that the settings align with their individual risk tolerance and trading strategy.

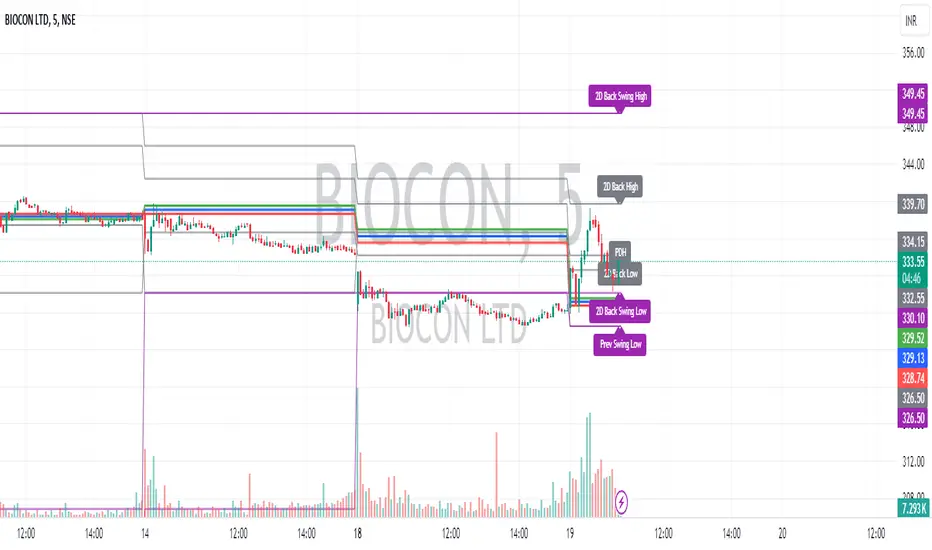
Intraday CPR with Previous Highs and Lows and Swing Highs/LowsThis Pine Script indicator plots the Central Pivot Range (CPR) for the current trading day along with previous day's high (PDH), low (PDL), and swing high/low (Swing H/L) values. It also includes the high, low, and swing high/low values from two days back for reference.
Key Features:
Central Pivot Range (CPR):
Pivot Point (PP): The central pivot point.
Bottom Central Pivot (BC): The lower boundary of the CPR.
Top Central Pivot (TC): The upper boundary of the CPR.
The area between the BC and TC is shaded for better visualization.
Previous Day and Two Days Back Values:
Previous Day High (PDH) and Low (PDL): Plots the high and low of the previous trading day.
Two Days Back High and Low: Plots the high and low from two trading days ago.
Previous Day Swing High/Low: The highest high and lowest low from a specified period (swing period) of the previous trading day.
Two Days Back Swing High/Low: The highest high and lowest low from a specified period (swing period) of two trading days ago.
TrendVista Swing IndicatorOverview
The swing indicator is designed to offer traders a comprehensive analysis of market trends and volatility by integrating Bollinger Bands and the Average True Range (ATR). It aids in the visualization of price movements and volatility across multiple time frames, thereby providing insights into potential buy and sell opportunities.
Key Features
- Multitimeframe Analysis : By default, the indicator examines the market across the following time frames: 1 Day (1D), 4 Hours (4H), 1 Hour (1H), and 15 Minutes (15min). Users have the flexibility to modify these time frames to suit their trading strategy by adjusting the indicator's settings.
- Buy and Sell Timings : The indicator identifies optimal buy signals when the price drops below the lower Bollinger Band and subsequently re-enters the band's range. Additionally, a buy signal is generated during high volatility periods—signified by the ATR exceeding its 10-day average—helping traders spot potential liquidation points. Sell signals are tailored for traders looking to exit long positions rather than for initiating short positions.
- Bollinger Bands Phases : The indicator categorizes the market condition into three phases based on Bollinger Bands movement:
- Neutral Phase : When the closing price is within the Bollinger Bands' upper and lower limits.
- Bullish Phase : Signaled by the price closing above the upper Bollinger Band, suggesting an upward trend until the price closes below the middle band.
- Bearish Phase : Initiated when the price closes below the lower Bollinger Band, indicating a downtrend until the price closes above the middle band.
Users can opt to exclude the neutral phase from the analysis through the indicator's settings for a more focused view on bullish or bearish trends.
Indicator Customization
The swing indicator is versatile, allowing users to customize the time frames and phase visibility according to their preferences. This feature ensures that traders can tailor the indicator to match their specific analysis needs and trading strategies.
Considerations
- The signals provided by the swing indicator are not symmetrically designed for both buy and sell actions. The indicator primarily optimizes for identifying long positions, particularly in bull markets. The sell signals are intended for exiting existing long positions rather than for short selling.

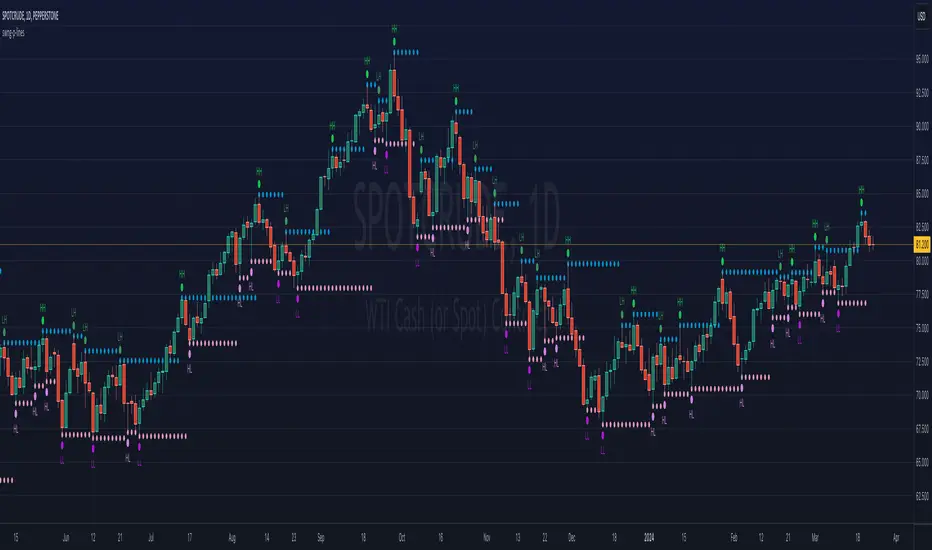
ka66: Swing/Pivot Point LinesThis indicator draws swing-highs and swing-lows, also called pivot highs and lows.
A swing high is a bar which has a higher-high than its surrounding bars (to the left and the right).
A swing low is a bar which has a lower-low than its surrounding bars (to the left and the right).
A common example of a pivot is Bill Williams' Fractal, which specifies that the centre bar must have a higher high than 2 bars to its left, and 2 bars to its right for a swing high, taking into account 5 bars at a time. Similarly, for a swing low, the centre bar must have a lower low than the 2 bars to its left and right.
This indicator allows configurable adjacent bars as input. Entering 2, means it essentially picks out a Williams Fractal. But you can select 1 (say for higher timeframes), using one 1 bar to the left and right of the centre bar.
The indicator will draw Swing/Pivot High/Low as circles at the same price level as the centre bar, till the next one shows up. Drawing is offset so it starts at the centre bar (the swing bar), showing exactly where the pivot bar is.
There are 2 main uses of pivot points, in various strategies:
Market Structure: to objectively define higher-highs/lows and lower-highs/lows in Trend Analysis.
More generally, to then determine if a trend might reverse, or continue as pivot levels are broken.
Messy pivot structures easily point out ranging markets.
There are a few of these, some closed source, which I don't like, since I think people should generally know what they are trading with, and I want to make sure I understand the logic exactly.
Cycles: 4x dual inputs: Swing / Time Cycles projected forward//Purpose/Premise:
To project forward vertical 'cycle' lines based on user-input anchor points, and to search for confluence.
The idea being that if several well-anchored cycles agree (i.e. we see multiple bunched vertical line confluence in the future), then this may add support to an already existing trade idea, or may indicate an increased likelihood of a shift in direction.
//Usage & notes:
~In the above chart I've anchored to obvious swing lows and swing highs in Btc/Usd from 2020-2022. You could also use fixed time-based cycles from a favored start anchor point. Bars per cycle are printed at the top of each cycle box if your're interested in time cycles. I.e. for 1, 2, 3 month cycles: for BTC you could use 30, 60, 90 bars on daily; for S&P you could use 20, 40, 60 bars on daily.
~On first loading the indicator you will be asked select 'start date', and 'end date' for each of 4 sessions (8x clicks on chart). After this you can easily reset points by clicking the indicator display line three dots>> reset points. Or you can simply drag the vertical box edges (purple lines) to change your cycle anchor points.
~Be sure the start anchor point is before the end anchor point or box/lines won't appear.
~When you drop down to low timeframes you might get bar_index error due to history available: you need then to click the three dots on indicator display line >> reset points >> 8x clicks on the chart.
~Vertical projected lines will match the color of the cycle box they origninate from.
~Lines will project into the future as far as is allowed by tradingview (500 bars max)
//Inputs:
~Time start and end dates for each cycle (change these as described above, or input manually)
~Show/hide each cycle (default is show all 4)
~Formatting options: color of forward projected lines, line width, line style, line / box / text color.
~Box transparancy: Set to 100 to make boxes invisible & declutter the chart. Set to 0 for maximum opacity. Default is 80.
thanks to @Sathyamurthie for his ideas on cycle confluence which caused me to write this.

MonkeyblackmailThis script consists of several sections. test it and tell me your concerns. a lot of more works will be done
Volume Accumulation : The first part of the script checks for a new 5-minute interval and accumulates the volume of the current interval. It separates the volume into buying volume and selling volume based on whether the closing price is closer to the high or low of the bar.
Volume Normalization and Pressure Calculation : The script then normalizes the volume with a 20-period EMA, and calculates buying pressure, selling pressure, and total pressure. These calculations provide insight into the underlying demand (buying pressure) and supply (selling pressure) conditions in the market.
RSI Calculation and Overbought/Oversold Conditions : The script calculates the RSI (Relative Strength Index) and checks whether it is in an overbought (RSI > 70) or oversold (RSI < 30) state. The RSI is a momentum indicator, providing insights into the speed and change of price movements.
Volume Condition Check and Wondertrend Indicator : The script checks if the volume is high for the past five bars. If it is, it applies the Wondertrend Indicator, which uses a combination of the Parabolic SAR (Stop and Reverse) and Keltner Channel to identify potential trends in the market.
Swing High/Low and Fibonacci Retracement : The script identifies swing high and swing low points using a specified pivot length. Then, it draws Fibonacci retracement levels between these swing high and swing low points.
he monkeyblackmail script works well in the 5 minutes chart and combines several elements of technical analysis, including volume analysis, momentum indicators, trend-following indicators, volatility channels, and Fibonacci retracements. It aims to provide a comprehensive view of the market condition, highlighting key levels and potential trends in an easily understandable format. Don’t be too quick to start trading with it, first study how it work and you will blackmail the market.

[blackcat] L1 An Adaptive Moving Average For Swing TradingLevel 1
Background
Scott Cong published an article of “An Adaptive Moving Average For Swing Trading” on April 2023. I rewrite it for pine script.
Function
In "An Adaptive Moving Average For Swing Trading," author Scott Cong introduces a new adaptive moving average that is designed to be responsive, smooth, and robust. He begins with a discussion of Perry Kaufman's adaptive moving average and explains how an adaptive moving average (AMA) can adapt to different market environments. Later he explains his methods of adjusting and changing the smoothing factor, which has better response than traditional EMA and SMA. I rewrited this new kind of moving average in pine script and use yellow color for its fast line while fuchsia color for its trigger signal as a slow line. By the way, divergence detector is also added for divergence notification. You can change period or length, and signal source parameters in setting dialog.
Remarks
Feedbacks are appreciated.

Paradigm Trades_VPA Swing IndicatorThe indicator is designed to identify specific patterns in price and volume movements that can signal potential trading opportunities. It does this by calculating several conditions based on the current bar's price and volume movements.
The code defines five conditions: Narrow Spread Up Bar, Wide Spread Down Bar, No Demand Bar, No Selling Bar, and Churning. These conditions are then plotted on the chart using specific shapes and colors. The code also includes alert conditions for each of the signals, which can be used to generate alerts for traders when a particular pattern is identified.
The VPA Swing Indicator can be used as part of a swing trading strategy to identify potential buy or sell signals. For example, a Narrow Spread Up Bar may indicate bullish momentum, while a Wide Spread Down Bar may indicate bearish momentum. Traders can use these signals to make informed trading decisions and manage their risk accordingly.
Legend:
Spread Up Bar: This is a bullish bar with a small spread, indicating a lack of selling pressure and strong buying activity.
Wide Spread Down Bar: This is a bearish bar with a large spread, indicating strong selling pressure and weak buying activity.
No Demand Bar: This is a bearish bar with a small spread and low volume, indicating a lack of buying interest and the smart money selling off their positions.
No Selling Bar: This is a bullish bar with a small spread and low volume, indicating a lack of selling interest and the smart money buying up positions.
Churning: This is a sideways market with narrow spread bars and low volume, indicating the smart money is distributing shares to the retail traders.

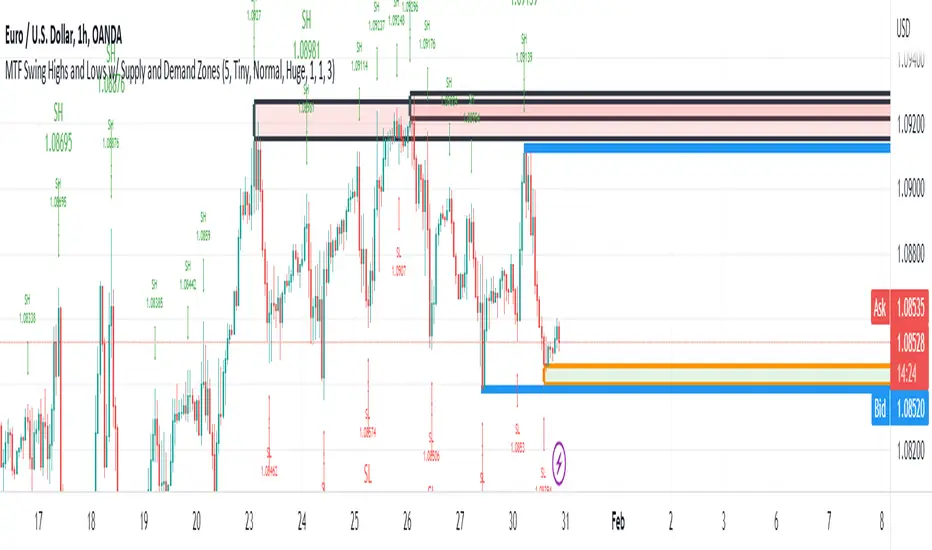
MTF Swing Highs and Lows w/ Supply and Demand ZonesI designed this indicator out of necessity for the Market structure/Price action trading strategy I use.
I thought I'd share. :)
For the fans of my Multi Timeframe Swing High and Low indicator, I have added Supply and Demand Zones!
The Supply and Demand Zones are based on the Swing Highs and Lows of my MTF Swing Highs and Lows Indicator.
The S/D Zones are created on the wicks of the Swing Highs and Lows.
You can choose whether to display the Chart, Higher and/or Highest timeframes as in the chart below.
You can also choose to display up to 3 S/D Zones from the past 3 Swing Highs and Lows.
The default setting is to display 1 chart timeframe S/D Zone, 2 higher and 3 highest, as I found this to be most effective without
cluttering the screen too much
The Chart Timeframe S/D Zones have an orange border, higher timeframe have a blue border and the highest have a black border.
Supply zones based on Swing Highs are red and Demand Zones based on Swing Lows are green.
This indicator displays Swing Highs and Lows on 3 timeframes based on the Chart timeframe, as follows:
Chart TF Higher TF Highest TF
1m 5m 15m
5m 15m 60m
15m 60m 240m
60m 240m Daily
240m Daily Weekly
Daily Weekly Monthly
You can change the font size of the labels as you'd prefer.
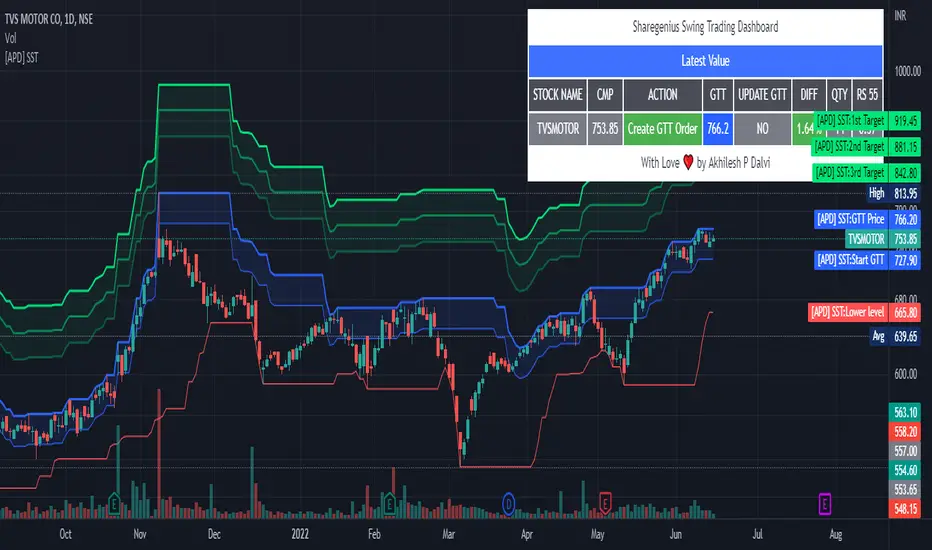
[APD] Sharegenius Swing Trading StrategyThis script plots GTT Price , Target Prices , Buy Zone , Target Zone and Information Dashboard according to Sharegenius Swing Trading Strategy. SST is for Swing Trading.
👉🏻 Strategy by Mahesh Kaushik -
1️⃣ Track the 20-Day Low of the instrument.
2️⃣ Create a GTT order which is 5% above 20 DL.
3️⃣ If the share makes a new 20 DL before getting purchased, then update your GTT order to be 5% above the new 20 DL.
4️⃣ Next GTT will be started when the average price falls by 10%. (GTT will be created as 5% above the last 20 DL or Buy on 10%, 20%, 30% fall in average price.)
5️⃣ Sell target is 5% of the average price. Sell all units or Set sell target on buy price.
6️⃣ No stop loss is needed as we buy when the stock falls.
👉🏻 Note:-
Trade in fundamentally good stocks & strong stocks those are outperforming index because we do not take stop loss in this strategy.
DISCLAIMER:- This Script is for educational purposes only. Nothing in this content should be interpreted as financial advice or a recommendation to buy or sell any sort of security or investment.
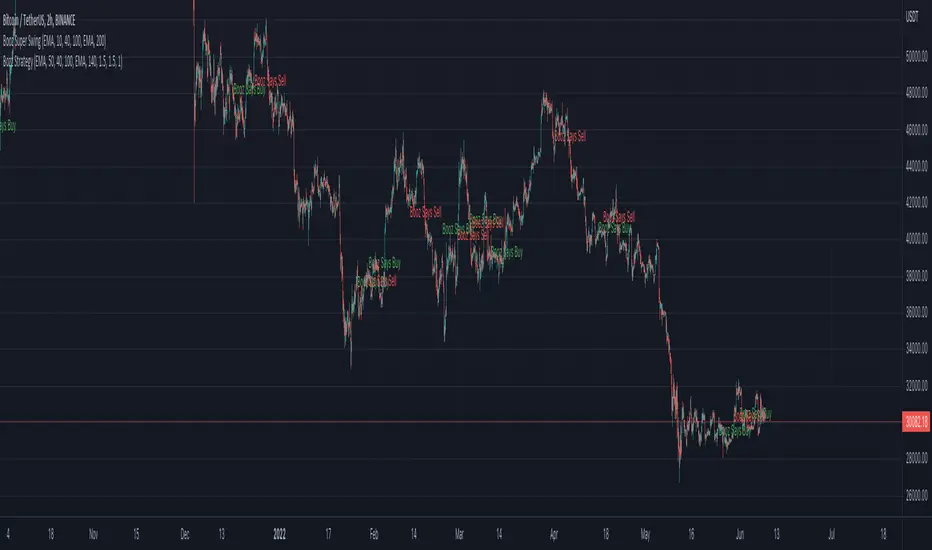
Booz Super SwingBooz Super Swing is an Indicator created for the purpose of identifying trends in Multiple Markets, it is based on Moving Average Crossover and extra features.
Trend Filter: allows you to take multiple entries in the same direction of the market.
If the market crosses below the 200 moving average it will take only short entries.
If the market crosses above the 200 moving average it will take only long entries.
Background Color : at a glance, you can see what cycle the market is in.
Green background : Shows that the market is in a bullish cycle.
Red background: Shows that the market is in a bearish cycle.
Markets : Booz Super Swing can be used and has been tested in Cryptocurrency, Stocks and Futures markets.
Timeframes
Charting from 1 Hour, 4 Hour, Daily, Weekly, Weekly
Weak Point :
Are Sideways Markets
Alarms :
Buy : Allows you to notify and automate entries based on market detection.
Sell : Allows you to notify and automate entries based on market detection.
RSI Scalping & Swing Signals With AlertsThis RSI indicator shows a green or red ribbon when the smoothed RSI is bullish or bearish. It also includes a long moving average for overall trend confirmation. Wait until the ribbon holds above or below the long moving average and take positions in that direction.
To get an easier to read RSI indicator, I smoothed the RSI out and paired it next to a short term RMA. These two together form the ribbon that will show you early reversals and trend direction. The long moving average is used as an overall trend detector and confirmation for longer term trends.
***HOW TO USE***
Scalping: Enter longs when the ribbon turns green and enter shorts when the ribbon turns red. Exit positions when the ribbon turns the opposite color or crosses the long moving average.
Swing Trading: When the ribbon holds above the long moving average or breaks out and retests it, look for long positions and exit when the ribbon turns red or crosses the long moving average. When the ribbon holds below the long moving average or breaks down and retests it, look for short positions and exit when the ribbon turns green or crosses the long moving average.
***DETAILS***
This indicator gives early reversal signals very well and waiting for the RSI ribbon to cross the long moving average helps to get you into positions when the market is ready to really move while filtering out some of the noise.
The ribbon and background will change to green or red depending on whether it is currently bullish or bearish.
There is also a label that changes colors and tells you if RSI is bullish or bearish and also whether the RSI ribbon is above or below the long moving average.
Green or red circles will appear on the indicator when there is a bullish or bearish cross of the RSI ribbon and the long moving average.
It also has alerts that trigger when RSI is turning bullish/bearish or when the RSI ribbon is crossing the long moving average.
***CUSTOMIZATION***
Each piece of this indicator can be customized to suit your preferences including the RSI source, length, smoothing length, short moving average length and long moving average length. You can also turn off the labels, signals and long moving average. All of these settings can be managed within the indicator settings input tab.
***MARKETS***
This indicator can be used as a signal on all markets, including stocks, crypto, futures and forex.
***TIMEFRAMES***
This RSI Scalping & Swing Signals indicator can be used on all timeframes.
***TIPS***
Try using numerous indicators of ours on your chart so you can instantly see the bullish or bearish trend of multiple indicators in real time without having to analyze the data. Some of our favorites are Trend Friend Scalp & Swing Trade Signals, Volume Spike Scanner, Buy & Sell Pressure Volume Profile, and Momentum Scalper in combination with this RSI indicator. They all have real time Bullish and Bearish labels as well so you can immediately understand each indicator's trend.

Momentum Scalping & Swing Signals With AlertsThis Momentum indicator shows a green or red ribbon when smoothed momentum is bullish or bearish. It also includes a long moving average for overall trend confirmation. Wait until the ribbon holds above or below the long moving average and take positions in that direction.
To get an easier to read momentum indicator, I smoothed the momentum out and paired it next to a short term RMA. These two together form the ribbon that will show you early reversals and trend direction. The long moving average is used as an overall trend detector and confirmation for longer term trends.
***HOW TO USE***
Scalping: Enter longs when the ribbon turns green and enter shorts when the ribbon turns red. Exit positions when the ribbon turns the opposite color or crosses the long moving average.
Swing Trading: When the ribbon holds above the long moving average or breaks out and retests it, look for long positions and exit when the ribbon turns red or crosses the long moving average. When the ribbon holds below the long moving average or breaks down and retests it, look for short positions and exit when the ribbon turns green or crosses the long moving average.
***DETAILS***
This indicator gives early reversal signals very well and waiting for the momentum ribbon to cross the long moving average helps to get you into positions when the market is ready to really move while filtering out some of the noise.
The ribbon and background will change to green or red depending on whether it is currently bullish or bearish.
There is also a label that changes colors and tells you if momentum is bullish or bearish and also whether the momentum ribbon is above or below the long moving average.
Green or red circles will appear on the indicator when there is a bullish or bearish cross of the momentum ribbon and the long moving average.
It includes alerts that trigger when momentum is turning bullish/bearish or when the momentum ribbon is crossing the long moving average.
***CUSTOMIZATION***
Each piece of this indicator can be customized to suit your preferences including the momentum source, length, smoothing length, short moving average length and long moving average length. You can also turn off the labels, signals and long moving average. All of these settings can be managed within the indicator settings input tab.
***MARKETS***
This indicator can be used as a signal on all markets, including stocks, crypto, futures and forex.
***TIMEFRAMES***
This Momentum Scalping & Swing Signals indicator can be used on all timeframes.
***TIPS***
Try using numerous indicators of ours on your chart so you can instantly see the bullish or bearish trend of multiple indicators in real time without having to analyze the data. Some of our favorites are Trend Friend Scalp & Swing Trade Signals, Volume Spike Scanner, Buy & Sell Pressure Volume Profile, and RSI Scalper in combination with this momentum indicator. They all have real time Bullish and Bearish labels as well so you can immediately understand each indicator's trend.

MTF Stochastic Zones w/ Candle and Swing Hi/Lo IndicatorsMTF Stochastic Zones w/ Candle and Swing Hi/Lo Indicators by // © KaizenTraderB
This indicator will display the Stochastic RSI as color zones utilizing 3 Timeframes of your choice as well as key reversal candles:
Entry Timeframe StochRSI Crossovers and Long Wick Reversal Candles (Hammer and Hanging Man) and Engulfing Candles
That correlate with Swing Highs and Lows.
When the higher timeframe is bullish it will be green and when bullish, red.
When the middle timeframe is counter the higher, it will appear brownish.
The entry timeframe will print Candle Labels and Swing Highs and Lows at bullish and bearish Stochastic RSI crossovers when oversold and overbought, respectively,
In the direction of the higher timeframe directional bias when the middle timeframe is counter that direction to catch reversals in corrections.
(It also prints Bull/Bear StochRSI Crossovers that correlated with Swing Highs and Lows that are not Hammers, Hanging Men or Engulfing Candles.)
The options allow you to turn the zones, swing highs and lows, candle indicators and entry StochRSI Crossovers on and off, as well as which Timeframes you choose to view.
Entry - 1Hr, 15m, 5m or 1m Middle Timeframe - Daily, 4Hr, 1Hr or 15m Higher Timeframe - Monthly, Weekly, Daily, 4Hr or 1Hr
You can change the Swing High and Low Lookback periods, as well as
The Stochastic RSI Lookback for each of the three timeframes and the level of Overbought and Oversold:
When 8 is chosen for RSI Lookback, Stochastic Lookback = 5, SmoothK = 3, Smooth D = 3 For 13 - 8, 5, 5 For 21 - 13, 8, 8 For 34 - 21, 13, 13
Its good practice to adjust settings so Higher Timeframe zones (green/red) correlate with longer trend movements,
Medium Timeframe with corrections and reversal areas (brown) and Entry Timeframe with key reversal candles.
For example, to adjust the Daily Higher Timeframe, turn the Higher Timeframe to Daily, turn off the others and bring up the Daily Chart.
Look at chart for last 200 bars or so and go through the different settings until you find the one that best correlates with recent past price action.
Do the same procedure for the Middle and Entry Timeframe. Once all the settings are how you prefer, view the Indicator on the Entry Timeframe to find trades.
Coding included to prevent repainting
Can be used in conjunction with the MTF Stochastic RSI w/ Zones which is displayed in the lower panel.
Need the same settings in both indicators for them to correlate or use different settings for different views,
Message me with feedback to improve upon this indicator or requested additions.
I will soon be releasing a Strategy based on this indicator!

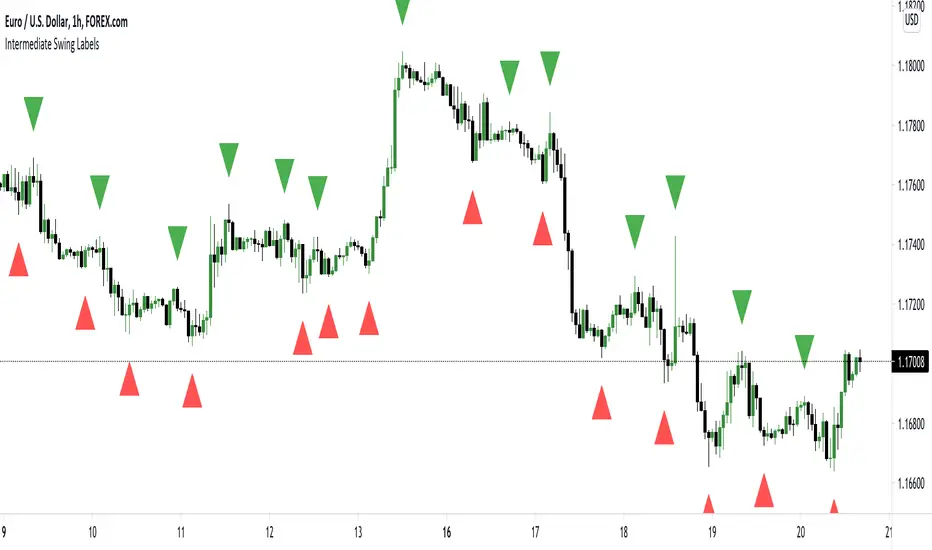
Intermediate Swing LabelsDraws labels above Intermediate Swing Highs, and below Intermediate Swing Lows. Intermediate Swing Highs are highs with swing highs on either side. Intermediate Swing Lows are lows with swing lows on either side.
Range Filter & LabelsAll credit goes to @DonovanWall for the Range Filter.
I just added Buy & Sell labels to demonstrate how the VuManChu Swing generates the same exact signals as the Range filter using the exact same settings between the two indicators.
This would only seem plausible if VuManChu Swing runs on the same code as the Range Filter.
It looks likely to be the old version of the Range Filter, where it had only two Inputs, Range Size and Range Period
