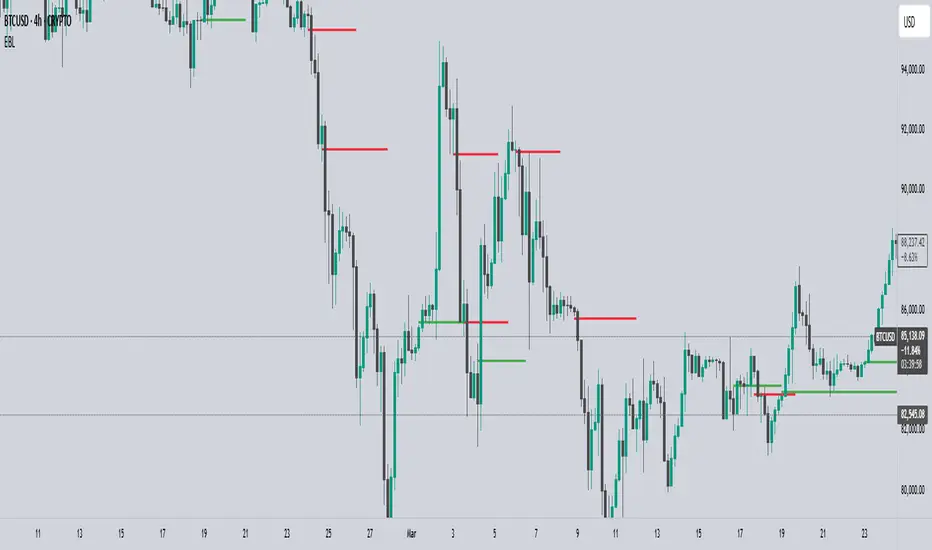
EBL - Enigma BOS LogicThe EBL - Enigma BOS Logic indicator is designed to detect key trend reversal points with precision by leveraging a unique concept based on two-candle price action analysis. Inspired by the balance of pairs in creation, this indicator identifies trend changes by focusing on significant bullish and bearish candle pairs, storing key levels, and waiting for confirmation to provide actionable trade signals. It goes beyond conventional trend-following indicators by offering real-time alerts and clear visual cues for traders.
How It Works
Bullish Setup:
The indicator identifies a bullish candle followed by a bearish candle. It then stores the high of the bullish candle as a potential reversal level.
A bullish confirmation occurs when a future bullish candle closes above the stored high. When this happens:
A green arrow is plotted below the confirming candle.
A horizontal green line is drawn at the stored high level, extending forward by a user-defined number of bars.
An alert is triggered to notify the trader of a confirmed bullish trend.
Bearish Setup:
The indicator identifies a bearish candle followed by a bullish candle. It stores the low of the bearish candle as a potential reversal level.
A bearish confirmation occurs when a future bearish candle closes below the stored low. When this happens:
A red arrow is plotted above the confirming candle.
A horizontal red line is drawn at the stored low level, extending forward by a user-defined number of bars.
An alert is triggered to notify the trader of a confirmed bearish trend.
Touch or Cross Alerts:
In addition to initial trend confirmation, the indicator tracks price movements relative to the drawn horizontal lines.
If the price returns to touch or cross a previously drawn horizontal line, an alert is triggered, indicating a potential re-entry or retracement opportunity.
Customization Options
To make the indicator versatile and adaptable for different trading styles, several customization options are provided:
Line Colors: Traders can customize the colors of the bullish and bearish lines.
Show/Hide Arrows and Lines: Users can choose whether to display the arrows and horizontal lines on the chart.
Line Length: The length of the horizontal lines (number of bars they extend into the future) is user-defined, offering flexibility based on trading timeframes and preferences.
Use Cases
Trend Reversal Detection: EBL is ideal for identifying key trend reversals, allowing traders to enter trades with a high probability of success.
Breakout Confirmation: The indicator provides visual and alert-based confirmation of breakouts beyond critical support or resistance levels.
Re-entry Opportunities: With alerts for price touching or crossing horizontal lines, traders can spot potential re-entry points during retracements.
Conceptual Foundation
The methodology behind this indicator is rooted in the principle that markets often move in pairs of bullish and bearish forces. By tracking the interaction between consecutive bullish and bearish candles and waiting for clear confirmations, this indicator ensures that only high-probability trend changes are signaled. This reduces noise and enhances trading accuracy, making it suitable for scalping, day trading, and swing trading across various timeframes.
How to Use
Apply the indicator to any chart and timeframe of your choice.
Set your preferred customization options, including line colors, arrow display, and line length.
Watch for arrows and listen for alerts to identify confirmed trend changes.
Pay attention to touch or cross alerts on horizontal lines, as these can signal potential re-entry or secondary trade opportunities.
Combine with other analysis: While EBL is powerful on its own, combining it with support/resistance analysis, moving averages, or volume indicators can further enhance its effectiveness.
This indicator is a powerful tool for traders seeking precision in identifying trend changes and actionable trade signals. Its unique logic, real-time alerts, and clear visual cues make it a valuable addition to any trader’s toolkit.
ค้นหาในสคริปต์สำหรับ "swing trading"
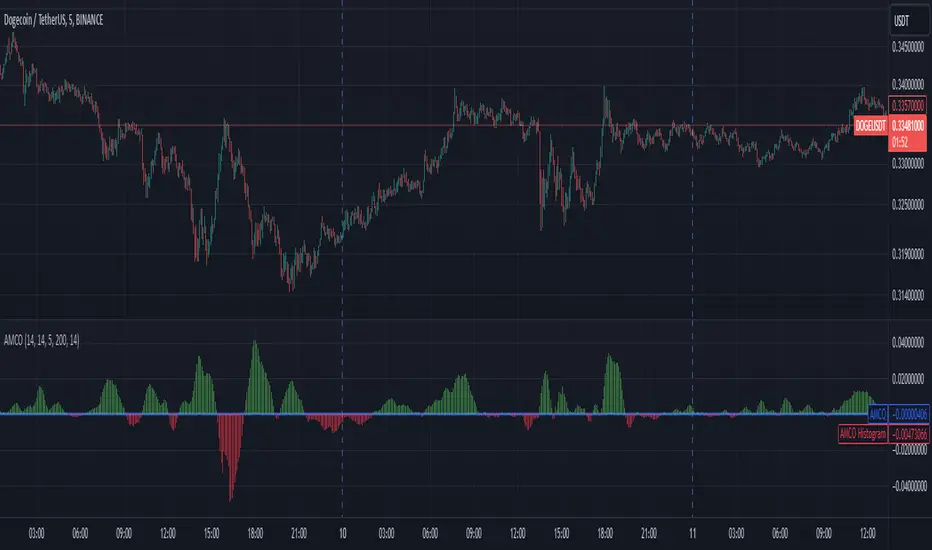
Adaptive Momentum Cycle Oscillator (AMCO)1. Concept and Foundation
The Adaptive Momentum Cycle Oscillator (AMCO) is an advanced indicator designed to dynamically adjust to varying market conditions while identifying price cycles and trends. It combines momentum and volatility into a single, oscillating signal that helps traders detect turning points in price movements. By incorporating adaptive periods and trend filtering, AMCO ensures relevance across different asset classes and timeframes. This innovation bridges the gap between traditional oscillators and trending indicators, providing a comprehensive tool for both cycle identification and trend confirmation.
2. Dynamic Adaptation to Market Conditions
A standout feature of AMCO is its ability to adapt its sensitivity based on market volatility. Using the ATR (Average True Range) as a measure of current volatility, AMCO adjusts its calculation periods dynamically. During periods of high volatility, it extends its lookback periods to smooth out noise and avoid false signals. Conversely, in low-volatility environments, it shortens its periods to remain responsive to smaller price fluctuations. This adaptability ensures that AMCO remains effective and reliable in both trending and ranging markets.
3. Trend Awareness and Directional Weighting
AMCO integrates a trend filter based on a long-term moving average, such as SMA(200), to align its signals with the broader market direction. This filter ensures that buy signals are prioritized during uptrends and sell signals during downtrends, reducing counter-trend trades. Additionally, a directional weighting mechanism amplifies momentum signals that align with the prevailing trend. This dual-layer approach significantly enhances the accuracy of signals, making AMCO especially useful in markets with clear directional bias.
4. Normalized Visualization for Clarity
The AMCO includes a normalized histogram that provides a clear visual representation of momentum strength relative to recent volatility. By dividing the raw AMCO value by the ATR, the histogram ensures consistency across assets with varying price ranges and volatility levels. Positive bars indicate bullish momentum, while negative bars signify bearish momentum. This intuitive visualization makes it easier for traders to interpret market dynamics and act on actionable signals, regardless of asset type or timeframe.
5. Practical and Actionable Signals
AMCO generates practical signals based on zero-line crossovers, allowing traders to easily identify shifts between bullish and bearish cycles. Positive values above the zero line suggest upward momentum, signaling potential buying opportunities, while negative values below the zero line indicate downward momentum, signaling potential sell opportunities. By combining adaptive behavior, trend filtering, and momentum-strength normalization, AMCO offers traders a robust framework for navigating complex markets with confidence. Its versatility makes it suitable for scalping, swing trading, and even longer-term investing.
EMA/SMA + Multi-Timeframe Dashboard (Vertical)20/50 ema and 200 sma
The EMA SMA Trading Indicator combines the power of Exponential Moving Averages (EMA) and Simple Moving Averages (SMA) to help traders identify trends, reversals, and key entry/exit points.
Features:
Dual Moving Averages: Tracks both EMA and SMA to provide a balanced view of short-term and long-term market trends.
Customizable Periods: Allows users to set unique periods for EMA and SMA to suit their trading style and timeframe (e.g., day trading, swing trading, or investing).
Cross Alerts: Highlights EMA and SMA crossover points, which often indicate potential buy or sell signals.
Color-Coded Lines: Visual differentiation between EMA (dynamic and responsive) and SMA (smooth and lagging) for better readability.
Multi-Timeframe Compatibility: Suitable for scalping, intraday trading, and long-term analysis.
Usage:
Trend Confirmation: When the EMA is above the SMA, it signals a bullish trend; when it is below the SMA, it signals a bearish trend.
Crossover Strategy: Use crossovers as potential buy (EMA crosses above SMA) or sell (EMA crosses below SMA) signals.
Dynamic Support/Resistance: EMA can act as short-term support/resistance, while SMA represents long-term levels.
This indicator is perfect for traders who want to combine EMA's speed with SMA's stability for improved decision-making in volatile markets. Customizable alerts and visual cues make it user-friendly for beginners and experienced traders.
Make informed decisions and take your trading to the next level with the EMA SMA Trading Indicator!

Dynamic Display for Max/Min MA Types with Fake-Out FilterDynamic Moving Average Max/Min Indicator with Step Line Break
**** select the setting to STEP LINE BREAK****
This indicator provides a powerful way to identify dynamic entry and stop-loss levels for both long and short trades. It calculates the maximum and minimum values of a selected moving average (MA) over a specified lookback period, adapting dynamically to market conditions. It features options for various MA types, including SMA, EMA, HMA, RMA, and DEMA, to suit different trading strategies and styles.
How It Works
1. Moving Average Selection: Choose the type of moving average (SMA, EMA, HMA, RMA, or DEMA) and its period (e.g., HMA 13).
2. Max/Min Calculation: The indicator calculates the highest and lowest values of the selected moving average over a specified lookback period (e.g., 5 candles).
3. Dynamic Plotting:
• Bullish Market: When the price breaks the Max MA level, the Min level is plotted, trailing upward as a potential stop-loss for long trades.
• Bearish Market: When the price breaks the Min MA level, the Max level is plotted, trailing downward as a potential stop-loss for short trades.
4. Fake-Out Filter: If a candle breaks the Max/Min level but closes within the range (indicating a fake-out), the plots do not switch. This can cause repainting during volatile conditions, so use caution in high-wick markets.
Features
• Customizable Inputs: Adjust MA type, period, lookback, and timeframe to suit your trading strategy.
• Multi-Timeframe Flexibility: Works on all timeframes, from micro-scalping on the 1-minute chart to swing trading on higher timeframes.
• Trend Confirmation: Provides clear indications of when to enter or exit based on dynamic levels.
• Risk Management: Highlights stop-loss levels that trail the trend, helping to lock in profits or limit losses.
Advantages
1. Clear Entry/Exit Points: Provides actionable signals for both long and short trades, with defined stop-loss locations.
2. Customizable for Any Style: Tailor the indicator to your product, timeframe, and trading approach (scalping or swing trading).
3. Trend-Focused Guidance: Helps avoid counter-trend trades by showing the dominant trend direction.
4. Adaptive to Market Conditions: The dynamic nature of the indicator allows it to respond to both trending and consolidating markets.
Limitations
1. Repainting During Fake-Outs: The indicator can repaint during volatile periods with long wicks, as it filters for fake-out candles. This may create noise in certain market conditions.
2. Optimization Required: The ideal settings for MA type, period, and lookback are dependent on the market profile and need to be fine-tuned by the trader.
3. Less Effective in Consolidation: In sideways or choppy markets, the indicator may produce less reliable signals unless adjusted for lower sensitivity.
Trading Tips
• Use this indicator to focus on trending markets, avoiding trades against the prevailing trend. For example, during an uptrend, only take long trades and avoid shorts.
• Consider having two configurations: one for trending markets and one for consolidating markets, switching between them as needed.
• Pair this indicator with volume analysis, price action, or other complementary tools to increase accuracy and reduce noise.
This indicator is designed to be both an entry and risk management tool, enabling traders to make informed decisions while keeping risks in check.

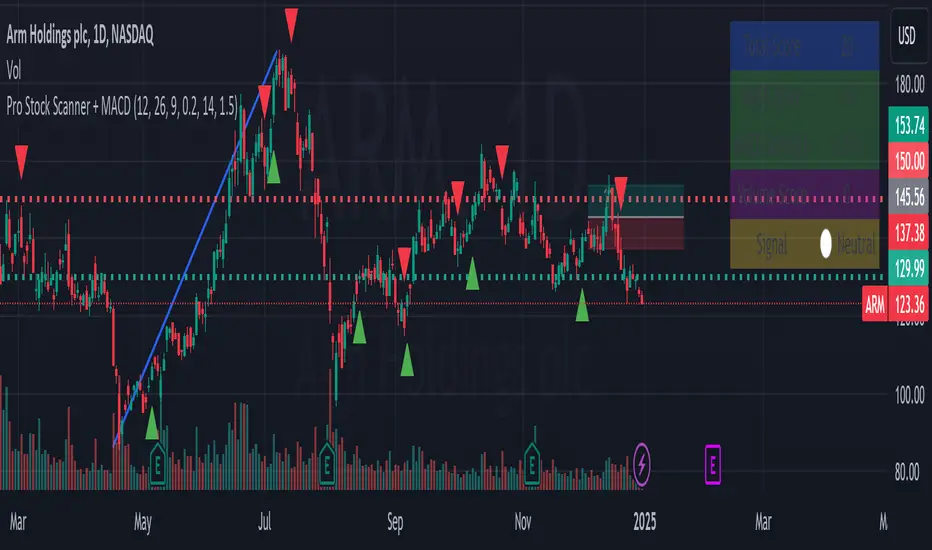
Pro Stock Scanner + MACD# Pro Stock Scanner - Advanced Trading System
### Professional Scanning System Combining MACD, Momentum & Technical Analysis
## 🎯 Indicator Purpose
This indicator was developed to identify high-quality trading opportunities by combining:
- Strong positive momentum
- Clear technical trend
- Significant trading volume
- Precise MACD signals
## 💡 Core Mechanics
The indicator is based on three core components:
### 1. Advanced MACD Analysis (40%)
- MACD line crossover tracking
- Momentum strength measurement
- Positive/negative divergence detection
- Score range: 0-40 points
### 2. Trend Analysis (40%)
- Moving average relationships (MA20, MA50)
- Primary trend direction
- Current trend strength
- Score range: 0-40 points
### 3. Volume Analysis (20%)
- Comparison with 20-day average volume
- Volume breakout detection
- Score range: 0-20 points
## 📊 Scoring System
Total score (0-100) composition:
```
Total Score = MACD Score (40%) + Trend Score (40%) + Volume Score (20%)
```
### Score Interpretation:
- 80-100: Strong Buy Signal 🔥
- 65-79: Developing Bullish Trend ⬆️
- 50-64: Neutral ↔️
- 0-49: Technical Weakness ⬇️
## 📈 Chart Markers
1. **Large Blue Triangle**
- High score (80+)
- Positive MACD
- Bullish MACD crossover
2. **Small Triangles**
- Green: Bullish MACD crossover
- Red: Bearish MACD crossover
## 🎛️ Customizable Parameters
```
MACD Settings:
- Fast Length: 12
- Slow Length: 26
- Signal Length: 9
- Strength Threshold: 0.2%
Volume Settings:
- Threshold: 1.5x average
```
## 📱 Information Panel
Real-time display of:
1. Total Score
2. MACD Score
3. MACD Strength
4. Volume Score
5. Summary Signal
## ⚙️ Optimization Guidelines
Recommended adjustments:
1. **Bull Market**
- Decrease MACD sensitivity
- Increase volume threshold
- Focus on trend strength
2. **Bear Market**
- Increase MACD sensitivity
- Stricter trend conditions
- Higher score requirements
## 🎯 Recommended Trading Strategy
### Phase 1: Initial Scan
1. Look for 80+ total score
2. Verify sufficient trading volume
3. Confirm bullish MACD crossover
### Phase 2: Validation
1. Check long-term trend
2. Identify nearby resistance levels
3. Review earnings calendar
### Phase 3: Position Management
1. Set clear stop-loss
2. Define realistic profit targets
3. Monitor score changes
## ⚠️ Important Notes
1. This indicator is a supplementary tool
2. Combine with fundamental analysis
3. Strict risk management is essential
4. Not recommended for automated trading
## 📈 Usage Examples
Examples included:
1. Successful buy signal
2. Trend reversal identification
3. False signal analysis and lessons learned
## 🔄 Future Updates
1. RSI integration
2. Advanced alerts
3. Auto-optimization features
## 🎯 Key Benefits
1. Clear scoring system
2. Multiple confirmation layers
3. Real-time market feedback
4. Customizable parameters
## 🚀 Getting Started
1. Add indicator to chart
2. Adjust parameters if needed
3. Monitor information panel
4. Wait for strong signals (80+ score)
## 📊 Performance Metrics
- Success rate: Monitor and track
- Best performing in trending markets
- Optimal for swing trading
- Most effective on daily timeframe
## 🛠️ Technical Details
```pine
// Core components
1. MACD calculation
2. Volume analysis
3. Trend confirmation
4. Score computation
```
## 💡 Pro Tips
1. Use multiple timeframes
2. Combine with support/resistance
3. Monitor sector trends
4. Consider market conditions
## 🤝 Support
Feedback and improvement suggestions welcome!
## 📜 License
MIT License - Free to use and modify
## 📚 Additional Resources
- Recommended timeframes: Daily, 4H
- Best performing markets: Stocks, ETFs
- Optimal market conditions: Trending markets
- Risk management guidelines included
## 🔍 Final Notes
Remember:
- No indicator is 100% accurate
- Always use proper position sizing
- Combine with other analysis tools
- Practice proper risk management
// @version=5
// @description Pro Stock Scanner - Advanced trading system combining MACD, momentum and volume analysis
// @author AviPro
// @license MIT
//
// This indicator helps identify high-quality trading opportunities by analyzing:
// 1. MACD momentum and crossovers
// 2. Trend strength and direction
// 3. Volume patterns and breakouts
//
// The system provides:
// - Total score (0-100)
// - Visual signals on chart
// - Information panel with key metrics
// - Customizable parameters
//
// IMPORTANT: This indicator is for educational and informational purposes only.
// Always conduct your own analysis and use proper risk management.
//
// If you find this indicator helpful, please consider leaving a like and comment!
// Feedback and suggestions for improvement are always welcome.
Previous Day High and Low by DRK TradingThe Previous Day High and Low Indicator is a simple yet powerful tool designed for traders who want to keep track of critical levels from the previous trading session. This indicator automatically marks the high and low of the previous day on your chart with dashed horizontal lines, making it easier to identify key support and resistance zones.
Features:
Horizontal Lines: Clearly marks the previous day's high and low levels.
Dynamic Updates: Automatically updates at the start of a new trading day.
Visual Clarity: Includes labels at the start of the day for quick reference.
Customizable: Works seamlessly across all timeframes and instruments.
Use Case:
Identify potential breakout and reversal zones.
Enhance intraday and swing trading strategies by focusing on key price levels.
Plan stop-loss and target levels based on historical price movements.
This indicator is perfect for price action traders, intraday scalpers, and swing traders who rely on past price behavior to make informed decisions.

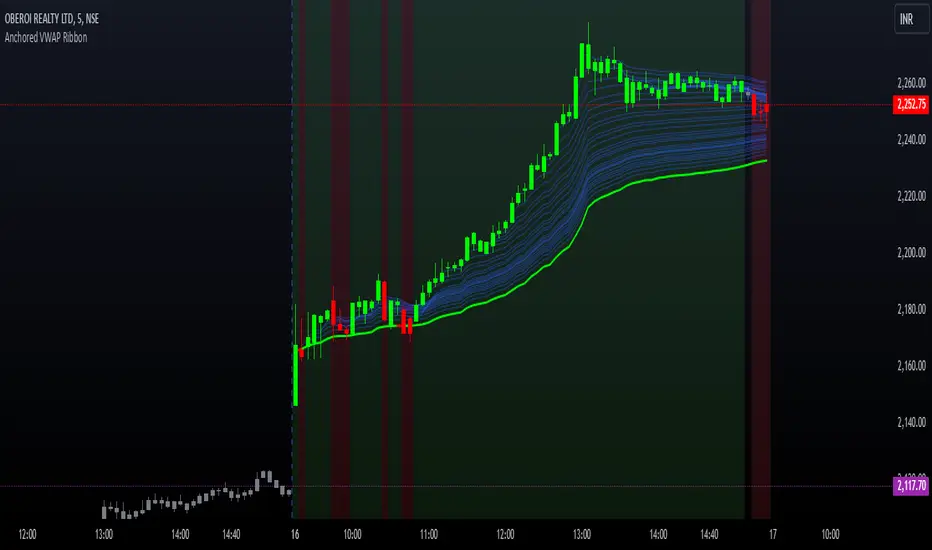
Options Series - Anchored VWAP Ribbon➤ AVWAP On different chart symbols:
⭐ Overview and Key Features:
Anchored VWAP Calculation:
The script implements the Anchored Volume Weighted Average Price (AVWAP), a tool used by professional traders to identify key price levels weighted by volume, starting from a specific timestamp (anchor point).
Bullish and Bearish Analysis:
It determines the dominance of bullish or bearish momentum based on the relationship between the close price and AVWAP levels across multiple time points.
Dynamic Visualization:
The background of the chart changes color based on overall bullish or bearish sentiment, making it easier to interpret market trends.
Multi-Time Anchors:
By defining multiple anchor points (e.g., 09:15, 09:20), the script calculates a series of AVWAP values for fine-grained intraday analysis.
Customizable Inputs:
Users can select the source price (e.g., hlc3), date, and time for AVWAP calculation.
⭐ How It Works and Functionality:
AVWAP Logic:
Uses the timestamp() function to establish a reference (anchor point).
Calculates the cumulative weighted price (price * volume) and cumulative volume from this anchor point.
The ratio of these sums gives the AVWAP, which updates dynamically with new bars.
Bullish and Bearish Signals:
Binary flags (1 or 0) are set for each time point depending on whether the closing price is above or below the AVWAP for that time.
Aggregates these flags into AVWAP_bull and AVWAP_bear to represent the overall market sentiment.
Decision Logic:
Determines final market conditions (bullish or bearish dominance) based on aggregated scores.
Visual feedback (background and bar colors) is applied accordingly.
⭐ Visualizations and User Experience:
Background Colors:
Green or red background highlights the overall sentiment (bullish or bearish), providing a quick market overview.
Bar Coloring:
Bars are color-coded based on bullish, bearish, or neutral conditions, making it easier to identify trends directly on the chart.
AVWAP Levels:
The calculated AVWAP values are plotted as colored lines for each anchor point, giving precise intraday levels of significance.
Bright colors (fluorescent green/red) are used for additional clarity when the close price is above or below these levels.
🎨 Settings and Customization:
Anchor Point:
Fully customizable anchor points allow users to set specific dates and times (e.g., 09:15 on December 13, 2024) for AVWAP calculations.
Source Price:
Users can choose from hlc3, close, or any other price source to calculate the AVWAP, tailoring the indicator to their strategy.
Visual Appearance:
The transparency, colors, and line styles are adjustable, enabling users to customize the chart to match their trading preferences.
Dynamic Signals:
The script accommodates numerous AVWAP levels, providing flexibility for scalpers and swing traders alike.
⭐ Uniqueness of the Concept:
Precise Intraday Analysis:
Unlike static VWAP, this script allows anchoring to specific times during the day, offering granular insights into market behavior.
Cumulative Sentiment Approach:
Aggregates signals across multiple time intervals, providing a comprehensive view of intraday momentum rather than a single-point reference.
Blending AVWAP with Visual Feedback:
Combines traditional AVWAP calculations with visually impactful features like background shading and bar coloring to enhance decision-making.
Scalability:
Supports adding multiple additional anchor points and customization for broader applicability in different market conditions.
🚀 Conclusion:
The Anchored VWAP Ribbon script is a powerful tool for traders seeking to analyze price behavior relative to volume-weighted levels anchored at specific times. It provides a visually intuitive way to assess intraday market sentiment, combining traditional technical indicators with customizable visualization features. The script’s flexibility makes it suitable for a variety of trading styles, from scalping to swing trading, while its unique cumulative sentiment logic sets it apart from conventional VWAP tools.
Crypto Market Cap Momentum Analyzer (AiBitcoinTrend)The Crypto Market Cap Momentum Analyzer (AiBitcoinTrend) is a robust tool designed to uncover trading opportunities by blending market cap analysis and momentum dynamics. Inspired by research-backed quantitative strategies, this indicator helps traders identify trend-following and mean-reversion setups in the cryptocurrency market by evaluating recent performance and market cap size.
This indicator classifies cryptocurrencies into market cap quintiles and ranks them based on their 2-week momentum. It then suggests potential trades—whether to go long, anticipate reversals, or simply hold—based on the crypto's market cap group and momentum trends.
👽 How the Indicator Works
👾 Market Cap Classification
The indicator categorizes cryptocurrencies into one of five market cap groups based on user-defined inputs:
Large Cap: Highest market cap tier
Upper Mid Cap: Second highest group
Mid Cap: Middle-tier market caps
Lower Mid Cap: Slightly below the mid-tier
Small Cap: Lowest market cap tier
This classification dynamically adjusts based on the provided market cap data, ensuring that you’re always working with a representative market structure.
👾 Momentum Calculation
By default, the indicator uses a 2-week momentum measure (e.g., a 14-day lookback when set to daily). It compares a cryptocurrency’s current price to its price 14 bars ago, thereby quantifying its short-term performance. Users can adjust the momentum period and rebalance period to capture shorter or longer-term trends depending on their trading style.
👾 Dynamic Ranking and Trade Suggestions
After assigning cryptos to size quintiles, the indicator sorts them by their momentum within each quintile. This two-step process results in:
Long Trade: For smaller market cap groups (Small, Lower Mid, Mid Cap) that have low (bottom-quintile) momentum, anticipating a trend continuation or breakout.
Reversal Trade: For the largest market cap group (Large Cap) that shows low momentum, expecting a mean-reversion back to equilibrium.
Hold: In scenarios where the coin’s momentum doesn’t present a strong contrarian or trend-following signal.
👽 Applications
👾 Trend-Following in Smaller Caps: Identify small or mid-cap cryptos with low momentum that might be poised for a breakout or sustained trend.
👾 Mean-Reversion in Large Caps: Pinpoint large-cap cryptocurrencies experiencing a temporary lull in performance, potentially ripe for a rebound.
👽 Why It Works in Crypto
The cryptocurrency market is heavily driven by retail investor sentiment and volatility. Research shows that:
Small-Cap Cryptos: Tend to experience higher volatility and speculative trends, making them ideal for momentum trades.
Large-Cap Cryptos: Exhibit more predictable behavior, making them suitable for mean-reversion strategies when momentum is low.
This indicator captures these dynamics to give traders a strategic edge in identifying both momentum and reversal opportunities.
👽 Indicator Settings
👾 Rebalance Period: The frequency at which momentum and trade suggestions are recalculated (Daily, Weekly, Monthly).
Shorter Periods (Daily): Fast updates, suitable for short-term trades, but more noise.
Longer Periods (Weekly/Monthly): Smoother signals, ideal for swing trading and more stable trends.
👾 Momentum Period: The lookback period for momentum calculation (default is 14 bars).
Shorter Periods: More responsive but prone to noise.
Longer Periods : Reflects broader trends, reducing sensitivity to short-term fluctuations.
Disclaimer: This information is for entertainment purposes only and does not constitute financial advice. Please consult with a qualified financial advisor before making any investment decisions.

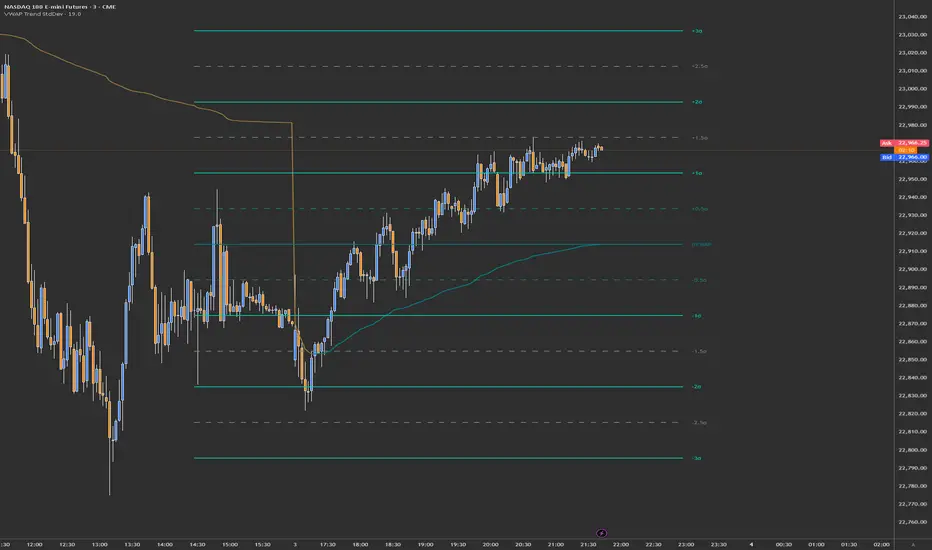
VWAP Trend with Standard Deviation & MidlinesThis indicator is a sophisticated VWAP (Volume Weighted Average Price) tool with multiple features:
Core Functionality:
1. Calculates a primary VWAP line that changes color based on trend direction (green when rising, red when falling)
2. Creates multiple standard deviation bands around the VWAP at customizable distances
3. Resets calculations at either:
- New York session start time (configurable, default 9:30 AM)
- Daily start time
- Can be hidden on daily/weekly/monthly timeframes if desired
Band Structure:
- Band 1 (innermost): ±1 standard deviation
- Band 2 (middle): ±2 standard deviations
- Band 3 (outermost): ±3 standard deviations
- Midlines at 0.5σ intervals between bands
- All bands can be individually enabled/disabled
Customization Options:
1. Band calculation modes:
- Standard Deviation based
- Percentage based
2. Visual settings:
- Customizable colors for all elements
- Adjustable line widths
- Optional labels with configurable size
- Optional extension lines
- Label position adjustment
3. Source data selection (default: HLC3 - High, Low, Close average)
Common Uses:
- Identifying potential support/resistance levels
- Measuring price volatility
- Spotting mean reversion opportunities
- Trading range analysis
- Trend direction confirmation
The indicator essentially creates a dynamic support/resistance structure that adapts to market volatility and volume, making it useful for both intraday and swing trading strategies.
Kalman PredictorThe **Kalman Predictor** indicator is a powerful tool designed for traders looking to enhance their market analysis by smoothing price data and projecting future price movements. This script implements a Kalman filter, a statistical method for noise reduction, to dynamically estimate price trends and velocity. Combined with ATR-based confidence bands, it provides actionable insights into potential price movement, while offering clear trend and momentum visualization.
---
#### **Key Features**:
1. **Kalman Filter Smoothing**:
- Dynamically estimates the current price state and velocity to filter out market noise.
- Projects three future price levels (`Next Bar`, `Next +2`, `Next +3`) based on velocity.
2. **Dynamic Confidence Bands**:
- Confidence bands are calculated using ATR (Average True Range) to reflect market volatility.
- Visualizes potential price deviation from projected levels.
3. **Trend Visualization**:
- Color-coded prediction dots:
- **Green**: Indicates an upward trend (positive velocity).
- **Red**: Indicates a downward trend (negative velocity).
- Dynamically updated label displaying the current trend and velocity value.
4. **User Customization**:
- Inputs to adjust the process and measurement noise for the Kalman filter (`q` and `r`).
- Configurable ATR multiplier for confidence bands.
- Toggleable trend label with adjustable positioning.
---
#### **How It Works**:
1. **Kalman Filter Core**:
- The Kalman filter continuously updates the estimated price state and velocity based on real-time price changes.
- Projections are based on the current price trend (velocity) and extend into the future (Next Bar, +2, +3).
2. **Confidence Bands**:
- Calculated using ATR to provide a dynamic range around the projected future prices.
- Indicates potential volatility and helps traders assess risk-reward scenarios.
3. **Trend Label**:
- Updates dynamically on the last bar to show:
- Current trend direction (Up/Down).
- Velocity value, providing insight into the expected magnitude of the price movement.
---
#### **How to Use**:
- **Trend Analysis**:
- Observe the direction and spacing of the prediction dots relative to current candles.
- Larger spacing indicates a potential strong move, while clustering suggests consolidation.
- **Risk Management**:
- Use the confidence bands to gauge potential price volatility and set stop-loss or take-profit levels accordingly.
- **Pullback Detection**:
- Look for flattening or clustering of dots during trends as a signal of potential pullbacks or reversals.
---
#### **Customizable Inputs**:
- **Kalman Filter Parameters**:
- `lookback`: Adjusts the smoothing window.
- `q`: Process noise (higher values make the filter more reactive to changes).
- `r`: Measurement noise (controls sensitivity to price deviations).
- **Confidence Bands**:
- `band_multiplier`: Multiplies ATR to define the range of confidence bands.
- **Visualization**:
- `show_label`: Option to toggle the trend label.
- `label_offset`: Adjusts the label’s distance from the price for better visibility.
---
#### **Examples of Use**:
- **Scalping**: Use on lower timeframes (e.g., 1-minute, 5-minute) to detect short-term price trends and reversals.
- **Swing Trading**: Identify pullbacks or continuations on higher timeframes (e.g., 4-hour, daily) by observing the prediction dots and confidence bands.
- **Risk Assessment**: Confidence bands help visualize potential price volatility, aiding in the placement of stops and targets.
---
#### **Notes for Traders**:
- The **Kalman Predictor** does not predict the future with certainty but provides a statistically informed estimate of price movement.
- Confidence bands are based on historical volatility and should be used as guidelines, not guarantees.
- Always combine this tool with other analysis techniques for optimal results.
---
This script is open-source, and the Kalman filter logic has been implemented uniquely to integrate noise reduction with dynamic confidence band visualization. If you find this indicator useful, feel free to share your feedback and experiences!
---
#### **Credits**:
This script was developed leveraging the statistical principles of Kalman filtering and is entirely original. It incorporates ATR for dynamic confidence band calculations to enhance trader usability and market adaptability.

Price Above 50 and 200 EMA with Smiley faces and 200 ema slope
Overview
This advanced indicator provides a comprehensive multi-timeframe analysis of price positioning relative to 50 and 200 Exponential Moving Averages (EMAs), offering traders a quick and intuitive view of market trends across different timeframes.
Key Features
Multi-Timeframe Analysis: Simultaneously evaluates price behavior across 5m, 15m, and other selected timeframes
EMA Trend Visualization: Instantly shows whether price is above or below 50 and 200 EMAs
Slope Direction Indicator: Tracks the directional momentum of the 200 EMA
Customizable Distance Metrics: Option to display distances as absolute values or percentages
Emoji-Based Indicators: Quick visual representation of price positioning
Functionality
The indicator uses color-coded and emoji-based signals to represent:
😊 (Blue): Price is above the EMA
☹️ (Red): Price is below the EMA
⬆️ (Blue): EMA slope is positive
⬇️ (Red): EMA slope is negative
Customization Options
Adjustable EMA periods
Togglable distance display
Distance representation (percentage or absolute value)
Best Used For
Trend identification
Multi-timeframe analysis
Quick market sentiment assessment
Supplementing other technical analysis tools
Recommended Timeframes
Intraday trading
Swing trading
Trend following strategies
Risk Disclaimer
This indicator is a tool for analysis and should not be used in isolation for trading decisions. Always combine with other technical and fundamental analysis, and proper risk management.
Azlan MA Silang PLUS++Overview
Azlan MA Silang PLUS++ is an advanced moving average crossover trading indicator designed for traders who want to jump back into the market when they missed their first opportunity to take a trade. It implements a sophisticated dual moving average system with customizable settings and re-entry signals, making it suitable for both trend following and swing trading strategies.
Key Features
• Dual Moving Average System with multiple MA types (EMA, SMA, WMA, LWMA)
• Customizable price sources for each moving average
• Smart re-entry system with configurable maximum re-entries
• Visual signals with background coloring and shape markers
• Comprehensive alert system for both initial and re-entry signals
• Flexible parameter customization through input options
Input Parameters
Moving Average Configuration
• MA1 Type: Choice between SMA, EMA, WMA, LWMA (default: EMA)
• MA2 Type: Choice between SMA, EMA, WMA, LWMA (default: EMA)
• MA1 Length: Minimum value 1 (default: 8)
• MA2 Length: Minimum value 1 (default: 15)
• MA1 & MA2 Shift: Offset values for moving averages
• Price Sources: Configurable for each MA (Open, High, Low, Close, HL/2, HLC/3, HLCC/4)
Re-entry System
• Enable/Disable re-entry signals
• Maximum re-entries allowed (default: 3)
Technical Implementation
Price Source Calculation
The script implements a flexible price source system through the price_source() function:
• Supports standard OHLC values
• Includes compound calculations (HL/2, HLC/3, HLCC/4)
• Defaults to close price if invalid source specified
Moving Average Types
Implements four MA calculations:
1. SMA (Simple Moving Average)
2. EMA (Exponential Moving Average)
3. WMA (Weighted Moving Average)
4. LWMA (Linear Weighted Moving Average)
Signal Generation Logic
Initial Signals
• Buy Signal: MA1 crosses above MA2 with price above both MAs
• Sell Signal: MA1 crosses below MA2 with price below both MAs
Re-entry Signals
Re-entry system activates when:
1. Price crosses under MA1 in buy mode (or over in sell mode)
2. Price returns to cross back over MA1 (or under for sells)
3. Position relative to MA2 confirms trend direction
4. Number of re-entries hasn't exceeded maximum allowed
Visual Components
• MA1: Blue line (width: 2)
• MA2: Red line (width: 2)
• Background Colors:
o Green (60% opacity): Bullish conditions
o Red (60% opacity): Bearish conditions
• Signal Markers:
o Initial Buy/Sell: Up/Down arrows with "BUY"/"SELL" labels
o Re-entry Buy/Sell: Up/Down arrows with "RE-BUY"/"RE-SELL" labels
Alert System
Generates alerts for:
• Initial buy/sell signals
• Re-entry opportunities
• Alerts include ticker and timeframe information
• Configured for once-per-bar-close frequency
Usage Tips
1. Moving Average Selection
o Shorter periods (MA1) capture faster moves
o Longer periods (MA2) identify overall trend
o EMA responds faster to price changes than SMA
2. Re-entry System
o Best used in strong trending markets
o Limit maximum re-entries based on market volatility
o Monitor price action around MA1 for potential re-entry points
3. Risk Management
o Use additional confirmation indicators
o Set appropriate stop-loss levels
o Consider market conditions when using re-entry signals
Code Structure
The script follows a modular design with distinct sections:
1. Input parameter definitions
2. Helper functions for price and MA calculations
3. Main signal generation logic
4. Visual elements and plotting
5. Alert system implementation
This organization makes the code maintainable and easy to modify for custom needs.

Price Action Dynamics Oscillator (PADO)1 minute ago
Price Action Dynamics Oscillator (PADO)
Indicator Overview and Technical Deep Dive
Concept and Philosophy
The Price Action Dynamics Oscillator (PADO) is a sophisticated technical analysis tool designed to provide multi-dimensional insights into market behavior by decomposing price action into manipulation and distribution metrics. The indicator goes beyond traditional momentum or trend indicators by introducing a nuanced approach to understanding market microstructure.
Key Architectural Components
1. Timeframe and Depth Selection
Pivot Depth Options:
Short Term (Length: 12 periods)
Intermediate Term (Length: 20 periods)
Long Term (Length: 100 periods)
This flexible configuration allows traders to adapt the indicator's sensitivity to different market conditions and trading styles.
2. Core Calculation Methodology
Manipulation Metrics
Calculates manipulation differently for green (bullish) and red (bearish) candles
Normalized against Average True Range (ATR) for consistent comparison across different volatility environments
Green Candle Manipulation: (Open - Low) / ATR
Red Candle Manipulation: (High - Open) / ATR
Distribution Metrics
Measures the directional strength and potential momentum shift
Green Candle Distribution: (Close - Open)
Red Candle Distribution: (Open - Close)
3. Normalization and Smoothing
Uses Simple Moving Average (SMA) for smoothing
Dynamic length calculation based on price range distance
Ensures minimum SMA length of 2 to prevent calculation errors
Unique Features
Visualization Toggles
Traders can selectively display:
Manipulation data
Distribution data
Long-term reference lines
Valuation metrics
Strategy signals
Valuation Comparative Analysis
Compares current manipulation and distribution metrics to 1000-bar long-term averages
Color-coded visualization for quick interpretation
Blue: Manipulation above average
Purple: Manipulation below average
Orange: Distribution above average
Yellow: Distribution below average
Strategy Deployment
Generates a composite strategy signal by comparing manipulation and distribution valuations
Uses Exponential Moving Average (EMA) for smoother signal generation
Incorporates volatility bands for context-aware signal interpretation
Quadrant Analysis
Classifies market state into four quadrants based on manipulation and distribution valuations:
Q1: Low Manipulation, High Distribution
Q2: High Manipulation, High Distribution
Q3: Low Manipulation, Low Distribution
Q4: High Manipulation, Low Distribution
Each quadrant is color-coded to provide visual market state representation.
Warning Signals
Manipulation Warning: When strategy crosses below low volatility band
Distribution Warning: When strategy crosses above high volatility band
Visual Indicators
Bar coloration based on strategy momentum
Multiple color states representing different market dynamics
Recommended Use Cases
Intraday and swing trading
Multi-timeframe market analysis
Volatility and momentum assessment
Trend reversal and continuation identification
Potential Limitations
Complexity might require significant trader education
Performance can vary across different market conditions
Requires careful parameter optimization
Recommended Settings
Best used on liquid markets with clear price action
Ideal for:
Forex
Futures
Large-cap stocks
Cryptocurrency pairs
Customization and Optimization
Traders should:
Backtest across multiple assets
Adjust timeframe settings
Calibrate visualization toggles
Use in conjunction with other technical indicators
Licensing
Mozilla Public License 2.0
Open-source and modification-friendly
Conclusion
The PADO represents an advanced approach to market analysis, blending traditional technical analysis with innovative metrics for deeper market understanding.
PADO Quadrant Color Analysis: Deep Dive
Quadrant Color Scheme Breakdown
Quadrant 1: Lime Green Background (RGB: 0, 255, 21, 90)
Condition: val_manip < 1 AND val_distr > 1
Market Interpretation:
Low Manipulation Pressure
High Distribution Activity
Potential Scenario:
Smart money might be gradually distributing positions
Trading Implications:
Caution for current trend followers
Potential preparation for trend change
Increased probability of consolidation or reversal
Quadrant 2: Bright Blue Background (RGB: 0, 191, 255, 90)
Condition: val_manip > 1 AND val_distr > 1
Market Interpretation:
High Manipulation Pressure
High Distribution Activity
Potential Scenario:
Strong institutional involvement
Potential market transition phase
Significant volume and momentum
Trading Implications:
High volatility expected
Increased market uncertainty
Potential for sharp price movements
Requires careful risk management
Quadrant 3: Light Gray Background (RGB: 252, 252, 252, 90)
Condition: val_manip < 1 AND val_distr < 1
Market Interpretation:
Low Manipulation Pressure
Low Distribution Activity
Potential Scenario:
Market consolidation
Reduced institutional activity
Potential low-volatility period
Trading Implications:
Range-bound market
Reduced trading opportunities
Potential setup for future breakout
Ideal for mean reversion strategies
Quadrant 4: Light Yellow Background (Hex: #f6ff0019)
Condition: val_manip > 1 AND val_distr < 1
Market Interpretation:
High Manipulation Pressure
Low Distribution Activity
Potential Scenario:
Accumulation of positions
Trading Implications:
Increased probability of directional move soon
Color Psychology and Technical Significance
Color Selection Rationale
Lime Green (Q1): Represents potential growth and transition
Bright Blue (Q2): Signifies high energy and institutional activity
Light Gray (Q3): Indicates neutrality and consolidation
Transparent Green (Q4): Suggests emerging trend potential
Advanced Interpretation Guidelines
Color Transition Analysis
Observe how the quadrant colors change
Rapid color shifts might indicate:
Market regime changes
Shifts in institutional sentiment
Potential trend acceleration or reversal
Technical Implementation Notes
Calculation Snippet
pinescriptCopyq1 = (val_manip < 1) and (val_distr > 1)
q2 = (val_manip > 1) and (val_distr > 1)
q3 = (val_manip < 1) and (val_distr < 1)
q4 = (val_manip > 1) and (val_distr < 1)
bgcolor(q1 ? color.rgb(0, 255, 21, 90):
q2 ? color.rgb(0, 191, 255, 90):
q3 ? color.rgb(252, 252, 252, 90):
q4 ? #f6ff0019:na)
Alpha Channel (Transparency)
90 and 0x19 values ensure background color doesn't overwhelm chart
Allows underlying price action to remain visible
Subtle visual cue without significant chart obstruction
Practical Trading Recommendations
Never Trade Solely on Quadrant Colors
Use as a complementary analysis tool
Combine with other technical and fundamental indicators
Timeframe Considerations
Validate quadrant signals across multiple timeframes
Longer timeframes provide more reliable signals
Risk Management
Set appropriate stop-loss levels
Use position sizing strategies
Be prepared for false signals
Recommended Workflow
Identify current quadrant
Assess overall market context
Confirm with other indicators
Execute with proper risk management

Universal Estimated Funding RateDescription:
This indicator calculates an estimated funding rate for perpetual futures contracts on Binance. The funding rate is derived from the premium index, reflecting the difference between the perpetual futures price and the spot market price, with an assumed constant interest rate.
Key Features:
Dynamic Symbol Detection: Automatically adapts to the base and quote currencies of the current chart, making it compatible with most Binance trading pairs that support both spot and perpetual markets.
Customizable Timeframes: Supports multiple timeframes, with a default recommendation of 4 hours to align with Binance's funding intervals.
Real-Time Data: Fetches live spot and perpetual prices to calculate the premium index and estimate funding rates in real time.
Error Handling: Displays alerts and highlights invalid data if the pair lacks spot or perpetual market information, ensuring clarity for the user.
Use Case:
This indicator is designed to help traders:
Track market sentiment through funding rates.
Identify opportunities for arbitrage or hedging between spot and perpetual markets.
Monitor trends in funding rates to complement technical analysis and refine entry/exit decisions.
How It Works:
The script dynamically identifies the spot and perpetual futures symbols for the selected chart.
It calculates the premium index as the percentage difference between the perpetual and spot prices.
Combines the premium index with an assumed interest rate (default: 0.01% per 8 hours) to estimate the funding rate.
How to Use:
Apply the indicator to any Binance trading pair chart.
Set the timeframe to align with your trading strategy (e.g., 4-hour for swing trading or 5-minute for scalping).
Observe the plotted funding rate to assess market sentiment:
Positive values indicate a long bias (longs pay shorts).
Negative values indicate a short bias (shorts pay longs).
Important Notes:
This is an estimated funding rate based on available data. For exact values, refer to Binance directly.
Funding rates are updated every 8 hours on Binance, so aligning with 4-hour charts is optimal.
Ensure both spot and perpetual data are available for the chosen pair.
This indicator is open-source and serves as a valuable tool for traders seeking deeper insights into funding dynamics on Binance. Happy trading! 🚀

ICT Macro Sessions by @zeusbottradingICT Macro Sessions Indicator
The ICT Macro Sessions Indicator is a powerful tool designed for traders who follow the ICT (Inner Circle Trader) methodology and want to optimize their trading during specific high-probability time intervals. This indicator highlights all the key macro sessions throughout the trading day in the GMT+8 (Hong Kong) time zone.
What Does the Indicator Do?
This indicator visually marks ICT Macro Sessions on your trading chart using background colors and optional labels. Each session corresponds to specific time intervals when institutional activity is most likely to drive price action. By focusing on these periods, traders can align their strategies with market volatility and liquidity, increasing their chances of success.
Highlighted Sessions
The indicator covers all major ICT Macro Sessions, each with a unique color for easy identification:
London Macro 1 (15:33–16:00 GMT+8):
- Marks the early London session, often characterized by strong directional moves.
London Macro 2 (17:03–17:30 GMT+8):
- Captures the mid-London session, where price frequently reacts to liquidity levels.
New York AM Macro 1 (22:50–23:10 GMT+8):
- Highlights the start of the New York session, a prime time for price reversals or continuations.
New York AM Macro 2 (23:50–00:10 GMT+8):
- Focuses on late-morning New York activity, often aligning with key news releases.
New York Lunch Macro (00:50–01:10 GMT+8):
- Covers the lunch period in New York, where price may consolidate or set up for afternoon moves.
New York PM Macro 1 (02:10–02:40 GMT+8):
- Tracks post-lunch activity in New York, often featuring renewed volatility.
New York PM Macro 2 (04:15–04:45 GMT+8):
- Captures late-session moves as institutional traders finalize their positions.
Features of the Indicator
Fixed Time: The indicator is pre-configured for GMT+8 but it will adapt automatically to your timezone. No need to change anything in the code.
Background Highlighting: Each session is visually marked with a unique background color for quick recognition.
Optional Labels: Traders can enable or disable labels for each session, providing flexibility in how information is displayed.
Session Toggles: You can choose which sessions to display based on your trading preferences and strategy.
Intraday Timeframes: The indicator is optimized for intraday charts with timeframes of 45 minutes or less. You can change it to anything you like.
Why Use This Indicator?
The ICT Macro Sessions Indicator helps traders focus on the most critical times of the trading day when institutional activity is at its peak. These periods often coincide with significant price movements, making them ideal for scalping, day trading, or even swing trading setups. By visually highlighting these sessions, the indicator eliminates guesswork and allows traders to plan their trades with precision.

MegaGas Bollinger Bands with Divergence and Circle SignalsIndicator: MegaGas Bollinger Bands with Divergence and Circle Signals
This script provides a powerful combination of Bollinger Bands, RSI Divergence detection, and signal visualization tools. Designed with flexibility and precision in mind, it aims to assist traders in identifying trend reversals, volatility zones, and divergence-based trading opportunities. The script is well-suited for swing trading, momentum trading, and even scalping when adapted to lower timeframes.
How It Works:
Bollinger Bands:
Bollinger Bands are used to detect price volatility and overbought/oversold conditions. The script calculates:
Basis Line: A 34-period Simple Moving Average (SMA) as the core trend line.
Upper Bands: Bands positioned 1x and 2x the standard deviation above the SMA.
Lower Bands: Bands positioned 1x and 2x the standard deviation below the SMA. These levels provide dynamic support and resistance zones, highlighting breakout and reversion opportunities.
RSI Divergence Detection:
The indicator detects bullish divergence (when RSI forms a higher low while price forms a lower low) and bearish divergence (when RSI forms a lower high while price forms a higher high). These divergences often precede significant reversals or momentum shifts.
Bullish divergence is displayed with blue triangles (up).
Bearish divergence is displayed with orange triangles (down).
Buy and Sell Signals:
Circle Signals are generated when price crosses key Bollinger Bands levels:
A green circle appears when the price crosses above the lower band (potential buy signal).
A red circle appears when the price crosses below the upper band (potential sell signal).
These signals help identify potential entry and exit points for trades, particularly in trend-following or mean-reversion strategies.
Trend Reference (Moving Average):
A 50-period Simple Moving Average (SMA) is included as a trend reference, helping traders gauge the overall market direction. Use this to confirm divergence signals and avoid trades against the prevailing trend.
Why This Indicator Is Unique:
This script integrates multiple tools in a meaningful way, emphasizing contextual trading signals. Unlike standalone Bollinger Bands or RSI indicators, it introduces:
Advanced Divergence Analysis: Enhancing traditional RSI with divergence-based alerts.
Dynamic Signal Filtering: Preventing repetitive signals by introducing state-based logic for circles and divergence signals.
Trend Alignment: Combining Bollinger Bands with an SMA to filter trades based on the prevailing trend.
How to Use:
Setup:
Apply the indicator to any chart and timeframe. For swing trading, higher timeframes like 4H or 1D are recommended.
Adjust the RSI, Bollinger Bands, and Moving Average lengths to match your strategy and asset.
Signals:
Look for divergence signals (triangles) as early warnings of trend reversals. Confirm these with price action or other tools.
Use circle signals (green/red) to time potential entries/exits around Bollinger Band extremes.
Confirmation:
Combine divergence and circle signals with the SMA line to avoid counter-trend trades. For example, take bullish signals when the price is above the SMA and bearish signals when it is below.
Chart Clarity:
The script is published with a clean chart for clarity. It visualizes all signals with distinct shapes (triangles and circles) and colors, ensuring they are easily recognizable. Bollinger Bands and the SMA are plotted with transparency to avoid clutter.
Originality:
This script is a thoughtful blend of Bollinger Bands and RSI divergence detection, carefully designed to provide traders with actionable insights. It introduces state-based logic to manage repetitive signals and seamlessly integrates trend filtering, making it a valuable tool for both novice and experienced traders.
