Psychological LevelsADVANCED PSYCHOLOGICAL LEVELS - PROFESSIONAL FOREX INDICATOR
This highly customizable indicator automatically identifies and visualizes all major psychological price levels across any Forex chart. Psychological levels represent critical price zones where traders naturally congregate their orders due to human psychology's attraction to round numbers. These levels consistently act as powerful support and resistance zones in the market.
🎯 KEY FEATURES:
✅ Four Distinct Level Types - Choose from 1000-pip, 100-pip, 50-pip, 25-pip, and 10-pip psychological levels
✅ Individual Color Customization - Each level type has its own customizable zone and line colors
✅ Separate Zone Width Control - Adjust zone width independently for each level type
✅ Universal Forex Compatibility - Automatically adapts to JPY pairs and all other currency pairs
✅ Extended Coverage - Displays levels far beyond the visible chart area for comprehensive analysis
✅ Fixed Positioning - Levels remain stationary when scrolling or zooming
✅ Fully Customizable Styling - Choose between solid, dashed, or dotted line styles
📊 LEVEL TYPES EXPLAINED:
🟣 1000-pip Levels (e.g., EUR/USD: 1.0000, 2.0000 | USD/JPY: 100.00, 110.00, 120.00)
The strongest macro-level psychological barriers in the Forex market
Represent massive institutional, long-term price zones
Extremely important for position traders, swing traders, and macro analysis
Used by hedge funds, banks, and large liquidity providers for major order placement
Ideal for identifying long-term support/resistance, trend reversals, and market structure shifts
Default color: Purple (highest, macro-level importance)
🔴 100-pip Levels (e.g., EUR/USD: 1.1000, 1.1100, 1.1200 | USD/JPY: 150.00, 151.00, 152.00)
The most significant psychological barriers in Forex trading
Major round numbers where institutional traders place large orders
Strongest support and resistance zones with highest reaction probability
Essential for swing trading and position trading strategies
Default color: Red (highest importance)
🟠 50-pip Levels (e.g., EUR/USD: 1.1050, 1.1150, 1.1250 | USD/JPY: 150.50, 151.50, 152.50)
Secondary psychological levels positioned midway between 100-pip levels
Important intermediate zones for profit-taking and order clustering
Highly effective for day trading strategies
Reliable targets for partial profit exits
Default color: Orange (medium-high importance)
🔵 25-pip Levels (e.g., EUR/USD: 1.1025, 1.1075, 1.1125 | USD/JPY: 150.25, 150.75, 151.25)
Quartile levels providing granular market structure
Perfect for scalping and short-term trading approaches
Excellent confluence zones with technical indicators
Ideal for tight stop-loss placement
Default color: Blue (medium importance)
🟢 10-pip Levels (e.g., EUR/USD: 1.1010, 1.1020, 1.1030 | USD/JPY: 150.10, 150.20, 150.30)
Most detailed psychological levels for precision trading
Optimal for micro scalping and high-frequency strategies
Provides fine-grained market structure analysis
Useful for optimizing entry and exit timing
Default color: Green (detailed analysis)
⚙️ CUSTOMIZATION OPTIONS:
Color Settings (Individual for Each Level):
Zone Color - Customize fill color with adjustable transparency
Line Color - Set center line color independently
Default color scheme uses traffic light logic (Purple → Red → Orange → Blue → Green)
Zone Width Settings (Separate for Each Level):
1000-pip Levels: Default 15 pips (widest zones for long-term significance)
100-pip Levels: Default 8 pips (wider zones for major levels)
50-pip Levels: Default 5 pips (medium zones)
25-pip Levels: Default 3 pips (smaller zones)
10-pip Levels: Default 2 pips (narrowest zones for precision)
Display Settings:
Line Style: Choose between Solid, Dashed, or Dotted
Line Thickness: Adjustable from 1 to 5 pixels
Level Selection: Toggle each level type on/off independently
💡 TRADING APPLICATIONS:
📈 Support & Resistance Identification
Instantly recognize where price is likely to react
Identify key reversal zones before they occur
Combine with price action for high-probability setups
🎯 Optimal Entry & Exit Points
Enter trades at psychological support/resistance
Set realistic profit targets at the next psychological level
Improve win rate by trading with market psychology
🛡️ Strategic Stop-Loss Placement
Position stops just beyond psychological levels to avoid stop hunts
Reduce premature stop-outs by understanding where others place stops
Protect profits by moving stops to psychological levels
💰 Profit Target Optimization
Set take-profit orders at psychological levels where profit-taking occurs
Scale out positions at multiple psychological levels
Maximize gains by understanding where demand/supply shifts
📊 Breakout Trading
Identify when price decisively breaks through major psychological barriers
Trade momentum when psychological levels are breached
Confirm breakouts using multiple level types as confluence
⚖️ Risk Management Enhancement
Calculate better risk-reward ratios using psychological levels
Size positions based on distance to next psychological level
Improve overall trading consistency
🔬 WHY PSYCHOLOGICAL LEVELS WORK:
Psychological levels are self-fulfilling prophecies in financial markets. Because thousands of traders worldwide monitor the same round numbers, these levels naturally attract significant order flow:
Order Clustering: Pending buy/sell orders accumulate at round numbers
Profit Taking: Traders instinctively close positions at psychological levels
Stop Hunts: Market makers often push price to psychological levels to trigger stops
Institutional Activity: Banks and funds use round numbers for large order placement
Pattern Recognition: Human brains naturally gravitate toward simple, round numbers
📋 TECHNICAL SPECIFICATIONS:
✓ Pine Script Version 6 (latest)
✓ Compatible with all Forex pairs (majors, minors, exotics)
✓ Works on all timeframes (M1 to Monthly)
✓ Automatic JPY pair detection and adjustment
✓ Maximum 500 lines and 500 boxes for optimal performance
✓ Levels extend infinitely across the chart
✓ No repainting - levels are fixed once drawn
✓ Efficient calculation prevents performance issues
✓ Clean visualization without chart clutter
👥 IDEAL FOR:
Day Traders: Use 100-pip and 50-pip levels for intraday setups
Swing Traders: Focus on major 100-pip levels for multi-day positions
Scalpers: Enable 25-pip and 10-pip levels for precision entries
Position Traders: Use 100-pip levels for long-term support/resistance analysis
Beginner Traders: Learn to recognize important market structure easily
Algorithm Developers: Incorporate psychological levels into automated strategies
🚀 HOW TO USE:
Add the indicator to any Forex chart
Select which level types you want to display (100, 50, 25, 10)
Customize colors to match your chart theme
Adjust zone widths based on your trading style and timeframe
Choose line style (solid, dashed, or dotted)
Watch for price reactions at the highlighted psychological zones
Use the levels to plan entries, exits, and stop-loss placement
💎 BEST PRACTICES:
✓ Combine with candlestick patterns for confirmation signals
✓ Wait for price action confirmation before entering trades
✓ Use multiple timeframes to identify the most significant levels
✓ Disable 10-pip levels on higher timeframes to reduce visual noise
✓ Enable only 100-pip levels for clean, uncluttered analysis on Daily/Weekly charts
✓ Adjust zone widths based on pair volatility (wider for volatile pairs)
✓ Use color coding to instantly recognize level importance
⚡ PERFORMANCE OPTIMIZED:
This indicator is engineered for maximum efficiency:
Smart calculation only within visible price range
Duplicate prevention system avoids overlapping levels
Optimized loops with early break conditions
Extended coverage (500 bars) without performance degradation
Handles thousands of levels across all timeframes smoothly
🎨 VISUAL DESIGN:
The default color scheme follows intuitive importance levels:
Purple (1000-pip): Macro-level, highest significance
Red (100-pip): Highest importance - major barriers
Orange (50-pip): Medium-high importance - secondary levels
Blue (25-pip): Medium importance - tertiary levels
Green (10-pip): Detailed analysis - precision levels
This traffic-light inspired system allows instant visual recognition of level significance.
📚 EDUCATIONAL VALUE:
Beyond being a trading tool, this indicator serves as an excellent educational resource for understanding market psychology and how professional traders think. It visually demonstrates where the "crowd" is likely to place orders, helping you develop better market intuition.
🔄 CONTINUOUS UPDATES:
This indicator displays levels dynamically based on the current price range, ensuring you always see relevant psychological levels no matter where price moves on the chart.
✨ WHAT MAKES THIS INDICATOR UNIQUE:
Unlike simple horizontal line indicators, this advanced tool offers:
Individual customization for each level type (colors, widths)
Automatic currency pair detection and adjustment
Visual zones (not just lines) for better support/resistance visualization
Extended coverage ensuring levels are always visible
Professional color-coding system for instant level importance recognition
Performance-optimized for handling hundreds of levels simultaneously
⭐ PERFECT FOR ALL TRADING STYLES:
Whether you're a conservative position trader looking at weekly charts or an aggressive scalper on 1-minute timeframes, this indicator adapts to your needs. Simply enable the appropriate level types and adjust the visualization to match your strategy.
Transform your Forex trading with professional-grade psychological level analysis. Add this indicator to your chart today and start trading with the market psychology on your side!
ค้นหาในสคริปต์สำหรับ "swing trading"

Psychological levelsADVANCED PSYCHOLOGICAL LEVELS - PROFESSIONAL FOREX INDICATOR
This highly customizable indicator automatically identifies and visualizes all major psychological price levels across any Forex chart. Psychological levels represent critical price zones where traders naturally congregate their orders due to human psychology's attraction to round numbers. These levels consistently act as powerful support and resistance zones in the market.
🎯 KEY FEATURES:
✅ Four Distinct Level Types - Choose from 100-pip, 50-pip, 25-pip, and 10-pip psychological levels
✅ Individual Color Customization - Each level type has its own customizable zone and line colors
✅ Separate Zone Width Control - Adjust zone width independently for each level type
✅ Universal Forex Compatibility - Automatically adapts to JPY pairs and all other currency pairs
✅ Extended Coverage - Displays levels far beyond the visible chart area for comprehensive analysis
✅ Fixed Positioning - Levels remain stationary when scrolling or zooming
✅ Fully Customizable Styling - Choose between solid, dashed, or dotted line styles
📊 LEVEL TYPES EXPLAINED:
🔴 100-pip Levels (e.g., EUR/USD: 1.1000, 1.1100, 1.1200 | USD/JPY: 150.00, 151.00, 152.00)
The most significant psychological barriers in Forex trading
Major round numbers where institutional traders place large orders
Strongest support and resistance zones with highest reaction probability
Essential for swing trading and position trading strategies
Default color: Red (highest importance)
🟠 50-pip Levels (e.g., EUR/USD: 1.1050, 1.1150, 1.1250 | USD/JPY: 150.50, 151.50, 152.50)
Secondary psychological levels positioned midway between 100-pip levels
Important intermediate zones for profit-taking and order clustering
Highly effective for day trading strategies
Reliable targets for partial profit exits
Default color: Orange (medium-high importance)
🔵 25-pip Levels (e.g., EUR/USD: 1.1025, 1.1075, 1.1125 | USD/JPY: 150.25, 150.75, 151.25)
Quartile levels providing granular market structure
Perfect for scalping and short-term trading approaches
Excellent confluence zones with technical indicators
Ideal for tight stop-loss placement
Default color: Blue (medium importance)
🟢 10-pip Levels (e.g., EUR/USD: 1.1010, 1.1020, 1.1030 | USD/JPY: 150.10, 150.20, 150.30)
Most detailed psychological levels for precision trading
Optimal for micro scalping and high-frequency strategies
Provides fine-grained market structure analysis
Useful for optimizing entry and exit timing
Default color: Green (detailed analysis)
⚙️ CUSTOMIZATION OPTIONS:
Color Settings (Individual for Each Level):
Zone Color - Customize fill color with adjustable transparency
Line Color - Set center line color independently
Default color scheme uses traffic light logic (Red → Orange → Blue → Green)
Zone Width Settings (Separate for Each Level):
100-pip Levels: Default 10 pips (wider zones for major levels)
50-pip Levels: Default 7 pips (medium zones)
25-pip Levels: Default 5 pips (smaller zones)
10-pip Levels: Default 3 pips (narrowest zones for precision)
Display Settings:
Line Style: Choose between Solid, Dashed, or Dotted
Line Thickness: Adjustable from 1 to 5 pixels
Level Selection: Toggle each level type on/off independently
💡 TRADING APPLICATIONS:
📈 Support & Resistance Identification
Instantly recognize where price is likely to react
Identify key reversal zones before they occur
Combine with price action for high-probability setups
🎯 Optimal Entry & Exit Points
Enter trades at psychological support/resistance
Set realistic profit targets at the next psychological level
Improve win rate by trading with market psychology
🛡️ Strategic Stop-Loss Placement
Position stops just beyond psychological levels to avoid stop hunts
Reduce premature stop-outs by understanding where others place stops
Protect profits by moving stops to psychological levels
💰 Profit Target Optimization
Set take-profit orders at psychological levels where profit-taking occurs
Scale out positions at multiple psychological levels
Maximize gains by understanding where demand/supply shifts
📊 Breakout Trading
Identify when price decisively breaks through major psychological barriers
Trade momentum when psychological levels are breached
Confirm breakouts using multiple level types as confluence
⚖️ Risk Management Enhancement
Calculate better risk-reward ratios using psychological levels
Size positions based on distance to next psychological level
Improve overall trading consistency
🔬 WHY PSYCHOLOGICAL LEVELS WORK:
Psychological levels are self-fulfilling prophecies in financial markets. Because thousands of traders worldwide monitor the same round numbers, these levels naturally attract significant order flow:
Order Clustering: Pending buy/sell orders accumulate at round numbers
Profit Taking: Traders instinctively close positions at psychological levels
Stop Hunts: Market makers often push price to psychological levels to trigger stops
Institutional Activity: Banks and funds use round numbers for large order placement
Pattern Recognition: Human brains naturally gravitate toward simple, round numbers
📋 TECHNICAL SPECIFICATIONS:
✓ Pine Script Version 6 (latest)
✓ Compatible with all Forex pairs (majors, minors, exotics)
✓ Works on all timeframes (M1 to Monthly)
✓ Automatic JPY pair detection and adjustment
✓ Maximum 500 lines and 500 boxes for optimal performance
✓ Levels extend infinitely across the chart
✓ No repainting - levels are fixed once drawn
✓ Efficient calculation prevents performance issues
✓ Clean visualization without chart clutter
👥 IDEAL FOR:
Day Traders: Use 100-pip and 50-pip levels for intraday setups
Swing Traders: Focus on major 100-pip levels for multi-day positions
Scalpers: Enable 25-pip and 10-pip levels for precision entries
Position Traders: Use 100-pip levels for long-term support/resistance analysis
Beginner Traders: Learn to recognize important market structure easily
Algorithm Developers: Incorporate psychological levels into automated strategies
🚀 HOW TO USE:
Add the indicator to any Forex chart
Select which level types you want to display (100, 50, 25, 10)
Customize colors to match your chart theme
Adjust zone widths based on your trading style and timeframe
Choose line style (solid, dashed, or dotted)
Watch for price reactions at the highlighted psychological zones
Use the levels to plan entries, exits, and stop-loss placement
💎 BEST PRACTICES:
✓ Combine with candlestick patterns for confirmation signals
✓ Wait for price action confirmation before entering trades
✓ Use multiple timeframes to identify the most significant levels
✓ Disable 10-pip levels on higher timeframes to reduce visual noise
✓ Enable only 100-pip levels for clean, uncluttered analysis on Daily/Weekly charts
✓ Adjust zone widths based on pair volatility (wider for volatile pairs)
✓ Use color coding to instantly recognize level importance
⚡ PERFORMANCE OPTIMIZED:
This indicator is engineered for maximum efficiency:
Smart calculation only within visible price range
Duplicate prevention system avoids overlapping levels
Optimized loops with early break conditions
Extended coverage (500 bars) without performance degradation
Handles thousands of levels across all timeframes smoothly
🎨 VISUAL DESIGN:
The default color scheme follows intuitive importance levels:
Red (100-pip): Highest importance - major barriers
Orange (50-pip): Medium-high importance - secondary levels
Blue (25-pip): Medium importance - tertiary levels
Green (10-pip): Detailed analysis - precision levels
This traffic-light inspired system allows instant visual recognition of level significance.
📚 EDUCATIONAL VALUE:
Beyond being a trading tool, this indicator serves as an excellent educational resource for understanding market psychology and how professional traders think. It visually demonstrates where the "crowd" is likely to place orders, helping you develop better market intuition.
🔄 CONTINUOUS UPDATES:
This indicator displays levels dynamically based on the current price range, ensuring you always see relevant psychological levels no matter where price moves on the chart.
✨ WHAT MAKES THIS INDICATOR UNIQUE:
Unlike simple horizontal line indicators, this advanced tool offers:
Individual customization for each level type (colors, widths)
Automatic currency pair detection and adjustment
Visual zones (not just lines) for better support/resistance visualization
Extended coverage ensuring levels are always visible
Professional color-coding system for instant level importance recognition
Performance-optimized for handling hundreds of levels simultaneously
⭐ PERFECT FOR ALL TRADING STYLES:
Whether you're a conservative position trader looking at weekly charts or an aggressive scalper on 1-minute timeframes, this indicator adapts to your needs. Simply enable the appropriate level types and adjust the visualization to match your strategy.

Pristine Adaptive Alpha ScreenerThe Pristine Adaptive Alpha Screener allows users to screen for all of the trading signals embedded in our premium suite of TradingView tools🏆
▪ Pristine Value Areas & MGI - enables users to perform comprehensive technical analysis through the lens of the market profile in a fraction of the time!
▪ Pristine Fundamental Analysis - enables users to perform comprehensive fundamental stock analysis in a fraction of the time!
▪ Pristine Volume Analysis - organizes volume, liquidity, and share structure data, allowing users to quickly gauge the relative volume a security is trading on, and whether it is liquid enough to trade
💠 How is this Screener Original?
▪ The screener allows users to screen for breakouts, breakdowns, bullish and bearish trend reversals, and allows users to narrow a universe of stocks based purely on fundamentals, or purely on technicals. One screening tool to support an entire technofundamental workflow!
💠 Signals Overview
Each of the below signals serves one of two purposes:
1) A pivot point to be used as a long or short entry
2) A tool for narrowing a universe of stocks to a shorter list of stocks that have a higher potential for superperformance
▪ HVY(highest volume in a year) -> Featured in Pristine Volume Analysis -> Entry signal
▪ Trend Template -> Inspired by Mark Minervini's famous trend filters -> Tool for narrowing a universe of stocks to a shorter list with a higher potential for superperformance
▪ Rule of 100 -> Metrics from Pristine Fundamental Analysis -> Tool for narrowing a universe of stocks to a shorter list with a higher potential for superperformance
▪ Bullish 80% Rule -> Featured in Pristine Value Areas & MGI -> Long entry signal -> Trend Reversal
▪ Bearish 80% Rule -> Featured in Pristine Value Areas & MGI -> Short entry signal -> Trend Reversal
▪ Break Above VAH -> Featured in Pristine Value Areas & MGI -> Long entry signal -> Trend Continuation
▪ Break Below VAL -> Featured in Pristine Value Areas & MGI -> Short entry signal -> Trend Continuation
💠 Signals Decoded
▪ HVY(highest volume in a year)
Volume is an important metric to track when trading, because abnormally high volume tends to occur when a new trend is kicking off, or when an established trend is hitting a climax. Screen for HVY to quickly curate every stock that meets this condition.
▪ Trend Template
Mark Minervini's gift to the trading world. Via his book "Think and Trade Like a Stock Market Wizard". Stocks tend to make their biggest moves when they are already in uptrends, and the Minervini Trend template provides criteria to assess whether a stock is in a clearly defined uptrend. Filter for trend template stocks using our tool.
▪ Rule of 100
Pristine Capital's gift to the trading world. The rule of 100 filters for stocks that meet the following condition: YoY EPS Growth + YoY Sales Growth >= 100%. Stocks that meet this criteria tend to attract institutional investors, making them strong candidates for swing trading to the long side.
💠 Market Profile Introduction
A Market Profile is a charting technique devised by J. Peter Steidlmayer, a trader at the Chicago Board of Trade (CBOT), in the 1980's. He created it to gain a deeper understanding of market behavior and to analyze the auction process in financial markets. A market profile is used to analyze an auction using price, volume, and time to create a distribution-based view of trading activity. It organizes market data into a bell-curve-like structure, which reveals areas of value, balance, and imbalance.
💠 How is a Value Area Calculated?
A value area is a distribution of 68%-70% of the trading volume over a specific time interval, which represents one standard deviation above and below the point of control, which is the most highly traded level over that period.
The key reference points are as follows:
Value area low (VAL) - The lower boundary of a value area
Value area high (VAH) - The upper boundary of a value area
Point of Control (POC) - The price level at which the highest amount of a trading period's volume occurred
If we take the probability distribution of trading activity and flip it 90 degrees, the result is our Pristine Value Area!
Market Profile is our preferred method of technical analysis at Pristine Capital because it provides an objective and repeatable assessment of whether an asset is being accumulated or distributed by institutional investors. Market Profile levels work remarkably well for identifying areas of interest, because so many institutional trading algorithms have been programmed to use these levels since the 1980's!
The benefits of using Market Profile include better trade location, improved risk management, and enhanced market context. It helps traders differentiate between trending and consolidating markets, identify high-probability trade setups, and adjust their strategies based on whether the market is in balance (consolidation) or imbalance (trending). Unlike traditional indicators that rely on past price movements, Market Profile provides real-time insights into trader behavior, giving an edge to those who can interpret its nuances effectively.
▪ Bullish 80% Rule
If a security opens a period below the value area low , and subsequently closes above it, the bullish 80% rule triggers, turning the value area green. One can trade for a move to the top of the value area, using a close below the value area low as a potential stop!
In the below example, HOOD triggered the bullish 80% rule after it reclaimed the monthly value area!
HOOD proceeded to rally through the monthly value area and beyond in subsequent trading sessions. Finding the first stocks to trigger the bullish 80% rule after a market correction is key for spotting the next market leaders!
▪ Bearish 80% Rule
If a security opens a period above the value area high , and subsequently closes below it, the bearish 80% rule triggers, turning the value area red. One can trade for a move to the bottom of the value area, using a close above the value area high as a potential stop!
ES proceeded to follow through and test the value area low before trending below the weekly value area
▪ Break Above VAH
When a security is inside value, the auction is in balance. When it breaks above a value area, it could be entering a period of upward price discovery. One can trade these breakouts with tight risk control by setting a stop inside the value area! These breakouts can be traded on all chart timeframes depending on the style of the individual trader. Combining multiple timeframes can result in even more effective trading setups.
RBLX broke out from the monthly value area on 4/22/25👇
RBLX proceeded to rally +62.78% in 39 trading sessions following the monthly VAH breakout!
▪ Break Below VAL
When a security is inside value, the auction is in balance. When it breaks below a value area, it could be entering a period of downward price discovery. One can trade these breakdowns with tight risk control by setting a stop inside the value area! These breakouts can be traded on all chart timeframes depending on the style of the individual trader. Combining multiple timeframes can result in even more effective trading setups.
CHWY broke below the monthly value area on 7/20/23👇
CHWY proceeded to decline -53.11% in the following 64 trading sessions following the monthly VAL breakdown!
💠 Metric Columns
▪ %𝚫 - 1-day percent change in price
▪ YTD %𝚫 - Year-to-date percent change in price
▪ MTD %𝚫 - Month-to-date percent change in price
▪ MAx Moving average extension - ATR % multiple from the 50D SMA -Inspired by Jeff Sun
▪ 52WR - Measures where a security is trading in relation to it’s 52wk high and 52wk low. Readings near 100% indicate close proximity to a 52wk high and readings near 0% indicate close proximity to a 52wk low
▪ Avg $Vol - Average volume (50 candles) * Price
▪ Vol RR - Candle volume/ Avg candle volume
💠 Best Practices
Monday -> Friday Post-market Analysis
1) Begin with a universe of stocks. I use the following linked universe screen as a starting point: www.tradingview.com
2) Screen for the HVY signal -> Add those stocks to a separate flagged (colored) watchlist
3) Screen for the Bullish 80% Rule signal -> Add those stocks to a separate flagged (colored) watchlist
4) Screen for the Break Above VAH Signal -> Add those stocks to a separate flagged (colored) watchlist
5) Screen for the Break Below VAL Signal -> Add those stocks to a separate flagged (colored) watchlist
6) Screen for the Bearish 80% Rule Signal -> Add those stocks to a separate flagged (colored) watchlist
7) Screen for the Bearish 80% Rule Signal -> Add those stocks to a separate flagged (colored) watchlist
8) Screen for the Trend Template Signal -> Add those stocks to a separate flagged (colored) watchlist
9) Toggle through each list and analyze each stock chart using the Supercharts tool in TradingView
10)Record the number of stocks in each list as a way of analyzing market conditions
Weekend Analysis
1) Begin with a universe of stocks. I use the following linked universe screen as a starting point: www.tradingview.com
2) Screen for the Rule of 100 Signal. Use this as a starting point for deeper fundamental and/or thematic and/or technical research
3) Screen for stocks that meet specific performance thresholds, such as YTD %𝚫 > 100% etc
💠 Get Creative
▪Users have the ability to layer signals on top of each other when screening. To do so, filter for a signal, and then filter your new list by another signal! Play around with the screener, and find what works best for you!

YaS-IN Multi-Timeframe RSI AnalyzerYAS-IN MULTI-TIMEFRAME RSI ANALYZER
📊 OVERVIEW
YaS-IN (Yield and Signal Indicator) is an advanced RSI-based trading tool that analyzes multiple timeframe RSI data (14, 25, 100 periods) to identify 5 key market scenarios with confirmation from volume, MACD, and ATR indicators.
🎯 KEY FEATURES
1. MULTI-TIMEFRAME RSI ANALYSIS
RSI 14: Short-term momentum
RSI 25: Medium-term trend
RSI 100: Long-term structural trend
2. 5 MARKET SCENARIOS
Trend Start (New trend confirmation)
Trend Continuation (Healthy uptrend)
Trend End (Overbought, reversal imminent)
Dip Buy Opportunity (Oversold, bounce expected)
Structural Turn (Major trend change)
3. CONFIRMATION SYSTEM
Volume: Above/below average confirmation
MACD: Momentum and crossover confirmation
ATR: Volatility confirmation
4. VISUAL TABLE DISPLAY
Real-time color-coded table showing:
Current RSI values
Active scenarios
Confirmation status
Scenario colors
🔧 HOW IT WORKS
SCENARIO DETECTION
The indicator analyzes RSI values against predefined thresholds to identify which market scenario is currently active.
CONFIRMATION STATUS
Each scenario is validated against three confirmation indicators:
✅ CONFIRMED: 2+ indicators confirm
🔶 PARTIAL: 1 indicator confirms
⚠️ WARNING: 1 indicator contradicts
⚠️ DIVERGENT: 2+ indicators contradict
➖ NEUTRAL: No clear signal
TABLE COLORS
Green: Active bullish scenario
Blue: Active continuation scenario
Red: Active bearish scenario
Orange: Active dip buy scenario
Purple: Active structural turn
Gray: Inactive scenario
⚙️ CUSTOMIZATION OPTIONS
1. RSI PERIODS
Adjust RSI calculation periods (14, 25, 100 default)
2. CONFIRMATION INDICATORS
Toggle Volume/MACD/ATR confirmation on/off
Adjust volume threshold multiplier
Set ATR change percentage
3. TABLE SETTINGS
Position: 6 different screen positions
Size: Small/Medium/Large text
Colors: Custom text and background
Opacity: Background transparency
4. VISUAL OPTIONS
Show/hide chart label
Customize text colors
Adjust table transparency
📈 OPTIMAL TIMEFRAMES
BEST PERFORMANCE
1-Hour: Optimal balance for most traders
4-Hour: Excellent for swing trading
Daily: Good for position trading
GOOD PERFORMANCE
30-Minute: Short-term swing trading
15-Minute: Precise entry timing
Weekly: Long-term analysis
NOT RECOMMENDED
1-5 Minute: Too much noise
Monthly: Too slow for active trading
🎮 USAGE GUIDE
FOR BEGINNERS
Add indicator to 4-hour chart
Watch table for 1-2 days
Trade only "✅ CONFIRMED" scenarios
Use 1-hour chart for entry confirmation
FOR INTERMEDIATE TRADERS
Use multi-timeframe analysis:
4-hour: Main trend direction
1-hour: Confirmation signals
30-minute: Entry timing
Look for scenario consistency across timeframes
Use divergence warnings for risk management
FOR ADVANCED TRADERS
Combine with other technical analysis
Adjust parameters for specific markets
Use alerts for automated notifications
Backtest different parameter combinations
📊 INTERPRETING RESULTS
STRONG SIGNALS
Multiple "✅ CONFIRMED" scenarios
Consistent signals across timeframes
High volume + MACD confirmation
WEAK SIGNALS
"🔶 PARTIAL" or "➖ NEUTRAL" status
Contradictory indicators
Low volume during signals
WARNING SIGNALS
"⚠️ WARNING" or "⚠️ DIVERGENT" status
Indicator divergence
ATR showing low volatility during moves
🔔 ALERT SYSTEM
4 TYPES OF ALERTS
Divergence Detected: Indicators contradict scenarios
Strong Confirmation: Multiple indicators confirm
Confirmed Trend End: Trend reversal with confirmation
Confirmed Dip Buy: Oversold bounce with confirmation
💡 TRADING STRATEGIES
TREND FOLLOWING
Enter on "Trend Start ✅ CONFIRMED"
Add on "Trend Continuation ✅ CONFIRMED"
Exit on "Trend End ✅ CONFIRMED"
MEAN REVERSION
Enter on "Dip Buy ✅ CONFIRMED"
Exit on RSI returning to normal levels
Use ATR for stop loss placement
BREAKOUT TRADING
Watch for "Structural Turn ✅ CONFIRMED"
Enter on confirmation of new trend
Use volume confirmation for validity
⚠️ RISK MANAGEMENT
POSITION SIZING
"✅ CONFIRMED": Full position
"🔶 PARTIAL": Half position
"⚠️ WARNING": Quarter position or avoid
"⚠️ DIVERGENT": No position
STOP LOSS SUGGESTIONS
Based on ATR value (2x ATR recommended)
Adjust for timeframe (tighter on lower TFs)
Consider scenario type (wider for structural turns)
📚 EDUCATIONAL VALUE
LEARN MARKET CYCLES
Understand different market phases
Recognize trend transitions
Identify overbought/oversold conditions
IMPROVE TIMING
Better entry/exit points
Reduced false signals
Improved risk/reward ratios
🚀 BENEFITS
Clear Visualization: All data in one table
Multi-Indicator Confirmation: Reduces false signals
Customizable: Adapt to any trading style
Educational: Helps understand market dynamics
Versatile: Works across multiple timeframes
📝 PUBLISHING NOTES
When publishing this indicator:
Name: YaS-IN Multi-Timeframe RSI Analyzer
Category: Momentum/Volume Indicators
Access Type: Open Source
Tags: RSI, Multi-Timeframe, Volume, MACD, ATR, Scanner
Description: Include this complete documentation
Preview Images: Show table on different charts
Video Tutorial: Demonstrate multi-timeframe usage
🔄 UPDATES & SUPPORT
For updates, improvements, or support:
Check TradingView script page
Join community discussions
Share backtest results
Suggest new features
Happy Trading with YaS-IN! 🚀
This response is AI-generated, for reference only.

ZynIQ Premium/Discount Master v2 - (Lite Pack)Overview
ZynIQ Premium-Discount Master v2 (Lite) is a simplified tool designed to highlight premium/discount zones relative to short-term market structure. It helps traders see when price is stretched above or below fair value, using volatility-adjusted logic suitable for intraday and swing trading.
Key Features
• Automated premium/discount classification
• Volatility-aware thresholds for mild and strong stretch conditions
• Clear visual cues for overbought/oversold environments
• Direction-aware structure to complement trend and momentum tools
• Clean labels marking stretch transitions
• Lightweight visuals suitable for fast charting workflows
Use Cases
• Identifying premium and discount zones for entries or exits
• Assessing when price has deviated significantly from equilibrium
• Combining with breakout or VWAP tools for structured confluence
• Improving trade timing with stretch-based context
Notes
This tool provides premium/discount structure and stretch context. It is not a standalone trading system. Use it along with your own confirmation and risk management rules.

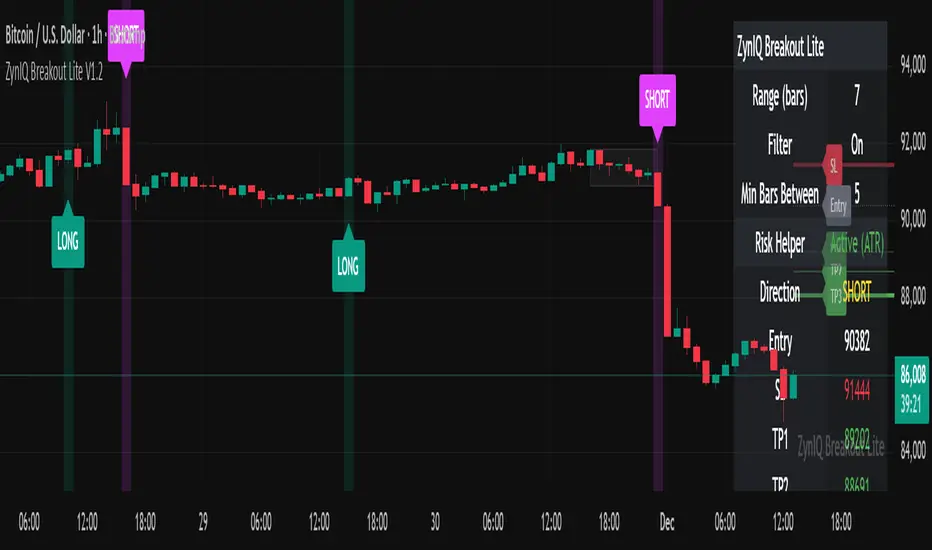
ZynIQ Breakout Lite v1.2 - (Lite Pack)Overview
ZynIQ Breakout Lite v1.2 provides a streamlined breakout framework designed to highlight expansion moves from short-term consolidation. It focuses on clarity and simplicity, making it suitable for intraday and swing trading.
Key Features
• Breakout range detection based on a configurable lookback period
• Optional minimum candle-range filter
• Simple signal spacing to reduce clustered signals
• Direction-aware breakout triggers (non-repainting)
• Optional ZynIQ Risk Helper for structured SL/TP planning
• Optional HUD panel showing current settings and breakout context
Use Cases
• Identifying range breakouts
• Highlighting directional shifts
• Quickly assessing breakout structure with lightweight visuals
Notes
This tool assists with breakout structure and risk planning. It is not a trading system by itself. Use with your preferred confirmation tools and risk management.
Equal Highs/Lows Multi-Pivot [Julio]Equal Highs/Lows Multi-Pivot
Description
A sophisticated multi-timeframe pivot analysis tool that detects and highlights equal highs and equal lows across four different pivot lengths simultaneously. This indicator identifies price levels where the market creates identical extremes, a powerful signal of institutional support/resistance and potential reversal or breakout zones.
How It Works
Four Independent Pivot Streams
Pivot 1 (Intraday - 2 bars): Ultra-fast level detection for scalpers
Pivot 2 (Session - 4 bars): Short-term swing levels
Pivot 3 (Daily - 6 bars): Medium-term structural levels
Pivot 4 (Weekly - 9 bars): Long-term institutional levels
Equal High (EQH) Detection
Compares consecutive swing highs and draws a line when two highs are nearly identical within a defined threshold. The indicator uses ATR-based confluence to determine "equality," filtering out noise while catching true market structure.
Equal Low (EQL) Detection
Same logic applied to swing lows, identifying support zones where price repeatedly fails to break below previous lows.
Key Features
Four Simultaneous Timeframes: Analyze intraday, session, daily, and weekly structures all on one chart
ATR-Based Confluence Threshold: Automatically adjusts sensitivity based on current volatility (no fake signals)
Color-Coded Levels: Each pivot length has distinct colors for instant visual identification
Highs: Red, Orange, Yellow, Fuchsia
Lows: Green, Blue, Aqua, Purple
Confirmation Mode: Optional setting to wait for full pivot confirmation before marking levels
Customizable Alert Zones: Toggle individual pivot lengths on/off to reduce clutter
Smart Label Positioning: Labels auto-center between the two equal pivots for clarity
Ideal For
Swing traders tracking support/resistance across multiple timeframes
Scalpers identifying micro-structure for quick entries and exits
Market structure analysts studying institutional price action patterns
Multi-timeframe traders needing confluence from intraday to weekly levels
Anyone trading 1-minute to 4-hour charts
Trading Applications
Identify strong support/resistance zones: Equal levels = confirmed institutional levels
Confirm trend reversals: Multiple equal lows = strong accumulation zone; multiple equal highs = distribution
Plan entries with precision: Enter near equal levels for higher probability setups
Detect liquidity concentration: Where price repeatedly tests the same level
Multi-timeframe confluence: Look for equal levels across multiple pivot lengths for ultra-strong zones
How to Use
Identify the equal levels: Color-coded lines instantly show where price creates matching extremes
Check for confluence: Strong setups occur where multiple pivot lengths align
Wait for price action: Watch for breakouts through equal levels or reversals at these zones
Enter with structure: Use equal levels as entry/exit triggers combined with your trading methodology
Manage with confidence: These levels mark institutional decision points
Customization Options
Adjust pivot lengths to match your preferred timeframe structure
Set ATR threshold sensitivity (lower = stricter equality, higher = more signals)
Toggle confirmation mode for additional filter
Enable/disable individual pivot streams to reduce visual clutter
Customize colors to match your chart theme
Default Settings Optimized For
NASDAQ futures and liquid forex pairs
Intraday and swing trading (1-minute to 4-hour charts)
Smart Money / ICT trading methodologies
Volatility-adjusted confluence detection

Asia & London Session Boxes (NY Time) + 4H SwingsAsia & London Session Boxes + 4H Swings
Description
A multi-timeframe session analysis tool designed for forex and futures traders operating on NY time. This indicator visualizes major trading sessions with automatic high/low range boxes while simultaneously tracking 4-hour swing levels, giving you a complete picture of institutional trading activity and key price levels.
How It Works
Session Boxes (NY Time Zone)
Asia Session (20:00 – 00:00 NY): Blue-shaded box marking the complete range from open to close
London Session (02:00 – 06:00 NY): Yellow-shaded box capturing the high-volatility London open
Each session box automatically records the highest high and lowest low during that timeframe, providing instant reference for session extremes and potential supply/demand zones.
4-Hour Swing Levels
Detects swing highs and lows on a 30-minute timeframe for ultra-responsive level identification
Red lines: Swing highs (resistance levels)
Green lines: Swing lows (support levels)
Lines extend to the right for continuous monitoring
Auto-removes touched levels: When price breaches a swing, it automatically deletes that level to keep your chart clean and focused on active levels
Key Features
Session-Based Trading Analysis: Identify which session created important price levels and ranges
Multi-Timeframe Architecture: Analyzes 30-minute swings while tracking 4-hour patterns on your current chart
Smart Level Cleanup: Touched swings automatically remove themselves, eliminating clutter
NY Time Conversion: All times automatically adjust to your NY timezone for consistency
Institutional Perspective: View exactly where institutions are trading during major session hours
Zero Lag Detection: Real-time identification of swing extremes
Ideal For
Forex traders (especially EUR/USD, GBP/USD) targeting session breakouts
Scalpers and swing traders needing precise support/resistance levels
Market structure traders analyzing institutional price action
Session traders looking to trade Asia/London opens
1-minute to 4-hour timeframe charts
Trading Applications
Trade Asia session breakouts into London
Identify liquidity zones from previous sessions
Detect swing extremes for entry/exit planning
Confirm trend direction using multi-session structure
Find support/resistance on intraday pullbacks
Default Settings Optimized For
NASDAQ futures and forex pairs
Scalping and short-term swing trading
NY timezone trading (automatically converts UTC-4)
30-minute swing detection for precise level identification

Bottom Up - Reverso ProReverso Pro by Bottom Up - Excess is the signal. Reversion is the edge.
Reverso is a mean reverting indicator that identifies market excesses and signals reversals for highly probable retracements to an average value.
Reverso's algorithm is extremely precise because it also takes into account the historical volatility of the instrument and constantly recalibrates itself dynamically without repainting.
This tool is suitable for mean-reversion traders who want to study EMA reactions, understand market trends, and refine entry/exit strategies based on price-memory dynamics.
Why Reverso Pro is different (This isn’t just another indicator)
Zero repainting – What you see is what you get. No tricks, no redraws, ever.
Dynamically adapts to the historical volatility of the instrument — works the same on Forex, stocks, indices, or some random crypto.
Constant real-time recalibration — adjusts instantly to volatility regime changes.
Fully adjustable sensitivity — From machine-gun signals for brutal scalping to only the most extreme deviations for monster-probability swing trades.
Native multi-timeframe control — Choose the timeframe used for signal calculation (5 min, 1H, daily, or custom). Reverso bends to your style.
When a Reverso signal fires:
Price has reached a statistically extreme deviation from its historical memory.
The probability of a snapback to the mean is at its peak.
It’s time to go counter-trend with the lowest risk and the highest reward possible.
Customization Options
You can use it on any timeframe and instrument.
You can customize also the timeframe over which the signals are processed to suit very fast scalping trading or to intercept slower and longer movements for swing trading.
The sensitivity of the indicator can also be customized to emit multiple signals or identify only the most extreme levels of deviation from the mean.
Add to chart. Turn on alerts. Happy trading!
Bottom Up - The Ecosystem Designed for Traders
bottomup.finance

Simulateur Carnet d'Ordres & Liquidité [Sese] - Custom🔹 Indicator Name
Order Book & Liquidity Simulator - Custom
🔹 Concept and Functionality
This indicator is a technical analysis tool designed to visually simulate market depth (Order Book) and potential liquidity zones.
It is important to adhere to TradingView's transparency rules: This script does not access real Level 2 data (the actual exchange order book). Instead, it uses a deductive algorithm based on historical Price Action to estimate where Buy Limit (Bid) and Sell Limit (Ask) orders might be resting.
Methodology used by the script:
Pivot Detection: The indicator scans for significant Swing Highs and Swing Lows over a user-defined lookback period (Length).
Level Projection: These pivots are projected to the right as horizontal lines.
Red Lines (Ask): Represent potential resistance zones (sellers).
Blue Lines (Bid): Represent potential support zones (buyers).
Liquidity Management (Absorption): The script is dynamic. If the current price crosses a line, the indicator assumes the liquidity at that level has been consumed (orders filled). The line is then automatically deleted from the chart.
Density Profile (Right Side): Horizontal bars appear to the right of the current price. These approximate a "Time Price Opportunity" or Volume Profile, showing where the market has spent the most time recently.
🔹 User Manual (Settings)
Here is how to configure the inputs to match your trading style:
1. Detection Algorithm
Lookback Length (Candles): Determines the sensitivity of the pivots.
Low value (e.g., 10): Shows many lines (scalping/short term).
High value (e.g., 50): Shows only major structural levels (swing trading).
Volume Factor: (Technical note: In this specific code version, this variable is calculated but the lines are primarily drawn based on geometric pivots).
2. Visual Settings
Show Price Lines (Bid/Ask): Toggles the horizontal Support/Resistance lines on or off.
Show Volume Profile: Toggles the heatmap-style bars on the right side of the chart.
Extend Lines: If checked, untouched lines will extend to the right towards the current price bar.
3. Colors and Transparency Management
Customize the aesthetics to keep your chart clean:
Bid / Ask Colors: Choose your base colors (Default is Blue and Red).
Line Transparency (%): Crucial for chart visibility.
0% = Solid, bright colors.
80-90% = Very subtle, faint lines (recommended if you overlay this on other tools).
Text Size: Adjusts the size of the price labels ("BUY LIMIT" / "SELL LIMIT").
🔹 How to Read the Indicator
Rejections: Unbroken lines act as potential walls. Watch for price reaction when approaching a blue line (support) or red line (resistance).
Breakouts/Absorption: When a line disappears, it means the level has been breached. The market may then seek the next liquidity level (the next line).
Density (Right-side boxes): More opaque/visible boxes indicate a price zone "accepted" by the market (consolidation). Empty gaps suggest an imbalance where price might move through quickly.
⚠️ Disclaimer
This script is for educational and technical analysis purposes only. It is a simulation based on price history, not real-time order book data. Past performance is not indicative of future results. Trading involves risk.

BPR [Gold Group]✨ BPR Indicator – Gold Group
The BPR (Breakout–Pullback–Reversal) Indicator by Gold Group is a premium, research-based market tool designed to help traders identify high-probability trading opportunities with precision. Built on advanced price-action logic and institutional behavior analysis, this indicator highlights key market zones where smart-money activity is most likely to occur—allowing traders to enter the market with confidence and clarity.
🔍 What the BPR Indicator Does
Detects Breakout Zones where liquidity is taken and momentum shifts begin.
Marks Pullback Levels where the market retests institutional footprints.
Identifies Reversal Points with high accuracy for powerful entries.
Filters out market noise, showing only meaningful structure changes.
Works on all timeframes and all major assets such as Gold, Forex, NAS100, US30, Crypto.
🔥 Why This Indicator Is Important
Helps traders understand institutional price movement, not retail traps.
Reduces emotional decision-making by giving crystal-clear levels.
Increases trade accuracy by aligning entries with market structure shifts.
Saves time by automatically plotting areas where smart money reacts.
🎯 Why You Should Use It
Perfect for both beginners and professionals.
Suitable for scalping, intraday, and swing trading.
Developed and tested by Gold Group Research Team with proven performance.
Allows traders to stay ahead of manipulative moves and avoid fake breakouts

VCP Base Detector
📊 VCP BASE DETECTOR - AUTO-DETECT CONSOLIDATION ZONES
🎯 WHAT IS THIS INDICATOR?
This indicator automatically detects and marks ALL consolidation bases (VCP bases) on your chart. It:
✅ Auto-detects when price enters consolidation
✅ Measures base tightness (volatility contraction)
✅ Tracks base duration (how long consolidating)
✅ Rates base quality (1-5 stars)
✅ Shows volume drying confirmation
✅ Detects base breakouts
✅ Shows progression of multiple bases (VCP pattern)
Use this WITH the "Mark Minervini SEPA Balanced" indicator for complete trading setups!
✅ Mark Minervini SEPA Balanced = Trend + RS + Stage
✅ VCP Base Detector = Base Quality + Progression
Combined = Complete professional trading system!
🎨 WHAT YOU SEE ON YOUR CHART
1️⃣ COLORED BOXES (Base Zones):
🟦 Aqua Box = ⭐⭐⭐⭐⭐ Excellent base (tightest)
🔵 Blue Box = ⭐⭐⭐⭐ Very good base
🟣 Purple Box = ⭐⭐⭐ Good base
🟠 Orange Box = ⭐⭐ Fair base
⬜ Gray Box = ⭐ Weak base
2️⃣ BASE LABELS (With Metrics):
Shows above each base:
• Duration: 20 days
• Tightness: 0.9%
• Quality: ⭐⭐⭐⭐⭐
3️⃣ BREAKOUT LABELS (When price exits base):
Green "BREAKOUT ✓" label shows:
• Price: ₹800
• Volume: 1.6x
4️⃣ DASHBOARD (Top-Left Panel):
Real-time base metrics showing:
• In Base: YES/NO
• Tightness: 0.8%
• Duration: 22 days
• Range: 3.5%
• Volume: Drying/Normal
• Quality: ⭐⭐⭐⭐
📊 UNDERSTANDING BASE QUALITY (⭐ Rating System)
⭐⭐⭐⭐⭐ (EXCELLENT)
├─ Tightness: < 0.8% ATR
├─ Duration: 15-40 days
├─ Volume: Significantly drying
├─ Price Range: < 5%
└─ Result: Most explosive breakouts (best quality)
⭐⭐⭐⭐ (VERY GOOD)
├─ Tightness: 0.8-1.0% ATR
├─ Duration: 15-35 days
├─ Volume: Very dry
├─ Price Range: < 7%
└─ Result: High probability breakouts
⭐⭐⭐ (GOOD)
├─ Tightness: 1.0-1.3% ATR
├─ Duration: 15-30 days
├─ Volume: Drying
├─ Price Range: < 8%
└─ Result: Decent breakout probability
⭐⭐ (FAIR)
├─ Tightness: 1.3-1.5% ATR
├─ Duration: 15-25 days
├─ Volume: Moderate drying
├─ Price Range: < 10%
└─ Result: Lower quality, riskier
⭐ (WEAK)
├─ Tightness: > 1.5% ATR
├─ Duration: Varies
├─ Volume: Not drying enough
├─ Price Range: > 10%
└─ Result: Low quality, skip these
📈 HOW TO USE - STEP BY STEP
STEP 1: ADD INDICATOR TO CHART
────────────────────────────────
1. Open any stock chart (use 1D timeframe for swing trading)
2. Click "Indicators"
3. Search "VCP Base Detector"
4. Click to add to chart
5. Wait a moment for boxes to appear
STEP 2: SCAN FOR BASES
───────────────────────
Look for:
✓ Colored boxes appearing on chart (bases forming)
✓ Dashboard showing "In Base: YES"
✓ Tightness below 1.5%
✓ Volume Dry: YES
STEP 3: MONITOR BASE QUALITY
──────────────────────────────
Dashboard shows stars:
⭐⭐⭐⭐⭐ = Wait for breakout (best setup)
⭐⭐⭐⭐ = Good quality, watch for breakout
⭐⭐⭐ = Decent, but not ideal
⭐⭐ or ⭐ = Skip (lower probability)
STEP 4: WAIT FOR BREAKOUT
──────────────────────────
When price breaks above the box:
✓ Green "BREAKOUT ✓" label appears
✓ Shows breakout price and volume
✓ If volume shows 1.3x+, breakout is confirmed
✓ This is your entry signal!
STEP 5: CHECK MINERVINI CRITERIA (Use Both Indicators)
───────────────────────────────────────────────────────
Before entering:
✓ VCP Base Detector shows ⭐⭐⭐⭐+ quality base
✓ Mark Minervini indicator shows BUY SIGNAL
✓ Dashboard shows 10+ criteria GREEN
✓ Stage shows S2
Result: HIGH-PROBABILITY SETUP! 🎯
📋 DASHBOARD INDICATORS - WHAT EACH MEANS
BASE METRICS SECTION:
─────────────────────
In Base = ✓ YES or ✗ NO
Show if price is currently consolidating
Tightness = 0-3% (lower = tighter = better)
< 0.8% = ⭐⭐⭐⭐⭐ (excellent)
0.8-1.0% = ⭐⭐⭐⭐ (very good)
1.0-1.3% = ⭐⭐⭐ (good)
1.3-1.5% = ⭐⭐ (fair)
> 1.5% = ⭐ (weak)
Duration = Number of days in consolidation
15 days = ⭐ (too short, weak)
20 days = ⭐⭐⭐ (ideal)
30 days = ⭐⭐⭐⭐ (very long, strong)
> 40 days = ⚠️ (too long, may break down)
Range = % movement within the base
< 5% = ⭐⭐⭐⭐⭐ (excellent, very tight)
5-8% = ⭐⭐⭐ (good)
> 10% = ⭐ (loose, not ideal)
Vol Dry = Volume status during consolidation
✓ YES = Volume contracting (good)
✗ NO = Normal/high volume (weak setup)
QUALITY SECTION:
────────────────
Stars = Overall base quality rating
⭐⭐⭐⭐⭐ = Best quality bases (most explosive)
⭐⭐⭐⭐ = Excellent quality
⭐⭐⭐ = Good quality
⭐⭐ = Fair quality
⭐ = Weak quality (skip)
52W INFO SECTION:
─────────────────
From 52W Hi = How far below 52-week high is price?
< 25% = In sweet zone ✓
> 25% = Too far from highs ✗
From 52W Lo = How far above 52-week low is price?
> 30% = In sweet zone ✓
< 30% = Too close to lows ✗
⚙️ CUSTOMIZATION GUIDE
Click ⚙️ gear icon next to indicator to adjust:
MINIMUM BASE DAYS (Default: 15)
──────────────────────────────
Current: 15 = Include shorter bases
Change to 20 = Longer bases only (higher quality)
Change to 10 = Include very short bases (more frequent)
Why: Longer bases = better breakouts, but fewer opportunities
ATR% TIGHTNESS THRESHOLD (Default: 1.5)
────────────────────────────────────────
Current: 1.5 = BALANCED for Indian stocks
Change to 1.0 = ONLY very tight bases (⭐⭐⭐⭐⭐)
Change to 2.0 = Looser bases included (more frequent)
Why: Lower = tighter bases = better quality, fewer signals
VOLUME DRYING THRESHOLD (Default: 0.7)
──────────────────────────────────────
Current: 0.7 = Volume at 70% of average (good drying)
Change to 0.6 = Stricter (more volume drying required)
Change to 0.8 = Looser (less volume drying required)
Why: Volume drying = consolidation confirmation
52W PERIOD (Default: 252)
─────────────────────────
Current: 252 = Full year lookback
Don't change unless you know what you're doing
📈 REAL TRADING EXAMPLE
SCENARIO: Trading MARUTI over 6 weeks
WEEK 1: Nothing happening
─────────────────────────
- No boxes on chart
- Dashboard: "In Base: NO"
- Action: SKIP (not consolidating)
WEEK 2: Base Starting to Form
─────────────────────────────
- Purple box appears (⭐⭐⭐ quality)
- Dashboard: "In Base: YES"
- Tightness: 1.2%
- Duration: 3 days (too new)
- Action: MONITOR (let it develop)
WEEK 3-4: Base Tightening
──────────────────────────
- Box color changes from Purple → Blue (⭐⭐⭐⭐ quality)
- Dashboard: Duration: 12 days
- Tightness: 0.9%
- Vol Dry: YES
- Action: GET READY (high-quality base forming)
WEEK 4-5: Perfect Base Formed
──────────────────────────────
- Box changes to Aqua (⭐⭐⭐⭐⭐ EXCELLENT!)
- Dashboard: Duration: 22 days ✓
- Tightness: 0.8% ✓
- Vol Dry: YES ✓
- Range: 4.2% ✓
- Action: WATCH FOR BREAKOUT
WEEK 5: BREAKOUT HAPPENS!
──────────────────────────
- Price closes above box
- Green "BREAKOUT ✓" label appears
- Shows: Price ₹850, Volume 1.6x
- Mark Minervini indicator: BUY SIGNAL ✓
- Dashboard all GREEN ✓
- Action: ENTER TRADE
Entry: ₹850
Stop: Box low (₹820)
Target: ₹980 (20% move)
RESULT: +15.3% profit in 2 weeks! ✅
💡 PRO TIPS FOR BEST RESULTS
1. COMBINE WITH MINERVINI INDICATOR
Use BOTH indicators together:
✓ VCP Detector = Base quality
✓ Minervini = Trend + RS + Volume
Result = Best high-probability setups
2. PREFER ⭐⭐⭐⭐+ QUALITY BASES
Don't trade ⭐⭐ or ⭐ quality bases
Only trade ⭐⭐⭐+ (ideally ⭐⭐⭐⭐+)
Higher quality = Higher win rate
3. WAIT FOR VOLUME CONFIRMATION
Base must show "Vol Dry: YES"
Breakout must have 1.3x+ volume
Low volume breakouts fail often
4. USE 1D TIMEFRAME ONLY
This indicator optimized for daily charts
Intraday = Too many false signals
Weekly = Misses good setups
5. MONITOR MULTIPLE BASES (VCP PATTERN)
Multiple bases getting tighter = VCP pattern
Each base should be better quality than last
Tightest base = Biggest breakout
6. COMBINE WITH 52W CONTEXT
Dashboard shows "From 52W Hi" and "From 52W Lo"
Price should be in sweet zone:
< 25% from 52W high (uptrend territory)
> 30% above 52W low (not oversold)
7. BACKTEST FIRST
Use TradingView Replay
Go back 6-12 months
See how many bases appeared
See which were profitable
❌ BASES TO SKIP (Lower Probability)
Skip if:
❌ Quality rating < ⭐⭐⭐ (only 1-2 stars)
❌ Tightness > 1.5% (too loose)
❌ Duration < 10 days (too short, weak)
❌ Duration > 50 days (too long, may break down)
❌ Vol Dry: NO (volume not contracting)
❌ Range > 10% (not tight consolidation)
❌ Price < 30% from 52W low (too weak)
❌ Price > 30% from 52W high (too far up, late entry)
⚠️ IMPORTANT DISCLAIMERS
✓ This indicator is for educational purposes only
✓ Past performance does not guarantee future results
✓ Always use proper risk management (position sizing, stop loss)
✓ Never risk more than 2% of your account on one trade
✓ Base detection is technical analysis, not investment advice
✓ Losses can occur - trade at your own risk
✓ Combine with other indicators for best results
🎓 LEARNING RESOURCES
To understand VCP bases better:
→ Study "Trade Like a Stock Market Wizard" by Mark Minervini
→ Watch: "VCP Pattern" videos on YouTube
→ Practice: Backtest on 1-2 years of historical data
→ Learn: How consolidation precedes breakouts
🚀 YOU'RE READY!
Happy trading! 📈🎯

Mark Minervini SEPA - Balanced
📊 MARK MINERVINI SEPA BALANCED - COMPLETE USER GUIDE
🚀 WHAT IS THIS INDICATOR?
This is a professional swing trading indicator based on Mark Minervini's famous
Trend Template strategy. It automatically identifies high-probability setups where:
✅ Long-term trend is BULLISH (confirmed by moving averages)
✅ Stock is OUTPERFORMING the market (relative strength improving)
✅ Price is CONSOLIDATING (forming a base for breakout)
✅ Volume is CONFIRMING (volume spike on breakout)
Result: CLEAR BUY SIGNALS when everything aligns! 🎯
🎨 WHAT YOU SEE ON YOUR CHART
1️⃣ FOUR MOVING AVERAGE LINES:
🟠 Orange Line (MA 20) = Short-term trend
🔵 Blue Line (MA 50) = Intermediate trend
🟢 Green Line (MA 150) = Long-term trend
🔴 Red Line (MA 200) = Very long-term trend
IDEAL: All lines stacked in order (Orange > Blue > Green > Red)
2️⃣ BACKGROUND COLOR:
🟢 GREEN background = Trend template is VALID (bullish setup ready)
🔴 RED background = Trend template is BROKEN (avoid trading)
3️⃣ DASHBOARD PANEL (Top-Right):
Real-time checklist showing:
✓ 6 core trend template rules
✓ Relative strength status
✓ VCP base quality
✓ Stage classification (S1/S2/S3/S4)
✓ Volume breakout status
4️⃣ VCP BASE BOXES (Blue Rectangles):
Shows where consolidation is happening
This is your potential entry zone
5️⃣ BUY SIGNAL LABEL (Green Text Below Candle):
Green "BUY" label appears when ALL criteria are met
This is your strongest entry signal
6️⃣ STOP LOSS LINE (Red Dashed Line):
Shows your stop loss level (base low)
📖 HOW TO USE - STEP BY STEP
STEP 1: ADD INDICATOR TO CHART
────────────────────────────────
1. Open TradingView chart
2. Click "Indicators" (top toolbar)
3. Search "Minervini SEPA Balanced"
4. Click to add to your chart
5. Use DAILY (1D) timeframe for swing trading
STEP 2: CHECK THE DASHBOARD (Top-Right Panel)
1. Look at all the checkmarks
2. Count how many are GREEN (✓)
3. Check Stage column - is it showing S2 or S1?
STEP 3: LOOK FOR SETUP PATTERNS
─────────────────────────────────
Ideal setup shows:
✓ Dashboard: 10+ criteria are GREEN
✓ Stage: S2 (green) or S1 (orange)
✓ Blue VCP box visible on chart (base forming)
✓ Moving averages aligned (50 > 150 > 200)
✓ Price above all moving averages
✓ Background is GREEN
STEP 4: WAIT FOR ENTRY SIGNAL
──────────────────────────────
Option A: BUY SIGNAL label appears
→ Green "BUY" label = ALL criteria met
→ ENTER at market price immediately
Option B: Setup looks good but no BUY label yet
→ Wait for price to break above blue VCP box
→ Volume should spike (1.3x or higher)
→ Then enter at breakout
STEP 5: PLACE YOUR TRADE
────────────────────────
📍 ENTRY: At breakout from VCP base
📍 STOP LOSS: Base low (red dashed line)
📍 TARGET: 20-30% move (typical Minervini target)
📍 HOLDING TIME: 2-4 weeks
🎯 BALANCED VERSION - WHY IT'S BETTER FOR INDIAN STOCKS
Volume Multiplier: 1.3x (NOT 1.5x)
→ Original was too strict for Indian market
→ 1.3x is realistic and catches good breakouts
→ Results: 5-10 signals per stock per year (tradeable!)
Trend Template: Core 6 rules (NOT all 8)
→ Focuses on the most important rules
→ Still maintains quality, but more flexible
→ Works better with Indian stock behavior
Stage Allowed: S1 OR S2 (NOT just S2)
→ Catches earlier moves
→ Allows you to enter sooner
→ But maintains quality with other criteria
📊 DASHBOARD INDICATORS - WHAT EACH MEANS
TREND SECTION (Core 6 Rules):
─────────────────────────────
P>200 ✓ = Price above 200-day MA (long-term uptrend)
150>200 ✓ = MA150 above MA200 (MA alignment)
200↑ ✓ = MA200 trending up (uptrend accelerating)
50>150 ✓ = MA50 above MA150 (intermediate uptrend)
50>200 ✓ = MA50 above MA200 (overall alignment)
P>50 ✓ = Price above MA50 (pullback level intact)
RS STRENGTH SECTION:
───────────────────
RS↑ ✓ = Stock outperforming NIFTY index
✗ = Stock underperforming NIFTY (avoid)
VCP BASE SECTION:
────────────────
In Base ✓ = Consolidation zone detected
✗ = No consolidation yet
Vol Dry ✓ = Volume drying up (base tightening)
✗ = Normal volume (consolidation weak)
ENTRY SECTION:
──────────────
Stage S2 = GREEN (best for swing trading)
S1 = ORANGE (acceptable, early entry)
S3 = RED (avoid - distribution phase)
S4 = RED (avoid - downtrend)
Vol Brk ✓ = Volume confirmed breakout (1.3x+ average)
✗ = Weak volume (breakout likely to fail)
❌ WHEN NOT TO TRADE
SKIP if ANY of these are true:
❌ Background is RED (trend template broken)
❌ Stage is S3 or S4 (distribution or downtrend)
❌ Vol Brk is RED (volume not confirming)
❌ RS↑ is ORANGE/RED (stock underperforming market)
❌ Blue box is NOT visible (no base forming)
❌ Base is very loose/messy (not tight enough)
❌ Moving averages are not aligned
❌ Less than 8 GREEN criteria on dashboard
⚙️ CUSTOMIZATION GUIDE
Click ⚙️ gear icon next to indicator name to adjust settings:
VOLUME MULTIPLIER (Default: 1.3)
────────────────────────────────
Current: 1.3x = BALANCED for Indian stocks ✅
Change to 1.2x = MORE signals (more false breakouts)
Change to 1.4x = FEWER signals (very selective)
Change to 1.5x = ORIGINAL (too strict, rarely triggers)
RS BENCHMARK (Default: NSE:NIFTY)
─────────────────────────────────
Current: NSE:NIFTY = Large-cap stocks
Change to NSE:NIFTY500 = Mid-cap stocks
Change to NSE:NIFTYNXT50 = Small-cap stocks
MINIMUM BASE DAYS (Default: 20)
───────────────────────────────
Current: 20 days = 4 weeks consolidation ✅
Change to 15 = Shorter bases (more frequent signals)
Change to 25 = Longer bases (higher quality)
ATR% FOR TIGHTNESS (Default: 1.5)
──────────────────────────────────
Current: 1.5% = BALANCED ✅
Change to 1.0% = ONLY very tight bases
Change to 2.0% = Loose bases accepted
📈 REAL TRADING EXAMPLE
SCENARIO: Trading RELIANCE over 4 weeks
WEEK 1: Base Starts Forming
────────────────────────────
- Price consolidating around ₹1,500
- Dashboard: 5/14 criteria green
- Action: MONITOR (not ready yet)
WEEK 2: Base Tightens
─────────────────────
- Price still ₹1,500 (no movement)
- VCP box appearing on chart
- Dashboard: 8/14 criteria green
- Vol Dry: ✓ (volume shrinking - good!)
- Action: MONITOR (almost ready)
WEEK 3: Perfect Setup Formed
──────────────────────────────
- Base still ₹1,500
- Dashboard: 12/14 criteria GREEN ✓✓✓
- Stage: S2 ✓
- Blue box tight and clean
- Action: WAIT FOR BREAKOUT
WEEK 4: Breakout Happens!
──────────────────────────
- Price closes at ₹1,550 (breakout!)
- Volume: 1.6x average (exceeds 1.3x requirement)
- Dashboard: BUY SIGNAL ✓ (all criteria met)
- Action: ENTER TRADE
Entry: ₹1,550
Stop: ₹1,480 (base low)
Target: ₹1,850 (20% move)
RESULT: +19.4% profit in 2 weeks! ✅
💡 PRO TIPS FOR BEST RESULTS
1. USE DAILY (1D) CHARTS ONLY
Weekly charts = Fewer signals, slower moves
Daily charts = Best for swing trading ✅
Intraday charts = Too many false signals
2. SCAN MULTIPLE STOCKS
Don't just watch 1 stock
Scan 50-100 stocks daily
More stocks = More opportunities
3. WAIT FOR PERFECT ALIGNMENT
Don't enter on 8/14 criteria
Wait for 12+/14 criteria
This increases win rate significantly
4. VOLUME IS CRITICAL
Always check Vol Brk column
No volume = Likely to fail
1.3x+ volume = Good breakout
5. COMBINE WITH YOUR OWN ANALYSIS
Indicator gives technical signals
You add your own fundamental view
Strong fundamental + technical = Best trade
6. BACKTEST ON HISTORICAL DATA
Use TradingView Replay feature
Go back 6-12 months
See how many signals appeared
Verify which were profitable
7. KEEP A TRADING JOURNAL
Track entry, exit, profit/loss
Note what worked and what didn't
Continuous improvement!
⚠️ IMPORTANT DISCLAIMERS
✓ This indicator is for educational purposes only
✓ Past performance does not guarantee future results
✓ Always use proper risk management (position sizing, stop loss)
✓ Never risk more than 2% of your account on one trade
✓ Backtest thoroughly before using with real money
✓ The indicator provides technical signals, not investment advice
✓ Losses can occur - trade at your own risk
🎯 QUICK START CHECKLIST
Before entering ANY trade, verify:
□ Dashboard shows mostly GREEN (10+ criteria)
□ Stage = S2 (green) or S1 (orange)
□ Blue VCP box visible on chart
□ Price just broke above the box
□ Volume is high (1.3x+ average, Vol Brk = ✓)
□ Moving averages aligned (50 > 150 > 200)
□ RS is uptrending (RS↑ = ✓)
□ BUY SIGNAL label appeared (optional but strong confirmation)
ALL CHECKED? → READY TO BUY! 🚀
📞 FOR HELP & SUPPORT
Questions about the indicator?
→ Check the dashboard - each criterion has a specific meaning
→ Review this guide - answers most common questions
→ Backtest on historical data using TradingView Replay
→ Start with paper trading (no real money) first
🎓 LEARNING RESOURCES
To understand Mark Minervini's method better:
→ Read: "Trade Like a Stock Market Wizard" by Mark Minervini
→ Watch: TradingView educational videos on trend templates
→ Practice: Backtest this indicator on 6-12 months of historical data
→ Learn: Study successful traders who use similar strategies
GOOD LUCK WITH YOUR TRADING! 🚀📈
May your trends be bullish and your breakouts be explosive! 🎯

Super-AO with Risk Management Alerts Template - 11-29-25Super-AO with Risk Management: ALERTS & AUTOMATION Edition
Signal Lynx | Free Scripts supporting Automation for the Night-Shift Nation 🌙
1. Overview
This is the Indicator / Alerts companion to the Super-AO Strategy.
While the Strategy version is built for backtesting (verifying profitability and checking historical performance), this Indicator version is built for Live Execution.
We understand the frustration of finding a great strategy, only to realize you can't easily hook it up to your trading bot. This script solves that. It contains the exact same "Super-AO" logic and "Risk Management Engine" as the strategy version, but it is optimized to send signals to automation platforms like Signal Lynx, 3Commas, or any Webhook listener.
2. Quick Action Guide (TL;DR)
Purpose: Live Signal Generation & Automation.
Workflow:
Use the Strategy Version to find profitable settings.
Copy those settings into this Indicator Version.
Set a TradingView Alert using the "Any Alert() function call" condition.
Best Timeframe: 4 Hours (H4) and above.
Compatibility: Works with any webhook-based automation service.
3. Why Two Scripts?
Pine Script operates in two distinct modes:
Strategy Mode: Calculates equity, drawdowns, and simulates orders. Great for research, but sometimes complex to automate.
Indicator Mode: Plots visual data on the chart. This is the preferred method for setting up robust alerts because it is lighter weight and plots specific values that automation services can read easily.
The Golden Rule: Always backtest on the Strategy, but trade on the Indicator. This ensures that what you see in your history matches what you execute in real-time.
4. How to Automate This Script
This script uses a "Visual Spike" method to trigger alerts. Instead of drawing equity curves, it plots numerical values at the bottom of your chart when a trade event occurs.
The Signal Map:
Blue Spike (2 / -2): Entry Signal (Long / Short).
Yellow Spike (1 / -1): Risk Management Close (Stop Loss / Trend Reversal).
Green Spikes (1, 2, 3): Take Profit Levels 1, 2, and 3.
Setup Instructions:
Add this indicator to your chart.
Open your TradingView "Alerts" tab.
Create a new Alert.
Condition: Select SAO - RM Alerts Template.
Trigger: Select Any Alert() function call.
Message: Paste your JSON webhook message (provided by your bot service).
5. The Logic Under the Hood
Just like the Strategy version, this indicator utilizes:
SuperTrend + Awesome Oscillator: High-probability swing trading logic.
Non-Repainting Engine: Calculates signals based on confirmed candle closes to ensure the alert you get matches the chart reality.
Advanced Adaptive Trailing Stop (AATS): Internally calculates volatility to determine when to send a "Close" signal.
6. About Signal Lynx
Automation for the Night-Shift Nation 🌙
We are providing this code open source to help traders bridge the gap between manual backtesting and live automation. This code has been in action since 2022.
If you are looking to automate your strategies, please take a look at Signal Lynx in your search.
License: Mozilla Public License 2.0 (Open Source). If you make beneficial modifications, please release them back to the community!

Buy Sell Signal — Ema crossover [© gyanapravah_odisha]Professional EMA Crossover + ATR Risk Control
Trade with confidence using a complete system that gives you clear entries, smart exits, and full automation.
Includes:
Precision 5/13 EMA crossover signals
ATR-based adaptive stop-loss
Multiple take-profit levels (with intermediate targets)
Fully customizable R:R ratios
ATR + volume filters to avoid choppy markets
Real-time trade dashboard
All alerts included
Built for: Crypto, Forex, Stocks • Scalping & Swing Trading
Built for you: Free, open-source & made for real-world trading.

Tomo's Pivots // last W, last M, last Q, last30d, last90d.These are pivots that you can use to look back at various time periods to find magnetic Price points of support and resistance. There are: weekly, last 30 days, last month, last 90 days, and last quarter. You can change the color and style of every indicator and its label. So if it happens to be November 29 today, you will see the last 90 days representing 90 days before November 29. But you will also see last quarter which represents from July 1 to September 30. These values are fair value equilibrium price point by averaging the high low and close of that time period. Weekly is great for intraday trading and the last 30 is great for momentum. Consider using the monthly for swing trading. Stay in the green.

DTR SL-TPDTR SL-TP is a simple risk-management indicator designed to automatically plot stop-loss and take-profit levels based on the current market price. It helps traders visualize their risk-to-reward setup directly on the chart, making trade planning faster and more consistent.
The indicator uses two main inputs: a Stop Loss Percentage and a Take Profit Multiplier. The stop loss is calculated by reducing the current price by the chosen percentage. The take profit level is set by multiplying that same percentage by the Take Profit Multiplier and adding it to the current price. This creates a dynamic stop-loss and take-profit pair that updates with every candle.
The stop-loss line is plotted in red, and the take-profit line is plotted in green for immediate visual clarity. Traders can adjust the percentage and multiplier to match their personal risk tolerance or strategy requirements.
DTR SL-TP is useful for any style of trading that requires predefined exit levels, including scalping, day trading, and swing trading. It helps maintain discipline, enforce consistent risk management, and quickly evaluate whether a potential trade offers an acceptable reward-to-risk ratio.

Bassi's Pattern Breakout IndicatorBASSI'S PATTERN BREAKOUT INDICATOR
Author: Bassi | Published 2025
One of the cleanest and most accurate classic pattern detectors on TradingView – proudly coded and shared by Bassi.
Detects & confirms breakouts from:
• Double Top / Double Bottom
• Triple Top / Triple Bottom
• Head & Shoulders
• Inverse Head & Shoulders
Key Features:
• 100% non-repainting – signals only appear after candle close
• Smart breakout confirmation using the correct neckline level
• Visual pattern drawing (tops/bottoms + necklines)
• Clear breakout labels with vertical confirmation lines
• Real-time TradingView alerts (one alert per bar close)
• All alerts include "Bassi" prefix so you know it's the original
• Dynamic coloring for Double Bottom (red in lower areas, green in higher areas)
• No messy BUY/SELL labels – clean professional look (as requested by the community)
Why traders love it:
- Extremely reliable on all timeframes (1m to monthly)
- Works perfectly on Forex, Stocks, Crypto, Indices
- No false signals during consolidation
- Perfect for swing trading, scalping and position trading
Settings:
• Pivot Left/Right Bars – adjust sensitivity
• Price Tolerance % – how flat the tops/bottoms must be
• Max Pivot Storage – memory management
• Enable/disable alerts and visual markers
How to use:
1. Add to chart
2. Create alert → select "Bassi's Pattern Breakout Indicator"
3. Choose "Once per bar close"
4. Get notified instantly on every confirmed breakout!
This is the original and only authorized version by Bassi.
If you enjoy this indicator, please leave a like and follow for future updates!
© Bassi 2025 – All rights reserved
#pattern #breakout #doubletop #doublebottom #headandshoulders #tradingview #bassi

Gap-Up Momentum Screener (S.S)
ENGLISH-VERSION
1) TradingView Gap Screener (for US stocks)
➤ Conditions
Gap-Up ≥ +3% (large gaps indicate institutional pressure)
Pre-market volume ≥ 150% of the 20-day average
RS line > 50
Price > 50 SMA
Market cap ≥ 1 billion USD
No penny stocks
2) Minervini Gap-Entry Strategy (Swing Trading)
This is a variant specifically optimized for gaps + momentum.
A) Setup Criteria
The stock must meet the following conditions:
Gap-Up ≥ +3%
First retracement ≤ 30% of the gap
High relative strength (RS line rising)
Volume on the gap day > 2× average
Price above 20 EMA, 50 SMA, 150 SMA, 200 SMA
No immediate resistance within 2–5%
B) Entry Setups
Entry 1: First Pullback Entry (FPE)
Wait for the first 1–3 day consolidation.
Entry → Breakout of the small range.
Stop → Below the low of the pullback.
Rule: No entry on the gap day itself.
Entry 2: High Tight Flag above the Gap
Stock rises > 10% after the gap
Then forms a 3–8 day sideways phase
Entry → Break above the flag’s high
Stop → Below the flag base
Entry 3: ORB Entry (Opening Range Breakout, 30 minutes)
Very effective for strong gaps.
Wait 30 minutes after the market opens
Entry → Break above the high of these first 30 minutes
Stop → Below the 30-minute low
C) Stop Levels
For FPE: 4–8%
For ORB: 1–2 × ATR(14)
For flags: 3–5%
D) Add Rules
Only if the stock continues showing strong volume:
Add on every new 3–5 day high
Add only above half-range levels
Maximum 3 adds
3) Early-Warning Module (Setup forming but not ready for entry)
This module marks stocks that are forming a setup but are not yet buyable.
➤ Criteria
Gap-Up ≥ 3%
Strong volume
Stock pulls back and consolidates (1–5 bars)
BUT no breakout yet
4) Exact Entry Checklist (Minervini-style, optimized for gaps)
Checklist before entry:
Gap ≥ +3%
20 EMA rising
Volume > 2× average
RS line rising
Price > 50 SMA
Pullback not deeper than 30% of the gap
3+ green signals from the Early-Warning diamonds
If all 7 are fulfilled → green light.
5) How to apply the strategy in daily practice
Morning (08:00–09:00)
Check the screener
Build your watchlist
Identify gaps
US Market Open (15:30)
Monitor the Early-Warning module
Sort gap momentum opportunities
16:00–17:00
Enter: First Pullback / ORB / Flag
Set stops
Determine position size based on risk
After 20:00
Check volume strength
If momentum fades → no more adds

HTF Entry Model+ [#] by @shulktradesHTF Entry Model+ by @shulktrades
Overview
The HTF Entry Model+ is a multi-timeframe trading indicator that identifies algorithmic signatures in price action and automatically displays complete entry setups with risk-to-reward projections. When specific order flow patterns are detected on a higher timeframe, the indicator calculates and displays entry zones, stop loss placement, and multiple profit targets - giving traders a complete trade plan before price reaches the entry level.
What This Indicator Does
Identifies Algorithmic Price Patterns
The indicator monitors a higher timeframe to detect specific signatures in price action that signal potential reversals or continuations. These patterns represent moments when institutional order flow creates measurable shifts in market dynamics.
Key Points:
- Analyzes higher timeframe price structure continuously
- Detects order flow signatures that precede directional moves
- Confirms patterns only when specific conditions are met
- Filters out low-quality signals automatically
Projects Complete Entry Models
When a valid pattern is detected, the indicator immediately calculates and displays a full trade setup with all necessary levels clearly marked on your chart.
What Gets Displayed:
- Entry zone (optimal price area to enter the trade)
- Stop loss level (where to exit if wrong)
- Multiple profit targets (1:1, 1:2, 1:3, 1:4, 1:5, 1:6, 1:7)
- OTE levels (Optimal Trade Entry zone & OTE + take profit model)
- Risk-reward ratios for each target
Adapts to Your Timeframe
The indicator intelligently selects an appropriate higher timeframe based on your current chart, or you can manually choose which timeframe to analyze.
Timeframe Relationships:
- 1-5 minute charts → analyzes 15-60 minute structure
- 15-30 minute charts → analyzes 4-hour structure
- 1 hour charts → analyzes daily structure
- 4 hour charts → analyzes weekly structure
- Daily charts → analyzes monthly structure
How Traders Use This Indicator
Step 1: Wait for Setup Detection
The indicator runs in the background, continuously scanning the higher timeframe for algorithmic signatures. When detected, a horizontal marker appears at the pattern formation level.
Step 2: Review the Entry Model
Once confirmed, the complete risk-reward projection displays instantly:
- All entry and exit levels are clearly labeled
- Stop loss shows exactly where the setup invalidates
- Multiple targets allow for systematic profit-taking
- Color coding shows bullish (green) or bearish (red) direction
Step 3: Plan Your Trade
Before price retraces to the entry zone, you have complete information:
- Know your exact entry price levels
- Know your exact stop loss placement
- Know multiple profit target levels
- Calculate position size based on the risk shown
Step 4: Execute When Price Returns
Wait for price to retrace back into the entry zone (OTE levels), then execute your trade with predefined parameters.
Step 5: Manage According to the Model
Use the displayed targets to manage your position:
- Scale out partial profits at each target level
- Move stops to breakeven after first or second target
- Let remaining position run toward extended targets
Key Features
Smart Pattern Recognition
- Detects specific algorithmic signatures that precede high-probability moves
- Validates patterns using proprietary order flow analysis
- Filters signals based on market structure quality
- Reduces false signals in choppy or ranging conditions
Complete Risk-Reward Framework
- Entry zones marked with "OTE" labels at optimal prices
- Stop loss clearly labeled at pattern invalidation point
- Seven profit targets (1:1 through 1:7 risk-reward)
- Additional reference levels for advanced trade management
Liquidity-Based Validation
- Monitors higher timeframe liquidity dynamics
- Identifies when stops are likely being hunted
- Confirms setups that follow liquidity sweeps
- Distinguishes high-quality from lower-quality signals
Session Time Filtering
- Optional time-based filtering for entry model display
- Set specific trading hours when setups should appear
- Useful for focusing on active market sessions
- Can be disabled for swing trading or higher timeframes
Clean Visual Presentation
- Color-coded setups (green for bullish, red for bearish)
- Clearly labeled levels (Entry, Stop Loss, OTE, 1:1, 1:2, etc.)
- Minimal chart clutter - only active setups display
- All historical setups remain visible for backtesting
Configuration Options
Higher Timeframe Settings
- Auto Mode: Automatically selects optimal higher timeframe for your chart
- Fixed Mode: Manually choose any specific timeframe to analyze
- Provides flexibility for different trading strategies and preferences
Visual Customization
- Bullish Color: Choose color for long setups (default: green)
- Bearish Color: Choose color for short setups (default: red)
- Display Length: Adjust how far forward the levels project
- Clean, professional appearance on any chart theme
Time Filter Options
- Enable/Disable Toggle: Turn session filtering on or off
- Entry Timeframe: Specify exact trading hours for setup display
- Recommended Usage: Enable for day trading, disable for swing trading
- Timezone adjustable to match your market hours
Who This Indicator Is For
Day Traders & Scalpers
- Get precise entry timing on intraday timeframes
- Clear stop placement for tight risk management
- Multiple targets for scaling out positions
- Session filtering helps focus on active market hours
Seconds Timeframe
5m Timeframe
Swing Traders
- Higher timeframe analysis for multi-day positions
- Structured entry and exit planning
- Extended targets for longer-term moves
- Can disable time filtering for 24-hour analysis
Multi-Timeframe Traders
- Aligns entries across different timeframes
- Provides higher timeframe context automatically
- Helps identify confluence between timeframes
- Works on any liquid market (stocks, futures, forex, crypto)
Systematic Traders
- Pre-defined entry and exit levels before execution
- Consistent risk-reward framework on every setup
- Historical setups remain visible for backtesting
- Removes emotional decision-making from entries
Market Compatibility
Best Performance On:
- Futures contracts (ES, NQ, YM, CL, GC, etc.)
- Major forex pairs (EUR/USD, GBP/USD, USD/JPY, etc.)
- Liquid stocks and ETFs
- Major cryptocurrency pairs
Optimal Timeframes:
- 1-minute to 1-hour: Intraday trading and scalping
- 4-hour to Daily: Swing trading and position entries
- Works on higher timeframes but signals become less frequent
Market Conditions:
- Most effective in trending or impulsive markets
- Automatically filters lower-quality ranging setups
- Adapts to different volatility environments
- Functions across all market sessions
Important Information
What This Indicator Does NOT Do
- Does not predict future price movement
- Does not guarantee profitable trades
- Does not show internal calculation methods or specific detection criteria
- Does not display the pattern scanning process (only confirmed setups)
What Traders Should Understand
- This tool identifies potential setups based on candlestick order flow analysis
- All trading involves risk - use appropriate position sizing
- Combine with your own analysis and market understanding
- Proper risk management is essential regardless of signal quality
- Past setup performance does not guarantee future results
Standard Risk Management Guidelines
Position Sizing
- Risk only 1-2% of account capital per trade
- Use the displayed stop loss distance to calculate position size
- Adjust size smaller for lower-confidence setups
- Never risk more than you can afford to lose
Stop Loss Placement
- Always honor the displayed stop loss level
- Place stops at or slightly beyond the marked level
- Do not move stops further away if trade moves against you
- Accept the loss if stop is hit and wait for next setup
Profit Taking Strategy
- Consider scaling out at multiple target levels
- Take some profit at 1:1 to reduce risk to zero
- Let remaining position run toward extended targets
- Move stops to breakeven after first target is hit
Additional Considerations
- Be aware of overall market trend direction
- Reduce position size during uncertain market conditions
- Keep detailed records of trades taken from indicator setups
Important Trading Considerations
Price Action Variability
It is important to note that market conditions vary and price does not always retrace into the displayed entry zones. In certain market environments, particularly during strong impulsive moves or high-impact news events, price may move directly toward the projected targets without providing an opportunity to enter at the optimal entry levels. Traders should be prepared to either wait for proper entry conditions or adjust their strategy accordingly based on their risk tolerance and trading plan.
Disclaimer
Educational Purpose Only
This indicator is provided solely for educational and informational purposes. It is designed to assist traders in analyzing market structure and identifying potential trading opportunities based on technical analysis principles. The indicator does not constitute financial advice, investment advice, trading advice, or any other type of professional advice.
No Guarantee of Results
Past performance of signals and setups identified by this indicator does not guarantee future results. All trading and investing involves substantial risk of loss, and you may lose some or all of your invested capital. No representation is being made that any account will or is likely to achieve profits or losses similar to those shown or discussed.
Personal Responsibility
Users of this indicator are solely responsible for their own trading decisions and any resulting outcomes. You should conduct your own research, analysis, and due diligence before making any trading or investment decisions. Always consult with a qualified financial advisor before making investment decisions if you are uncertain about your financial situation.
Risk Warning
Trading futures, forex, stocks, and cryptocurrencies carries a high level of risk and may not be suitable for all investors. The high degree of leverage can work against you as well as for you. Before deciding to trade, you should carefully consider your investment objectives, level of experience, and risk appetite. Only trade with money you can afford to lose.
No Warranty
This indicator is provided "as is" without warranty of any kind, either expressed or implied. The developer makes no guarantees about the accuracy, reliability, completeness, or timeliness of the information, signals, or projections provided by this indicator.
---
This indicator represents proprietary research into algorithmic price behavior and order flow dynamics. The methodology is protected to preserve the effectiveness of the approach and maintain the integrity of the analysis framework.

The Trade Plan 9 & 15 EMA⭐ What Are EMAs?
An Exponential Moving Average (EMA) gives more weight to recent prices, making it more responsive than a simple moving average.
9-EMA = very fast, reacts quickly to price changes
15-EMA = slightly slower, smooths short-term noise
Together they help identify momentum shifts.
📈 How the 9/15 EMA Strategy Works
1. Buy Signal (Bullish Crossover)
You enter a long (buy) trade when:
➡ 9 EMA crosses above the 15 EMA
This suggests momentum is shifting upward and a new uptrend may be forming.
2. Sell Signal (Bearish Crossover)
You enter a short (sell) trade or exit long positions when:
➡ 9 EMA crosses below the 15 EMA
This suggests momentum is turning downward.
🔧 How Traders Typically Use It
Entry
Wait for a clear crossover.
Confirm with price closing on the same side of EMAs.
Some traders add confirmation using RSI, MACD, or support/resistance.
Exit
Several options:
Exit when the opposite crossover occurs.
Exit at predetermined risk-reward levels (e.g., 1:2).
Use trailing stop below/above EMAs.
👍 Strengths
Easy to follow
Good for fast-moving markets
Works well on trending markets
Minimal indicators needed
👎 Weaknesses
Whipsaws in sideways markets
Many false signals on very low timeframes
Works best with additional filters
🕒 Common Timeframes
Scalping: 1m, 5m
Day trading: 5m, 15m
Swing trading: 1H, 4H

BaraaCoOL's Multi-Timeframe Signals**BaraaCoOL's RTD - Real-Time Direction Indicator**
© BaraaCoOL 2025 | Version 1.0
**🎯 What Does This Indicator Do?**
RTD shows you the market direction across multiple timeframes in one simple dashboard. When all timeframes align, you get clear BULLISH or BEARISH signals to help you make better trading decisions.
**📊 What You See on Your Chart:**
1. **Dashboard Table** - Shows 6 timeframes (M5, M15, M30, H1, H4, D1)
- **R Row** = Momentum strength (green = bullish, red = bearish)
- **T Row** = Trend acceleration (green = accelerating up, red = accelerating down)
- **D Row** = Direction status (▲ = up, ▼ = down, ● = neutral)
- **TREND Row** = Overall signal (BULLISH/BEARISH/NEUTRAL)
2. **Colored Zones** - Show you where price is relative to trend
- Green zones = Price above trend (bullish area)
- Red zones = Price below trend (bearish area)
3. **Trend Line** - Main reference line
- Cyan color = Price is above (bullish)
- Pink color = Price is below (bearish)
4. **Signal Arrows** (optional)
- ▲ Green arrow = Potential buy signal
- ▼ Red arrow = Potential sell signal
**🔔 How to Get Alerts:**
**Quick Setup (Single Symbol):**
1. Add the indicator to your chart
2. Click the Alert button (⏰) at the top
3. Select "BaraaCoOL's RTD" → "Dashboard BULLISH/BEARISH"
4. Click Create
**For Multiple Symbols:**
1. Make a watchlist with symbols you want to monitor
2. Click Alert button (⏰)
3. In "Symbol" dropdown → Choose your watchlist
4. In "Condition" → Select "BaraaCoOL's RTD" → "Dashboard BULLISH/BEARISH"
5. Click Create
You'll get notified whenever ANY symbol in your watchlist turns BULLISH or BEARISH!
**💡 How to Trade With It:**
**Simple Strategy:**
- Dashboard shows **BULLISH** → Look for BUY opportunities
- Dashboard shows **BEARISH** → Look for SELL opportunities
- Dashboard shows **NEUTRAL** → Stay out or wait for confirmation
**Best Results:**
- Wait for the TREND row to show BULLISH or BEARISH
- This happens when M5, M15, and M30 all align in the same direction
- The stronger the alignment, the better the signal
**⚙️ Settings You Can Change:**
- **Dashboard Position** - Move it to any corner of your chart
- **Dashboard Size** - Compact (phone), Normal (desktop), Large (tablet)
- **Show/Hide Elements** - Turn on/off zones, trend line, or arrows
- **Colors** - Customize all colors to match your style
- **Sensitivity** - Adjust how fast the indicator responds to price changes
**✅ Works On:**
- All markets (Forex, Crypto, Stocks, Indices, Commodities)
- All timeframes (1-minute to Monthly)
- All trading styles (Scalping, Day Trading, Swing Trading)
**⚠️ Important:**
- Use proper risk management
- Don't risk more than you can afford to lose
- This indicator is a tool to help analysis, not a guarantee of profits
- Combine with your own analysis and strategy
**Need Help?** Send me a message on TradingView!

EMAs Bullish/Bearish Confluence [Trend Bias]EMA Confluence Zones
This indicator is designed to simplify trend identification by visually highlighting "Confluence Zones" —areas where short-term, medium-term, and long-term momentum are fully aligned.
While traders can manually add three Moving Averages to a chart, identifying the exact moment all three align (the "Perfect Stack") can be visually difficult during live trading. This script automates that process, converting complex line crosses into simple background color zones and providing actionable alerts for the exact moment a trend alignment begins.
🛠 How It Works
The script utilizes three customizable Exponential Moving Averages (EMAs) to detect the market bias:
Short EMA: Represents immediate price action/momentum.
Medium EMA: Represents the intermediate trend.
Long EMA: Represents the major trend baseline.
Calculations & Logic
The indicator checks for a specific hierarchical alignment (Stacking) of these averages:
1. 🟢 Bullish Confluence (Buy Zone):** Returns true when `Short > Medium` AND `Medium >Long`. This confirms that momentum is rising across all three monitored timeframes.
2. 🔴 Bearish Confluence (Sell Zone):** Returns true when `Short < Medium` AND `Medium < Long`. This confirms that momentum is falling across all three monitored timeframes.
3. ⚪ Neutral (No Color): Any other state indicates a choppy or consolidating market where the EMAs are intertwined.
---
🚀 Key Features
*Visual Bias Confirmation: The background highlights Green (Bullish) or Red (Bearish) only when the "Perfect Stack" conditions are met.
Trend Start Alerts: Unlike standard EMA cross alerts, this script includes custom alert conditions that trigger only on the first bar where the confluence becomes valid. This prevents spam alerts during a prolonged trend.
Full Customization: Users can adjust the lengths of all three EMAs to fit specific strategies (e.g., Scalping vs. Swing Trading).
Clean Chart Mode: Includes options to hide the EMA lines entirely and rely solely on the background color for a minimalist "Naked Trading" setup.
🎯 How to Use
1. Trend Filter: Use the background color to determine your directional bias. If the background is Green, look only for Long setups on lower timeframes. If Red, look only for Short setups.
2. Breakout Confirmation: If price breaks a key level, wait for the background color to flip. This confirms that the Moving Averages have caught up to the move, validating the breakout strength.
3. Exit Signal: If you are in a trend trade and the background color disappears (turns transparent), it indicates the trend momentum is fading and the EMAs are beginning to cross/compress.
⚙️ Settings
EMA Lengths: Default is 20, 50, 100. These can be changed to common combinations like (9, 21, 55) or (50, 100, 200).
Visuals: Toggle lines or background colors on/off and adjust transparency to keep your chart readable.
---
Disclaimer: This script is for informational purposes only. Past performance of a trend following method does not guarantee future results. Always use proper risk management.
