Sweep2Trade Pro [CHE]Sweep2Trade Pro \ — Liquidity Sweep → Trend → Confirmation
Sweep2Trade Pro \ helps you catch high-probability reversals or continuations that start with a liquidity sweep, align with the T3 trend, and finalize with a structure confirmation (BOS). It’s designed to reduce noise, time your entries, and keep you out of weak, chop-driven signals.
What’s a “sweep”?
A liquidity sweep happens when price briefly breaks a prior swing high/low (where many stops sit), triggers those stops, and then snaps back. This “stop-hunt” creates liquidity for bigger players and often precedes a sharp move in the opposite direction if the break fails, or fuels continuation if structure actually shifts.
What’s a BOS (Break of Structure)?
A BOS is a price action event where the market takes out a recent swing level in the trend’s direction, signaling continuation and confirming that structure has shifted (bullish BOS through a recent swing high, bearish BOS through a recent swing low).
How the indicator works (at a glance)
1. Regime Filter (T3 + R²)
T3 Moving Average: A smoother, faster-responding moving average that aims to reduce lag while filtering noise, so trend direction changes are clearer.
R² (Coefficient of Determination): Measures how “linear” the recent price path is (0→1). Higher values = stronger, cleaner trend; lower values = more chop. Used here to allow trades only when trend quality exceeds a user-set threshold.
2. Sweep Detection
Bullish sweep: price pokes below a prior swing low and closes back above it.
Bearish sweep: price pokes above a prior swing high and closes back below it.
Lookback length is configurable.
3. Sequence Lock (built-in FSM)
The script manages state in phases so you don’t jump the gun:
Phase 1: Sweep detected → wait for T3 to turn in the corresponding direction.
Phase 2: T3 direction confirmed → show “SWEEP OK” and wait for final confirmation.
Trade Signal: Only fires if confirmation arrives before a timeout.
4. Confirmation Layer
BOS via wick or close (you choose),
Strong close toward the signal (top/bottom quartile of the candle),
Optional “close above/below T3” condition.
These checks help avoid weak sweeps that immediately fade.
5. Alerts & Visuals
“SWEEP OK” markers show when the sweep + T3 direction align.
Final BUY/SELL arrows appear only when the confirmation layer passes.
Ready-made alert conditions for automation.
What you can do with it
Time reversals after sweeps: Enter when a stop-hunt fades and structure confirms.
Ride continuations: Use BOS with the T3 trend to pyramid or re-enter with structure on your side.
Filter chop: Let R² gate entries to periods with cleaner directional drift.
Automate: Use the included alerts with your platform or webhook setup.
Inputs (key settings)
Regime Filter
T3 Length / Volume Factor: Controls smoothness and responsiveness. Smaller length → faster, more sensitive; higher volume factor → smoother curve.
R² Lookback & Threshold: Length of the linear fit window and the minimum “trend quality” required. Higher thresholds mean fewer, cleaner signals.
Sweep / Sequence
Swing Lookback: How far back to define the “reference” high/low for sweeps.
Timeout: Maximum bars allowed between phases to keep signals fresh.
Restart timeout on Phase 2: Optional safety so entries don’t go stale.
Confirmation
BOS Lookback: Micro-pivot window for structure breaks.
Wick vs Close BOS: Conservative traders may prefer close.
Require close above/below T3: Tightens confirmation with trend alignment.
Practical guide (quick start)
1. Timeframe & markets: Works across majors, indices, and crypto. Start with 5m–1h intraday or 1h–4h swing; adjust R² threshold upward on noisier pairs.
2. Entry recipe (Long):
Bullish sweep of a prior low → T3 turns up → BOS/strong close.
Optional: enable “close above T3” for extra confirmation.
3. Entry recipe (Short): Mirror the above.
4. Stops: Common choices are just beyond the sweep wick (tighter) or past the BOS invalidation (safer).
5. Targets: Previous structural levels, measured move, or a T3 trail (exit when price closes back through T3).
6. Avoid low-quality contexts: If R² is very low, market is likely ranging erratically—skip or widen filters.
Tips & best practices
Context first: The same sweep means different things in a strong trend vs. flat regime; that’s why the T3+R² filter exists.
BOS choice: Wick-based BOS is earlier but noisier; close-based BOS is slower but cleaner. Tune per market.
Backtest -> Forward test: Validate settings per symbol/timeframe; then paper trade before going live.
Risk: Fixed fractional risk with asymmetric R\:R (e.g., 1:1.5–1:3) generally performs better than “all-in” discretionary sizing.
Behind the scenes (for the curious)
T3 is a multi-stage EMA construction that produces a smooth curve with reduced lag versus simple/standard EMAs.
R² is the square of correlation (0–1). Here it’s used as a moving gauge of how well price aligns to a linear path—our “trend quality” dial.
Stop-hunts / sweeps are a recognized microstructure phenomenon where clustered stops provide the liquidity that fuels the next move.
Disclaimer
No indicator guarantees profits. Sweep2Trade Pro \ is a decision aid; always combine with solid risk management and your own judgment. Backtest, forward test, and size responsibly.
The content provided, including all code and materials, is strictly for educational and informational purposes only. It is not intended as, and should not be interpreted as, financial advice, a recommendation to buy or sell any financial instrument, or an offer of any financial product or service. All strategies, tools, and examples discussed are provided for illustrative purposes to demonstrate coding techniques and the functionality of Pine Script within a trading context.
Any results from strategies or tools provided are hypothetical, and past performance is not indicative of future results. Trading and investing involve high risk, including the potential loss of principal, and may not be suitable for all individuals. Before making any trading decisions, please consult with a qualified financial professional to understand the risks involved.
By using this script, you acknowledge and agree that any trading decisions are made solely at your discretion and risk.
Enhance your trading precision and confidence 🚀
Happy trading
Chervolino
ค้นหาในสคริปต์สำหรับ "sweep"

Sweep institutionalThis indicator focuses on identifying "SWEEPs" based on taking liquidity at highs and lows. The application of the SWEEP strategy is highly determinant in the Swing points, as they serve as the target of our operations.
ALERTS INCLUDED
🔹Example of Strategy Application
1.-Create the BULLISH SWEEP.
2.-You can enter LONG.
3.-If it is a BULLISH SWEEP, take a long with a SWING HIGH target (2-3 pips up).
4.-If it is a BULLISH SWEEP, place your SL behind the SWEEP (2-3 pips).
(This example is bullish, but it would be the same in a bearish setup, applying everything in the opposite way)
t's very crucial for the strategy to reference SWING POINTS, as these points will be our take profit and stop loss points.
The strategy is based on identifying a SWEEP. After this, we can look for trading opportunities with targets on the opposite side of the fractal. Remember, if you decide to enter, the Stop Loss should be placed protected by the Sweep, and the Take Profit should be set at the opposite Swing, as seen in the example.
Use this STRATEGY IN TIMEFRAMES GREATER THAN 30M. If you decide to use it in timeframes <30M, there's a higher probability of encountering false SWEEPs (the most optimal are 1h & 4h)
🔹Use
The Sweep strategy involves identifying potential trades based on the creation of a "SWEEP" (liquidity grab) at the Swing High or Swing Low. Below is an example of a bearish opportunity after taking liquidity from a Swing High with a wick and no candle body closing above it.
🔹Details
As you have seen, it indicates the surpassing of a high without the candle body, this is called a “SWEEP.” Each time this occurs, the price is likely to surpass the opposite SWING High/Low. The following example will show more clearly how it works in both bullish and bearish scenarios.
🔹Configuration
-Cooldown period: is the length of the operating Range line
-Swing detection: determines the points to be used as SL and TP protection
Bullish/Berish Sweep
-Line Width: size of the line
-Line Style: design type
-Color
Sweep Engulf CHoCH📖 Indicator Overview
The Sweep Engulf CHoCH indicator is designed to detect the Sweep + Engulf + CHoCH (Change of Character) pattern on price charts. This indicator helps traders identify bullish and bearish entry opportunities based on the last three candles forming this pattern.
📊 How the Indicator Works
The indicator analyzes specific conditions in the last three candles:
🔹 Bullish Entry (Buy Signal)
✔️ Candle 1 must be bearish (close < open )
✔️ Candle 2 must sweep the low of candle 1 (low < low )
✔️ Candle 2 must also engulf candle 1 (close > close )
✔️ Candle 3 must break structure (CHoCH) by closing above the open of candle 1 (close > open )
🔻 Bearish Entry (Sell Signal)
✔️ Candle 1 must be bullish (close > open )
✔️ Candle 2 must sweep the high of candle 1 (high > high )
✔️ Candle 2 must also engulf candle 1 (close < open )
✔️ Candle 3 must break structure (CHoCH) by closing below the open of candle 1 (close < open )

Liquidity Sweep Filter Strategy [AlgoAlpha X PineIndicators]This strategy is based on the Liquidity Sweep Filter developed by AlgoAlpha. Full credit for the concept and original indicator goes to AlgoAlpha.
The Liquidity Sweep Filter Strategy is a non-repainting trading system designed to identify liquidity sweeps, trend shifts, and high-impact price levels. It incorporates volume-based liquidation analysis, trend confirmation, and dynamic support/resistance detection to optimize trade entries and exits.
This strategy helps traders:
Detect liquidity sweeps where major market participants trigger stop losses and liquidations.
Identify trend shifts using a volatility-based moving average system.
Analyze volume distribution with a built-in volume profile visualization.
Filter noise by differentiating between major and minor liquidity sweeps.
How the Liquidity Sweep Filter Strategy Works
1. Trend Detection Using Volatility-Based Filtering
The strategy applies a volatility-adjusted moving average system to determine trend direction:
A central trend line is calculated using an EMA smoothed over a user-defined length.
Upper and lower deviation bands are created based on the average price deviation over multiple periods.
If price closes above the upper band, the strategy signals an uptrend.
If price closes below the lower band, the strategy signals a downtrend.
This approach ensures that trend shifts are confirmed only when price significantly moves beyond normal market fluctuations.
2. Liquidity Sweep Detection
Liquidity sweeps occur when price temporarily breaks key levels, triggering stop-loss liquidations or margin call events. The strategy tracks swing highs and lows, marking potential liquidity grabs:
Bearish Liquidity Sweeps – Price breaks a recent high, then reverses downward.
Bullish Liquidity Sweeps – Price breaks a recent low, then reverses upward.
Volume Integration – The strategy analyzes trading volume at each sweep to differentiate between major and minor sweeps.
Key levels where liquidity sweeps occur are plotted as color-coded horizontal lines:
Red lines indicate bearish liquidity sweeps.
Green lines indicate bullish liquidity sweeps.
Labels are displayed at each sweep, showing the volume of liquidated positions at that level.
3. Volume Profile Analysis
The strategy includes an optional volume profile visualization, displaying how trading volume is distributed across different price levels.
Features of the volume profile:
Point of Control (POC) – The price level with the highest traded volume is marked as a key area of interest.
Bounding Box – The profile is enclosed within a transparent box, helping traders visualize the price range of high trading activity.
Customizable Resolution & Scale – Traders can adjust the granularity of the profile to match their preferred time frame.
The volume profile helps identify zones of strong support and resistance, making it easier to anticipate price reactions at key levels.
Trade Entry & Exit Conditions
The strategy allows traders to configure trade direction:
Long Only – Only takes long trades.
Short Only – Only takes short trades.
Long & Short – Trades in both directions.
Entry Conditions
Long Entry:
A bullish trend shift is confirmed.
A bullish liquidity sweep occurs (price sweeps below a key level and reverses).
The trade direction setting allows long trades.
Short Entry:
A bearish trend shift is confirmed.
A bearish liquidity sweep occurs (price sweeps above a key level and reverses).
The trade direction setting allows short trades.
Exit Conditions
Closing a Long Position:
A bearish trend shift occurs.
The position is liquidated at a predefined liquidity sweep level.
Closing a Short Position:
A bullish trend shift occurs.
The position is liquidated at a predefined liquidity sweep level.
Customization Options
The strategy offers multiple adjustable settings:
Trade Mode: Choose between Long Only, Short Only, or Long & Short.
Trend Calculation Length & Multiplier: Adjust how trend signals are calculated.
Liquidity Sweep Sensitivity: Customize how aggressively the strategy identifies sweeps.
Volume Profile Display: Enable or disable the volume profile visualization.
Bounding Box & Scaling: Control the size and position of the volume profile.
Color Customization: Adjust colors for bullish and bearish signals.
Considerations & Limitations
Liquidity sweeps do not always result in reversals. Some price sweeps may continue in the same direction.
Works best in volatile markets. In low-volatility environments, liquidity sweeps may be less reliable.
Trend confirmation adds a slight delay. The strategy ensures valid signals, but this may result in slightly later entries.
Large volume imbalances may distort the volume profile. Adjusting the scale settings can help improve visualization.
Conclusion
The Liquidity Sweep Filter Strategy is a volume-integrated trading system that combines liquidity sweeps, trend analysis, and volume profile data to optimize trade execution.
By identifying key price levels where liquidations occur, this strategy provides valuable insight into market behavior, helping traders make better-informed trading decisions.
Key use cases for this strategy:
Liquidity-Based Trading – Capturing moves triggered by stop hunts and liquidations.
Volume Analysis – Using volume profile data to confirm high-activity price zones.
Trend Following – Entering trades based on confirmed trend shifts.
Support & Resistance Trading – Using liquidity sweep levels as dynamic price zones.
This strategy is fully customizable, allowing traders to adapt it to different market conditions, timeframes, and risk preferences.
Full credit for the original concept and indicator goes to AlgoAlpha.

Engulfing Candles with Sweep by AydmaxxEngulfing Candles with Sweep Indicator
The "Engulfing Candles with Sweep" indicator identifies bullish and bearish engulfing candles that exhibit liquidity sweeps. It marks these significant candlestick patterns and draws a 50% Fibonacci retracement line from the high to low of the engulfing candle. The indicator helps traders spot potential reversal points where large market players might be accumulating or distributing positions.
Key Features:
Bullish Engulfing Candle with Sweep:
Identifies when a bullish candle (closing higher than it opened) engulfs the previous bearish candle (closing lower than it opened).
Ensures that the bullish candle’s low is lower than the previous candle’s low, indicating a sweep of liquidity.
Marks the identified bullish candle with a symbol below the candlestick.
Draws a 50% Fibonacci retracement line from the high to the low of the bullish engulfing candle.
Bearish Engulfing Candle with Sweep:
Identifies when a bearish candle (closing lower than it opened) engulfs the previous bullish candle (closing higher than it opened).
Ensures that the bearish candle’s high is higher than the previous candle’s high, indicating a sweep of liquidity.
Marks the identified bearish candle with a symbol above the candlestick.
Draws a 50% Fibonacci retracement line from the high to the low of the bearish engulfing candle.
Customizable Settings:
Fibonacci Line Color: Allows customization of the Fibonacci retracement line color for both bullish and bearish engulfing candles.
Fibonacci Line Style: Provides options to choose the line style (solid, dotted, dashed).
Fibonacci Line Width: Enables adjustment of the line width for better visibility.
Toggle Fibonacci Lines: Option to enable or disable the display of Fibonacci retracement lines.
How to Use:
Apply the indicator to your chart.
Look for symbols below or above the candlesticks, indicating bullish or bearish engulfing candles with liquidity sweeps.
Utilize the 50% Fibonacci retracement lines to identify potential support or resistance levels.
Benefits:
Helps in identifying key reversal patterns in the market.
Provides visual aids with Fibonacci retracement levels for potential entry and exit points.
Enhances trading decisions by confirming engulfing patterns with liquidity sweeps.
Typical Sweeps: Pivot high/low boxes. Grade sweeps, Handles/PipsTool to show typical pip-grade/ handle-grade sweep distance above pivot highs and pivot lows
-In consolidation/ranging periods (i.e. most of the time); Highs/Lows may by swept by fairly consistent distances in typical stop raids.
-Idea is from ICT teaching on typical Pip-grade sweeps in FX (10,20,30pips). Designed to work on FX, Indices, Commodities, Bitcoin.
-Above chart shows S&P; sweeping below and then above by 5 handles.
///inputs///
~choose sweep distance handles ($) or pips: will auto-calculate depending on the asset: FX= pips; Indices/stocks/commodities = handles ($)
--(2,5,10,20,30,50,100, 500, 1000)
~choose pivot lookback: larger number for more significant swing highs/lows
~choose number of historical boxes to display
~toggle on/off Pivot high boxes and Pivot low boxes independently
~extend boxes fully to the right (default is not extend)
~toggle on/off text
~text & box formatting options
Bitcoin, hourly chart; Pivot lookback = 15; $100 sweep boxes:
Eur/Usd; 15m chart; Pivot lookback = 30; 10pip sweep boxes; Boxes extended fully to the right:

B A N K $ - Breaks & SweepsThis indicator automatically maps on Breaks of Structure & Liquidity Sweeps. It works by calculating pivot points based on how many candles are above/below either side of a pivot.
The user can manually set how many candles need to be above/below either side of a pivot if they would prefer to change it.
The indicator will dynamically adjust the lines as the user changes timeframe to allow for seamless analysis.
Features
Break of Structure lines
Liquidity Sweep lines
Dealing Range - this allows the user to visualise the current dealing range
Explanation
A sweep is determined by whether a candle closes through a pivot point with a body closure or not. If the candle wicks this level but fails to close through it, the line will turn red to indicate a liquidity sweep.
If the following 3 candles go on to close through the break line, this will then update it from a red sweep line to the normal break line again. (sometimes the initial candle that touches a level will not close through it but price will continue to break that level in the next few candles).

Session Sweeps [LuxAlgo]The Session Sweeps indicator combines ICT-based features for a complete trading methodology involving market sessions, market structure, and fair value gaps to find optimal entry conditions for trading price action.
Traders frequently tend to place stop/limit orders at the high and low points of major trading sessions such as Asian (Tokyo), European (London), and North American (New York), resulting in the establishment of liquidity pools at those particular levels. The Session Sweeps indicator is crafted to recognize and underscore occurrences of session sweeps or liquidity sweeps during these major trading sessions.
🔶 USAGE
Default settings utilize major forex trading sessions, yet users can select their preferred opening and closing times, rename the sessions, or adjust the colors. It's important to note that the specified times for each session align with the respective local timezones: Asian (Tokyo) UTC+9, European (London) UTC, and North American (New York) UTC-5.
If the price briefly crosses either the highest or lowest point of a market session. These movements, aiming at triggering stop losses, suggest potential shifts in the market direction. Detecting such movements is the fundamental purpose and core functionality of the script.
🔹Market Structure Shifts
A Market Structure Shift refers to a change in market direction, either from an uptrend to a downtrend or vice versa. A part of a common entry model when using session sweeps is waiting for the formation of a CHoCH after a session sweep.
🔹Fair Value Gaps
A Fair Value Gap (FVG) holds particular appeal for price action traders, emerging when there are inefficiencies or imbalances in the market, often a result of uneven buying and selling activity. The underlying concept of FVGs is that the market tends to revisit these inefficiencies before resuming its trajectory in alignment with the initial impulsive move.
After the formation of a CHoCH traders can enter a position when the price enters the area of a Fair Value Gap (FVG).
🔹Setup Examples
This entry setup is commonly used by ICT traders and is shared for informational & educational purposes only.
Long Positions (5-Minute Timeframe):
Wait for the previous session's low to be swept.
Look for a Bullish Choch.
Find a Bullish FVG formed by or before the Choch.
Entry Point: At the FVG.
Take Profit (TP): At the session high or aim for a 1:2 Risk-Reward Ratio.
Stop Loss (SL): At the session low or nearest Swing Low.
Take partial profits at intermediate swings, but don’t shift SL prematurely.
Short Positions (5-Minute Timeframe):
Wait for the previous session's high to be swept.
Look for a Bearish Choch.
Find a FVG formed by or before the Choch.
Entry Point: At the FVG.
Take Profit (TP): At the previous session's low or aim for a 1:2 RR.
Stop Loss (SL): At the session high or nearest Swing High.
Take partial profits at intermediate swings, but don’t shift SL prematurely.
🔶 SETTINGS
🔹Session Sweeps
Buyside Sweep Zones, Color, and Margin: toggles the visibility of bullside sweep zones, customizes the associated color, and sets the margin value defining the range of a bullside sweep zone.
Sellside Sweep Zones, Color, and Margin: toggles the visibility of sell-side sweep zones, customizes the associated color, and sets the margin value defining the range of a sell-side sweep zone.
Sweep Margin Length: specifies the maximum allowed length of a sweep zone invalidation, the length over which the price slightly invalidated the margin range.
Detect Sweeps Once per Session: if enabled will detect only once a sweep zone within a session.
Hide Fake Sweep Zones, and Color: controls the visibility and color of the fake sweep zones.
🔹Sessions
Session (Asia, London, New York AM, and New York PM), Start Time, and End Time: enables or disables the visibility of the named market session range, and customization of the session hours.
Color: color customization option of the named session.
Extend Max/Min: extends the highest and lowest price levels of the named session until the end of the next enabled session. This option is recommended to be enabled when sweep zone detection is activated to observe the relationship between the sweep zone and previous session extreme levels.
Extend Mid: extends the mean price levels of the named session until the end of the next enabled session. The extended line may serve as potential support and resistance levels.
Fill: enables/disables background coloring of the named session.
New York DST | London DST: enabling this option initiates Daylight Saving Time (DST) for New York or London. Note: Daylight Saving Time is not applied to the Asian (Tokyo) session.
Sessions Extreme Lines | Sessions Names: toggles the visibility of the highest and lowest price levels, as well as the names, for all market sessions.
Session Lines Width: sets the width of the lines for all sessions.
Session Fill Transparency: sets the background color transparency of the range for all sessions.
🔹Market Structure Shifts
Market Structure Shifts: toggles the visibility of market structure shifts, also known as change of character (CHoCH).
Detection Length: specifies the detection length.
Market Structure Shifts; Bull & Bear: color customization options.
🔹Fair Value Gaps
Fair Value Gaps: toggles the visibility of the fair value gaps.
Fair Value Gap Width Filter: specifies the filtering multiplier; additional details can be found in the tooltip of the respective input option.
Bullish & Bearish Imbalance: color customization options.
🔹Sessions Tabular View
Sessions Tabular View: toggles the visibility of the tabular view of the sessions, displaying date &time, status, and countdown counter.
Hide if not Forex Market Instrument: checks the market and automatically enables/disables the option based on the market instrument.
Table Text Size & Position: size and placement customization options
🔶 LIMITATIONS
Please be aware that fair value gap filtering cannot be applied to the initial 144 candles (with a fixed-length ATR) as the ATR value necessary for filtering won't be available during this period.
🔶 RELATED SCRIPTS
Buyside-Sellside-Liquidity
Sessions
Liquidity-Voids-FVG
Thank you to our community for the recommendation of this script. To explore additional conceptual scripts and related content, we invite you to visit >>> LuxAlgo-Scripts .

Quantura - Liquidity Sweep & Run LevelsIntroduction
“Quantura – Liquidity Sweep & Run Levels” is a structural price-action indicator designed to automatically detect swing-based liquidity zones and visualize potential sweep and run events. It helps traders identify areas where liquidity has likely been taken (sweep) or released (run), improving precision in market structure analysis and timing of entries or exits.
Originality & Value
This tool translates institutional liquidity concepts into an automated visual framework. Instead of simply marking highs and lows, it dynamically monitors swing points, tracks their breaches, and identifies subsequent reactions. The indicator is built to highlight the liquidity dynamics that often precede reversals or continuations.
Its originality lies in:
Automatic identification and tracking of swing highs and lows.
Real-time detection of broken levels and liquidity sweeps.
Distinction between “Run” and “Sweep” modes for different market behaviors.
Persistent historical visualization of liquidity levels using clean line structures.
Configurable signal markers for bullish and bearish sweep confirmations.
Functionality & Core Logic
Detects swing highs and lows using a user-defined Swing Length parameter.
Stores and updates all swing levels dynamically with arrays for efficient memory handling.
Draws horizontal lines from each detected swing point to visualize potential liquidity zones.
Monitors when price breaks a swing level and marks that event as “broken.”
Generates signals when the market either sweeps above/below or runs away from those levels, depending on the chosen mode.
Provides optional visual signal markers (“▲” for bullish sweeps, “▼” for bearish sweeps).
Parameters & Customization
Mode: Choose between “Sweep” (detects liquidity grabs) or “Run” (detects breakout continuations).
Swing Length: Sets the sensitivity for detecting swing highs/lows. A higher value focuses on larger structures, while smaller values detect micro liquidity points.
Bullish Color / Bearish Color: Customize color themes for sweep/run lines and signal markers.
Signals: Enables or disables visual up/down markers for confirmed events.
Visualization & Display
Horizontal lines represent potential liquidity levels (unbroken swing highs/lows).
Once broken, lines automatically stop extending, marking the moment liquidity is taken.
Depending on the selected mode:
“Sweep” mode identifies false breaks or stop-hunt behavior.
“Run” mode highlights breakouts that continue the trend.
Colored arrows indicate the direction and type of liquidity reaction.
Clean, non-intrusive visualization suitable for overlaying on price charts.
Use Cases
Detect liquidity sweeps before major reversals.
Identify breakout continuations after liquidity runs.
Combine with Supply/Demand or FVG indicators for multi-layered confirmation.
Validate liquidity bias in algorithmic or discretionary strategies.
Analyze market manipulation patterns and institutional stop-hunting behavior.
Limitations & Recommendations
This indicator identifies structural behavior but does not guarantee trade direction or profitability.
Works best on liquid markets with clear swing structures (e.g., crypto, forex, indices).
Signal interpretation should be combined with confluence tools such as volume, order flow, or structure-based filters.
Excessively small swing settings may cause over-signaling in volatile markets.
Markets & Timeframes
Optimized for all major asset classes — including crypto, Forex, indices, and equities — and for intraday to higher-timeframe structural analysis (5-minute up to daily charts).
Author & Access
Developed 100% by Quantura. Published as a Open-source script indicator. Access is free.
Compliance Note
This description fully complies with TradingView’s Script Publishing Rules and House Rules . It avoids performance claims, provides transparency on methodology, and clearly describes indicator behavior and limitations.

Market Structure with Inducements & Sweeps [LuxAlgo]The Market Structure with Inducements & Sweeps indicator is a unique take on Smart Money Concepts related market structure labels that aims to give traders a more precise interpretation considering various factors.
Compared to traditional market structure scripts that include Change of Character (CHoCH) & Break of Structures (BOS) -- this script also includes the detection of Inducements (IDM) & Sweeps which are major components of determining other structures labeled on the chart.
SMC & price action traders have historically considered this a more accurate representation of market structure by including these components.
🔶 USAGE
Below we can see a diagram for how market structure is displayed within the Market Structure with Inducements & Liquidity indicator.
Change of Characters (CHoCH) are based on swing points detection, while Break of Structures (BOS) are based on trailing maximum & minimums from the detected Change of Characters. We do this for a more dynamic & timely display of market structure.
🔹 Inducements (IDM)
Traders that consider inducements as a part of their analysis of Change of Characters & Break of Structures can more easily avoid fakeouts within trends as shown below.
In this script IDM's are always required between each market structures.
🔹 Sweeps of Liquidity (x)
SMC traders looking to properly analyze market structure need to look for sweeps of liquidity to ensure levels that are wicked are noted as sweeps, while levels that are fully closed above / below are labeled as confirmed market structures.
In the chart below we can see a Sweep of Liquidity which typically can occur on the longer term price action and indicate a potential reversal.
Notably, since labels such as CHoCH or BOS's can occur at the same level as a Sweep of liquidity, we have allowed the indicator to display the market structure label at the current bar in the event this happens.
The Sweeps of Liquidity are also based on trailing maximum / minimum, which allows for a continuous evaluation of areas for liquidity sweeps to occur.
This can be helpful for traders looking for longer term & shorter term sweeps.
🔶 SETTINGS
CHoCH Detection Period: Detection period for CHoCH's, higher values will return longer term CHoCH's.
IDM Detection Period: Detection period for IDM's, higher values will return longer term IDM's.
Thank you all for 500k followers on TradingView! Enjoy!

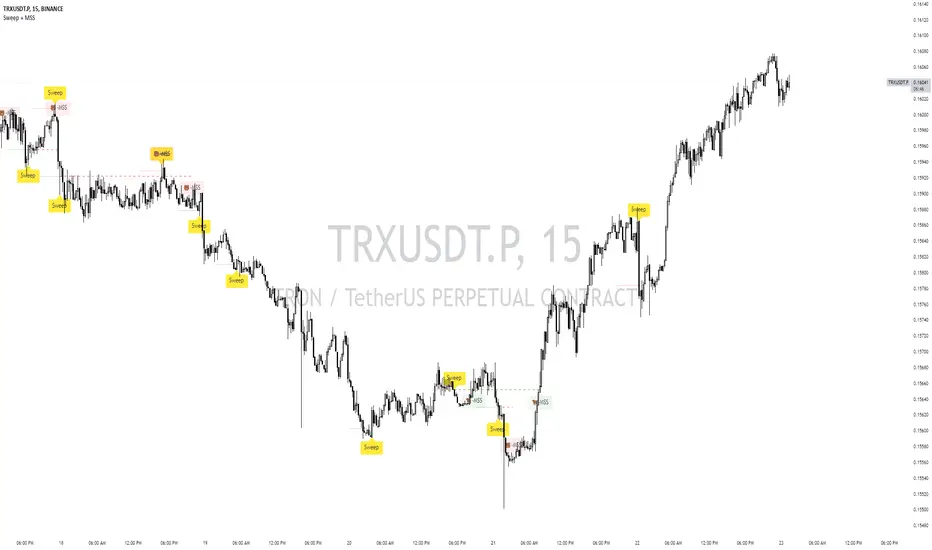
Sweep + MSS# Sweep + MSS Indicator
This indicator identifies market sweeps and Market Structure Shifts (MSS) to help traders recognize potential trend changes and market manipulations.
How it works:
1. Sweep Detection:
- Identifies when price briefly moves beyond a recent high/low (pivot point) and then reverses.
- Bullish sweep: Price drops below a recent low, then closes above it.
- Bearish sweep: Price rises above a recent high, then closes below it.
2. Market Structure Shift (MSS):
- Occurs when price action invalidates a previous sweep level.
- Bullish MSS: Price closes above a bearish sweep level.
- Bearish MSS: Price closes below a bullish sweep level.
Key Features:
- Customizable pivot lookback length for sweep detection
- Minimum bar requirement after a sweep before MSS can trigger
- One MSS per sweep level to avoid multiple signals
- Visual representation with lines connecting sweep points to MSS triggers
- Emoji labels for easy identification (🐂-MSS for bullish, 🐻-MSS for bearish)
Logic Behind MSS:
The MSS aims to identify potential trend changes by recognizing when the market invalidates a previous sweep level. This often indicates a shift in market structure, suggesting that the previous trend may be weakening or reversing.
- A bullish MSS occurs when the price closes above a bearish sweep level, potentially signaling a shift from bearish to bullish sentiment.
- A bearish MSS occurs when the price closes below a bullish sweep level, potentially signaling a shift from bullish to bearish sentiment.
By requiring a minimum number of bars between the sweep and the MSS, the indicator helps filter out noise and focuses on more significant structural changes in the market.
This indicator can be a valuable tool for traders looking to identify potential trend changes and entry/exit points based on market structure analysis.
Pure Price Action Liquidity Sweeps [LuxAlgo]The Pure Price Action Liquidity Sweeps indicator is a pure price action adaptation of our previously published and highly popular Liquidity-Sweeps script.
Similar to its earlier version, this indicator detects the presence of liquidity sweeps on the user's chart, while also identifying potential areas of support/resistance or entry when liquidity levels are taken. The key difference, however, is that this price action version relies solely on price patterns, eliminating the need for numerical swing length settings.
🔶 USAGE
A Liquidity Sweep occurs when the price breaks through a liquidity level , after which the price returns below/above the liquidity level , forming a wick.
The examples below show a bullish and bearish scenario of "a wick passing through a liquidity level where the price quickly comes back".
Short-term liquidity sweep detection is based on short-term swing levels. Some of these short-term levels, depending on further market developments, may evolve into intermediate-term levels and, in the long run, become long-term levels. Therefore, enabling short-term detection with the script means showing all levels, including minor and temporal ones. Depending on the trader's style, some of these levels may be considered noise. Enabling intermediate and long-term levels can help filter out this noise and provide more significant levels for trading decisions. For further details on how swing levels are identified please refer to the details section.
The Intermediate-term option selection for the same chart as above, filters out minor or noisy levels, providing clearer and more significant levels for traders to observe.
🔶 DETAILS
The swing points detection feature relies exclusively on price action, eliminating the need for numerical user-defined settings.
The first step involves detecting short-term swing points, where a short-term swing high (STH) is identified as a price peak surrounded by lower highs on both sides. Similarly, a short-term swing low is recognized as a price trough surrounded by higher lows on both sides.
Intermediate-term swing and long-term swing points are detected using the same approach but with a slight modification. Instead of directly analyzing price candles, we now utilize the previously detected short-term swing points. For intermediate-term swing points, we rely on short-term swing points, while for long-term swing points, we use the intermediate-term ones.
🔶 SETTINGS
Detection: Period options of the detected swing points.
🔶 RELATED SCRIPTS
Pure-Price-Action-Structures.
Liquidity-Sweeps.

ICT Setup 04 [TradingFinder] SFP Sweep Liquidity Fake CHoCH/BOS🔵 Introduction
In smart money and ICT based trading, liquidity is never random. Some of the most meaningful market moves begin with a liquidity sweep where price intentionally hunts a previous swing high or swing low to trigger stop loss orders and absorb volume.
This manipulation is often followed by a sharp reversal from a reaction zone, creating ideal conditions for a high probability entry. This indicator is built to detect exactly that. It identifies a valid swing point and defines a reaction zone where price is likely to react.
For short setups, the zone lies between the swing high and the maximum of the candle’s open or close. For long setups, it’s drawn from the swing low to the minimum of the open or close.
When price returns to this zone and forms a qualified confirmation candle typically a doji or a small bodied candle that closes inside the zone while sweeping the liquidity this is a potential sign of reversal.
The candle must show both the sweep and the inability to hold above or below the key level, signaling a fake breakout or failed move. By combining elements of liquidity hunt, reaction zone rejection, and candle based entry confirmation, this tool highlights sniper entry points used by smart money to trap retail traders and reverse the trend. It helps filter out noise and enhances timing, making it ideal for trading in alignment with institutional order flow.
Long Position :
Short Position :
🔵 How to Use
This indicator is designed to highlight precise moments where price sweeps liquidity and reacts within a high probability reversal zone. By identifying clean swing highs and lows and defining a smart reaction zone around them, it filters out weak fakeouts and focuses only on setups with strong institutional footprints.
The tool works best when combined with market structure analysis and is suitable for both scalping and intraday trading. Below is a breakdown of how to interpret the signals for long and short positions based on the visual setups provided.
🟣 Long Setup
In a long setup, the indicator first detects a valid swing low where liquidity has likely accumulated below. A reaction zone is then drawn between the swing low and the minimum of the open or close of the swing candle.
When price returns to this zone, it must sweep the previous low and form a precise confirmation candle, such as a doji or a small bodied candle, that closes inside the zone. This candle must also reject the lower level, showing failure to continue downward.
As shown in the chart, once the liquidity grab is complete and the confirmation candle forms, a clean long signal is issued, indicating a potential bullish reversal backed by smart money behavior.
🟣 Short Setup
In a short setup, the indicator identifies a swing high where buy-side liquidity is resting. It then constructs a reaction zone between the high and the maximum of the open or close of the swing candle. Price must return to this zone, sweep the swing high, and form a bearish confirmation candle inside the zone.
A classic example is a doji or rejection candle that traps breakout buyers and fails to hold above the previous high. In the provided chart, the price aggressively hunts the liquidity above the swing high, but the close within the reaction zone signals exhaustion, prompting a short signal with high reversal probability.
These setups represent moments where price action, liquidity behavior, and candle structure align to offer strong entries. By focusing on clean sweeps and reactive confirmations, the indicator helps traders stay on the side of smart money and avoid common breakout traps.
🔵 Settings
🟣 Logical settings
Swing period : You can set the swing detection period.
Max Swing Back Method : It is in two modes "All" and "Custom". If it is in "All" mode, it will check all swings, and if it is in "Custom" mode, it will check the swings to the extent you determine.
Max Swing Back : You can set the number of swings that will go back for checking.
Maximum Distance Between Swing and Signal :The maximum number of candles allowed between the swing point and the potential signal. The default value is 50, ensuring that only recent and relevant price reactions are considered valid.
🟣 Display settings
Displaying or not displaying swings and setting the color of labels and lines.
🟣 Alert Settings
Alert SFP : Enables alerts for Swing Failure Pattern.
Message Frequency : Determines the frequency of alerts. Options include 'All' (every function call), 'Once Per Bar' (first call within the bar), and 'Once Per Bar Close' (final script execution of the real-time bar). Default is 'Once per Bar'.
Show Alert Time by Time Zone : Configures the time zone for alert messages. Default is 'UTC'.
🔵 Conclusion
This indicator is built for traders who rely on liquidity driven setups and smart money principles. By combining swing structure analysis with precision reaction zones and strict entry confirmation, it isolates the exact moments where price sweeps liquidity and fails to continue. These are high value points where institutional activity often reveals itself, and retail traps unfold.
Unlike generic breakout tools, this script focuses on quality over quantity by requiring both a sweep of a swing high or low and a confirmed rejection candle that closes inside a predefined zone. With customizable swing depth, proximity filters, visual highlights, and alert functions, it offers a complete framework for identifying and acting on fake breakouts with confidence. Whether you trade forex, crypto, or indices, this tool enhances your ability to align with true order flow and take entries where liquidity is most likely to shift.

$ - HTF Sweeps & PO3HTF Sweeps & PO3 Indicator
The HTF Sweeps & PO3 indicator is a powerful tool designed for traders to visualise higher timeframe (HTF) candles, identify liquidity sweeps, and track key price levels on a lower timeframe (LTF) chart. Built for TradingView using Pine Script v6, it overlays HTF candle data and highlights significant price movements, such as sweeps of previous highs or lows, to help traders identify potential liquidity sweep and reversal points. The indicator is highly customisable, offering a range of visual and alert options to suit various trading strategies.
Features
Higher Timeframe (HTF) Candle Visualisation:
- Displays up to three user-defined HTF candles (e.g., 15m, 1H, 4H) overlaid on the LTF chart.
- Customisable candle appearance with adjustable size (Tiny to Huge), offset, spacing, and colours for bullish/bearish candles and wicks.
- Option to show timeframe labels above or below HTF candles with configurable size and position.
Liquidity Sweep Detection:
- Identifies bullish and bearish sweeps when price moves beyond the high or low of a previous HTF candle and meets specific conditions.
- Displays sweeps on both LTF and HTF with customisable line styles (Solid, Dashed, Dotted), widths, and colours.
- Option to show only the most recent sweep per candle to reduce chart clutter.
Invalidated Sweep Tracking:
- Detects and visualises invalidated sweeps (when price moves past a sweep level in the opposite direction).
- Configurable display for invalidated sweeps on LTF and HTF with distinct line styles and colours.
Previous High/Low Lines:
- Plots horizontal lines at the high and low of the previous HTF candle, extending on both LTF and HTF.
- Customisable line style, width, and color for easy identification of key levels.
- Real-Time Sweep Detection:
-Optional real-time sweep visualisation for active candles, enabling traders to monitor developing price action.
Alert System:
- Triggers alerts for sweep formation (when a new sweep is detected).
- Triggers alerts for sweep invalidation (when a sweep is no longer valid).
- Alerts include details such as timeframe, ticker, and price level for precise notifications.
Performance Optimisation:
- Efficiently manages resources with configurable limits for lines, labels, boxes, and bars (up to 500 each).
- Cleans up outdated visual elements to maintain chart clarity.
Flexible Configuration:
- Supports multiple timeframes for HTF candles with user-defined settings for visibility and number of candles displayed (1–60).
- Toggle visibility for HTF candles, sweeps, invalidated sweeps, and high/low lines independently for LTF and HTF.
This indicator is ideal for traders focusing on liquidity hunting, order block analysis, or price action strategies, providing clear visual cues and alerts to enhance decision-making.

Liquidity Swings & SweepsThis Pine script indicator is designed to create a visual representation liquidity as identified by swing Highs/Lows along with an indication of the liquidity level that was swept, optionally rating the strength of the sweep based on time & price.
Relevance:
Liquidity levels & sweeps are crucial for many SMC/ICT setups and can indicate a point at which the price changes direction or may re-trace in an opposite direction to provide additional liquidity for continued move in the original direction. Additionally, liquidity levels may provide targets for setups, as price action will often seek to take out those levels as they main contain many buy/sell stops.
How It Works:
The indicator tracks all swing points, as identified using user-defined strength of the swing. Once a swing is formed that meets the criteria, it is represented by a horizontal line starting at the price of the current swing until the last bar on the chart. While the swing is valid, this line will continue to be extended until the swing is invalid or a new swing is formed. Upon identifying a new swing, the indicator then scans the earlier swings in the same direction looking for a point of greatest liquidity that was taken by the current swing. This level is then denoted by dashed horizontal line, connecting earlier swing point to the current. At the same time any liquidity zones between the two swings are automatically removed from the chart if they had previously been rendered on the chart. If the setting to enable scan for maximum liquidity is enabled, then while looking back, the indicator will look for lowest low or highest high that was taken by the current swing point, which may not be a swing itself, however, is a lowest/highest price point taken (mitigated) by the current swing, which in many cases will be better price then then the one represented by previous swing. If the option to render sweep label is enabled, the sweep line will also be completed by a label, that will score the sweep and a tooltip showing the details of the level swept and the time it took to sweep it. The score explained further in configurability section ranks the strength of the sweep based on time and is complemented by price (difference in price between the two liquidity levels).
Configurability:
A user may configure the strength of the swing using both left/right strength (number of bars) as well as optionally instruct the indicator to seek the lowest/highest price point which may not be previous swing that was taken out by newly formed swing.
From appearance perspective liquidity level colors & line width presenting the liquidity/swing can be configured. There is also an option to render the liquidity sweep label that will generate an icon-based rating of the liquidity sweep and a tooltip that provides details on the scope of the swing, which includes liquidity level swept and when it was formed along with the time it took to sweep the liquidity.
Rating is of sweeps is primarily based on time with a secondary reference to price
💥- Best rating, very strong sweep with an hourly or better liquidity sweep
🔥- Second rating, strong sweep with 15 – 59 minute liquidity sweep, or 5+ minute sweep of 10+ points
✅- Third rating, ok sweep with 5 - 15 minute liquidity sweep, or lower-time-frame sweep of 10+ points
❄️ - Weakest sweep, with liquidity of 5 or less minutes swept
What makes this indicator different:
Designed with high performance in mind, to reduce impact on chart render time.
Only keeps valid liquidity levels & sweeps on the chart
Automatically removes previously taken liquidity levels
Ranks liquidity sweeps to indicate strength of the sweep

Apex Edge - Session Sweep ProApex Edge Session Sweep Pro
By Apex Edge | 2025 Edition
🔍 What is it?
The Apex Session Sweep Pro is a precision trading tool designed for identifying high-probability liquidity sweep entries during key global market sessions. It combines powerful sweep detection logic with dynamic candle colouring, session visualization, TP projections, and real-time alerts — all within a clean, performance-optimized Pine Script engine.
This is not your average session box indicator. This is Apex-grade.
⚙️ How it Works
The indicator detects session liquidity sweeps by tracking price action relative to previous session highs and lows. When a session high/low is swept (i.e., price breaches it and then closes in the opposite direction), it generates a signal:
Buy Signal → Price sweeps previous low and closes back above it
Sell Signal → Price sweeps previous high and closes back below it
Each session is boxed on the chart (Tokyo, London, New York, Sydney), color-coded, and dynamically labelled.
Upon detecting a valid sweep, the script:
Plots a small entry label (toggleable)
Projects up to 5 customizable TP levels
Coloured candles for visual trade direction
Alerts for Buy or Sell sweep signals (optional)
All elements are memory-managed and customizable to suit your trading style.
🧠 Key Features
✅ Smart Sweep Detection Logic
✅ Global Market Session Boxes (Custom Times)
✅ Toggleable Entry Labels + TP Levels
✅ Candle Colouring by Signal
✅ Manual TP input + TP toggles
✅ Real-time Alerts for Apex entries
🕒 Why Are My Sessions Offset?
Your chart’s time zone may be different from UTC. This script is UTC-based by design, so if your chart is set to UTC+1, for example, the sessions will appear one hour later. Either:
Adjust your chart to UTC or or Exchange for perfect alignment,
Or tweak the session input times manually.
🧰 Who is this for?
This tool is made for:
Intraday traders looking for sweeps into liquidity
SMC (Smart Money Concept) strategists
Forex, crypto, and indices traders
Anyone who uses session-based levels to define entries
Whether you scalp London or ride NY swings, this tool frames each session cleanly — and shows you where the traps are laid.
🚨 Disclaimer
This indicator is a technical tool, not financial advice. Use proper risk management. Past performance ≠ future results.

Liquidity Sweep Candlestick Pattern with MA Filter📌 Liquidity Sweep Candlestick Pattern with MA Filter
This custom indicator detects liquidity sweep candlestick patterns—price action events where the market briefly breaks a previous candle’s high or low to trap traders—paired with optional filters such as moving averages, color change candles, and strictness rules for better signal accuracy.
🔍 What is a Liquidity Sweep?
A liquidity sweep occurs when the price briefly breaks the high or low of a previous candle and then reverses direction. These events often occur around key support/resistance zones and are used by institutional traders to trap retail positions before moving the price in the intended direction.
🟢 Bullish Liquidity Sweep Criteria
The current candle is bullish (closes above its open).
The low of the current candle breaks the low of the previous candle.
The candle closes above the previous candle’s open.
Optionally, in Strict mode, it must also close above the previous candle’s high.
Optionally, it can be filtered to only show if the candle changed color from the previous one (e.g., red to green).
Can be filtered to only show when the price is above or below a moving average (if MA filter is enabled).
🔴 Bearish Liquidity Sweep Criteria
The current candle is bearish (closes below its open).
The high of the current candle breaks the high of the previous candle.
The candle closes below the previous candle’s open.
Optionally, in Strict mode, it must also close below the previous candle’s low.
Optionally, it can be filtered to only show if the candle changed color from the previous one (e.g., green to red).
Can be filtered to only show when the price is above or below a moving average (if MA filter is enabled).
⚙️ Features & Customization
✅ Signal Strictness
Choose between:
Less Strict (default): Basic wick break and close conditions.
Strict: Must close beyond the wick of the previous candle.
✅ Color Change Candles Only
Enable this to only show patterns when the candle color changes (e.g., from red to green or green to red). Helps filter fake-outs.
✅ Moving Average Filter (optional)
Supports several types of MAs: SMA, EMA, WMA, VWMA, RMA, HMA
Choose whether signals should only appear above or below the selected moving average.
✅ Custom Visuals
Show short (BS) or full (Bull Sweep / Bear Sweep) labels
Plot triangles or arrows to represent bullish and bearish sweeps
Customize label and shape colors
Optionally show/hide the moving average line
✅ Alerts
Includes alert options for:
Bullish sweep
Bearish sweep
Any sweep
📈 How to Use
Add the indicator to your chart.
Configure the strictness, color change, or MA filters based on your strategy.
Observe signals where price is likely to reverse after taking out liquidity.
Use with key support/resistance levels, order blocks, or volume zones for confluence.
⚠️ Note
This tool is for educational and strategy-building purposes. Always confirm signals with other indicators, context, and sound risk management.

Liquidity Sweep Detector - PDH/PDL LevelsPrevious Day High/Low Liquidity Sweep Detector (Intraday Accurate)
This indicator tracks the previous day's high and low using intraday data, rather than the daily candle, ensuring precise sweep detection across lower timeframes (15m to 4H).
It monitors for liquidity sweeps—moments when price briefly moves above the previous high or below the previous low—and visually marks these events on the chart.
Key Features
Intraday-accurate PDH/PDL tracking
Real-time sweep detection
On-chart labels marking sweep events
Toggleable table showing sweep status
Alert conditions for PDH/PDL sweep triggers
Best For
Traders who use Smart Money Concepts (SMC), liquidity-based strategies, or look for stop hunts and reversal zones tied to key prior-day levels.
Works well across FX, crypto, and indices on 15m, 1H, and 4H charts.

Market Structure Inducements ICT [TradinFinder] CHoch BOS Sweeps🔵 Introduction
Market Structure is the foundation for identifying trends in the market, crucial in technical analysis and strategies like ICT and SMC. Understanding key concepts such as Break of Structure (BOS) and Change of Character (CHOCH) helps traders recognize critical shifts in the market. BOS, referring to a Market Structure Change (BMS), and CHOCH or Market Structure Shift (MSS) signal trend reversals in the market.
Additionally, the concept of Inducement, a vital tool in Smart Money strategies, allows traders to avoid price traps. Identifying valid pullback, valid inducement, POI, and Liquidity Grab helps traders find optimal entry and exit points and leverage Smart Money movements effectively.
Bullish Market Structure :
Bearish Market Structure :
🔵 How to Use
The Market Structure indicator is designed to help traders better understand market structure and detect price traps. By using this indicator, you can identify the right entry and exit points based on structural changes in the market and avoid unprofitable trades. Below, we explain the key concepts and how to apply them in trading.
🟣 Market Structure
Market Structure refers to the overall pattern of price movement in the market. Using this indicator, traders can identify uptrends and downtrends and make better trading decisions based on changes in market structure. The two key concepts here are Break of Structure (BOS) and Change of Character (CHOCH).
Change of Character (CHOCH) : CHOCH occurs when the market shifts from an uptrend to a downtrend or vice versa. These changes typically indicate a broader trend reversal, and the indicator assists you in identifying them accurately.
Break of Structure (BOS) : When the market breaks a key support or resistance level, it signals a change in market structure. This indicator helps you identify these breakouts in time and take advantage of trading opportunities.
🟣 Inducement
Inducement refers to price traps set by Smart Money to trick retail traders into making the wrong trades. This indicator helps you recognize these traps and avoid unprofitable trades.
Valid Inducement : Valid Inducement refers to deliberately created price traps by major market players to gather liquidity from retail traders. Once the market has collected sufficient liquidity, it makes the real move, and professional traders use this moment to enter.
🟣 Valid Pullback
A Valid Pullback refers to a temporary market retracement, indicating a price correction within the main trend. This concept is crucial in technical analysis as it helps traders enter trades at the right time and profit from the continuation of the trend. The Market Structure indicator can identify these valid retracements, allowing traders to enter trades with greater confidence.
🟣 Point of Interest (POI)
Another important concept in market analysis is the Point of Interest (POI), referring to key price areas on the chart. POI includes zones where significant price movements are likely to occur. The Market Structure indicator helps you locate these key points and use them as entry signals for trades.
🟣 Liquidity Grab
Liquidity Grab refers to a scenario where the market intentionally moves to areas where retail traders' stop losses are placed. The goal is to gather liquidity, allowing major players to execute trades at better prices. By using this indicator, you can spot these liquidity grabs and avoid falling into price traps.
🔵 Setting
ChoCh Detector Period : The period of identifying the major market levels that occur when they break ChoCh.
BoS & Liquidity Detector Period : The period of identifying minor levels, which are used to identify BoS and Liquidity levels.
Inducement Detector Period : The period of identification of Inducement levels.
Fast Trend Detector : This feature will help you update the major market structure levels sooner.
Inducement Type Detector : Two modes "Sweeps" and "Total" can be used to identify the levels of Inducement. In "Sweeps" mode only Levels detected by touch shadow. In "Total" mode, all Levels are detected.
🔵 Conclusion
In financial market analysis and forex trading, identifying Market Structure and Inducement is crucial. Market Structure helps you detect uptrends and downtrends, and understand Break of Structure (BOS) and Change of Character (CHOCH). The concept of Inducement also enables traders to spot Smart Money price traps and avoid unprofitable trades.
The Market Structure indicator is a powerful tool that, by analyzing the market structure and concepts like valid pullback and valid inducement, helps you make more precise trade entries. Additionally, by identifying POI and Liquidity Grab, the indicator gives you the ability to spot key market zones and use them to your advantage in trading.

ICT Setup 01 [TradingFinder] FVG + Liquidity Sweeps/Hunt Alerts🔵 Introduction
The ICT (Inner Circle Trader) style of trading involves analyzing the behavior of market participants and market makers to identify areas where fake buy and sell activities occur. This trading style helps retail traders align with market maker behavior and avoid falling into market traps.
A key aspect of the ICT strategy is focusing on liquidity hunts. This involves searching for trading opportunities in areas of the market with low liquidity or where other traders have little activity. The ICT method leverages market inefficiencies and weaknesses, allowing traders to profit from small price movements that might go unnoticed by others.
In "ICT Setup 01," our focus is on these liquidity areas and stop hunts that form in Fair Value Gaps (FVGs). Trading within FVGs, combined with confirmations from "Hunts" and "Sweeps," can enhance trader performance.
🔵 How to Use
The presence of Fair Value Gaps (FVGs) in the market indicates rapid, powerful movements likely caused by the influx of smart money. When the price returns to these levels, a market reaction is expected.
Combining this with the complex and deceptive behavior of smart money—such as "Liquidity Sweeps" and "Stop Hunts"—forms an ICT-based price action setup that we expect to perform well.
Components of "ICT Setup 01" :
● Fair Value Gap (FVG)
● Premium and Discount
● Hunts / Sweeps
Whenever the price returns to an FVG area and reacts in such a way that only the wicks of the candles remain in the area and the candle bodies are outside the FVG, the first condition for creating the setup is met.
If subsequent candles hunt the wick that has penetrated the deepest into the FVG, a buy or sell signal is issued. In the format where hunting is based on Sweeps, penetrations that extend even outside the area are considered signals, provided they do not form a body within the area.
Additionally, a refining system exists for cases where a candle body forms in the area, optimizing the proximal levels of the FVG.
Bullish Setup :
Bearish Setup :
🔵 Features and Settings of "ICT Setup 01"
You can Find out more in Setting :
● FVG Detector Multiplier Factor
● FVG Validity Period
● Level in Low-Risk Zone
● Issuing Signals Method
● Number of Signals Allowed from a Zone
● Signal after Hunts/Sweeps
● How Many Hunts/Sweeps
● Show or Hide
● Alert Sender
FVG Detector Multiplier Factor :
This feature allows you to determine the size of the moves forming the FVGs based on the ATR (Average True Range). The default value is 1 to identify the majority of setups. You can increase this value according to the symbol and market you are trading in to achieve better results.
FVG Validity Period :
This shows the validity period of an FVG based on the number of candles. By default, an FVG area is valid for up to 15 candles. However, you can increase or decrease this period.
Level in Low-Risk Zone :
This feature helps reduce your risk. The method works by identifying the entire length of the three candles forming the FVG and dividing it into two equal areas. The upper area is "Premium," and the lower area is "Discount." To reduce risk, it is better for "Demand FVG" to be in the "Discount" and "Supply FVG" in the "Premium." This feature is off by default.
Issuing Signals Method :
This feature allows you to specify whether the hunt should occur only within the FVG area or if the wicks can extend outside the area.
If set to "Hunts," only signals where the wicks are within the area are issued, and the area loses its validity if the wicks extend outside.
In "Sweeps" mode, wicks can extend outside the area as long as they do not form a body within the area.
Number of Signals Allowed from a Zone :
This feature allows you to specify how many valid signals can be issued from one area.
Signal after Hunts/Sweeps :
In markets or symbols with a tendency for frequent stop hunts, this feature allows you to specify how many hunts should occur before you receive a signal to avoid receiving potentially failed signals.
How Many Hunts/Sweeps :
Enter the number of hunts you want to set for the "Signal after Hunts/Sweeps" feature here.
Show or Hide :
The number of setups formed may be very large, and displaying all of them on the chart can be distracting and messy. By default, only the last setup is displayed, but if you want to see all setups, you can turn on the relevant options.
Alert Sender :
You cannot constantly monitor multiple charts to identify trading opportunities. Using the alert sending feature can save time and improve performance.
Alerts Name : Customize the alert name to your preference.
Message Frequency : Determines the frequency of alert messages. Options include 'All' (triggers every time the function is called), 'Once Per Bar' (triggers only on the first call within the bar), and 'Once Per Bar Close' (triggers only on the final script execution of the real-time bar upon closure). The default is 'Once per Bar.'
Show Alert Time by Time Zone : Configure the alert messages to reflect any chosen time zone. For instance, input 'UTC+1' for London time. The default is 'UTC.'
By configuring these settings, traders can effectively utilize ICT setups to improve their trading strategies and outcomes.

Follow Through Day (FTD) + Sweep [TrendX_]The Follow Through Day (FTD) + Sweep indicator is a Trend-following tool mixing William O'Neil's original FTD concept and Liquidity concept. This indicator helps you identify potential subsequent bullish trends with greater precision by combining volume analysis, price action, and liquidity concepts.
💎 FEATURES
Follow Through Day Candle (FTD Candle)
The FTD, pioneered by William O'Neil, serves as a reliable signal for identifying the beginning of new bull markets. It's particularly valuable because it combines multiple market factors - price action, volume, and timing - to confirm genuine market reversals rather than temporary bounces.
The power of the FTD lies in its ability to distinguish between ordinary market fluctuations and significant trend changes. By requiring specific criteria to be met across multiple sessions, it helps filter out false signals and identifies high-probability reversal points where institutional investors are likely beginning to accumulate positions.
Sweep Area
The Sweep area feature enhances the traditional FTD concept by incorporating modern liquidity analysis. This overlay identifies zones where large market participants are likely to trigger stop losses before continuing the trend. These areas often represent optimal entry points for traders looking to join the new uptrend with reduced risk.
🔎 BREAKDOWN
FTD Candle
The FTD formation process occurs in two distinct phases: Setup and Completion.
Setup Phase
Strong Market Decline
The market must first experience a significant downtrend
This selling pressure helps clear out weak hands and creates oversold conditions
The decline creates the potential energy for a powerful reversal
First Recovery Session
Marks the initial sign of buying pressure emerging
Often characterized by a strong reversal candle
Represents the first indication that selling pressure may be exhausting
Recovery Confirmation
The second and third days must maintain prices above the new pivot low
This consolidation period helps confirm the validity of the initial bounce
Shows that sellers are no longer in control of price action
Completion Phase:
Supply Test Session
Low volume indicates diminishing selling pressure
Price remains above the pivot low
Creates the foundation for institutional buyers to begin accumulating
Breakout Day
Price increase exceeds average profit of bullish candles
Volume increases by at least 15% compared to previous session
Shows strong institutional commitment to the new uptrend
Timing Window
Must occur between the 4th and 8th candle after First Recovery Session
This specific timing helps confirm the sustainability of the reversal
Based on O'Neil's research of historical market bottoms
FTD Sweep
The Post-FTD Phase introduces the Sweep concept, which is crucial for understanding how large market participants operate. This feature leverages the liquidity concept because institutional traders often need to trigger stop losses to accumulate larger positions at better prices. This helps:
Create liquidity pools for large position entries
Shake out weak hands before continuing the trend
Test the strength of the new trend by absorbing selling pressure
⚙️ USAGE
Sweep + TP & SL Strategy
Example: BTCUSDT (1D) - Replay back to 9th November 2024
After an FTD candle forms, traders can adopt a systematic approach to enhance their trading strategy. First, they should determine the swing range and convert the post-FTD zone into concrete stop loss and take profit levels, which are based on the price action during the FTD formation. Next, traders should wait for a sweep formation, as this indicates that institutional players are accumulating positions. A quick price rejection from the sweep level should be observed before executing an entry.
The reasoning behind this strategy is rooted in market microstructure. By waiting for the sweep, traders position themselves alongside institutional players who need to build large positions without causing adverse price movement. The sweep creates the liquidity they need, and the subsequent move often represents the true trend continuation.
DISCLAIMER
This indicator is not financial advice, it can only help traders make better decisions. There are many factors and uncertainties that can affect the outcome of any endeavor, and no one can guarantee or predict with certainty what will occur. Therefore, one should always exercise caution and judgment when making decisions based on past performance.

Sweep + Estructura + Pullback (Long & Short)Sweep + Estructura + Pullback (Long & Short)
EFECTIVO EN 5 MIN