DayTraderIt is one of the most common mobile stop indicators based on ATR.
In this version, you can change the ATR calculation method from the settings. The standard method is RMA, when the alternative method is SMA .
The indicator is easy to use and leaves an accurate reading on an ongoing trend. It is built with two parameters, period and multiplier. The default values used when building a super indicator are 10 for the average true range or trading period and three for its multiplier.
The average true range (ATR) plays an important role in, as the indicator uses the ATR to calculate its value. The ATR indicator signals the degree of price volatility .
The buy and sell signals are generated when the indicator starts to place a price at or close to the closing price. A buy signal is created when a 'Supertrend' closes above the price and a sell signal is generated when it closes below the closing price.
It also suggests that the trend is shifting from downward to upward. Conversely, when a 'Supertrend' closes above the price, it generates a sell signal as the indicator changes to red.
The indicator can be used in stocks, futures or forex, or even crypto markets and also in daily, semantic and hourly charts, but it generally fails in the side display market.
----------------------------------------------------------------------------------------------------------------------------------------------------------------------------------
É um dos indicadores de parada móvel mais comuns baseados em ATR.
Nesta versão, você pode alterar o método de cálculo do ATR a partir das configurações. O método padrão é RMA, quando o método alternativo é SMA .
O indicador é fácil de usar e deixa uma leitura precisa sobre uma tendência em andamento. É construído com dois parâmetros, período e multiplicador. Os valores padrão usados durante a construção de um superindicador são 10 para o intervalo verdadeiro médio ou período de negociação e três para o seu multiplicador.
O intervalo verdadeiro médio (ATR) desempenha um papel importante em, pois o indicador usa o ATR para calcular seu valor. O indicador ATR sinaliza o grau de volatilidade dos preços.
Os sinais de compra e venda são gerados quando o indicador começa a colocar um preço no fechamento ou abaixo do preço do fechamento. Um sinal de compra é criado quando uma 'Supertrendência' fecha acima do preço e um sinal de venda é gerado quando ele fecha abaixo do preço de fechamento.
Também sugere que a tendência está mudando do modo descendente para o modo ascendente. Ao contrário, quando uma 'Supertrend' fecha acima do preço, gera um sinal de venda conforme o indicador muda para vermelho.
O indicador pode ser usado em ações, futuros ou forex, ou mesmo mercados de criptografia e também em gráficos diários, semânticos e horários, mas geralmente falha no mercado de exibição lateral.
ค้นหาในสคริปต์สำหรับ "supertrend"

Cartera SuperTrends v4 PublicDescription
This script creates a screener with a list of ETFs ordered by their average ROC in three different periods representing 4, 6 and 8 months by default. The ETF
BIL
is always included as a reference.
The previous average ROC value shows the calculation using the closing price from last month.
The current average ROC value shows the calculation using the current price.
The previous average column background color represents if the ETF average ROC is positive or negative.
The current average column background color represents if the ETF average ROC is positive or negative.
The current average column letters color represents if the current ETF average ROC is improving or not from the previous month.
Changes from V2 to V3
Added the option to make the calculation monthly, weekly or daily
Changes from V3 to V4
Adding up to 25 symbols
Highlight the number of tickers selected
Highlight the sorted column
Complete refactor of the code using a matrix of arrays
Options
The options available are:
Make the calculation monthly, weekly or daily
Adjust Data for Dividends
Manual calculation instead of using ta.roc function
Sort table
Sort table by the previous average ROC or the current average ROC
Number of tickers selected to highlight
First Period in months, weeks or days
Second Period in months, weeks or days
Third Period in months, weeks or days
Select the assets (max 25)
Usage
Just add the indicator to your favorite indicators and then add it to your chart.


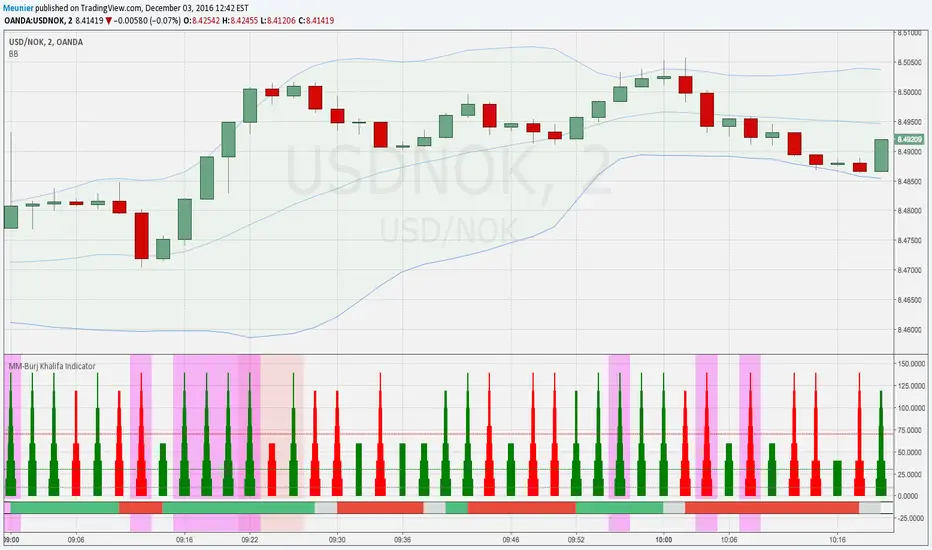
MM-Burj Khalifa Indicator
This indicator uses several signals to visualize a "perfect candle" to enter a trade.
It colors the background to identify the zones of interest (multiple configurable high or low RSI zones). Underlying is a trendbar with the current MACD direction. It's possible to tweak the indicator with a lot of options in the settings section (e.g. for which period you want a rising DM+-signal, etc.)
The indicator is using signals of:
--MACD
--RSI
--PVT
--ATR
--AD and DMI+/DMI-
When all 7 criterias are met it highlights the candle.
It also creates different colums with different height and width, so that you can see which signal is OK and which is maybe missing. When all signals are on GO you'll see a Burj-Khalifa-like figure. If not all signals are on GO you'see crippled versions.
To be clear:
it's not intended to detect trends or supertrends or reversals. It's purpose it's just to decide if this current candle is really going in the right direction. It doesn't prevent upcoming reversals in the opposite direction.
The Burj-Khalifa indicator could help to confirm the entry point of an trade which was already planned.
I'll come up with a more detailed documentation.
MM-Burj Khalifa IndicatorThis indicator uses several signals to visualize a "perfect candle" to enter a trade.
It colors the background to identify the zones of interest (multiple configurable high or low RSI zones). Underlying is a trendbar with the current MACD direction.
The indicator is using signals of:
--MACD
--RSI
--PVT
--ATR
--AD and DMI+/DMI-
When all 7 criterias are met it highlights the candle.
It also creates different colums with different height and width, so that you can see which signal is OK and which is maybe missing. When all signals are on GO you'll see a Burj-Khalifa-like figure. If not all signals are on GO you'see crippled versions.
To be clear:
it's not intended to detect trends or supertrends or reversals. It's purpose it's just to decide if this current candle is really going in the right direction.
The Burj-Khalifa indicator could help to confirm the entry point of an trade which was already planned.

Dix$ons Tackle BoxDixsons Tackle Box — Multi-Tool Trend & Levels Suite (MA/EMA + VWAP + BB + Adaptive Trend Channels + Auto Fibs)
---
**Dixsons Tackle Box** is an all-in-one overlay for traders who want a clean chart with *stacked edge* instead of stacked indicators.
It combines:
* A **5-slot MA/EMA pack** with live slope % labels and MTF smoothing
* A **full VWAP engine** with event-based anchors, trend angle coloring, and VWAP bands
* **Bollinger Bands** with volatility-aware coloring and optional gradient background
* A **Short-Term & Long-Term Adaptive Trend Channel (ATC)** with automatic period detection, log-regression channels, and performance tables
* A **Dixson Auto Fibonacci suite**: ATR-based “rail” Fibs + Lookback Fibs off HH/LL, both driving a shared, fully customizable Fib bank
Everything is controlled logically by feature groups under the **“Tackle Box”** section, so you can quickly turn modules on/off and tune the tool to your style (scalp, intraday, swing, or position).
> **Important:** This is an analysis/visualization tool only. Nothing here is financial advice or an automatic trading system. Always test and manage risk yourself.
---
## 1. MA/EMA Pack — 5 Smart Averages with Slope %
**Group:** `Tackle Box` + per-slot groups `MA/EMA 1` … `MA/EMA 5`
**Main toggle:** `Enable MA's`
**Per-slot master row:** `_maRow1` … `_maRow5`
### What it does
This module gives you **five independent MA/EMA slots**, each with:
* Its own **type** (MA or EMA)
* **Length**, **color**, **line width**, and **plot style** (`Solid`, `Step`, or `Circles`)
* **Timeframe per slot** (MTF)
* Rich **label controls** (slope %, length/type text, timeframe text, etc.)
* **Label size** per slot (`tiny → huge`)
On top of that, each average has a **live slope % readout**, normalized by instrument tick size, so you can compare trend steepness across assets.
### Key features
* **Master slot row (1–5):**
In the `Tackle Box` group you have `_maRow1`–`_maRow5` toggles. These gate each slot globally, so you can quickly show/hide specific MAs without digging into each slot.
* **MTF Smoothed Mode:**
* `MTF Smoothed Mode` (on by default) makes higher-timeframe MAs **update only when the HTF bar closes (and on the last bar)**.
* That reduces the stair-stepping noise you often get when pulling HTF data onto an LTF chart, while still giving you accurate levels and a smooth, tradeable line.
* **Per-slot label text controls:**
Each MA group has toggles to control exactly what the label shows:
* `Show Label` – show/hide label entirely
* `Slope` – append slope % to the label
* `Len+Type` – show e.g. `50EMA` or `200MA`
* `TF` – show HTF name if the slot is on an MTF
* `'slope' text` – optionally include the word `slope` in the label
* **Slope % (angle) logic:**
Slope for each MA uses a normalized **“angle %” in **, based on the 1-bar change vs `syminfo.mintick`.
* Big positive values = strong uptrend
* Big negative values = strong downtrend
* Near zero = flat/neutral
This makes it easy to build rules like:
* “Only trade long if the **50EMA slope** is above +20% and price is above VWAP”
* “Take profit if slope on my faster MA collapses back toward 0.”
### Typical use
* Slot 1–2: **fast intraday EMAs** (e.g., 9 / 20 EMA)
* Slot 3–4: **structural EMAs/MAs** (e.g., 50 / 200)
* Slot 5: a **dedicated MTF trend filter** (e.g., 5-minute or 1-hour EMA on a 1-minute chart)
---
## 2. VWAP Engine + Bands — Anchor-Aware, Angle-Aware VWAP
**Group:** `Enable VWAP` + `------ VWAP Settings ------`, `Bands Settings`, `Color Settings`
### Core VWAP
* **Anchors:**
`Anchor Period` lets you choose where each VWAP reset starts:
* `Session` (day session VWAP, perfect for intraday)
* `Week`, `Month`, `Quarter`, `Year`, `Decade`, `Century`
* Corporate events: `Earnings`, `Dividends`, `Splits`
This lets you build VWAP logic around:
* **Intraday mean reversion** (Session VWAP + bands)
* **Swing anchor VWAPs** (Weekly/Monthly)
* **Event-based anchors** (earnings/dividend/split reaction)
* **Hide on DWM:**
`Hide VWAP on 1D or Above` lets you keep intraday VWAP from cluttering higher-TF charts.
* **Angle/Trend Detection:**
The VWAP engine computes a **regression slope** over each anchor segment and converts it to an **angle %**:
* `Angle Lookback (bars)` controls how many bars are used
* `Angle Trend Threshold (%)` sets the threshold where a slope is considered “trending”
With `Color VWAP by Trend` enabled:
* Uptrend > threshold → VWAP turns **trend up color** (e.g., lime)
* Downtrend < −threshold → VWAP turns **trend down color** (e.g., red)
* Inside threshold → VWAP uses a neutral color
You can also set separate **line widths** for neutral vs trend state and transparency to give a “Hull-style” visual feel.
* **VWAP Labels:**
You get a single, de-duplicated VWAP label on the last bar with:
* Optional **name** (`VWAP`)
* Optional **price** (`$xxx.xx`)
* Optional **angle %** and optional `"slope"` word
* Global **label size** for VWAP + bands
### VWAP Bands
* **Calc modes:**
`Bands Calculation Mode`:
* `Standard Deviation` – classic VWAP ± n * σ
* `Percentage` – bands as a fixed % of VWAP
* **Bands 1-3:**
Each band has:
* Visibility toggle, independent multiplier (`×`)
* Separate **upper/lower colors** per band
* Optional **fill** between upper/lower for each band
* Label toggles:
* `Show All Labels`
* `Show Band #X Label`
* `Band Labels: Show Names` (VWAP+1, VWAP-1, etc.)
* `Band Labels: Show Prices`
This lets you configure anything from a minimalist “just VWAP + 1 band” view to a full 3-band ladder.
### VWAP Highlight Fill
* **Premium/discount shading**:
Optional fill that shades:
* Region **above VWAP** when price is above (e.g., greenish)
* Region **below VWAP** when price is below (e.g., reddish)
This makes it extremely easy to see when price is trading at **premium vs discount** relative to the current anchor VWAP.
### Typical use
* Intraday scalpers: Session VWAP + 1–2 bands + highlight fill
* Swing traders: Weekly/Monthly VWAP + only the main line and label
* Event traders: Earnings-anchored VWAP, tracking post-earnings drift
---
## 3. Bollinger Bands — Volatility-Aware BB with Gradient Fill
**Group:** `Enable Bollinger Bands` + `------ Bollinger Band settings ------`
### What it adds
A clean Bollinger Band overlay designed to play nicely with the VWAP/MA stack:
* `Bollinger Bands Length` (default 20)
* `Bollinger Bands Multiplier` (default 2.0)
* `BB Basis Color` & **line width**
* Upper/lower bands colored based on **width change**:
* Expanding volatility → `BB Expanding Color`
* Contracting volatility → `BB Contracting Color`
You can also toggle:
* `Show Center Line MA Label` – prints something like `20ma` on the last bar.
* `Enable Gradient Background Fill` – draws a gradient between price and the bands:
* `Gradient Fill Up Color` for below-price fill
* `Gradient Fill Down Color` for above-price fill
### Why it’s unique here
Instead of just static bands, this implementation **flags volatility regimes** (expansion vs contraction) via color and optional gradient. That pairs nicely with ATR Fibs and VWAP:
* Use **BB contraction (squeeze)** + flat VWAP angle to anticipate breakouts.
* Use BB + VWAP bands to filter which “touches” are genuinely overextended.
---
## 4. Dixson Adaptive Trend Channel (ATC) — Short-Term & Long-Term Log Channels
**Master toggle:** `Enable Adaptive Trend Channel`
**Groups:** `------ Dixson ATC Settings ------`, `Short-Term Channel Settings`, `Long-Term Channel Settings`, `Short-Term Midline Settings`, `Long-Term Midline Settings`, `Channel Trend Background Fill Settings`, `Short-Term Table Settings`, `Long-Term Table Settings`
### Under the hood
ATC is a **log-scale regression channel engine** that automatically:
1. Scans a set of candidate periods.
* **Short-term:** 20 → 200 bars
* **Long-term:** 300 → 1200 bars
2. For each period, it computes:
* Log-price regression slope & intercept
* Standard deviation of residuals
* A Pearson-style R value (trend “strength”)
3. Picks the period with the **highest correlation (|R|)** and uses that as the **detected trend length**.
This yields a **data-driven channel** that adapts to whatever trend the market is actually respecting.
> For long-term stats, annualized return only makes sense on **daily/weekly** charts. On intraday charts, treat the “Annual Return” purely as informational.
### Short-Term Channel
Controls in `Short-Term Channel Settings` + `Short-Term Midline Settings`:
* `Show Short-Term Channel` – on/off
* `Deviation Multiplier (Short-Term)` – how wide the channel is (in standard deviations)
* **Upper/Lower colors**, line width, style (Solid/Dotted/Dashed), transparency
* `Line Extension Style` – Extend Right / Extend Both / Extend None / Extend Left
Optional **Short-Term Midline**:
* Toggle + color, style, width, transparency
* Tracks the regression line itself (center of the channel)
Background fill:
* `Enable ST Background Fill` with separate **ST Uptrend** / **ST Downtrend** colors
* Trend direction is inferred from regression slope sign
### Long-Term Channel
Mirrors the ST controls with its own group:
* `Show Long-Term Channel`
* `Deviation Multiplier (Long-Term)`
* Upper/Lower channel colors, thickness, style, transparency
* `Line Extension Style`
* Optional Long-Term midline + colors/styles
* Optional **background fill** with separate colors for up vs down
You can run **both channels at once**, giving a panel of:
* **Macro trend structure** (Long-Term ATC)
* **Current swing trend** (Short-Term ATC)
* MAs, VWAP, and Auto Fibs on top for entries/exits
### Trend Info Tables
Each channel has its own table options:
* `Show Detected Period` (bars used)
* `Show Trend Strength` – either:
* Descriptive text: “Extremely Weak” → “Ultra Strong”, or
* Raw Pearson R value if `Show Pearson R` is enabled
* `Show Annualized Return` (when timeframe is daily/weekly)
* Table position (`Top Left`, `Bottom Right`, etc.)
* Text size (`Small`, `Normal`, `Large`)
These tables quantify:
* Over what lookback the trend is being measured
* How “clean” that trend is
* What the approximate annualized performance of that trend has been
---
## 5. Dixson Auto Fibonacci Suite — ATR Fibs + Lookback Fibs + Shared Fib Bank
**Master toggle:** `Enable Auto Fibonacci`
**Groups:** `Dixson Auto Fibonacci`, `ATR Auto Fib`, `Previous ATR Fib`, `Lookback Auto Fib`, `Lookback Anchor Overrides`, `Fibonacci Levels`
You get **two separate engines** (ATR-based and Lookback-based) that both draw from the **same customizable Fib bank**, with optional log scaling.
---
### 5.1 Global Auto Fib Settings
* `Logarithmic Scale`
* When ON, Fib levels are interpolated in log-space (better for assets that move in percentages).
* When OFF, interpolation is linear in price.
This applies to **both** the ATR and Lookback engines.
---
### 5.2 ATR Auto Fib (Rail-Based, Supertrend-Driven)
**Groups:** `ATR Auto Fib`, `Previous ATR Fib`
The ATR engine builds **“rails”** that hug price without letting candles touch them, then projects Fib levels between these anchors.
#### How it works
1. Uses built-in `ta.supertrend` with:
* `ATR Period`
* `ATR Multiplier`
2. Builds dynamic **upper and lower rails** around price:
* Uses ATR to define a **proximity gap** (`Proximity (×ATR)`) so rails stay **just outside the wicks** (no-touch behavior).
* Smooths raw highs/lows slightly (RMA) to avoid spiky rails.
* Ensures the upper rail is always ≥ high+gap and lower rail ≤ low−gap.
3. The **direction** (uptrend/downtrend) is inferred from the Supertrend direction:
* On trend flips, the script:
* Captures the prior rail pair as a **“previous segment”**
* Starts a new rail segment in the new direction
4. From these rails, the script draws **directional Fib “ladders”**:
* For the **current ATR Fib**:
* The Fib is drawn from one anchor to the other depending on the trend sign.
* Rays are projected `Ray Length` bars to the right of `Current Offset`.
* For the **previous ATR Fib**:
* The last completed segment’s start/end rails are used as anchors
* Rays are projected using `Prev Fib Offset` and `Prev Fib Length`
#### Current ATR Fib controls
* `Enable ATR Fib` – toggles current ATR Fib bank
* `ATR Period`, `ATR Multiplier` – control the “engine” behind the rails and ST logic
* `Current Offset`, `Ray Length` – where and how far rays are drawn
* `Show Level Text`, `Show Price`, `Display % not ratio` – label style
* `Label Size (Current ATR Fib)` – for all current ATR Fib labels
Visual extras:
* `Plot Hi/Low Anchor Lines` – shows upper/lower rails
* `Plot ATR Trailing Stop` – shows clamped Supertrend as a continuous line
#### Previous ATR Fib controls
* `Enable Prev ATR Fib` – toggles previous segment ladders
* Independent `Prev Fib Offset`, `Prev Fib Length`
* Separate label controls:
* `Show Level Text (Prev)`
* `Show Price (Prev)`
* `Display % not ratio (Prev)`
* `Label Size (Previous ATR Fib)`
Use the **current ATR Fib** as your active trading “ladder” and the **previous ATR Fib** to track recently broken structure and potential retest zones.
---
### 5.3 Lookback Auto Fib — HH/LL-Driven Fib Bank, MTF + Manual Overrides
**Group:** `Lookback Auto Fib` + `Lookback Anchor Overrides`
This engine draws Fibs between **highest high** and **lowest low** within a given lookback window on a chosen timeframe.
#### How it works
1. Select higher timeframe:
* `Lookback Timeframe` (empty = chart timeframe)
2. Choose your range:
* `Lookback Bars` – number of bars on the selected TF to scan for extremes
3. Optionally allow look-ahead:
* `Look-ahead Bars (repainting)`
* `0` = no look-ahead (no forward info, no repainting)
* `>0` = uses `barmerge.lookahead_on` for forward-looking extremes (can repaint)
4. For that range, the script finds:
* Highest high + its bar offset
* Lowest low + its bar offset
5. Trend direction is determined by **which extreme is more recent**:
* Recent high → **down** direction (high → low)
* Recent low → **up** direction (low → high)
6. Manual direction overrides:
* `Force Uptrend` / `Force Downtrend` – override the auto decision
7. Manual anchor overrides:
* `Manual Anchor High (LB)`
* `Manual Anchor Low (LB)`
If both are set, those become the anchors and direction is deduced from which is higher.
8. The engine then draws a **directional Fib ladder**:
* Anchors between high/low based on direction
* Rays extend `Lookback Fib Length` bars from `Lookback Fib Offset`
#### Label controls
* `Show Level Text`, `Show Price`, `Display % not ratio`
* `Label Size (Lookback Fib)`
* Labels are prefixed with `LB` to distinguish them from ATR Fibs.
This engine is ideal for:
* **Swing structure mapping:** Drawing Fibs across the last major swing on the HTF.
* **Confluence:** Aligning Lookback Fibs with ATR Fibs, ATC channel boundaries, and VWAP bands.
---
### 5.4 Shared Fibonacci Levels — Fully Custom Fib Bank for Both Engines
**Group:** `Fibonacci Levels`
The ATR and Lookback engines **both** use the same Fib bank:
* **Ratios provided by default:**
* 0.000
* 0.146
* 0.236
* 0.382
* 0.500
* 0.618
* 0.650
* 0.707
* 0.786
* 0.886
* 1.000
* 1.130
* 1.272
* 1.618
* 2.000
Each ratio has its own:
* `Enable Level X.XXX`
* `Level X.XXX` (the actual ratio – fully editable)
* `Thickness X.XXX` (line width)
* `Style X.XXX` (Solid / Dashed / Dotted)
* `Color X.XXX` (line + label color)
Adjusting a level here **instantly updates both** ATR and Lookback ladders. This makes it very easy to:
* Run “standard” Fib sets for classic retracements
* Or define your **own Fib presets** (e.g., 0.25 / 0.5 / 0.75, or custom extension clusters)
---
## How to Use & Suggested Workflows
**Scalpers / 0DTE / Intraday:**
* Enable:
* MA/EMA pack (fast EMAs + one MTF slot)
* VWAP (Session anchor) + 1–2 VWAP bands + highlight fill
* ATR Auto Fib (current + previous)
* Optionally hide:
* Lookback Fibs
* Long-Term ATC (unless you want HTF bias on your intraday chart)
Use slope labels, VWAP angle %, and ATR Fib ladders to structure trades around pullbacks, mean reversion, and breakouts.
**Swing / Position traders:**
* Turn on:
* Long-Term ATC (with table)
* Short-Term ATC for swing structure
* Lookback Auto Fib on a higher timeframe (e.g., D on 4H chart)
* Keep VWAP anchored to Week or Month, and MA slots for key reference MAs.
Use ATC channels for **trend structure**, Lookback Fibs for **swing levels**, and long VWAPs for **value zones**.
---
## Final Notes & Disclaimer
* Works on **all symbols** and **all timeframes**, but some stats (like “Annualized Return”) are only meaningful on **daily/weekly** data.
* Some options (like Look-ahead mode for Lookback Fibs) can **repaint** on purpose. These are clearly labeled — use them only if you understand and want forward-looking behavior.
* This script does **not** place trades. It is a visual / analytical tool only.
* Nothing in this indicator or description is financial advice. Always do your own research, forward-test, and manage risk appropriately.
If you have **invite-only access** to **Dixsons Tackle Box**, you’re getting the full Dixson overlay stack in one place — designed to be the central “hub” for your chart, not just another line on it.

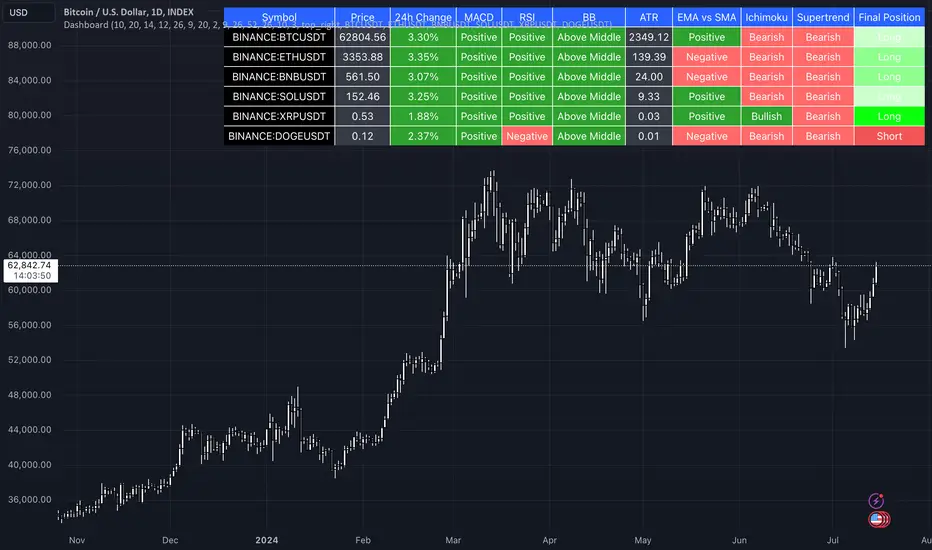
All-in-One India v21. **Overview**: Multi-indicator strategy for NSE index options (NIFTY/BANKNIFTY) tracking CE/PE premiums as a synthetic asset (straddle or single-leg) on TradingView.
2. **Setup**: Input index, expiry (e.g., 21-08-24), strikes (e.g., 50800 CE/PE). Choose "Combined" for straddle premium or single option.
3. **Data**: Fetches OHLCV for options; plots premium as candlesticks (green up, red down).
4. **Indicators** (toggleable): EMA (7/12 cross), Supertrend (ATR7, factor2), VWAP (daily reset), RSI (7-period, 80/20 levels), SMA (7-period).
5. **Signals**: Buy/Sell on crosses/flips (e.g., EMA fast> slow for buy; one per day/direction). Multi-indicator: Sequential AND logic (best with 1 enabled).
6. **Buy Logic**: EMA cross up, Supertrend to up (-1), premium>VWAP/SMA, RSI>80 (momentum tweak).
7. **Sell Logic**: Opposite crosses/flips (e.g., EMA cross down, Supertrend to down +1, RSI<20).
8. **Trading**: Long premium on buy (volatility play); short on sell (decay). No exits—use opposite signal or targets.
9. **Visuals/Alerts**: Shapes for signals; lines for indicators; alerts on buy/sell.
10. **Tips**: Test intraday near expiry; ATM strikes; risk 1-2%; tweak RSI if needed.

Futures Momentum Scanner – jyoti//@version=5
indicator("Futures Momentum Scanner – Avvu Edition", overlay=false, max_lines_count=500)
//------------------------------
// USER INPUTS
//------------------------------
rsiLen = input.int(14, "RSI Length")
macdFast = input.int(12, "MACD Fast")
macdSlow = input.int(26, "MACD Slow")
macdSignal = input.int(9, "MACD Signal")
stLength = input.int(10, "Supertrend Length")
stMult = input.float(3.0, "Supertrend Multiplier")
//------------------------------
// SUPER TREND
//------------------------------
= ta.supertrend(stMult, stLength)
trendUp = stDirection == 1
//------------------------------
// RSI
//------------------------------
rsi = ta.rsi(close, rsiLen)
rsiBull = rsi > 50 and rsi < 65
//------------------------------
// MACD
//------------------------------
= ta.macd(close, macdFast, macdSlow, macdSignal)
macdBull = macd > signal and macd > 0
//------------------------------
// MOVING AVERAGE TREND
//------------------------------
ema20 = ta.ema(close, 20)
ema50 = ta.ema(close, 50)
ema200 = ta.ema(close, 200)
trendStack = ema20 > ema50 and ema50 > ema200
//------------------------------
// BREAKOUT LOGIC
//------------------------------
prevHigh = ta.highest(high, 20)
breakout = close > prevHigh
//------------------------------
// FINAL SCANNER LOGIC
//------------------------------
bullishCandidate = trendUp and rsiBull and macdBull and trendStack and breakout
//------------------------------
// TABLE OUTPUT FOR SCANNER FEEL
//------------------------------
var table t = table.new(position.top_right, 1, 1)
if barstate.islast
msg = bullishCandidate ? "✔ BUY Candidate" : "– Not a Setup"
table.cell(t, 0, 0, msg, bgcolor=bullishCandidate ? color.new(color.green, 0) : color.new(color.red, 70))
//------------------------------
// ALERT
//------------------------------
alertcondition(bullishCandidate, title="Scanner Trigger", message="This stock meets Avvu's futures scanner criteria!")

EMA+SuperThis indicator integrates multiple trend-following components into a unified, clean, and easy-to-interpret chart overlay. Its purpose is to help traders observe short-term and long-term trend direction, momentum shifts, and potential areas of interest using established moving-average and volatility-based techniques.
🔹 Features
1. Multi-EMA Framework
Plots the 9, 21, 50, 100, and 200 EMAs to provide a structured view of short, medium, and long-term market trends.
2. Supertrend Overlay
Applies an ATR-based Supertrend to visualize potential directional shifts.
Both uptrend and downtrend zones are lightly shaded for improved clarity.
3. NovaWave-Style Trend Cloud
A dynamic cloud formed from:
Fast EMA
Slow EMA
Signal MA
The cloud automatically adapts its color based on the relationship between the fast and slow EMAs, offering a quick visual read of momentum bias.
4. Displaced Moving Averages (20 / 50 / 200 DMA)
Includes optional forward displacement to replicate commonly used DMA models in trend-following systems.
5. Crossover Buy/Sell Signals
Buy and sell markers appear when the fast EMA crosses above or below the slow EMA.
Users may create custom alerts via the TradingView alerts panel.
🔹 Alerts
This indicator supports built-in EMA crossover alerts:
Buy Alert – triggered when the fast EMA crosses above the slow EMA
Sell Alert – triggered when the fast EMA crosses below the slow EMA
Users can enable these alerts through the “Add Alert” panel and select the corresponding alert condition.
Alerts are evaluated on bar close for consistency and do not repaint.
🔹 How to Use
EMA structure helps define directional bias and market phase.
The Supertrend and Trend Cloud offer contextual confirmation.
EMA crossovers can help highlight momentum changes.
DMAs provide an additional perspective on smoothed trend levels.
This tool is intended for visual analysis and can complement other approaches such as volume studies, higher-timeframe trend analysis, or support/resistance mapping.
⚠️ Disclaimer
This script is for educational and informational purposes only. It does not constitute financial advice or guarantee any outcome. Always perform independent analysis and apply proper risk management.

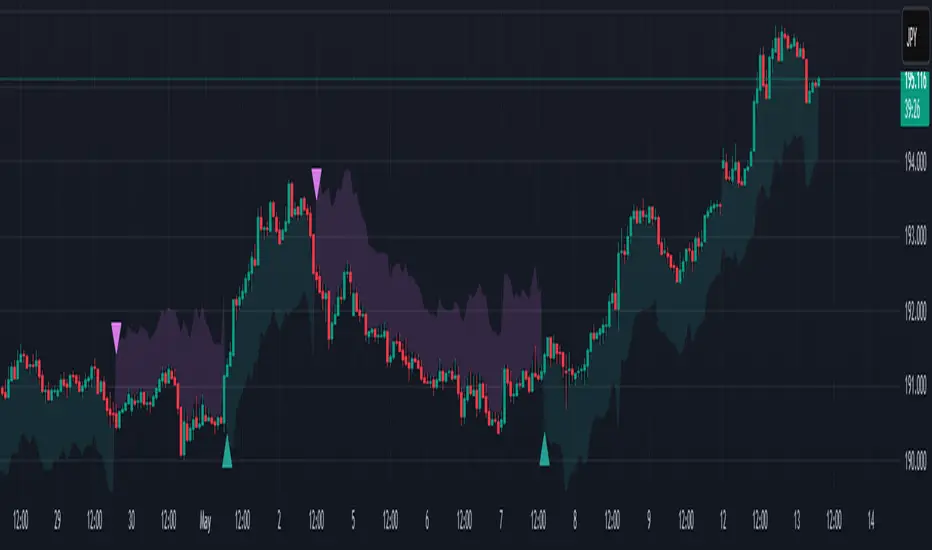
💎 Trend Master Pro Scalping MTFTrend Master Pro Scalping MTF is a professional-grade indicator designed for intraday trading and scalping, optimized for 1M, 5M, and 15M timeframes. It combines multiple technical filters to provide high-confidence breakout and trend signals with visual clarity.
Key Features:
Multi-indicator analysis: EMA, RSI, ATR, SuperTrend, and volume.
Multi-Timeframe (MTF) filter: signals are validated only if the higher timeframe trend is aligned.
Clear visual signals: colored triangles and dynamic labels showing signal strength: A++, A+, A, B.
Confirmation dashboard: instantly see EMA trend, RSI strength, volume, ATR activity, SuperTrend direction, and final signal on your chart.
Reliable alerts: fixed alert messages compatible with TradingView, avoiding Pine Script errors.
Customizable parameters: adjust EMA, RSI, ATR, volume, and SuperTrend settings to match your scalping or day trading style.
How to Use:
Select your desired timeframe: 1M, 5M, or 15M.
Look for signals rated A++ or A+ for maximum probability.
Confirm trends using labels and the dashboard before entering trades.
Receive real-time notifications via alerts when confirmed signals occur.
Benefits:
Ideal for quick scalping and intraday strategies.
Reduces false signals with MTF trend filtering.
Professional visualization for fast and confident decision-making.
Recommendations:
Test on a demo account before trading live.
Adjust parameters to fit your asset and timeframe.
Combine with proper risk management strategies.

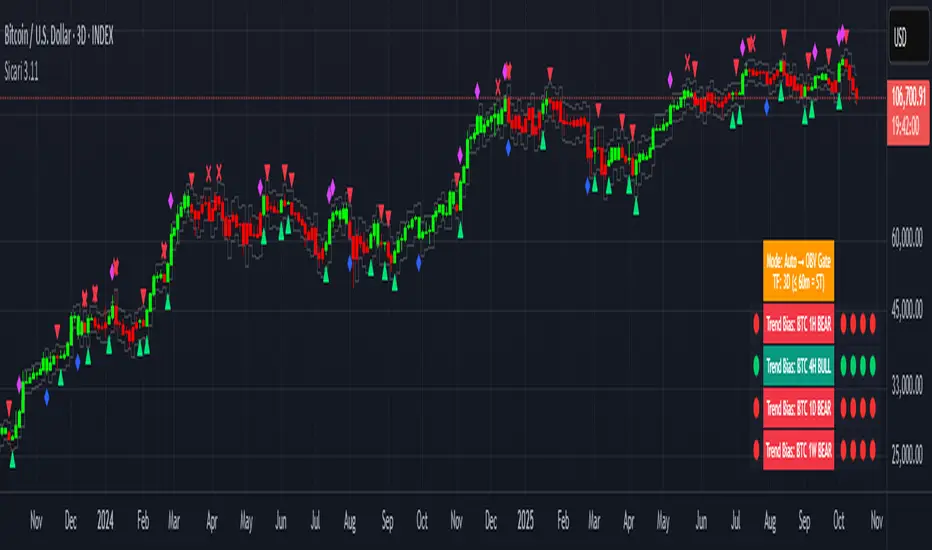
SicariSicari
What is it?
Sicari is a trend-following trading system that identifies potential bullish or bearish trends. It blends EMA trend, OBV participation, and an Adaptive SuperTrend gate (machine-learning k-means over ATR bands) into a strict 2-of-3 confirmation model.
By default, it uses a clean two-colour scheme: 🟢 green = long bias and 🔴 red = short bias.
Optionally, a four-colour mode exposes hedge and early-risk conditions.
Sicari works across all asset classes and timeframes (recommended: 15-minute to monthly).
How it works
* Auto mode adapts by timeframe: ≤60m uses a Hard-Gate where SuperTrend must confirm to flip; >60m uses Majority mode where OBV carries more weight for faster reversals
* Voters are EMA, OBV, and Adaptive SuperTrend; a flip requires 2 of 3 agreement (Hard-Gate also needs ST)
* Optional four-colour candles highlight hedge state when voters disagree. The hedge direction is OBV-led (↑ / ↓ tint), helping you trim risk or wait for full confirmation.
* Multi-Timeframe Trend Bias panel (1H, 4H, 1D, 1W): left dot = live bias for that TF; Four dots on the right show = last four closed bars (newest on right). In 4-colour mode, the left/current dot follows 4-colour logic, history dots remain 2-colour for stability. Compact mode optionally shows only current dots per TF.
What you can plot
* Candles: two-colour by default (🟢 long / 🔴 short); optional 4-colour hedge mode (OBV-led ↑/↓ tint).
* Triangles: mark long/short flips.
* Multi-Timeframe Trend Bias panel: 1H / 4H / 1D / 1W
* VWAPs: Session + Weekly VWAP for fair-value anchoring.
* Moving Averages: Daily 20/50 (non-repainting) and Weekly 20/50/100 stair-step MAs for structure.
* Dynamic ATR Stops: step-line long/short stop bands for risk control and stopped-out detection.
* RSI Take-Profit markers: X-shaped markers on the chart TF (touch / re-entry logic)
* 4H RSI Diamonds: non-repainting diamonds confirming on 4H close
Combined Asset Volume (crypto-aware)
* One toggle aggregates spot volume across major venues
* Majors (BTC/ETH): Binance + Coinbase + Bitfinex + Kraken (USD/USDT/USDC)
* Alts: Binance + Bybit + KuCoin + Coinbase (lean, USDT/USD)
* CRYPTOCAP indexes, non-crypto or FX pairs automatically fall back to the chart’s own volume
* OBV has a unit-volume fallback when volume data is missing
Alerts (programmatic or traditional)
* Programmatic (recommended): Create one alert → “Any alert() function call”. This single alert respects your chosen settings (asset, timeframe, 2/four-colour mode, RSI levels, chop/flip cooldown, stops on/off, etc.) and fires for all enabled conditions once-per-bar-close. Long/short signals trigger only at flips, not every bar.
* Traditional: add specific alerts only for what you want (entries, exits, etc.)
Alert list (fires on bar close)
* 🚀🟢 LONG entry
* 🔻🔴 SHORT entry
* 🟡 HEDGE LONG (four-colour mode)
* 🟠 HEDGE SHORT (four-colour mode)
* 🎯 Take Profit Long (RSI-based)
* 🎯 Take Profit Short (RSI-based)
* 💥🔴 HTF Super SHORT (4H RSI diamond)
* 🚀🟢 HTF Super LONG (4H RSI diamond)
* 💀 Stopped Out of Short (dynamic ATR stop)
* 💀 Stopped Out of Long (dynamic ATR stop)
Programmatic alerts include tick-aware thousands separators and VWAP references on intraday charts for mobile readability
Setup & tips
* After adding Sicari: Click the three dots next to the script name → Visual order → Bring to front. This hides the original candles so Sicari’s candles are fully visible
* Keep Auto mode ON; enable 4-colour only if you want hedge awareness; toggle VWAPs and MAs as structure guides
* Works on crypto, indices, FX and equities - any symbol, ny timeframe
* Use standard candles (not Heikin Ashi)
* Colours optimised for dark backgrounds
Sicari distills trend, participation, and structure into one adaptive stream - delivering institutional-grade precision, clarity, and timing within the Sicari ecosystem.
RK Scalper V1.0Version 1.0
Scalper Indicator
Use multiple options to decide the best possible scalping possibilities on 1, 3, 5 and 15 min timeframes
1. 3 different EMA trend lines to decide direction and reversal; option to include EMA crossover to take entry and exit positions
2. Show signal when price cross VWAP with huge volume
3. Show SuperTrend and identify possible reversal when price touches the SuperTrend line
4. Show VWAP line
5. Show SuperTrend VWAP crossover with an option to either include volume spike or not
6. Show VWMA line to decide exit points when price moves below at buy and above at sell positions
7. Show Open=High / Open-Low to see the buy and sell pressure and buyer seller dominance
8. Show Volume spike indication on Volume for NIFTY, BANK NIFTY and MIDCAP NIFTY futures volume on their respective underlying asset
9.
Note: It is batter to use scalp indicator along with trend and momentum indicators to have better results.

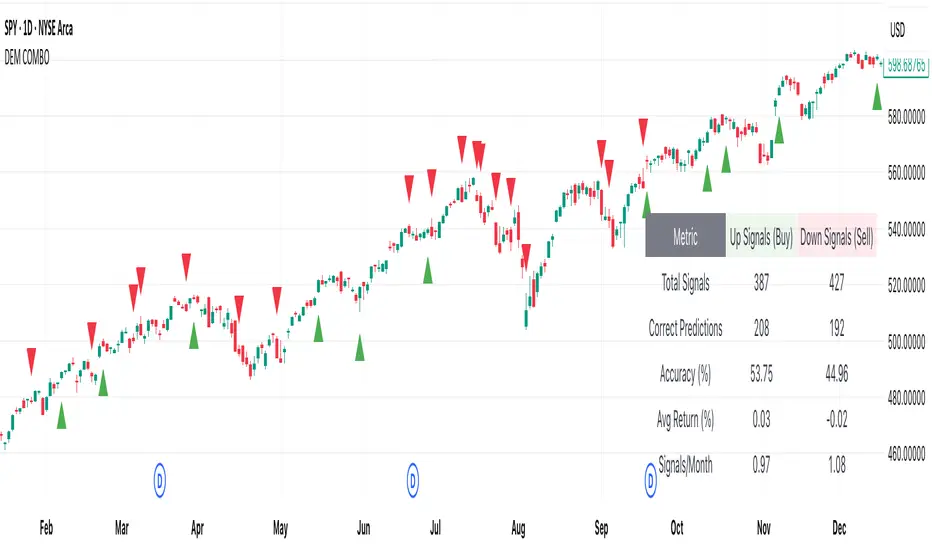
[DEM] Combo Signal (With Backtesting) Combo Signal (With Backtesting) is designed to generate buy and sell signals by combining seven different trading strategies that incorporate multiple technical indicators including SuperTrend, Parabolic SAR, MACD, and RSI. It also includes a comprehensive backtesting framework to evaluate the historical performance of these signals. The indicator overlays directly on the price chart, plotting signals and displaying performance statistics in a table. The strategy triggers buy signals when any of seven long conditions are met (including ATR-based reversal patterns, SuperTrend confirmations, RSI oversold crossovers, MACD bullish crossovers, and SuperTrend line breaks), while sell signals are generated when any of the corresponding seven short conditions occur, creating a multi-faceted approach that aims to capture various market conditions and trading opportunities while tracking signal accuracy, average returns, and signal frequency through its integrated backtesting system.
NEO CLOUD + Kinetic Compass CombinedThis is a comprehensive technical analysis indicator combining three powerful trading systems:
📊 NEO CLOUD System:
- Trend identification system based on dual EMA range filters
- Provides dynamic cloud fill for intuitive trend direction and strength visualization
- Supports Fast/Normal/Slow trend length settings
- Fully customizable colors including cloud fill and signal arrows
🧭 KINETIC COMPASS System:
- Modified trend indicator based on EMA100 for high-precision trend tracking
- Dual-layer exit signal system to optimize exit timing
- Integrated EMA50/100/200 multi-timeframe confirmation
- Gradient fill effects for clear support/resistance visualization
- Independent control over buy/sell signals and exit signals display
📈 DUAL SUPERTREND System:
- Two independent Supertrend indicators with separate parameters
- Selective display control - show one, both, or neither
- Dynamic support/resistance lines that adapt to market volatility
- Adjustable transparency fill areas
🚀 Combined Features:
- MEGA Alerts: Super alerts triggered when multiple systems align
- Independent Switches: Each system can be enabled/disabled separately
- Color Customization: Full personalization of all visual elements
- Candle Coloring: Support for NEO or Kinetic candle coloring schemes
- Signal Filtering: Choose to show or hide various types of trading signals
💡 Usage Recommendations:
- Beginners: Start with single system, then combine after familiarization
- Trend Trading: Focus on NEO CLOUD direction and Kinetic trend lines
- Scalping: Use exit signals and Supertrend for precise entry/exit points
- Signal Confirmation: Wait for multiple system alignment for higher success rate

NeuroFlow Pro IndicatorThe **NeuroFlow Pro Indicator** is a comprehensive technical analysis tool designed for traders on the TradingView platform. It provides actionable buy and sell signals by combining multiple technical indicators, including Moving Averages, MACD, RSI, Stochastic RSI, SuperTrend, Ichimoku Cloud, Bollinger Bands, and Volume analysis. The indicator generates a **Composite Score** (0–100) that reflects market conditions, with low scores indicating bullish opportunities and high scores suggesting bearish conditions. It also identifies key trend reversal points and significant EMA crossovers (Golden Cross and Death Cross) to help traders make informed decisions.
**Key Features**:
- **Composite Score**: Aggregates signals from multiple indicators to provide a single, easy-to-read metric.
- **Buy/Sell Signals**: Generates clear signals for potential long (buy) and short (sell) opportunities.
- **Golden/Death Cross**: Marks EMA 50 crossing above (🚀) or below (💀) EMA 200, indicating major trend shifts.
- **Dashboard**: Displays real-time metrics like trend direction, momentum, volume, and signal confidence.
- **Customizable Alerts**: Notifies users of buy/sell signals, divergences, and EMA crossovers via TradingView’s alert system.
- **Multi-Timeframe Analysis**: Incorporates higher timeframe trends for enhanced signal reliability.
- **Candlestick Patterns**: Optionally includes patterns like Hammer, Engulfing, or Morning Star for signal confirmation.
This indicator is ideal for traders seeking a robust, all-in-one tool to identify trading opportunities across various markets (e.g., crypto, stocks, forex) and timeframes (e.g., 1H, 4H, daily).
User Guide for NeuroFlow Pro Indicator
Understanding the Indicator
- **Dashboard**:
- Located on the chart (left or right, configurable), it shows real-time metrics:
- **Comp Score**: Composite Score (0–100); low (<30) is bullish, high (>70) is bearish.
- **Trend**: Bullish, Bearish, or Neutral
- **MTF Trend**: Trend from a higher timeframe (e.g., 60m or 240m).
- **Momentum**: RSI and Stochastic RSI-based momentum (Bullish, Bearish, Neutral).
- **MFI**: Money Flow Index (Inflow, Outflow, Neutral).
- **Volatility**: High or Low based on ATR and Bollinger Bands.
- **Volume**: High, Low, or Neutral relative to volume MA.
- **Ichimoku**: Bullish, Bearish, or Neutral based on cloud position.
- **ADX Strength**: Strong or Weak trend based on ADX.
- **Divergence**: Bullish, Bearish, or Neutral for RSI/MACD divergences.
- **Reversal**: Bullish or Bearish reversal potential with confidence percentage.
- **Signal Status**: Long (buy), Short (sell), or None.
- **Signal Confid**: Confidence percentage for the current signal.
- **Chart Visuals**:
- **EMA 50 (White)**: Fast-moving average for short-term trends.
- **EMA 200 (Blue)**: Long-moving average for long-term trends.
- **Golden Cross (🚀)**: Green rocket emoji when EMA 50 crosses above EMA 200 (bullish).
- **Death Cross (💀)**: Red skull emoji when EMA 50 crosses below EMA 200 (bearish).
- **Alerts**:
- Configurable for Buy/Sell Signals, Golden/Death Cross, and Bullish/Bearish Divergences.
Configuring Settings
1. **Open Settings**:
- Right-click the indicator’s name on the chart and select “Settings,” or double-click the indicator in the chart’s indicator list.
2. **Key Settings to Customize**:
- **Strategy Settings**:
- **Max ATR Multiplier**: Adjusts sensitivity to volatility (default: 3.0).
- **Main Settings**:
- **Candlestick Pattern**: Choose Hammer, Engulfing, Morning Star, or Custom (default: Hammer).
- **Multi-Timeframe Period**: Set higher timeframe for trend analysis (e.g., 60m, 240m, Daily; default: 60m).
- **Higher Timeframe**: Secondary timeframe for confirmation (default: 240m).
- **Use Candlestick Patterns**: Enable/disable pattern-based signals (default: off).
- **Use Volume Filter**: Require high volume for signals (default: on).
- **Use ADX Filter**: Require strong trend for signals (default: on).
- **Momentum Settings**:
- **RSI/Stochastic/MFI Lengths**: Adjust periods for RSI, Stochastic RSI, and MFI (defaults: 14, 14, 60).
- **EMA Lengths**: Fast (50), Slow (100), Long (200) for trend and crossovers.
- **ATR/ADX Lengths**: Volatility and trend strength periods (default: 14).
- **SuperTrend/Bollinger/Ichimoku Settings**:
- Customize periods and multipliers (defaults: SuperTrend 10/3.0, Bollinger 20/2.0, Ichimoku 9/26/52).
- **MACD Settings**:
- **MACD Preset**: Auto (timeframe-based), 1H (3-10-16), 4H (5-34-21), D (5-15-9), or Custom (default: Auto).
- **Custom MACD Lengths**: Fast (12), Slow (26), Signal (9) for Custom preset.
- **Weights Settings**:
- Adjust weights for trend, momentum, volatility, etc., to prioritize certain indicators (defaults: Trend 1.0, Momentum 0.3, etc.).
- **Threshold Settings**:
- **Bullish/Bearish Reversal Thresholds**: Set score thresholds for reversals (default: 30/70).
- **ADX Threshold**: Minimum ADX for trend strength (default: 20).
- **Signal Thresholds**: Base (70) and alert (80) thresholds for signals.
- **Dashboard Settings**:
- **Position**: Left or Right (default: Right).
- **Show/Hide Metrics**: Enable/disable dashboard rows (e.g., Comp Score, Trend, MFI; all enabled by default except Volatility and Volume MA).
3. **Save Changes**:
- Click “OK” to apply settings. The dashboard and plots update instantly.
Using the Indicator
1. **Interpreting Signals**:
- **Buy Signal (Long)**: Appears when Composite Score is low (≤30), with at least two bullish confirmations . Shown as “Long” in Signal Status with confidence percentage.
- **Sell Signal (Short)**: Appears when Composite Score is high (≥70), with at least two bearish confirmations. Shown as “Short” in Signal Status.
- **Golden Cross (🚀)**: Indicates a bullish trend when EMA 50 crosses above EMA 200. Look for confirmation from Composite Score and Signal Status.
- **Death Cross (💀)**: Indicates a bearish trend when EMA 50 crosses below EMA 200. Confirm with dashboard metrics.
- **Reversal Signals**: Dashboard shows “Bullish” or “Bearish” with a percentage when reversal conditions are met .
2. **Monitoring the Dashboard**:
- Use the dashboard to assess market conditions in real-time.
- Green (bullish), red (bearish), or gray (neutral) colors highlight key metrics.
- Check “Signal Confid” for confidence in buy/sell signals (higher is better, e.g., >60%).
3. **Trading Decisions**:
- Combine signals with your own analysis (e.g., support/resistance, news).
- Use Golden/Death Cross for long-term trend confirmation.
- Avoid trading in high volatility (dashboard: “Volatility: High”) unless experienced
Best Practices
- **Timeframe Selection**:
- Use higher timeframes (e.g., 4H, Daily) for more reliable signals, especially for Golden/Death Cross.
- Lower timeframes (e.g., 5m, 15m) may produce more signals but with higher noise.
- **Confirm Signals**:
- Cross-check buy/sell signals with dashboard metrics (e.g., Trend, MFI, ADX).
- Use Golden/Death Cross as a trend filter rather than a standalone signal.
- **Risk Management**:
- Always use stop-losses and position sizing based on your risk tolerance.
- Avoid trading during high volatility unless part of your strategy.
- **Regular Updates**:
- Monitor TradingView for script updates from the author (KoKalito) to access new features or bug fixes.
Troubleshooting
- **No Signals**:
- Ensure the chart timeframe matches your settings (e.g., 60m for MTF Period).
- Check if filters (Volume, ADX) are too strict; try disabling them.
- **Dashboard Missing**:
- Verify “Dashboard Position” is set to Left or Right.
- Ensure dashboard metrics are enabled (e.g., Show Comp Score).
- **Alerts Not Triggering**:
- Confirm the alert condition is set to “NeuroFlow Pro Indicator” and the correct option (e.g., “Golden Cross Alert”).
- Check TradingView’s “Alerts” panel for errors or expired alerts.
- Reapply the indicator to the chart if it was recently updated.
- **EMA Crosses Not Showing**:
- Zoom in on the chart to see 🚀 (Golden Cross) or 💀 (Death Cross) symbols.
- Ensure EMA 50 and EMA 200 lengths are not identical (defaults: 50, 200).
Support
- **Author**: KoKalito (check TradingView profile for updates or contact info).
- **TradingView Community**: Post questions in the TradingView Pine Script community or forums.
- **Documentation**: Refer to TradingView’s Pine Script v5 documentation for advanced customization.
- **Risk Warning**: Trading involves risk. Use the indicator as a tool, not a guarantee of profits. Always conduct your own analysis and manage risk appropriately.
Happy trading with **NeuroFlow Pro Indicator**! 🚀

Q Squeeze TrendQ Squeeze Trend
A sharp, signal-based trend tool that combines classic SuperTrend mechanics with configurable squeeze breakout logic and momentum confirmation. Built for clean entry points and minimalist charting — perfect for fast setups and real-time alerts.
🔧 Core Features
Configurable Squeeze Breakout Logic
• Detects low-volatility "squeeze" phases using customizable Bollinger Band vs. Keltner Channel logic
• Confirms breakouts only when momentum aligns with directional bias
SuperTrend Confirmation
• Filters noise and validates signals based on ATR-based trend logic
• Adds directional confidence before triggering signals
Alternating Signal Logic
• Ensures only one directional signal is active at a time
• Avoids repetitive entries and improves clarity
Clean Visual Feedback
• Directional arrows on confirmed buy/sell signals
• Optional colored fill between price and signal level
• Lightweight, non-intrusive label system
Real-Time Alerts
• Alerts for confirmed buy and sell setups
• Easy integration with webhooks, bots, or mobile notifications
⚙️ Configurable Inputs
• ATR Period & Multiplier – adjust SuperTrend sensitivity
• Squeeze Length, BB/KC Multipliers – fine-tune compression detection
• Signal Colors – customize arrow and background styling
✨ Highlights
• Designed for fast, visual trading with minimal clutter
• Non-repainting logic, effective across all timeframes
• Pairs well with structure, momentum, and volume strategies
📈 How to Use
• Enter on breakout arrows when trend, momentum, and squeeze align
• Use background fill to track current direction
• Exit on opposite signal, or combine with your own trade management logic
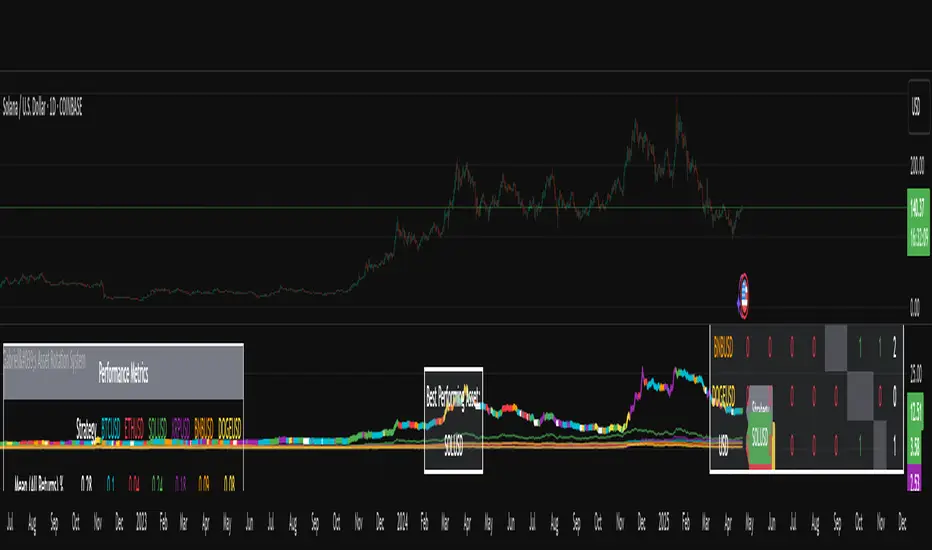
Gabriel's Asset Rotation System📈 Gabriel's Asset Rotation System
Overview
Gabriel’s Asset Rotation System is an advanced multi-asset trend-following tool that dynamically ranks and rotates up to 6 assets (plus USD) based on a customizable trend scoring matrix. Using enhanced signal detection techniques like Cauchy-weighted Supertrend, Jurík RSX, Fisherized CCI, Kalman-filtered PSAR, and Dynamic DMI Smoothing, the system identifies the most dominant asset and simulates strategy equity performance compared to buy-and-hold benchmarks.
🔍 Key Features
✅ Multi-Asset Rotation: Analyze up to 6 symbols and USD simultaneously.
✅ Relative Strength Matrix: Compares every asset against each other to find outperformers.
✅ Custom Trend Engine:
Jurik RSX with advanced RSX logic
Fisherized CCI for momentum confirmation
Kalman-smoothed PSAR for trend bias
SuperTrend using a Cauchy Moving Average
Smoothed DMI signal across looped periods (10–17)
✅ Dynamic Best Asset Detection: Identifies and tracks the asset with the highest trend score over time.
✅ Performance Table: Displays Sharpe, Sortino, and Omega Ratios along with drawdowns and means for both strategy and each asset.
✅ Visual Trend Matrix: Tabular view of asset strength comparisons against each other + final scoring.
✅ Realistic Strategy Equity Curve: Tracks performance assuming full capital rotation into the best asset.
✅ Alerts: Get notified when the top-performing asset changes.
⚙️ Inputs
🔹 Assets: Customize 6 tickers (crypto, stocks, ETFs, etc.)
🔹 Trend Classification Method:
RSI
CCI
SuperTrend
DMI
PSAR
or use all together
🔹 Jurik RSX Length
🔹 Fisherized CCI Length
🔹 Cauchy MA Gamma and ATR Settings
🔹 DMI Range and MA Type (SMA, EMA, HMA, etc.)
🔹 PSAR Parameters with Kalman smoothing
🔹 Custom Backtest Start Date
📊 Outputs
Plot 1: Best Asset Equity (colored dynamically)
Plot 2–7: Buy & Hold Curves for each asset (with labels)
Tables:
Rotation Matrix (bottom-right)
Best Performing Asset (bottom-center)
Performance Metrics Table (optional toggle)
🧠 Use Case Ideas
🔁 Dynamic Portfolio Rebalancing
⚖️ Compare Risk-Adjusted Returns Across Crypto or Stocks
🧪 Backtest Rotation Hypotheses
🚀 Identify Strongest Breakout Assets in Trend Environments
📉 Avoid Weakening Assets with Rising Drawdowns
🚨 Alerts
🔔 "New Optimal Asset": Triggers when a new top-ranking asset replaces the current one.
Ensemble Alerts█ OVERVIEW
This indicator creates highly customizable alert conditions and messages by combining several technical conditions into groups , which users can specify directly from the "Settings/Inputs" tab. It offers a flexible framework for building and testing complex alert conditions without requiring code modifications for each adjustment.
█ CONCEPTS
Ensemble analysis
Ensemble analysis is a form of data analysis that combines several "weaker" models to produce a potentially more robust model. In a trading context, one of the most prevalent forms of ensemble analysis is the aggregation (grouping) of several indicators to derive market insights and reinforce trading decisions. With this analysis, traders typically inspect multiple indicators, signaling trade actions when specific conditions or groups of conditions align.
Simplifying ensemble creation
Combining indicators into one or more ensembles can be challenging, especially for users without programming knowledge. It usually involves writing custom scripts to aggregate the indicators and trigger trading alerts based on the confluence of specific conditions. Making such scripts customizable via inputs poses an additional challenge, as it often involves complicated input menus and conditional logic.
This indicator addresses these challenges by providing a simple, flexible input menu where users can easily define alert criteria by listing groups of conditions from various technical indicators in simple text boxes . With this script, you can create complex alert conditions intuitively from the "Settings/Inputs" tab without ever writing or modifying a single line of code. This framework makes advanced alert setups more accessible to non-coders. Additionally, it can help Pine programmers save time and effort when testing various condition combinations.
█ FEATURES
Configurable alert direction
The "Direction" dropdown at the top of the "Settings/Inputs" tab specifies the allowed direction for the alert conditions. There are four possible options:
• Up only : The indicator only evaluates upward conditions.
• Down only : The indicator only evaluates downward conditions.
• Up and down (default): The indicator evaluates upward and downward conditions, creating alert triggers for both.
• Alternating : The indicator prevents alert triggers for consecutive conditions in the same direction. An upward condition must be the first occurrence after a downward condition to trigger an alert, and vice versa for downward conditions.
Flexible condition groups
This script features six text inputs where users can define distinct condition groups (ensembles) for their alerts. An alert trigger occurs if all the conditions in at least one group occur.
Each input accepts a comma-separated list of numbers with optional spaces (e.g., "1, 4, 8"). Each listed number, from 1 to 35, corresponds to a specific individual condition. Below are the conditions that the numbers represent:
1 — RSI above/below threshold
2 — RSI below/above threshold
3 — Stoch above/below threshold
4 — Stoch below/above threshold
5 — Stoch K over/under D
6 — Stoch K under/over D
7 — AO above/below threshold
8 — AO below/above threshold
9 — AO rising/falling
10 — AO falling/rising
11 — Supertrend up/down
12 — Supertrend down/up
13 — Close above/below MA
14 — Close below/above MA
15 — Close above/below open
16 — Close below/above open
17 — Close increase/decrease
18 — Close decrease/increase
19 — Close near Donchian top/bottom (Close > (Mid + HH) / 2)
20 — Close near Donchian bottom/top (Close < (Mid + LL) / 2)
21 — New Donchian high/low
22 — New Donchian low/high
23 — Rising volume
24 — Falling volume
25 — Volume above average (Volume > SMA(Volume, 20))
26 — Volume below average (Volume < SMA(Volume, 20))
27 — High body to range ratio (Abs(Close - Open) / (High - Low) > 0.5)
28 — Low body to range ratio (Abs(Close - Open) / (High - Low) < 0.5)
29 — High relative volatility (ATR(7) > ATR(40))
30 — Low relative volatility (ATR(7) < ATR(40))
31 — External condition 1
32 — External condition 2
33 — External condition 3
34 — External condition 4
35 — External condition 5
These constituent conditions fall into three distinct categories:
• Directional pairs : The numbers 1-22 correspond to pairs of opposing upward and downward conditions. For example, if one of the inputs includes "1" in the comma-separated list, that group uses the "RSI above/below threshold" condition pair. In this case, the RSI must be above a high threshold for the group to trigger an upward alert, and the RSI must be below a defined low threshold to trigger a downward alert.
• Non-directional filters : The numbers 23-30 correspond to conditions that do not represent directional information. These conditions act as filters for both upward and downward alerts. Traders often use non-directional conditions to refine trending or mean reversion signals. For instance, if one of the input lists includes "30", that group uses the "Low relative volatility" condition. The group can trigger an upward or downward alert only if the 7-period Average True Range (ATR) is below the 40-period ATR.
• External conditions : The numbers 31-35 correspond to external conditions based on the plots from other indicators on the chart. To set these conditions, use the source inputs in the "External conditions" section near the bottom of the "Settings/Inputs" tab. The external value can represent an upward, downward, or non-directional condition based on the following logic:
▫ Any value above 0 represents an upward condition.
▫ Any value below 0 represents a downward condition.
▫ If the checkbox next to the source input is selected, the condition becomes non-directional . Any group that uses the condition can trigger upward or downward alerts only if the source value is not 0.
To learn more about using plotted values from other indicators, see this article in our Help Center and the Source input section of our Pine Script™ User Manual.
Group markers
Each comma-separated list represents a distinct group , where all the listed conditions must occur to trigger an alert. This script assigns preset markers (names) to each condition group to make the active ensembles easily identifiable in the generated alert messages and labels. The markers assigned to each group use the format "M", where "M" is short for "Marker" and "x" is the group number. The titles of the inputs at the top of the "Settings/Inputs" tab show these markers for convenience.
For upward conditions, the labels and alert messages show group markers with upward triangles (e.g., "M1▲"). For downward conditions, they show markers with downward triangles (e.g., "M1▼").
NOTE: By default, this script populates the "M1" field with a pre-configured list for a mean reversion group ("2,18,24,28"). The other fields are empty. If any "M*" input does not contain a value, the indicator ignores it in the alert calculations.
Custom alert messages
By default, the indicator's alert message text contains the activated markers and their direction as a comma-separated list. Users can override this message for upward or downward alerts with the two text fields at the bottom of the "Settings/Inputs" tab. When the fields are not empty , the alerts use that text instead of the default marker list.
NOTE: This script generates alert triggers, not the alerts themselves. To set up an alert based on this script's conditions, open the "Create Alert" dialog box, then select the "Ensemble Alerts" and "Any alert() function call" options in the "Condition" tabs. See the Alerts FAQ in our Pine Script™ User Manual for more information.
Condition visualization
This script offers organized visualizations of its conditions, allowing users to inspect the behaviors of each condition alongside the specified groups. The key visual features include:
1) Conditional plots
• The indicator plots the history of each individual condition, excluding the external conditions, as circles at different levels. Opposite conditions appear at positive and negative levels with the same absolute value. The plots for each condition show values only on the bars where they occur.
• Each condition's plot is color-coded based on its type. Aqua and orange plots represent opposing directional conditions, and purple plots represent non-directional conditions. The titles of the plots also contain the condition numbers to which they apply.
• The plots in the separate pane can be turned on or off with the "Show plots in pane" checkbox near the top of the "Settings/Inputs" tab. This input only toggles the color-coded circles, which reduces the graphical load. If you deactivate these visuals, you can still inspect each condition from the script's status line and the Data Window.
• As a bonus, the indicator includes "Up alert" and "Down alert" plots in the Data Window, representing the combined upward and downward ensemble alert conditions. These plots are also usable in additional indicator-on-indicator calculations.
2) Dynamic labels
• The indicator draws a label on the main chart pane displaying the activated group markers (e.g., "M1▲") each time an alert condition occurs.
• The labels for upward alerts appear below chart bars. The labels for downward alerts appear above the bars.
NOTE: This indicator can display up to 500 labels because that is the maximum allowed for a single Pine script.
3) Background highlighting
• The indicator can highlight the main chart's background on bars where upward or downward condition groups activate. Use the "Highlight background" inputs in the "Settings/Inputs" tab to enable these highlights and customize their colors.
• Unlike the dynamic labels, these background highlights are available for all chart bars, irrespective of the number of condition occurrences.
█ NOTES
• This script uses Pine Script™ v6, the latest version of TradingView's programming language. See the Release notes and Migration guide to learn what's new in v6 and how to convert your scripts to this version.
• This script imports our new Alerts library, which features functions that provide high-level simplicity for working with complex compound conditions and alerts. We used the library's `compoundAlertMessage()` function in this indicator. It evaluates items from "bool" arrays in groups specified by an array of strings containing comma-separated index lists , returning a tuple of "string" values containing the marker of each activated group.
• The script imports the latest version of the ta library to calculate several technical indicators not included in the built-in `ta.*` namespace, including Double Exponential Moving Average (DEMA), Triple Exponential Moving Average (TEMA), Fractal Adaptive Moving Average (FRAMA), Tilson T3, Awesome Oscillator (AO), Full Stochastic (%K and %D), SuperTrend, and Donchian Channels.
• The script uses the `force_overlay` parameter in the label.new() and bgcolor() calls to display the drawings and background colors in the main chart pane.
• The plots and hlines use the available `display.*` constants to determine whether the visuals appear in the separate pane.
Look first. Then leap.

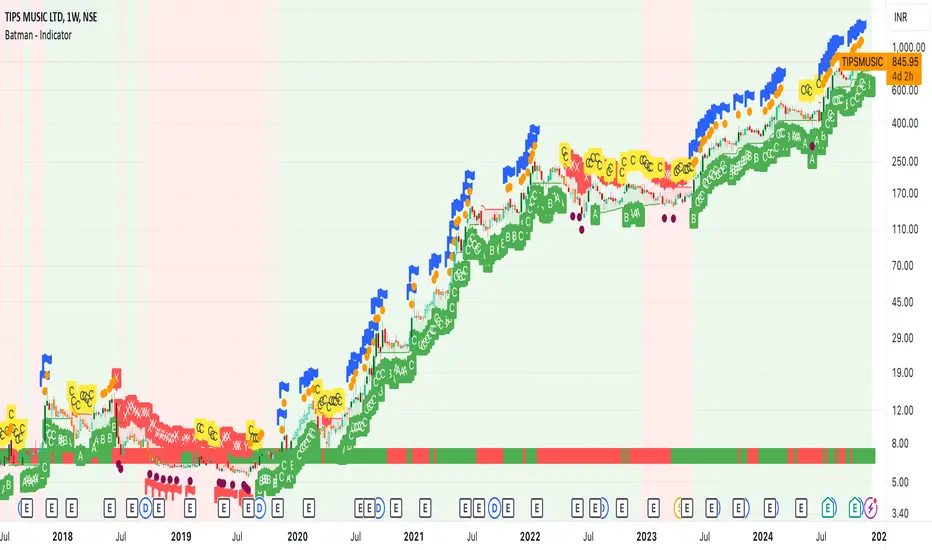
Batman - IndicatorThe Batman - Indicator is an advanced trend-following tool that combines multiple methodologies to provide traders with actionable insights for efficient decision-making. This comprehensive indicator leverages both classic and innovative approaches to detect market trends, identify relative strength, and signal entry/exit opportunities. Key features include:
Core Features:
1. Trend Analysis with ADX :
- Measures trend strength and signals shifts in momentum using the Average Directional Index (ADX).
- Configurable parameters allow traders to fine-tune the threshold for their preferred trading style.
2. Relative Strength (RS) Evaluation :
- Analyzes the relative strength of the asset compared to broader market indices (e.g., CRYPTOCAP:TOTAL, NSE:NIFTY, NASDAQ:NDX).
- Provides intuitive visual cues with strength and weakness coloring for quick decision-making.
3. Volume-Based Price Action Insights :
- Highlights bars with significant volume activity relative to a configurable moving average.
- Identifies potential turning points and momentum using color-coded volume bars.
4. 52-Week High/Low Detection :
- Tracks and flags new 52-week highs or lows to highlight key levels of interest.
- Adds context for long-term market trends and potential breakout/breakdown points.
5. Donchian Channel Breakouts :
- Detects changes in Donchian channel levels, signaling potential breakout or reversal scenarios.
6. Multi-Layered Scoring System :
- Combines ADX and RSI to score market conditions on a scale from bearish (Z) to bullish (A).
- Includes intermediate levels (X, Y, C) to capture nuanced shifts in sentiment.
7. Exit Strategies :
- Features customizable exit indicators, offering a choice between SuperTrend and VStop .
- Provides dynamic, visually distinct trendlines for clear trend-following exits.
Unique Value:
- Unlike traditional single-purpose indicators, the Batman - Indicator integrates multiple tools into a single cohesive framework.
- Each component is independently configurable, allowing traders to adapt the indicator to their unique strategy and risk tolerance.
- Background color and plot shapes improve visual clarity, ensuring ease of use during fast-paced trading sessions.
Use Cases:
- Scalping and intraday trading with dynamic trend and volume signals.
- Swing and positional trading with long-term high/low levels and trend exits.
- Relative strength analysis for pair trading or benchmarking performance against broader markets.
How It Works:
- Trend Identification : Utilizes ADX and RSI to provide directional bias and signal overbought/oversold conditions.
- Volume Analysis : Highlights potential areas of interest based on abnormal volume activity.
- Breakout Signals : Detects new 52-week highs/lows and Donchian channel breakouts for actionable alerts.
- Exit Planning : Offers clear, customizable exit levels via SuperTrend or VStop, reducing emotional decision-making.
Configuration:
- The indicator includes customizable inputs for all calculations (length, thresholds, multipliers) to suit diverse market conditions and trading styles.
- Default settings provide a balanced approach suitable for most markets but can be tailored as needed.
---
Instructions for Use:
1. Add the indicator to your chart and configure the inputs according to your trading timeframe and asset type.
2. Pay attention to the ADX-RSI Scoring System for overall market sentiment.
3. Use volume-based price action and 52-week breakout signals to identify potential entries.
4. Exit trades based on the chosen exit indicator (SuperTrend or VStop) to manage risk and lock in profits.
Alerts:
- Set up alerts for scoring system changes, 52-week high/low breakouts, and exit signals for seamless trading automation.
MadTrend [InvestorUnknown]The MadTrend indicator is an experimental tool that combines the Median and Median Absolute Deviation (MAD) to generate signals, much like the popular Supertrend indicator. In addition to identifying Long and Short positions, MadTrend introduces RISK-ON and RISK-OFF states for each trade direction, providing traders with nuanced insights into market conditions.
Core Concepts
Median and Median Absolute Deviation (MAD)
Median: The middle value in a sorted list of numbers, offering a robust measure of central tendency less affected by outliers.
Median Absolute Deviation (MAD): Measures the average distance between each data point and the median, providing a robust estimation of volatility.
Supertrend-like Functionality
MadTrend utilizes the median and MAD in a manner similar to how Supertrend uses averages and volatility measures to determine trend direction and potential reversal points.
RISK-ON and RISK-OFF States
RISK-ON: Indicates favorable conditions for entering or holding a position in the current trend direction.
RISK-OFF: Suggests caution, signaling RISK-ON end and potential trend weakening or reversal.
Calculating MAD
The mad function calculates the median of the absolute deviations from the median, providing a robust measure of volatility.
// Function to calculate the Median Absolute Deviation (MAD)
mad(series float src, simple int length) =>
med = ta.median(src, length) // Calculate median
abs_deviations = math.abs(src - med) // Calculate absolute deviations from median
ta.median(abs_deviations, length) // Return the median of the absolute deviations
MADTrend Function
The MADTrend function calculates the median and MAD-based upper (med_p) and lower (med_m) bands. It determines the trend direction based on price crossing these bands.
MADTrend(series float src, simple int length, simple float mad_mult) =>
// Calculate MAD (volatility measure)
mad_value = mad(close, length)
// Calculate the MAD-based moving average by scaling the price data with MAD
median = ta.median(close, length)
med_p = median + (mad_value * mad_mult)
med_m = median - (mad_value * mad_mult)
var direction = 0
if ta.crossover(src, med_p)
direction := 1
else if ta.crossunder(src, med_m)
direction := -1
Trend Direction and Signals
Long Position (direction = 1): When the price crosses above the upper MAD band (med_p).
Short Position (direction = -1): When the price crosses below the lower MAD band (med_m).
RISK-ON: When the price moves further in the direction of the trend (beyond median +- MAD) after the initial signal.
RISK-OFF: When the price retraces towards the median, signaling potential weakening of the trend.
RISK-ON and RISK-OFF States
RISK-ON LONG: Price moves above the upper band after a Long signal, indicating strengthening bullish momentum.
RISK-OFF LONG: Price falls back below the upper band, suggesting potential weakness in the bullish trend.
RISK-ON SHORT: Price moves below the lower band after a Short signal, indicating strengthening bearish momentum.
RISK-OFF SHORT: Price rises back above the lower band, suggesting potential weakness in the bearish trend.
Picture below show example RISK-ON periods which can be identified by “cloud”
Note: Highlighted areas on the chart indicating RISK-ON and RISK-OFF periods for both Long and Short positions.
Implementation Details
Inputs and Parameters:
Source (input_src): The price data used for calculations (e.g., close, open, high, low).
Median Length (length): The number of periods over which the median and MAD are calculated.
MAD Multiplier (mad_mult): Determines the distance of the upper and lower bands from the median.
Calculations:
Median and MAD are recalculated each period based on the specified length.
Upper (med_p) and Lower (med_m) Bands are computed by adding and subtracting the scaled MAD from the median.
Visual representation of the indicator on a price chart:
Backtesting and Performance Metrics
The MadTrend indicator includes a Backtesting Mode with a performance metrics table to evaluate its effectiveness compared to a simple buy-and-hold strategy.
Equity Calculation:
Calculates the equity curve based on the signals generated by the indicator.
Performance Metrics:
Metrics such as Mean Returns, Standard Deviation, Sharpe Ratio, Sortino Ratio, and Omega Ratio are computed.
The metrics are displayed in a table for both the strategy and the buy-and-hold approach.
Note: Due to the use of labels and plot shapes, automatic chart scaling may not function ideally in Backtest Mode.
Alerts and Notifications
MadTrend provides alert conditions to notify traders of significant events:
Trend Change Alerts
RISK-ON and RISK-OFF Alerts - Provides real-time notifications about the RISK-ON and RISK-OFF states for proactive trade management.
Customization and Calibration
Default Settings: The provided default settings are experimental and not optimized. They serve as a starting point for users.
Parameter Adjustment: Traders are encouraged to calibrate the indicator's parameters (e.g., length, mad_mult) to suit their specific trading style and the characteristics of the asset being analyzed.
Source Input: The indicator allows for different price inputs (open, high, low, close, etc.), offering flexibility in how the median and MAD are calculated.
Important Notes
Market Conditions: The effectiveness of the MadTrend indicator can vary across different market conditions. Regular calibration is recommended.
Backtest Limitations: Backtesting results are historical and do not guarantee future performance.
Risk Management: Always apply sound risk management practices when using any trading indicator.

RV- Dynamic Trend AnalyzerRV Dynamic Trend Analyzer
The RV Dynamic Trend Analyzer is a powerful TradingView indicator designed to help traders identify and capitalize on trends across multiple time frames—daily, weekly, and monthly. With dynamic adjustments to key technical indicators like EMA and MACD, the tool adapts to different chart periods, ensuring more accurate signals. Whether you are swing trading or holding longer-term positions, this indicator provides reliable buy/sell signals, breakout opportunities, and customizable visual elements to enhance decision-making. Its intelligent use of EMAs and MACD values ensures high potential returns, making it suitable for traders seeking strong, data-driven strategies. Below are its core features and their respective benefits.
Supertrend Indicator:
Importance: The Supertrend is a trend-following tool that helps traders identify the market’s direction by offering clear buy and sell signals based on price movement relative to the Supertrend line.
Benefits:
Helps filter out market noise and enables traders to stay in trends longer.
The pullback detection feature enhances trade timing by identifying potential entry points during retracements.
ATH/ATL & 52-Week High/Low with Candle Coloring:
Importance: Tracking all-time highs (ATH), all-time lows (ATL), and 52-week high/low levels helps traders identify key support and resistance levels.
Benefits:
Offers insights into the strength of price movements and potential reversal zones.
Candle coloring improves visual analysis, allowing quick identification of bullish or bearish conditions at critical levels.
Multi-Time Frame Analysis
Importance: The ability to view indicators like RSI and MACD across multiple time frames provides a more in-depth and comprehensive view of market behavior, allowing traders to make informed decisions that align with both short-term and long-term trends.
Benefits:
Align Strategies Across Time frames: By using multiple time frames, traders can align their strategies with larger trends (such as weekly or daily) while executing trades on lower time frames (like 1-minute or 5-minute charts). This improves the accuracy of trade entries and exits.
Reduce False Signals: Viewing key technical indicators like RSI and MACD across different time frames reduces the likelihood of false signals by offering a broader market context, filtering out noise from smaller time frames.
Customization of Table Display: Traders can customize the position and size of a table that displays RSI and MACD values for selected time frames. This flexibility enhances visibility and ease of analysis.
Time frame-Specific Data: The code allows for displaying RSI and MACD data for up to seven different time frames, making it highly customizable for traders depending on their preferred analysis period.
Visual Clarity: The table displays key values such as RSI and MACD histogram readings in a visually clear format, with color coding to quickly indicate overbought/oversold levels or MACD crossovers.
Pivot Points:
Importance: Pivot points serve as key support and resistance levels that help predict potential price movements.
Benefits:
Assists in identifying potential reversal zones and breakout points, aiding in trade planning.
Displaying pivot points across multiple time frames enhances market insight and improves strategic planning.
Quarterly Earnings Table:
Importance: Understanding a company’s quarterly earnings releases is crucial, as these events often lead to significant price volatility. Traders can leverage this information to adjust their strategies around earnings reports and prevent unexpected losses.
Benefits:
Helps traders anticipate potential price movements due to earnings reports.
Allows traders to avoid sudden losses by being aware of important earnings announcements and adjusting positions accordingly.
Customizable Visuals for Traders:
Dark Mode: Toggle between dark and light themes based on your chart's color scheme.
Mini Mode: A condensed version that visually simplifies the data, making it quicker to interpret through color-coded traffic lights (green for positive, red for negative).
Table Size & Position: Customize the size and position of the table for better visibility on your charts.
Data Period (FQ vs FY): Easily switch between displaying quarterly or yearly data based on the selected period.
Top-Left Cell Display: Option to display Free Float or Market Cap in the top-left cell for quick reference.
Exponential Moving Averages (EMAs) with Adjustable Lengths:
Importance: EMAs are essential for identifying trends and generating reliable buy/sell signals. The indicator plots four EMAs that dynamically adjust based on the selected time frame.
Benefits:
Dynamic Time frame Logic: EMA lengths and sources automatically adapt based on whether the user selects daily, weekly, or monthly time frames. This ensures the EMAs are relevant for the chosen strategy.
Multiple EMAs: By incorporating four different EMAs, users can observe both short-term and long-term trends simultaneously, improving their ability to identify key trend shifts.
Breakout Arrow Functionality:
Importance: This feature visually signals potential buy/sell opportunities based on the interaction between EMAs and MACD crossovers.
Benefits:
Crossover Signals: Arrows are plotted when EMAs and MACD cross, indicating breakout opportunities and aiding in quick trade decisions.
RSI Filter Option: Users can apply an optional RSI filter to refine buy/sell signals, reducing false signals and improving overall accuracy.
Disclaimer:
Before engaging in actual trading, we strongly recommend back testing the this indicator to ensure it fits your trading style and risk tolerance. Be sure to adjust your risk-reward ratio and set appropriate stop-loss levels to safeguard your investments. Proper risk management is key to successful trading.

Super Trend ReversalsMain Concept
The core idea behind the Super Trend Reversals indicator is to assess the momentum of automated trading bots (often referred to as 'Supertrend bots') that enter the market during critical turning points. Specifically, the indicator is tuned to identify when the market is nearing bottoms or peaks, but just before it shifts direction based on the triggered Supertrend signals. This approach helps traders engage with the market right as the reversal momentum builds up, allowing for entry just as conditions become favorable and exit before momentum wanes.
How It Works
The Super Trend Reversals uses multiple Supertrend calculations, each with different period and multiplier settings, to form a comprehensive view of the trend. The total trend score from these calculations is then analyzed using the Relative Strength Index (RSI) and Exponential Moving Averages (EMA) to gauge the strength and sustainability of the trend.
A key feature of this indicator is the isCurrentRangeSmaller() function, which evaluates if the current price range is lower than the average over the recent period. This function is critical as it helps determine the stability of the market environment, reducing the likelihood of entering or exiting trades based on erratic price movements that could lead to false signals.

Uptrick: Comprehensive Market Sentiment DashboardIntroducing "Uptrick: Comprehensive Market Sentiment Dashboard"—an advanced trading indicator designed to provide traders with a complete and detailed overview of market conditions for multiple assets at a glance. This sophisticated tool is engineered to enhance your trading decisions by consolidating key technical indicators into a single, easy-to-read dashboard. Perfect for both novice and experienced traders, the Uptrick Dashboard is built to offer a competitive edge in the dynamic world of trading.
### Purpose
The primary goal of the Uptrick Dashboard is to equip traders with a powerful, all-in-one solution that streamlines market analysis. By combining multiple technical indicators and presenting their outputs in a cohesive format, this dashboard eliminates the need to toggle between different charts and tools. It delivers a clear, immediate understanding of market sentiment across various assets, enabling faster and more informed trading decisions.
### Features and Inputs
The Uptrick Dashboard integrates several widely-used technical indicators, each customizable to fit your specific trading strategy. Here’s a detailed breakdown of the features and input parameters:
1. **Exponential Moving Average (EMA)**
- **Input Parameter:** EMA Length
- **Purpose:** Tracks the asset’s price trend by smoothing out price data over a specified period.
2. **Simple Moving Average (SMA)**
- **Input Parameter:** SMA Length
- **Purpose:** Provides a simpler, more straightforward calculation of price trends compared to EMA.
3. **Relative Strength Index (RSI)**
- **Input Parameter:** RSI Length
- **Purpose:** Measures the magnitude of recent price changes to evaluate overbought or oversold conditions.
4. **Moving Average Convergence Divergence (MACD)**
- **Input Parameters:** MACD Fast Length, MACD Slow Length, MACD Signal Length
- **Purpose:** Identifies changes in the strength, direction, momentum, and duration of a trend.
5. **Bollinger Bands (BB)**
- **Input Parameters:** BB Length, BB StdDev
- **Purpose:** Provides a visual representation of volatility and relative price levels over a specified period.
6. **Ichimoku Cloud**
- **Input Parameters:** Ichimoku Tenkan Length, Ichimoku Kijun Length, Ichimoku Span A Length, Ichimoku Span B Length
- **Purpose:** Offers a comprehensive view of support and resistance levels, momentum, and trend direction.
7. **Supertrend**
- **Input Parameters:** Supertrend ATR Length, Supertrend Multiplier
- **Purpose:** Combines trend direction and volatility to provide buy and sell signals.
8. **Symbols Input**
- **Input Parameter:** Symbols (comma separated)
- **Purpose:** Allows users to specify and monitor multiple assets simultaneously.
### Customization and Flexibility
Each indicator within the Uptrick Dashboard is fully customizable, allowing you to adjust parameters to align with your trading strategy. Whether you prefer short-term trading with faster indicators or long-term analysis with slower, more reliable data, this dashboard can be tailored to meet your needs.
### Key Differentiators
What sets the Uptrick Dashboard apart from other market sentiment tools is its unparalleled integration of multiple technical indicators into a single, comprehensive view. This consolidation not only saves time but also provides a more holistic understanding of market conditions. Here’s what makes the Uptrick Dashboard unique:
- **Integrated Analysis:** Combines multiple indicators to provide a unified market sentiment.
- **Customizable Inputs:** Each indicator can be adjusted to suit your specific trading strategy.
- **Multi-Asset Monitoring:** Track and analyze several assets simultaneously.
- **User-Friendly Interface:** Designed for ease of use, presenting data in an organized, visually appealing format.
- **Real-Time Updates:** Continuously updates to reflect the latest market data.
### Future Updates
We are committed to continually improving the Uptrick Dashboard to ensure it remains a valuable tool in your trading arsenal. Users can expect regular updates that will introduce new features, enhance existing functionalities, and incorporate user feedback. Future updates may include:
- **Additional Indicators:** Introducing new technical indicators to provide even deeper insights.
- **Enhanced Visualization:** Improved graphical representations for better data interpretation.
- **Automation Features:** Tools to automate certain trading strategies based on indicator outputs.
- **User Customization:** More options for personalizing the dashboard to fit individual preferences.
### How It Works
The Uptrick Dashboard operates by calculating key technical indicators for each specified asset and displaying the results in a neatly organized table. Here’s a closer look at how it works:
1. **Input Parameters:** Users input their preferred settings for each indicator, including the list of assets to monitor.
2. **Data Retrieval:** The dashboard retrieves real-time market data for each specified asset.
3. **Indicator Calculation:** Using the input parameters, the dashboard calculates the values for each technical indicator.
4. **Visual Display:** Results are displayed in a table format, highlighting key information such as price, 24-hour change, and sentiment indicators (e.g., MACD, RSI, Bollinger Bands).
5. **Final Position:** The dashboard calculates an overall market position (Long, Short, or Neutral) based on the combined outputs of the individual indicators.
### Conclusion
The "Uptrick: Comprehensive Market Sentiment Dashboard" is a must-have tool for traders seeking a streamlined, efficient way to monitor market conditions across multiple assets. By integrating essential technical indicators into a single, customizable dashboard, it provides a comprehensive view of market sentiment, facilitating quicker and more informed trading decisions. Stay ahead of the market with Uptrick and experience the difference that a well-designed, all-in-one trading tool can make.
With regular updates and a commitment to excellence, the Uptrick Dashboard is poised to evolve continually, adapting to the changing needs of traders and the dynamics of the market. Whether you’re a seasoned trader or just starting out, the Uptrick Dashboard offers the insights and flexibility needed to enhance your trading strategy. Invest in the Uptrick Dashboard today and take your trading to the next level.