Trading IQ - Razor IQIntroducing TradingIQ's first dip buying/shorting all-in-one trading system: Razor IQ.
Razor IQ is an exclusive trading algorithm developed by TradingIQ, designed to trade upside/downside price dips of varying significance in trending markets. By integrating artificial intelligence and IQ Technology, Razor IQ analyzes historical and real-time price data to construct a dynamic trading system adaptable to various asset and timeframe combinations.
Philosophy of Razor IQ
Razor IQ operates on a single premise: Trends must retrace, and these retracements offer traders an opportunity to join in the overarching trend. At some point traders will enter against a trend in aggregate and traders in profitable positions entered during the trend will scale out. When occurring simultaneously, a trend will retrace against itself, offering an opportunity for traders not yet in the trend to join in the move and continue the trend.
Razor IQ is designed to work straight out of the box. In fact, its simplicity requires just a few user settings to manage output, making it incredibly straightforward to manage.
Long Limit Order Stop Loss and Minimum ATR TP/SL are the only settings that manage the performance of Razor IQ!
Traders don’t have to spend hours adjusting settings and trying to find what works best - Razor IQ handles this on its own.
Key Features of Razor IQ
Self-Learning Retracement Detection
Employs AI and IQ Technology to identify notable price dips in real-time.
AI-Generated Trading Signals
Provides retracement trading signals derived from self-learning algorithms.
Comprehensive Trading System
Offers clear entry and exit labels.
Performance Tracking
Records and presents trading performance data, easily accessible for user analysis.
Self-Learning Trading Exits
Razor IQ learns where to exit positions.
Long and Short Trading Capabilities
Supports both long and short positions to trade various market conditions.
How It Works
Razor IQ operates on a straightforward heuristic: go long during the retracement of significant upside price moves and go short during the retracement of significant downside price moves.
IQ Technology, TradingIQ's proprietary AI algorithm, defines what constitutes a “trend” and a “retracement” and what’s considered a tradable dip buying/shorting opportunity. For Razor IQ, this algorithm evaluates all historical trends and retracements, how much trends generally retrace and how long trends generally persist. For instance, the "dip" following an uptrend is measured and learned from, including the significance of the identified trend level (how long it has been active, how much price has increased, etc). By analyzing these patterns, Razor IQ adapts to identify and trade similar future retracements and trends.
In simple terms, Razor IQ clusters previous trend and retracement data in an attempt to trade similar price sequences when they repeat in the future. Using this knowledge, it determines the optimal, current price level where joining in the current trend (during a retracement) has a calculated chance of not stopping out before trend continuation.
For long positions, Razor IQ enters using a market order at the AI-identified long entry price point. If price closes beneath this level a market order will be placed and a long position entered. Of course, this is how the algorithm trades, users can elect to use a stop-limit order amongst other order types for position entry. After the position is entered TP1 is placed (identifiable on the price chart). TP1 has a twofold purpose:
Acts as a legitimate profit target to exit 50% of the position.
Once TP1 is achieved, a stop-loss order is immediately placed at breakeven, and a trailing stop loss controls the remainder of the trade. With this, so long as TP1 is achieved, the position will not endure a loss. So long as price continues to uptrend, Razor IQ will remain in the position.
For short positions, Razor IQ provides an AI-identified short entry level. If price closes above this level a market order will be placed and a short position entered. Again, this is how the algorithm trades, users can elect to use a stop-limit order amongst other order types for position entry. Upon entry Razor IQ implements a TP order and SL order (identifiable on the price chart).
Downtrends, in most markets, usually operate differently than uptrends. With uptrends, price usually increases at a modest pace with consistency over an extended period of time. Downtrends behave in an opposite manner - price decreases rapidly for a much shorter duration.
With this observation, the long dip entry heuristic differs slightly from the short dip entry heuristic.
The long dip entry heuristic specializes in identifying larger, long-term uptrends and entering on retracement of the uptrends. With a dedicated trailing stop loss, so long as the uptrend persists, Razor IQ will remain in the position.
The short dip entry heuristic specializes in identifying sharp, significant downside price moves, and entering short on upside volatility during these moves. A fixed stop loss and profit target are implemented for short positions - no trailing stop is used.
As a trading system, Razor IQ exits all TP orders using a limit order, with all stop losses exited as stop market orders.
What Classifies As a Tradable Dip?
For Razor IQ, tradable price dips are not manually set but are instead learned by the system. What qualifies as an exploitable price dip in one market might not hold the same significance in another. Razor IQ continuously analyzes historical and current trends (if one exists), how far price has moved during the trend, the duration of the trend, the raw-dollar price move of price dips during trends, and more, to determine which future price retracements offer a smart chance to join in any current price trend.
The image above illustrates the Razor Line Long Entry point.
The green line represents the Long Retracement Entry Point.
The blue upper line represents the first profit target for the trade.
The blue lower line represents the trailing stop loss start point for the long position.
The position is entered once price closes below the green line.
The green Razor Lazor long entry point will only appear during uptrends.
The image above shows a long position being entered after the Long Razor Lazor was closed beneath.
Green arrows indicate that the strategy entered a long position at the highlighted price level.
Blue arrows indicate that the strategy exited a position, whether at TP1, the initial stop loss, or at the trailing stop.
Blue lines above the entry price indicate the TP1 level for the current long trade. Blue lines below the current price indicate the initial stop loss price.
If price reaches TP1, a stop loss will be immediately placed at breakeven, and the in-built trailing stop will determine the future exit price.
A blue line (similar to the blue line shown for TP1) will trail price and correspond to the trailing stop price of the trade.
If the trailing stop is above the breakeven stop loss, then the trailing stop will be hit before the breakeven stop loss, which means the remainder of the trade will be exited at a profit.
If the breakeven stop loss is above the trailing stop, then the breakeven stop loss will be hit first. In this case, the remainder of the position will be exited at breakeven.
The image above shows the trailing stop price, represented by a blue line, and the breakeven stop loss price, represented by a pink line, used for the long position!
You can also hover over the trade labels to get more information about the trade—such as the entry price and exit price.
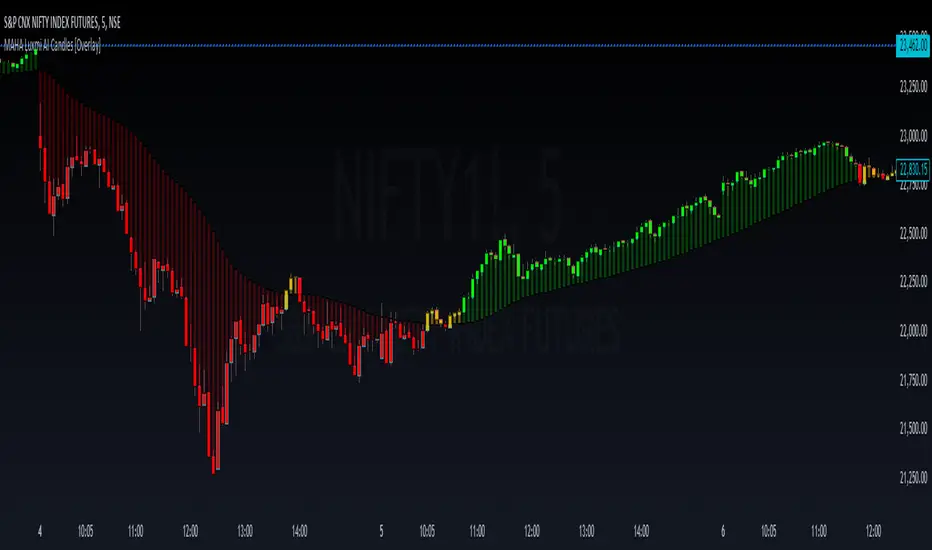
The image above exemplifies Razor IQ's output when a downtrend is active.
When a downtrend is active, Razor IQ will switch to "short mode". In short mode, Razor IQ will display a neon red line. This neon red line indicates the Razor Lazor short entry point. When price closes above the red Razor Lazor line a short position is entered.
The image above shows Razor IQ during an active short position.
The image above shows Razor IQ after completing a short trade.
Red arrows indicate that the strategy entered a short position at the highlighted price level.
Blue arrows indicate that the strategy exited a position, whether at the profit target or the fixed stop loss.
Blue lines indicate the profit target level for the current trade when below price. and blue lines above the current price indicate the stop loss level for the short trade.
Short traders do not utilize a trailing stop - only a fixed profit target and fixed stop loss are used.
You can also hover over the trade labels to get more information about the trade—such as the entry price and exit price.
Minimum Profit Target And Stop Loss
The Minimum ATR Profit Target and Minimum ATR Stop Loss setting control the minimum allowed profit target and stop loss distance. On most timeframes users won’t have to alter these settings; however, on very-low timeframes such as the 1-minute chart, users can increase these values so gross profits exceed commission.
After changing either setting, Razor IQ will retrain on historical data - accounting for the newly defined minimum profit target or stop loss.
AI Direction
The AI Direction setting controls the trade direction Razor IQ is allowed to take.
“Trade Longs” allows for long trades.
“Trade Shorts” allows for short trades.
Verifying Razor IQ’s Effectiveness
Razor IQ automatically tracks its performance and displays the profit factor for the long strategy and the short strategy it uses. This information can be found in the table located in the top-right corner of your chart showing.
This table shows the long strategy profit factor and the short strategy profit factor.
The image above shows the long strategy profit factor and the short strategy profit factor for Razor IQ.
A profit factor greater than 1 indicates a strategy profitably traded historical price data.
A profit factor less than 1 indicates a strategy unprofitably traded historical price data.
A profit factor equal to 1 indicates a strategy did not lose or gain money when trading historical price data.
Using Razor IQ
While Razor IQ is a full-fledged trading system with entries and exits - manual traders can certainly make use of its on chart indications and visualizations.
The hallmark feature of Razor IQ is its ability to signal an acceptable dip entry opportunity - for both uptrends and downtrends. Long entries are often signaled near the bottom of a retracement for an uptrend; short entries are often signaled near the top of a retracement for a downtrend.
Razor IQ will always operate on exact price levels; however, users can certainly take advantage of Razor IQ's trend identification mechanism and retracement identification mechanism to use as confluence with their personally crafted trading strategy.
Of course, every trend will reverse at some point, and a good dip buying/shorting strategy will often trade the reversal in expectation of the prior trend continuing (retracement). It's important not to aggressively filter retracement entries in hopes of avoiding an entry when a trend reversal finally occurs, as this will ultimately filter out good dip buying/shorting opportunities. This is a reality of any dip trading strategy - not just Razor IQ.
Of course, you can set alerts for all Razor IQ entry and exit signals, effectively following along its systematic conquest of price movement.
สคริปต์แบบชำระเงิน