Reflex - A new Ehlers indicatorSource: Stocks and Commodities V38
Hooray! A new John Ehlers indicator!
John claims this indicator is lag-less and uses the SPY on the Daily as an example.
He states that drawing a line from peak to peak (or trough to trough) will correspond perfectly with the Asset.
I have to say I agree! There is typically one bar of lag or no lag at all!
I believe this indicator can be used for either entries or exits, but not both.
Entry
1. Entering Long positions at the pivot low points (Stocks and ETFs)
2. Entering Long when the Reflex crosses above the zero lines (Stocks, ETFs, Commodities)
Exit
1. Exiting Long positions at a new pivot high point (Stocks and ETFs)
2. Exiting Long when the Reflex crosses below the zero lines (Stocks, ETFs, Commodities)
In this example, I place a Long order on the SPY every time the Reflex crosses above the zero level and exit when it crosses below or pops my stop loss, set at 1.5 * Daily ATR.
4/6 Wins
+10.76%
For me, that's good enough to create a strategy and backtest on several Indices and ETFs, which is what I have a hunch this will work on.
I think there is a lot of promise from a single Indicator!
Let me know in the comment section if you're able to use this in a strategy.
ค้นหาในสคริปต์สำหรับ "spy"

Hide Extended Hours/non-intraday American BarsOnly works with American bar style.
Not works with Candles.
--------
This script can hide the extended hours/non-intraday bars and leave the intraday bars only, especially for future users, such as ES/NQ/RTY/YM, etc.,.
Now you can find the intraday support/resistance quite easily!
Example, as a ES investor, you can easily find the intraday support/resistance level ,which is almost equal to SPY / SPX , no longer need to check SPY / SPX separately again, saving your time a lot.
--------
IMPORTANT INSTRUCTION
In order to make the script work, you have to bring it to the most top visual layer.
Please do as the following steps:
Add the script to chart
Hover mouse on the script name, and tap the right-most 'more' button (which appears as 3 dots)
Select "Visual Order", then select "Bring to front".
Done!
Also, in order to have a better view effect and make the bars COMPLETELY "Hidden", you can adjust the hidden bar color in the "setting" menu to the exact color of your chart background.

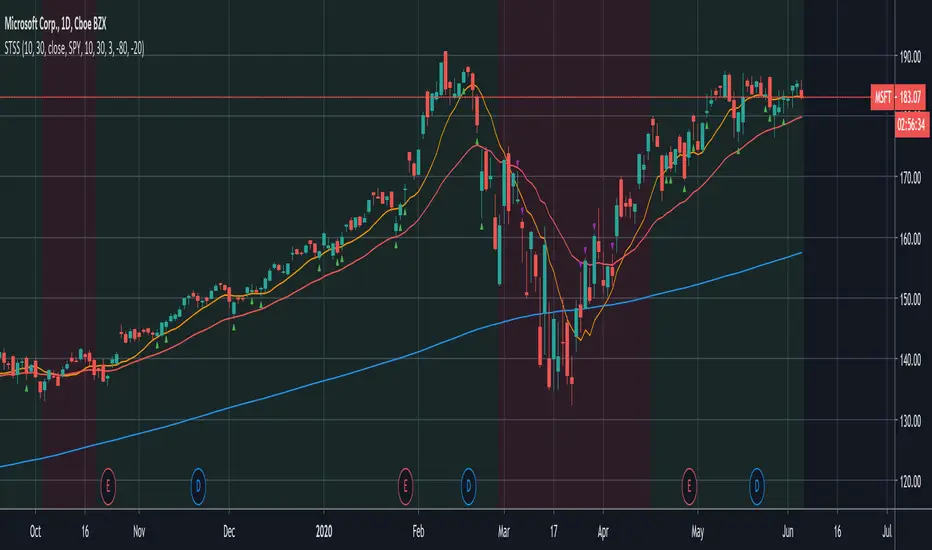
Swing-Trade-Stocks SystemThis is a simple swing trade system inspired by sources on the internet. The rules are as follows:
Buy when first green arrow appears after 10ma above 30ma
Set stop-loss below most recent support
Set take-profit below most recent swing point high or wait until price closes below 30ma (red)
Short when first purple arrow appears after 10ma below 30ma
Set stop-loss above most recent resistance
Set take-profit above most recent swing point low or wait until price closes above 30ma (red)
The background color changes based on the direction of SPY. If SPY is going down (10ma < 30ma) the
background will be red and only short indicators (purple arrows) will appear. If SPY is going up (10ma > 30ma),
the background will be green and only long indicators (green arrows) will appear.
Happy trading!
Market Internals [Makit0] MARKET INTERNALS INDICATOR v0.5beta
Market Internals are suitable for day trade equity indices, named SPY or /ES, please do your own research about what they are and how to use them
This scripts plots the NYSE market internals charts as an indicator for an easy and full visualization of market internal structure all in one chart, useful for SPY and /ES trading
Description of the Market Internals
- TICK: NYSE stocks ticking up vs stocks ticking down, extreme values may point to trend continuation on trending days or reversal in non trending days, example of extreme values can be 800 and 1000
- ADD: NYSE stocks going up vs stocks going down, if price auctions around the zero line may be a non trend day, otherwise may be a trend day
- VOLD: NYSE volume of stocks up vs volume of stocks going down, identify clearly where the volume is going, as example if volume is flowing down may be a good idea no to place longs
- TRIN: NYSE up stocks vs down stocks ratio divided by up volume vs down volume ratio. A value of 1 indicates parity, below that the strength is on the long side, above the strength is in the short side.
A basic use of market internals may be looking for divergences, for example:
- /ES is trading in a range but ADD and VOLD are trending up nonstop, may /ES will break the range to the upside
- /ES is trading in a range and ADD and VOLD are trading around the zero line but got an extreme reading on TICK, may be a non trending day and the TICK extreme reading is at one of the extremes of the /ES range, may be a good probability trade to fade that move
- /ES is trading in a trend to the downside, ADD and VOLD too, you catch a good portion of the move but are fearful to flat and miss more gains, you see in the TICK a lot of extreme values below -800 so your're confident in the continuation of the downtrend, until the TICK goes beyond -1000 and you use that signal to go flat
Market internals give you context and confirmation, price in /ES may be trending but if market internals do not confirm the move may a reversal is on its way
Price is an advertise, you can see the real move in the structure below, in the behavior of the individual components of the market, those are the real questions:
- How many stocks are going up/down (ADD)
- How many volume is flowing up/down (VOLD)
- How many stocks are ticking up/down (TICK)
- What is the overall volume breath of the market (TRIN)
FEATURES:
- Plot one of the four basic market internal indices: TICK, ADD, VOLD and TRIN
- Show labels with values beyond an user defined threshold
- Show ZERO line
- Show user defined Dotted and Dashed lines
- Show user defined moving average
SETTINGS:
- Market internal: ticker to plot in the indicator, four options to choose from (TICK, ADD, VOLD and TRIN)
- Labels threshold: all values beyond this will be ploted as labels
- Dot lines at: two dotted lines will be plotted at this value above and below the zero line
- Dash lines at: two dashed lines will be plotted at this value above and below the zero line
- MA type: two options avaiable SMA (Simple Moving Average) or EMA (Exponential Moving Average)
- MA length: number of bars to calculate the moving average
- Show zero line: show or hide zero line
- Show dot line: show or hide dotted lines
- Show dash line: show or hide dashed lines
- Show labels: show or hide labels
GOOD LUCK AND HAPPY TRADING

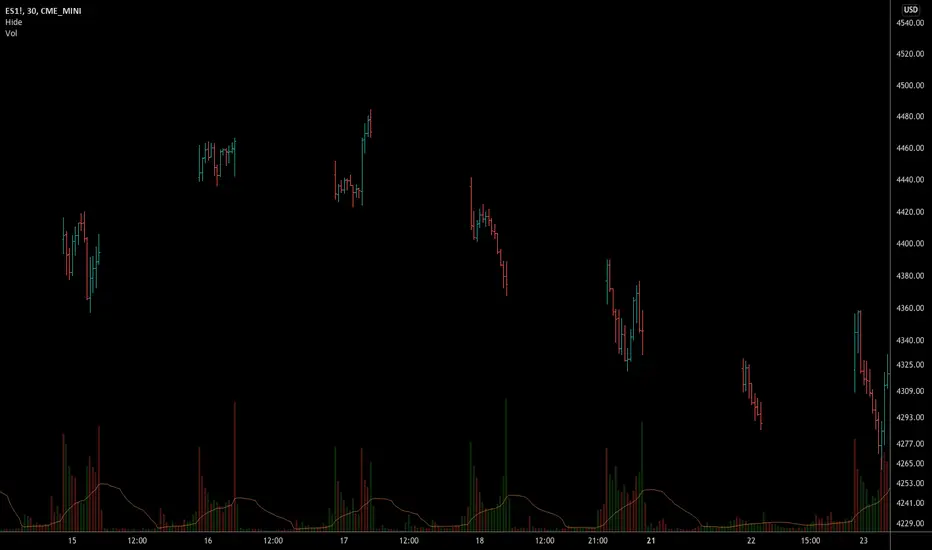
Hide extended hours/non-intraday barsEspecially for future users, such as ES/NQ/RTY/YM, etc., this script can hide the extended hours/non-intraday bars and leave the intraday bars only.
With this script , you can find the intraday support/resistance quite easily!
Example, if you are a ES investor, you can easily find the intraday support/resistance level ,which is almost equal to SPY, with this script, and no need to check SPY separately again , saving your time a lot.
Note: Please couple this script with American Bars. If you use candle charts, the upper/lower pins of the candle can't be hidden with the bars together, which is restricted by the code editor itself...
Swim Trading - Beta Trend FilterSwim Trading's Optimized Beta Trend Filter
Validated Outcome For SPY
Expected CAR (1995 to 2019): 15.11% p.a.
MDD: 19.03%
Buy & Hold SPY: 7.8% p.a. CAR

GA - Comparative Relative StrengthGA - Comparative Relative Strength is an Oscillator. It shows the Relative Strength of a Financial Instrument .
It defines the Relative Strength in relation to Markets, Sectors, Sub-sectors ETFs . Besides, it includes also Currency Indices and the manual selection of Financial Instruments.
Groups of ETFs and Manual Selection
You enable the Group of Financial Instruments that collects the ETF in your interest. Besides, you can enable more that one group. This lets you show Relative Strength Curves related to ETFs of the groups selected.
For example, it can show the Relative Strength related to Market and Sector ETFs. Besides, you can show the Relative Strength related to Sector and Industry ETFs.
The Groups of ETFs are SPDR Categories:
SPDR Core ETFs.
SPDR Select Sector ETFs.
SPDR Industry ETFs.
An extra group includes Currency Indices.
Oscillator around Zero
The Relative Strength of 2 Financial Instruments waves around a borderline. This line is a mean. The GA - Comparative Relative Strength normalizes the curve to the borderline. This makes an Oscillator around Zero.
Upper and Lower Bands
Upper and Lower Bands can follow the full curve. But you can Enable or Disable the visualization of Partial Bands. They follow the curve only for positive waves or for negative waves.
Bands are dynamic levels. Their role is to define where the Relative Strength becomes relevant or normal. When the Relative Strength persists above the Upper Band, Financial Instrument is strong. When the Relative Strength persists below the Lower Band, Financial Instrument is weak.
The Upper and Lower Bands are relevant tools in the decision process to enter the market long or short.
You need to buy Financial Instrument that is outperforming the related market. In the same way, short/sell financial instruments that are under-performing the marketplace.
A Relative Strength that decreases below the Upper Band shows a weakening. A Relative Strength that increases above the Lower Band shows a reinforcement. These indications can precede an eventual change of sentiment of large investors.
Currency Indices
The difficult part is when you want to define the Relative Strength of a Currency Pair. In this case, you can compare a pair with a group of other related pairs. In the same way, you can try to use a Currency Index or a specific calculation.
The use of a Currency Index shows limitations to define the Relative Strength in a proper way.
But an expert trader can define it in different ways so as with different tools. Besides, an expert trader knows the pairs included in the currency index. Moreover, he knows the formula and the weights of the currency pairs included in the index.
The GA - Comparative Relative Strength gives you a collection of Currency Indices. You can enable it and use the Currency Index you need.
Note: I restrict access to the tool.
Regards
Girolamo Aloe
Founder of Profiting Me
------------
Examples
Comparative Relative Strength of APD on SPY (Market Composite Average)
Comparative Relative Strength of APD on XLB Materials Sector
Comparative Relative Strength of ADP on SPY and ADP on XLB

Two level MACD into one indicatorMerged two level MACD into one indicator, then Long Entry (buy) and Short Entry (sell) is more clearly now.
Try and test it, please send me some feedback or suggestions, then the indicator can help you make money more easy!
good luck!
AMEX:SPY

SS EMA / SMA RibbonColor Change if above or below EMAs / Ribbon
StokedStocks EMA / SMA Ribbon 9 20 25 30 35 40 45 50 55 60 65 70 75 80 85 90 95 100 200
EMAs Color Change if above or below EMAs / Ribbon
Lime : Uptrending; Long Bias
Green : Dip Buy / ReEntry or downtrend reversal warning
Red : Downtrend. Short Bias
Maroon : Short Reentry (sell the peak) or uptrend reversal warning
1st strategy Long when Price crosses above all EMAs
2nd strategy if late is buy first or second pullback to 9 or 20 EMA which are the 1st and 2nd ribbon lines (in an uptrend)
3rd strategy is Short once price crosses UNDER all EMAs
Use Trailing stop % once long or short
Better when shorter time frames line up with Longer time Frames for less risk EXAMPLE Above all EMAs on 5min chart and on Daily Chart

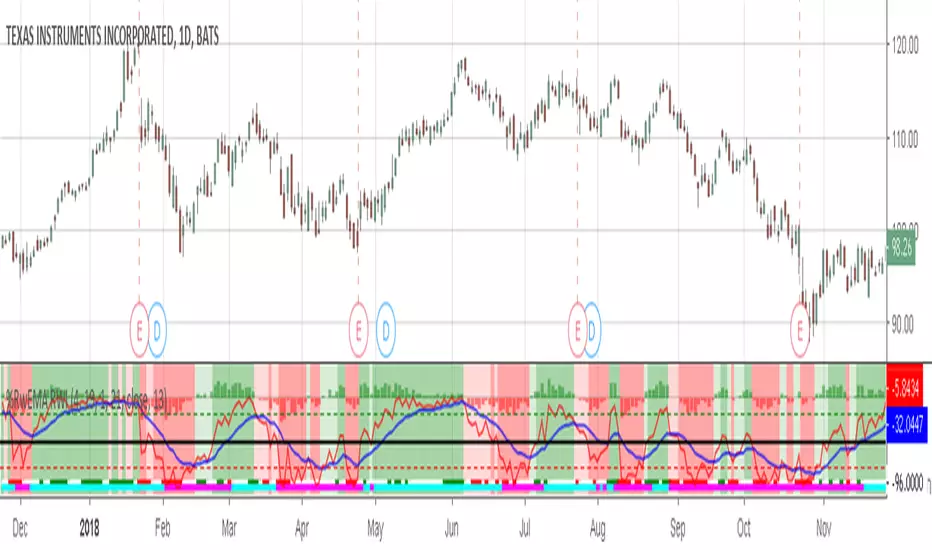
Willams %RwEMAspy
Was looking for something else when surfed into an old question
wanting %R 21 period with EMA 13 period of the %R signal
and being a rookie at this, made this code to post for them.
Tried to comment the script in such a way that other rookies
like me could make better sense of what is being done. Hope
this helps someone. I find it useful as one of my indicators for
trading.
Pinescript for tradingview.com user Tom1trader
All time frames.
Interpretation:
%R (Red) crosses above it's average (Blue) - bull
%R crosses below it's average - bear. Background
color changes green-up red-down with above crossings.
Most but not all of serious price movement takes place
from the time the %R (red) goes into oversold (or bought) and
exits again.
%R centerline crosses can also be useful.
I use various indicators and want all of the confirmation
that I can get for expectations BUT I never know what the
next bar will do and define my risks accordingly.
Sectors Relative Strength Normal DistributionI wrote this indicator as an attempt to see the Relative Strengths of different sectors in the same scale, but there is also other ways to do that.
This indicator plots the normal distribution for the 10 sectors of the SPY for the last X bars of the selected resolution, based on the selected comparative security. It shows which sectors are outperforming and underperforming the SPY (or any other security) relatively to each other by the given deviation.

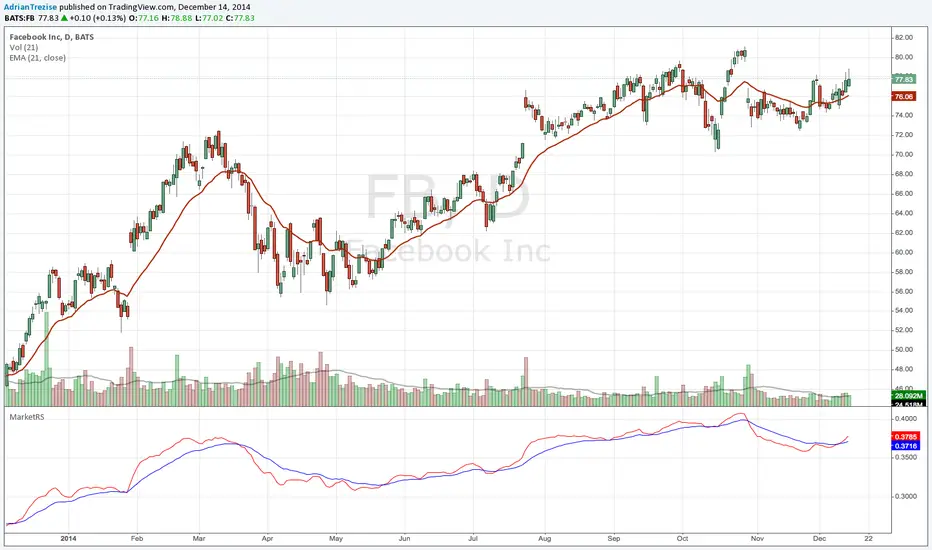
MarketRSThe strength of a stock relative to the market (SPY) is an import indicator accumulation of a stock by institutionan funds, especially during a market decline. This indicator plot the ratio of a security/SPY and plots a fast (5 period) and slow (21 period) EMA.
Anurag Institutional Swing Trader Pro [Robust]nstitutional Swing Flow is a comprehensive, multi-timeframe system designed for swing traders who want to align with "Smart Money" rather than fight against it.
Unlike standard indicators that rely solely on price crossovers, this script analyzes the underlying order flow—tracking stealth accumulation, volume anomalies, and institutional footprints—to generate high-probability swing setups.
Key Features (The "Smart Money" Logic)
1. Institutional Footprints
Stealth Accumulation/Distribution: Detects when price is held in a tight range despite high volume (a classic sign of institutions building a position).
Smart Money Divergence: Identifies when price makes a lower low but Money Flow (OBV/Accumulation-Distribution) makes a higher high.
Fair Value Gaps (FVG): Automatically plots Bullish and Bearish imbalance zones where price is likely to retrace before continuing the trend.
2. Safety First (Risk Management)
Real Earnings Detection: Automatically checks upcoming earnings dates. If an earnings report is within 5 days (adjustable), the script blocks new signals to prevent gambling on binary events.
Visual Exits: Plots dynamic Stop Loss and Take Profit levels on the chart the moment a trade is taken, along with "SL Hit" or "TP Hit" markers for visual backtesting.
3. The "Confluence Score" Dashboard A sophisticated dashboard in the top-right corner rates every setup on a scale of 0 to 100 based on:
Multi-Timeframe Trend: Is the Weekly, Daily, and 4H trend aligned?
Relative Strength: Is the asset outperforming the SPY benchmark?
Volatility: Is the asset in a "Squeeze" (Bollinger Band compression)?
Momentum: RSI, MACD, and CMF confirmation.
Only setups with a score > 65 (adjustable) trigger a BUY or SELL signal.
How to Use
Timeframe: Optimized for 4-Hour (4H) and Daily (D) charts. (Avoid using on <15m charts due to multi-timeframe calculations).
The Signal: Wait for a large "CALL" or "PUT" label.
The Confirmation: Check the Dashboard. Ideally, look for a "Squeeze: YES" combined with a high Institutional Buy Score.
The Exit: Follow the Red (Stop Loss) and Green (Take Profit) lines plotted automatically.
Disclaimer
This tool is for educational purposes only. Swing trading involves risk. Always confirm signals with your own analysis and risk management rules.

DCA Destroyer[Sahebson]Smart DCA Signal Calculator with Dynamic Position Sizing: (Designed for SPY or QQQ)
Transform your dollar-cost averaging strategy with intelligent position sizing.
This indicator identifies market exhaustion points where price reversals are likely, then calculates optimal position sizes based on the severity of the correction. Instead of buying fixed amounts on fixed dates, it deploys capital strategically when assets show oversold conditions, automatically scaling investment amounts from small positions on minor dips to aggressive positions during major corrections.
Core Features:
Exhaustion Detection: Identifies reversal points using swing analysis and momentum indicators
Dynamic Position Sizing: 8-tier multiplier system (0.1x to 25x base amount) based on drawdown depth
Real-Time Comparison: Side-by-side performance tracking vs traditional DCA
Adaptive Scaling: Exponential curve matches market volatility patterns
Risk Management: Tracks average cost, share accumulation, and ROI metrics
Visual Signals: Color-coded buy arrows with multiplier and amount labels
How It Works:
Monitors price for exhaustion patterns (sustained selling pressure followed by reversal)
Measures current drawdown from recent highs
Calculates position multiplier based on correction severity
Displays buy signal with recommended purchase amount
Tracks cumulative performance vs baseline DCA strategy
Use Cases:
Systematic accumulation of long-term positions
Optimizing entry timing for core holdings
Capital-efficient portfolio building
Crash buying with predetermined rules
Emotion-free position sizing
Ideal For:
Long-term investors building positions
Traders seeking systematic dip-buying rules
Portfolio managers optimizing capital deployment
Anyone practicing dollar-cost averaging who wants better results
Customizable Parameters:
Adjust exhaustion sensitivity (swing length, bar count)
Configure multiplier tiers for your risk tolerance
Set lookback period for drawdown measurement
Define base position size and DCA comparison amount
Performance Metrics:
Real-time ROI comparison (strategy vs DCA)
Share accumulation efficiency
Average cost basis tracking
Signal quality analytics
Tier distribution analysis

NeuralFlow Forecast Levels - User InputsThis is a companion indicator that plots AI-adaptive market equilibrium and expansion mapping levels directly on the SPY chart.
NeuralFlow Forecast Levels are generated through a Artificial Intelligence framework trained to identify:
Where price is statistically inclined to re-balance
Where expansion zones historically exhaust rather than extend
This is structure mapping, not prediction.
......................................................................................
What the Bands Represent?
AI Equilibrium (white core)
Primary weekly balance zone where price is most likely to mean-revert.
Predictive Rails (aqua / purple)
High-confidence corridor of institutional flow containment.
Outer Zones (green / red)
Expansion limits where continuation historically begins to decay.
Extreme Zones (top / bottom)
Rare deviation envelope where auction completion is statistically favored.
.The engine updates only when underlying structure changes —
not when candles fluctuate intraday.
.................................................................................................................
Usage Context
These levels are contextual reference zones, not entry signals. They are designed to answer:
Where does price matter?
Where does continuation weaken?
Where does balance statistically reassert itself?
Risk Disclaimer
Educational and analytical use only. Not financial advice.

Optimized Options Day Trading Script -Anurag Dec20-2025This indicator is a specialized Multi-Timeframe Trend & Regime System designed specifically for intraday trading on SPY, QQQ, and SPX. It is optimized for high-volatility execution (like 0DTE) by filtering out "choppy" low-probability conditions before they happen.
Unlike standard indicators that only look at the current chart, this script runs a background check on the 15-Minute Timeframe

TRS (Trend Readiness System)TRS – Trend Readiness System
TRS (Trend Readiness System) is a trend-aligned trading framework designed to help you identify stocks that are becoming ready for entry , not just those already breaking out.
Instead of producing noisy buy/sell signals, TRS evaluates trend quality, pullback structure, momentum rebuilding, and market context , and converts them into clear scores, states, and timing awareness — both on the chart and inside the TradingView Screener.
---
Core Philosophy
Strong trends don’t start at the breakout — they start when conditions quietly align.
TRS focuses on:
• Primary trend alignment
• Healthy pullbacks above long-term support
• Early momentum recovery
• Market regime confirmation
• Entry timing (fresh vs late)
---
What TRS Measures
1. Setup Score (Trend Quality)
Answers the question: “Is this stock structurally worth watching?”
Based on:
• Price position relative to MA150
• Long-term trend direction
• Higher-low structure
• Distance from MA150 (overextension control)
• Market regime (bullish / bearish)
---
2. Entry Score (Timing Quality)
Answers the question: “Is the timing right — or still early?”
Based on:
• Short and mid-term moving averages
• Pullback behavior
• Momentum stabilization
• Volume confirmation
---
3. General Score
A combined readiness score used for ranking in the TradingView Screener:
General Score = Setup Score + Entry Score
---
Entry State Tracking (Key Feature)
TRS tracks the full entry lifecycle , not just signals:
• Valid Entry
• Pending Entry (almost ready)
• Bars Since Valid Entry
• Entry Window (Fresh / Expired)
• Entry Still Valid (Yes / No)
This helps avoid chasing late or already-played setups.
---
Market Regime Filter
Signals automatically adapt to overall market conditions:
• Market trend confirmation (e.g. SPY / QQQ)
• Reduced false signals during weak markets
• Clear explanation when setups are blocked
---
Visual Dashboard (Optional)
The on-chart dashboard can display:
• General Score
• Market state
• Setup quality
• Entry status
• Entry window
• Bars since entry
• Blocking reason (if any)
You can switch between:
• Minimal mode – essential info only
• Full table mode – detailed diagnostics
---
Screener Integration
TRS exposes clean numeric outputs for the TradingView Pine Screener:
• Setup Score
• Entry Score
• General Score
• Pending Entry (1 / 0)
• Valid Entry (1 / 0)
• Bars Since Valid Entry
• Market Bullish (1 / 0)
Example Screener Filters:
• Setup Score ≥ 50
• Pending Entry = 1
• Bars Since Valid Entry ≤ 3
• Market Bullish = 1
---
How to Use TRS (Daily Routine)
Step 1 – Scan
• Look for high Setup Score
• Prefer Pending Entry = 1
Step 2 – Review
• Confirm pullback quality
• Check MA150 support
• Observe momentum rebuilding
Step 3 – Act
• Enter only on Valid Entry
• Avoid expired entry windows
• Skip setups blocked by market regime
---
What TRS Is NOT
• Not a breakout chaser
• Not a day-trading system
• Not signal spam
TRS is a decision-support system for swing and position traders who value structure, context, and timing.
---
Best Used On
• Daily timeframe (1D)
• Liquid stocks & ETFs
• Trend-following strategies
• Portfolio-level screening
---

Market Pressure Regime [Interakktive]The Market Pressure Regime (MPR) is a 4-state market classifier that models how structural forces create "pressure zones" — regions where price movement is either supported (Release) or suppressed (Pinned) by market microstructure.
It combines compression analysis, follow-through efficiency, and stress detection into a composite pressure score, classifying markets into Release, Suppressed, Transition, or Trap states — helping traders understand WHY price is moving (or not moving) in the current environment.
█ USAGE
MPR addresses a core question traders face: Is the market in a regime where directional moves are likely to follow through, or is it structurally pinned?
For swing traders, MPR identifies Release phases where momentum strategies work best, and Suppressed phases where mean reversion dominates.
For day traders, it highlights Trap conditions — high effort with no follow-through — where reversals are probable and trend entries fail.
🔹 The 4-State Model
The indicator classifies markets into four distinct regimes:
• Release (Teal): Pressure score ≥ +5. Directional flow dominates. Price moves efficiently with follow-through. Favor trend continuation.
• Suppressed (Grey): Pressure score ≤ -5. Compression dominates. Price is range-bound or pinned. Fade extremes, expect reversion.
• Transition (Amber): Score between thresholds OR instability detected. Regime is uncertain — wait for confirmation before committing.
• Trap (Magenta): High stress + low follow-through. Effort without result. Expect reversals.
🔹 Reading the Pressure Histogram
The histogram displays the composite Pressure Score (range approximately -100 to +100):
• Positive values: Follow-through exceeds compression. Market is "releasing" — directional moves are supported.
• Negative values: Compression exceeds follow-through. Market is "suppressed" — price movement is constrained.
• Color reflects confirmed state: The histogram uses persistence filtering — a state must hold for N bars before the color changes, preventing false signals from noise.
🔹 The 5-Stage Calculation
MPR synthesizes five analytical stages into the final state:
1. Compression Score: Measures how tight the current range is relative to ATR. High compression suggests structural forces are pinning price.
2. Follow-Through Score: Measures price path efficiency (MER-style). Efficient moves indicate genuine directional flow, not chop.
3. Stress Score: Detects effort-without-result (ERD-style). High volume or range with no price progress = absorption.
4. Composite Pressure: Combines follow-through and compression into a single directional score.
5. Persistence Filter: Requires states to hold for configurable bars before confirming, eliminating flickering.
█ SETTINGS
Core Settings
• ATR Length: Period for volatility normalization. Default 14.
• Baseline Lookback: Period for compression and efficiency baselines. Default 20.
• Volume Average Length: Period for stress calculation baseline. Default 20.
State Classification
• Release Threshold: Pressure score above this = Release. Default +5.
• Suppressed Threshold: Pressure score below this = Suppressed. Default -5.
• Trap Threshold: Stress score above this (with low follow-through) = Trap. Default 30.
• Persistence Bars: Bars required to confirm state change. Default 3.
• Stability Lookback: Period for stability calculation. Default 20.
• Stability Threshold: Below this = forced Transition state. Default 0.5.
Visual Settings
• Show Pressure Histogram: Display the main pressure score histogram.
• Show Zero Line: Display the zero reference line.
• Show Background Tint: Subtle background color by state (default OFF).
Data Window
• Show Data Window Values: Export all calculated scores for analysis.
█ INTERPRETATION GUIDE
When to Use Trend Strategies (Release):
• Histogram tall and positive
• Teal coloring confirmed
• Price making efficient higher highs or lower lows
When to Use Mean Reversion (Suppressed):
• Histogram flat or negative
• Grey coloring confirmed
• Price oscillating without follow-through
When to Wait (Transition):
• Amber coloring
• Mixed signals — don't force trades
• Wait for state to resolve
When to Expect Reversals (Trap):
• Magenta coloring
• High volume moves that don't stick
• Often occurs at structural inflection points
█ COMPLEMENTARY TOOLS
MPR pairs well with:
• Volatility State Index (VSI) — Confirms whether volatility is expanding into the pressure regime
• Effort-Result Divergence (ERD) — Provides bar-by-bar absorption/vacuum detection
• Market Efficiency Ratio (MER) — Validates follow-through quality
█ SUITABLE MARKETS
Works across all liquid markets:
• Equities: SPY, QQQ, liquid single stocks
• Futures: ES, NQ, CL, GC
• Crypto: BTC, ETH
• Forex: Major pairs
Works on any timeframe, but 1H–Daily provides cleanest regime classification. Intraday (5m–15m) useful for session-level tactical decisions.
█ OPEN SOURCE
This indicator is open-source for educational purposes. Review the code to understand the full calculation methodology.
█ DISCLAIMER
This indicator is for educational and informational purposes only. It does not constitute financial advice. Past performance does not guarantee future results. Always conduct your own analysis and use proper risk management.

ema200 filler═══════════════════════════════════════════════════════════════
TRADINGVIEW INDICATOR DESCRIPTION
═══════════════════════════════════════════════════════════════
TITLE: EMA 200 Filler - Visual Trend Indicator
SHORT DESCRIPTION:
Instantly see trend direction with color-coded shading between price and the 200 EMA. Green above = bullish, Red below = bearish.
═══════════════════════════════════════════════════════════════
MAIN DESCRIPTION
═══════════════════════════════════════════════════════════════
🎨 SEE THE TREND AT A GLANCE
This elegant indicator fills the space between price and the 200-period Exponential Moving Average (EMA) with color-coded shading, making trend direction instantly obvious without any analysis required.
✨ KEY FEATURES:
• Visual Trend Clarity - Green fill = bullish zone, Red fill = bearish zone
• EMA 200 Line - The institutional trader's favorite trend indicator
• Dynamic Shading - Fill automatically adjusts as price moves
• Clean Design - Semi-transparent fills won't clutter your chart
• Zero Configuration - Works perfectly right out of the box
• Universal Application - Works on any timeframe, any asset
📊 WHAT YOU SEE:
🟢 GREEN SHADED AREA
→ Price is ABOVE the 200 EMA
→ Bullish trend in effect
→ Look for LONG opportunities
🔴 RED SHADED AREA
→ Price is BELOW the 200 EMA
→ Bearish trend in effect
→ Look for SHORT opportunities
🔵 BLUE LINE = 200 EMA
→ The dividing line between bull and bear zones
→ Major support/resistance level
→ Institutional trend filter
💡 WHY THE 200 EMA MATTERS:
The 200-period EMA is one of the most widely watched technical indicators by:
✓ Institutional traders and hedge funds
✓ Day traders and swing traders
✓ Algorithmic trading systems
✓ Technical analysis professionals
When millions of traders watch the same level, it becomes a self-fulfilling prophecy - making it incredibly powerful for entries, exits, and stop placement.
🎯 TRADING APPLICATIONS:
✓ **Trend Filter** - Only take longs in green, shorts in red
✓ **Trend Confirmation** - Strong trends stay on one side for extended periods
✓ **Reversal Signals** - Watch for crossovers when price crosses the 200 EMA
✓ **Support/Resistance** - 200 EMA acts as dynamic support in uptrends, resistance in downtrends
✓ **Stay Out Zones** - Avoid trading when price chops around the 200 EMA (mixed colors)
📈 PERFECT FOR:
✓ Swing traders who need clear trend direction
✓ Day traders using the 200 EMA as a filter
✓ Beginners who want simple trend identification
✓ Multi-timeframe analysis (check higher timeframe trend)
✓ Anyone who wants cleaner charts with instant trend clarity
⚙️ WORKS WITH:
• All asset classes (stocks, forex, crypto, commodities, indices)
• All timeframes (1-minute to monthly charts)
• Combines perfectly with other indicators
• No special settings required - just add and trade
🌟 CLEAN & PROFESSIONAL:
• Semi-transparent fills (70% opacity) - won't hide candles or other indicators
• White price line for clear visibility
• Blue EMA line - industry standard color
• Minimalist design philosophy
🚀 INSTANT SETUP:
1. Add indicator to chart
2. Start trading with the trend
3. That's it - no configuration needed!
The simplest way to visualize trend direction. When you see green, think bullish. When you see red, think bearish. Trading doesn't get more straightforward than this.
═══════════════════════════════════════════════════════════════
CATEGORIES:
• Trend Analysis
• Moving Averages
• Overlays
TAGS:
ema, ema 200, moving average, trend indicator, trend filter, visual indicator, exponential moving average, 200 ema, trend following, color coded, bullish bearish
═══════════════════════════════════════════════════════════════
QUICK START GUIDE
═══════════════════════════════════════════════════════════════
🚀 QUICK START - EMA 200 Filler
──────────────────────────────────────────────────────────────
STEP 1: ADD TO CHART
──────────────────────────────────────────────────────────────
1. Open TradingView
2. Load any chart (stocks, forex, crypto - anything!)
3. Click "Indicators" button at top
4. Search: "EMA 200 Filler"
5. Click to add
You're done! No settings to adjust.
──────────────────────────────────────────────────────────────
STEP 2: UNDERSTAND THE COLORS
──────────────────────────────────────────────────────────────
The indicator fills the space between PRICE and the 200 EMA:
🟢 GREEN FILL = BULLISH ZONE
• Price is above the 200 EMA
• Uptrend is active
• Bias: Look for LONG entries only
🔴 RED FILL = BEARISH ZONE
• Price is below the 200 EMA
• Downtrend is active
• Bias: Look for SHORT entries only
🔵 BLUE LINE = 200 EMA
• The trend dividing line
• Acts as support in uptrends
• Acts as resistance in downtrends
──────────────────────────────────────────────────────────────
STEP 3: BASIC TRADING RULES
──────────────────────────────────────────────────────────────
📈 RULE #1: TRADE WITH THE COLOR
In GREEN zone:
→ Only look for LONG setups
→ Buy dips toward the 200 EMA
→ Avoid shorting against the trend
In RED zone:
→ Only look for SHORT setups
→ Sell rallies toward the 200 EMA
→ Avoid longing against the trend
──────────────────────────────────────────────────────────────
🎯 RULE #2: USE THE 200 EMA AS SUPPORT/RESISTANCE
In GREEN (uptrend):
→ 200 EMA acts as SUPPORT
→ Price bouncing off 200 EMA = buy opportunity
→ Price breaking BELOW 200 EMA = trend change warning
In RED (downtrend):
→ 200 EMA acts as RESISTANCE
→ Price rejecting at 200 EMA = sell opportunity
→ Price breaking ABOVE 200 EMA = trend change warning
──────────────────────────────────────────────────────────────
⚠️ RULE #3: AVOID THE CHOP ZONE
When price keeps crossing the 200 EMA (color changing frequently):
→ Market is RANGING, not trending
→ Stay out or reduce position size
→ Wait for a clear trend to establish
──────────────────────────────────────────────────────────────
STEP 4: TRADING STRATEGIES
──────────────────────────────────────────────────────────────
✅ STRATEGY #1: TREND FOLLOWING (PULLBACK ENTRIES)
Wait for GREEN zone (bullish trend):
1. Price pulls back toward the 200 EMA (blue line)
2. Look for bullish reversal candle near 200 EMA
3. Enter LONG
4. Stop below 200 EMA
5. Hold while in green zone
Example:
• Chart shows green shading
• Price dips to 200 EMA and bounces
• Enter long at bounce confirmation
• Stop 5-10 pips below 200 EMA
• Exit when price crosses back below 200 EMA (turns red)
──────────────────────────────────────────────────────────────
✅ STRATEGY #2: BREAKOUT TRADING (TREND CHANGE)
Watch for color change (crossover):
GREEN → RED (bearish reversal):
1. Price crosses below 200 EMA
2. Fill turns from green to red
3. Enter SHORT on next pullback to 200 EMA
4. Stop above 200 EMA
5. Ride the new downtrend
RED → GREEN (bullish reversal):
1. Price crosses above 200 EMA
2. Fill turns from red to green
3. Enter LONG on next pullback to 200 EMA
4. Stop below 200 EMA
5. Ride the new uptrend
──────────────────────────────────────────────────────────────
✅ STRATEGY #3: HIGHER TIMEFRAME FILTER
Use this indicator on a HIGHER timeframe as a filter:
Example for day trading:
• Add indicator to DAILY chart
• Check the color: Green or Red?
• Switch back to your trading timeframe (5m, 15m, etc.)
• Only take trades in the direction of daily trend
If daily = GREEN → Only take longs on lower timeframes
If daily = RED → Only take shorts on lower timeframes
This keeps you aligned with the bigger trend!
──────────────────────────────────────────────────────────────
STEP 5: REAL TRADING EXAMPLES
──────────────────────────────────────────────────────────────
📊 EXAMPLE #1: LONG ENTRY IN UPTREND
Chart: SPY on 1-hour timeframe
Indicator: Green fill (price above 200 EMA)
Setup:
• Price at 450, 200 EMA at 445
• Green shading shows bullish trend
• Price pulls back to 446 (near 200 EMA)
• Bullish hammer candle forms at 200 EMA
Trade:
→ Enter LONG at 446.50
→ Stop at 444.50 (below 200 EMA)
→ Target: Previous high at 452
→ Risk: 2 points | Reward: 5.50 points = 2.75:1 R/R
──────────────────────────────────────────────────────────────
📊 EXAMPLE #2: SHORT ENTRY IN DOWNTREND
Chart: EUR/USD on 4-hour timeframe
Indicator: Red fill (price below 200 EMA)
Setup:
• Price at 1.0850, 200 EMA at 1.0900
• Red shading shows bearish trend
• Price rallies to 1.0895 (near 200 EMA)
• Bearish rejection candle at 200 EMA
Trade:
→ Enter SHORT at 1.0890
→ Stop at 1.0910 (above 200 EMA)
→ Target: 1.0820 (recent support)
→ Risk: 20 pips | Reward: 70 pips = 3.5:1 R/R
──────────────────────────────────────────────────────────────
📊 EXAMPLE #3: AVOID THE CHOP
Chart: Bitcoin on 15-minute timeframe
Indicator: Color keeps changing (green/red/green/red)
Observation:
• Price crossed 200 EMA 4 times in 2 hours
• No clear trend established
• Whipsaw action
Action:
→ STAY OUT - wait for clear trend
→ Check higher timeframe for direction
→ Come back when one color dominates
──────────────────────────────────────────────────────────────
STEP 6: PRO TIPS
──────────────────────────────────────────────────────────────
💡 **Combine with Price Action**
Don't just enter because it's green - wait for bullish candle patterns (hammer, engulfing, etc.) at the 200 EMA for high-probability setups.
💡 **Respect the 200 EMA**
The longer price stays on one side, the stronger that side becomes. A stock green for months has strong bullish momentum.
💡 **Watch Volume at Crossovers**
When price crosses the 200 EMA with HIGH volume = strong signal
Low volume crossover = might be false breakout
💡 **Use Multiple Timeframes**
• Daily chart = overall trend direction
• 4H chart = swing trade setups
• 1H chart = day trade entries
Always align smaller timeframe trades with larger timeframe color!
💡 **Strongest Setups = Clean Trends**
Best trades happen when:
• Chart stays ONE color for extended period
• Price respects 200 EMA as support/resistance
• No frequent crossovers
──────────────────────────────────────────────────────────────
COMMON QUESTIONS
──────────────────────────────────────────────────────────────
❓ "What if price crosses the 200 EMA frequently?"
→ That's a ranging market. Stay out or trade smaller size. Wait for a clear trend.
❓ "Can I change the colors?"
→ Not in this version, but green/red is universal and intuitive.
❓ "Does this work on all timeframes?"
→ Yes! But longer timeframes (4H, Daily) tend to give cleaner signals.
❓ "Should I always use the 200 EMA?"
→ The 200 is the institutional standard. Stick with it for consistency.
❓ "What about the 50 or 20 EMA?"
→ You can add those separately. This indicator focuses on the proven 200 EMA.
──────────────────────────────────────────────────────────────
THE GOLDEN RULE
──────────────────────────────────────────────────────────────
🟢 GREEN = GO LONG (or stay long)
🔴 RED = GO SHORT (or stay short)
🔄 FREQUENT CHANGES = STAY OUT
It's that simple. The trend is your friend - this indicator just makes it impossible to miss!
──────────────────────────────────────────────────────────────
Happy Trading! 📈
──────────────────────────────────────────────────────────────

ODTE Layman Signals 📌 Script Name
Layman Options Signals – Structured BUY CALL / BUY PUT with SL & TP
📖 Overview
This indicator is a complete, finished intraday trading system designed to simplify options trading (including 0DTE and weekly options) by converting price action and market structure into clear, actionable signals.
The script performs all analysis in the background and displays only what the trader needs to execute consistently:
BUY CALL or BUY PUT
Predefined Stop Loss (SL)
Two Take Profit levels (TP1 and TP2)
Trade status and levels displayed in a live status box
The focus of this tool is execution discipline, not prediction.
🧠 Core Concepts Used (What Makes This Script Original)
This script combines multiple price-action concepts into a single, rule-based framework:
1️⃣ Opening Range Breakout (ORB)
The script calculates the opening range high and low using the first X minutes of the regular session.
Trades are only allowed above ORB high for CALLs and below ORB low for PUTs.
This filters low-quality trades during early chop.
2️⃣ Market Structure Confirmation
CALL trades require higher highs and higher lows
PUT trades require lower lows and lower highs
This prevents trading against structure.
3️⃣ Retest & Liquidity Sweep Validation
Breakouts are validated using:
ORB retests (price accepts above/below the range)
Liquidity sweeps (false breakouts that trap traders)
This helps reduce fake breakouts.
4️⃣ Volatility-Aware Risk Management
Stop losses are placed using market structure + ATR buffer
This avoids stops being placed at obvious levels.
5️⃣ Multi-Target Trade Management
TP1 = partial profit (risk reduction)
TP2 = runner target (trend continuation)
After TP1, stop loss can move to breakeven (optional)
6️⃣ Discipline Controls
Only one active trade at a time
Cooldown period after a stop loss
Prevents over-trading and revenge trading
📊 What the Indicator Displays
The script plots the following directly on the chart:
Entry level
Stop Loss (SL)
Take Profit 1 (TP1)
Take Profit 2 (TP2)
Opening Range High & Low
It also includes a Status Box that always shows one of the following states:
WAIT
BUY CALL
BUY PUT
IN TRADE
COOLDOWN
This allows traders to understand the current state at a glance without reading code.
▶️ How to Use the Indicator
Recommended Timeframes
1-minute or 2-minute charts
Intraday use only
Entry Rules
When BUY CALL appears → Buy an ATM or slightly ITM call
When BUY PUT appears → Buy an ATM or slightly ITM put
Risk Management
Exit immediately if price hits the SL line
Take partial profits at TP1
Hold remaining position for TP2 if conditions allow
When Status Shows WAIT or COOLDOWN
No trade should be taken
⚙️ Recommended Instruments
SPY / QQQ
Liquid large-cap stocks
Intraday options (0DTE / weeklies)
⚠️ Important Disclaimer
This script is provided for educational purposes only.
It is not financial advice
It does not guarantee profits
It does not place trades automatically
Options trading involves significant risk
Always test using paper trading or small size before live use.
🎯 Who This Script Is For
✔ Traders who want clear rules
✔ Traders who prefer price action over indicators
✔ Options traders who value risk management
✔ Users who want less chart clutter and more discipline
❌ Not intended for swing trading
❌ Not intended for automated trading systems
🧩 Final Notes
This is a complete, finished indicator, not a test or experimental script.
All logic is deterministic, non-repainting, and designed for real-time use.
The philosophy behind this tool is simple:
Good trading comes from structure, discipline, and risk control — not prediction.

Volume Weighted Initial Balance This indicator dynamically calculates and plots a Volume-Weighted Initial Balance (VW-IB) for U.S. equity trading sessions (Regular Trading Hours: 9:30–16:00 ET). Unlike traditional time-based Initial Balance (fixed first 30/60 minutes), this version ends the IB formation when a user-defined percentage of the 20-day Average Daily Volume (ADV) is reached – providing a more adaptive, market-activity-driven range that better reflects actual participation.
Key Concepts and Methodology:
- 20-day Average Daily Volume (ADV20) is calculated using daily volume from the security's daily timeframe.
- A customizable target volume percentage (default 25%, adjustable 10–50%) determines the threshold (e.g., 25% of ADV20).
- The Initial Balance period begins at 9:30 AM ET and accumulates intrabar volume in real time.
- The IB completes on the first bar where either:
- Cumulative volume since open reaches or exceeds the target, OR
- A safety time cap (default 30 minutes, adjustable 15–60) is hit.
- Once complete, the script locks in the high and low of the IB period and plots them as horizontal lines.
- Additionally, it maintains a rolling 20-day history of prior IB ranges and computes their average. This average range is projected as a centered band around today's 9:30 open price, giving traders a statistical expectation of "normal" early-session volatility based on recent behavior.
Visual Features:
- Solid green/red lines for today's completed IB high and low.
- Blue circled lines and lightly filled band showing the 20-day average IB projection (centered on actual 9:30 open price).
- Subtle background shading while the IB is still forming.
- A clean top-right table displaying live status: completion state, today's IB range, 20-day average range, ADV20, and volume target.
- A label appears at completion showing exact range, minutes taken, and volume reached.
Usage Ideas:
- Use the VW-IB high/low as early support/resistance or breakout levels.
- Compare today's actual IB range to the 20-day average band for expansion/contraction context (wide today = high volatility day potential).
- Ideal for day traders on stocks, ETFs, or futures with clear RTH sessions (e.g., ES, NQ, SPY, QQQ, AAPL).
- Built-in alert fires only once per day when the VW-IB completes.
This is not a simple replication of fixed-time Initial Balance indicators. The volume-weighted termination (instead of rigid clock time), combined with real-time intrabar volume accumulation, safety time cap, rolling 20-day average projection band centered on actual open, and comprehensive live table, makes it uniquely adaptive and informative.

Minervini Scanner [MarketSmith RS] (up to 40 tickers)"Find the Leaders. Ignore the Laggards."
This dashboard is a complete Trend & Momentum Command Center designed to replicate the manual screening process of top growth traders like Mark Minervini and William O'Neil. It scans up to 40 tickers simultaneously to identify "Stage 2" super-performance candidates while filtering out broken trends and "zombie" stocks.
Core Features
1. The "Trend Template" Engine The scanner automatically checks every ticker against 7 strict trend criteria to verify a healthy Stage 2 Uptrend:
Price > 150-Day & 200-Day Moving Averages.
150-Day MA > 200-Day MA.
200-Day MA is Trending Up (at least 1 month).
50-Day MA > 150-Day & 200-Day MAs.
Price > 50-Day MA (Momentum Check).
Price > 25% above 52-Week Low.
Price within 25% of 52-Week High.
2. Institutional RS Rating (0-99) Unlike standard "Relative Strength" indicators that just compare price to SPY, this script uses the IBD/MarketSmith Methodology:
Weighted Performance: It calculates a composite score based on price performance over the last 12 months, with a heavy 40% weight on the most recent quarter.
Percentile Proxy: It maps this weighted score to a 1-99 rating scale using fixed constants derived from historical market leader data.
90-99 (Blue): Market Leaders (Top 10%).
80-89 (Green): Institutional Candidates.
< 70 (Red): Laggards.
How to Read the Dashboard
STAGE 2 (Lime Green): The "Holy Grail" signal. The stock meets 7/7 trend criteria. It is fundamentally sound and ready for a setup (like a VCP).
SETTING UP (Yellow): Score 5/7 or 6/7. The trend is developing but not perfect (e.g., 200MA might still be flat). Watch for improvements.
AVOID (Maroon): Broken trend. Moving averages are stacked downward. Do not trade long.
RS Rating: Look for the "Power Combo": A STAGE 2 trend status combined with an RS Rating of 80+. This indicates the stock is not only going up but is outperforming the vast majority of the market.
Settings & Customization
40-Ticker Watchlist: Monitor your entire focus list in one panel.
Adjustable Constants: You can fine-tune the RS Rating thresholds (p99, p90) to adapt to Bull or Bear market volatility.
MA Type: Switch between SMA (Simple) and EMA (Exponential) moving averages.
Disclaimer: This tool provides technical analysis data, not financial advice. Always manage risk.

Trading Volatility Clock⏰ TRADING VOLATILITY CLOCK - Know When the Action Happens (Anywhere in the World)
A real-time session tracker with multi-timezone support for active traders who need to know when US market volatility strikes - no matter where they are in the world. Perfect for day traders, scalpers, and anyone trading liquid US markets.
══════════════════════════════════════════════════════
📊 WHAT IT DOES
This indicator displays a live clock showing:
- Current time in YOUR selected timezone (10 major timezones supported)
- Active US market session with color-coded volatility levels
- Countdown timer showing time remaining in current session
- Preview of the next upcoming session
- Optional alerts when entering high-volatility periods
══════════════════════════════════════════════════════
🌍 MULTI-TIMEZONE SUPPORT
SESSIONS ALWAYS TRACK US MARKET HOURS (Eastern Time):
No matter which timezone you select, the sessions always trigger at the correct US market times. Perfect for international traders who want to:
• See their local time while tracking US market sessions
• Know exactly when US volatility hits in their timezone
• Plan their trading day around US market hours
SUPPORTED TIMEZONES:
• America/New_York (ET) - Eastern Time
• America/Chicago (CT) - Central Time
• America/Los_Angeles (PT) - Pacific Time
• Europe/London (GMT) - Greenwich Mean Time
• Europe/Berlin (CET) - Central European Time
• Asia/Tokyo (JST) - Japan Standard Time
• Asia/Shanghai (CST) - China Standard Time
• Asia/Hong_Kong (HKT) - Hong Kong Time
• Australia/Sydney (AEDT) - Australian Eastern Time
• UTC - Coordinated Universal Time
EXAMPLE: A trader in Tokyo selects "Asia/Tokyo"
• Clock shows: 11:30 PM JST
• Session shows: "Opening Drive" 🔥 HIGH
• They know: US market just opened (9:30 AM ET in New York)
══════════════════════════════════════════════════════
🎯 WHY IT'S USEFUL
Whether you trade futures, high-volume stocks, or ETFs, volatility isn't constant throughout the day. Knowing WHEN to expect movement is critical:
🔥 HIGH VOLATILITY (Red):
• Opening Drive (9:30-10:30 AM ET) - Highest volume of the day
• Power Hour (3:00-4:00 PM ET) - Second-highest volume, final push
⚡ MEDIUM VOLATILITY (Yellow):
• Pre-Market (8:00-9:30 AM ET) - Building momentum
• Lunch Return (1:00-2:00 PM ET) - Traders returning
• Afternoon Session (2:00-3:00 PM ET) - Trend continuation
• After Hours (4:00-5:00 PM ET) - News reactions
💤 LOW VOLATILITY (Gray):
• Overnight Grind (12:00-8:00 AM ET) - Thin volume
• Mid-Morning Chop (10:30-11:30 AM ET) - Ranges form
• Lunch Hour (11:30 AM-1:00 PM ET) - Dead zone
• Evening Fade (5:00-8:00 PM ET) - Volume dropping
══════════════════════════════════════════════════════
⚙️ CUSTOMIZATION OPTIONS
TIMEZONE SETTINGS:
• Select from 10 major timezones worldwide
• Clock automatically displays in your local time
• Sessions remain locked to US market hours
SESSION TIME CUSTOMIZATION:
• Every session boundary is adjustable (in minutes from midnight ET)
• Perfect for traders who define sessions differently
• Advanced users can create custom volatility schedules
DISPLAY OPTIONS:
• Toggle next session preview on/off
• Enable/disable high volatility alerts
• Clean, unobtrusive table display in top-right corner
══════════════════════════════════════════════════════
💡 HOW TO USE
1. Add indicator to any chart (works on all timeframes)
2. Select your timezone in Settings → Timezone Settings
3. Set your chart to 1-minute timeframe for real-time updates
4. Customize session times if needed (Settings → Session Time Customization)
5. Watch the top-right corner for live session tracking
TRADING APPLICATIONS:
• Avoid trading during dead zones (lunch hour, mid-morning chop)
• Increase position size during high volatility windows
• Set alerts for Opening Drive and Power Hour
• Plan your trading day around US market volatility schedule
• International traders can track US sessions in their local time
══════════════════════════════════════════════════════
🎓 EDUCATIONAL VALUE
This indicator teaches traders:
• Market microstructure and volume patterns
• Why certain times produce better opportunities
• How institutional flows create intraday patterns
• The importance of timing in active trading
• How to adapt US market trading to any timezone
══════════════════════════════════════════════════════
⚠️ IMPORTANT NOTES
- Works best on 1-minute charts for frequent updates
- Sessions are ALWAYS based on US Eastern Time (ET)
- Timezone selection only changes the clock display
- Clock updates when new bar closes (not tick-by-tick)
- Alerts trigger once per bar when enabled
- Perfect for international traders tracking US markets
══════════════════════════════════════════════════════
📈 BEST USED WITH
- High-volume US stocks: TSLA, NVDA, AAPL, AMD, META
- Major US ETFs: SPY, QQQ, IWM, DIA
- US Futures: ES, NQ, RTY, YM, MES, MNQ
- Any liquid US instrument with clear intraday volume patterns
══════════════════════════════════════════════════════
🌏 FOR INTERNATIONAL TRADERS
This tool is specifically designed for traders outside the US who need to:
• Track US market sessions in their local timezone
• Know when to be at their desk for US volatility
• Avoid waking up for low-volatility periods
• Maximize trading efficiency around US market hours
No more timezone confusion. No more missing the opening bell. Just set your timezone and trade with confidence.
══════════════════════════════════════════════════════
This is an open-source educational tool. Feel free to modify and adapt to your trading style!
Happy Trading! 🚀
