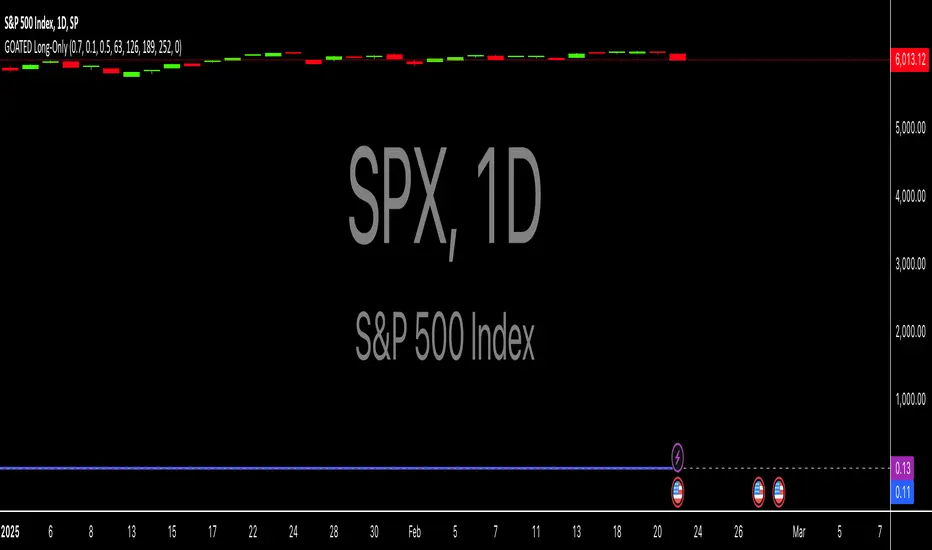
ADL-SPX Rank Difference-Buschi
English:
An expansion of the Advance Decline Line of the NYSE. It can be interesting to compare the Advance Decline Line with the corresponding benchmark index. I therefore made a ranking (0 to 100) based on the performance over the last days (default: 21 days). The difference is the target figure and ranges between -100 (bearish divergence) to +100 (bullish divergence).
Deutsch:
Eine Erweiterung der Advance Decline Line der NYSE. Oft möchte man den Verlauf der Advance Decline Line mit dem zugehörigen Leitindex vergleichen. Daher habe ich für beide ein Ranking (0 bis 100) erstellt auf Basis des Verlaufs über die letzten Tage (Standardwert: 21 Tage). Die Differenz stellt dabei die Zielgröße dar und schwankt zwischen -100 (bärische Divergenz) und +100 (bullische Divergenz).
ค้นหาในสคริปต์สำหรับ "spx"
Trend Channel [Gu5]SMA 200 determines the trend
Bullish trend, green candles. Down trend, red candles.
If the market value is narrow to the SMA200 channel, yellow candles.
Setting recommended for SMA Range
BTCUSD = 100
EURUSD = 1000
SPX = 100
ETHUSD = 10
ck - Crypto Correlation IndicatorA simple Correlation Indicator initially configured for Crypto Trader use (but other markets can use this too).
It plots the correlation between the current chart (say BTCUSD ) versus 4 user-definable indices, currency pairs, stocks etc.
By default, the indicator is preconfigured for:
GOLD (Oz/$),
Dow Jones Index (DJI),
Standard & Poor 500 Index (SPX) ,
Dollar Index ( DXY )
You can set the period (currently 1D resolution) in the "Period" box in the settings, valid inputs are:
minutes (number), days (1D, 2D, 3D etc), weeks (1W, 2W etc), months (1M, 2M etc)
Length is the lagging period/smoothing applied - default is 14
When changing comparison instruments/tickers, you may find it useful to prefix the exchange with the instrument's ticker, for example:
Binance:BTCUSDT, NYSE:GOOG etc
*** Idea originally from the brilliant Backtest Rookies - backtest-rookies.com ***
A.I.Driven TradersAI Model Trades for 20190612The entry and exit levels here are NOT derived from any specific indicator but are coming from our A.I. driven proprietary models.
This is an attempt at exploring the trading community here at TradingView and sharing our daily trading plans published at our site with the community here in the form a Pine Script - just starting and learning this platform. Please help point out any obvious errors or gotchas committed in the scripts. Thanks and have a great trading day!
**** The Trading Plan Published for today ****
>>>> Medium-Frequency Models: <<<<< For today, Wednesday 06/12, our medium-frequency models indicate using the 2895 as a pivot point - opening a long on a break above 2895, and opening a short on a break below 2895 (wait for a close on at least a five minute chart to determine the break), both sides with a 9-point trailing stop.
Note: For the trades to trigger, the breaks should occur during the regular session hours starting at 9:30am ET. By design, these models do NOT open any new positions after 3:45pm. Only one open position at any given time.
>>>>> Aggressive Intraday Models: <<<<< For today, Wednesday 06/12, our aggressive intraday models indicate going long on a break above 2892 or 2875 with an 6-point trailing stop, and going short on a break below 2887 or 2878 with an 8-point trailing stop.
Note: For the trades to trigger, the breaks should occur during regular session hours starting at 9:30am ET. Due to the intraday nature of these aggressive models, they indicate closing any open trades at 3:55pm and remaining flat into the session close. No opening of new positions after 3:45pm. Only one open position at any given time.
Kal’s MTF ADX Rangoli RollerKaly MTF ADX Rangoli Roller is a method/study for finding trending stocks, indexes and cryptocurrencies using two different data periods (10, 5) of ADX Overlap over different time-frames (10m, 1H, 4H, 1D, 1W, 1M). In the study, I used 5-Period ADX for all mentioned time-frames. You may use 10-Period ADX for lower time-frames especially 10m and 1H.
Sample Image of the pinescript code(at the end of this post) in Tradingview looks as follows:
Note: Kal's MTF ADX Rangoli Roller is the lower Plot. The upper plot is KAL’s ADX Overlap Technical Study with MACD Filter( )
Description:
----------------
In the study plot, the lowest row is 10m, row above is 1H, row above is 4H, then 1D, then 1W and highest row is 1M
Lime(Bright Green) dot implies Trending Uptrend for that time-frame (first phase)
Green dot implies Trending Uptrend for that time-frame (second phase near exhaustion)
Red dot implies Trending Downward for that time-frame (first phase)
Maroon dot implies Trending Downward for that time-frame (second phase near exhaustion)
Lime cross implies Strong Trending Uptrend for that time-frame (first phase)
Green cross implies Strong Trending Uptrend for that time-frame (second phase near exhaustion)
Red cross implies Trending Strong Downward for that time-frame (first phase)
Maroon cross implies Trending Strong Downward for that time-frame (second phase near exhaustion)
Yellow is ‘Squeeze On’ setting. During the squeeze period, the ADX signals are almost always ineffective. One may wait and watch over during this time. Once the Squeeze is released (i.e. no longer yellow), the trend corresponds to the color of the dots and crosses.
Black is CRSI Overbought condition for that time-frame. It’s best to wait and research for possibility of trend reversal because
1. Profit-booking/trimming happens after CRSI Overbought condition.
2. Large Short-sellers may take huge positions during this time pushing the stock prices up.
White is CRSI Oversold condition for that time-frame. It’s best to wait and research for possibility of trend reversal because
1. Profit-booking/trimming happens after CRSI Oversold conditions.
2. Large buyers may take huge positions during this time pushing the stock prices down.
I am a disabled man. Therefore, I am not able to write in detail here today. More Details will follow as time permits. Please let me know if I am missing anything…
Legal Disclaimer: I published here so I get replies from fellow viewers to educate myself and for my daily expenses. Hence, if anyone uses this script for making their decisions, I am not responsible for any failures incurred.
Safe Trading!
Kal Gandikota
PS: If you found this script interesting and edifying please follow and upvote.
PS2: Please kindly donate for my daily expenses (atleast as you would on streets) at the following addresses:
BTC Wallet: 1NeDC1GvpFa49DFLuT1v28ohFjqtoWXNQ5
ETH Wallet: 0x35e557F39A998e7d35dD27c6720C3553e1c65053
NEO Wallet: AUdiNJDW7boeUyYYNhX86p2T8eWwuELSGr
PS3: For more information on ADX and CRSI, please 'Google' or search here yourself.
PS4: This study is intended for research in creating automated Python Trading Systems using Pandas( steemit.com ).
Screenshots of the pinescript code looks as follows:
10minute Screenshot of Kal's MTF ADX Rangoli Roller (Above)
1 Hour Screenshot of Kal's MTF ADX Rangoli Roller (Above)
4 Hour Screenshot of Kal's MTF ADX Rangoli Roller (Above)
1 Day Screenshot of Kal's MTF ADX Rangoli Roller (Above)
1 Week Screenshot of Kal's MTF ADX Rangoli Roller (Above)
1 Month Screenshot of Kal's MTF ADX Rangoli Roller (Above)
Logarithmic Fibonacci RetraceThis script will allow you to use Logarithmic (instead of linear) Fibonacci retrace.
Please see excellent write up here: www.elliottwavetrader.net
explaining why logarithmic is preferred, especially over large price movement and long timeframes.
All TradingView fib tools use linear math, and will show incorrect long-term levels because of this.
HOW TO USE:
* Enter your points for Wave 0 and 1. Example: 1810.10 and 2872.87 in the SPX chart shown.
* Turn on "show lines" and "show labels". These are OFF by default because the chart will usually get warped
if you display the lines before entering the actual values you want.
* Change the "label offset" if the fib labels are too close or too far from the chart.
Please be aware that this is considered an "INDICATOR" script and so will not save the values separately
for each chart. You will need to enter new values each time you change to a different symbol.
Logarithmic Fibonacci ExtensionThis script will allow you to use Logarithmic (instead of linear) Fibonacci extensions.
Please see excellent write up here: www.elliottwavetrader.net
explaining why logarithmic is preferred, especially over large price movement and long timeframes.
All TradingView fib tools use linear math, and will show incorrect long-term levels because of this.
HOW TO USE:
* Enter your points for Wave 0, 1, and 2. Example: 666.79, 1219.80, 1010.91 in the SPX chart shown.
* Turn on "show lines" and "show labels". These are OFF by default because the chart will usually get warped
if you display the lines before entering the actual values you want.
* Change the "label offset" if the fib labels are too close or too far from the chart.
* Select up to 2.000, 3.000, and 4.000 to display higher-power fibs.
Please be aware that this is considered an "INDICATOR" script and so will not save the values separately
for each chart. You will need to enter new values each time you change to a different symbol.
Put/Call Ratio De-TrendedExperimenting with de-trending the various Put/Call Ratios.
Use with tickers PCCE, PCC, PCE, PCOEX, etc. Type "PUT" in the ticker field to see the many options. Use daily charts. Then you can hide the put call ratio and overlay SPX to see the signals. The default MAs are a common way to detrend. Basically takes the 10 day moving average and 127 day moving average(half year in trading days), to "de-trend" the ratio to weed out the noise that is seen in the ratio.
If you can find anything useful or interesting with this, let me know. I think it is useful as is, but if you find an interesting way to use it let me know.
Advance Decline Line NYSE-BuschiThis script shows the Advance Decline Line of the NYSE (dark blue)in comparison to the SPX (light blue). There is also a difference line of the two series (red).
Both are indexed to current values to allow a better overview. Series can be smoothed via the length of the Moving Average.
I consider it more of a work in progress. I work on a more inuitive kind of presentation.
Dollar / Stocks Correlation OscillatorMakes visual the theory that "a strong dollar is bullish for equities/stocks"
...but oh man, these two are definitely not that strongly correlated.
What's the deal with that? Still learning. Glad for any comments.
Relative StrengthRelative strength is a ratio between two assets, most often a stock and a market average (index). This implementation uses the method described here and the second method described here to calculate its value: "To calculate the relative strength of a particular stock, divide the percentage change over some time period by the percentage change of a particular index over the same time period". This indicator oscillates around zero. If the value is greater than zero, the investment has been relatively strong during the selected period; if the value is less than zero, the investment has been relatively weak. The period and the comparative symbol can be set in the settings for the indicator (the defaults are 50 and SPX), there you can also find an option to turn on a moving average.
Bollinger + RSI, Double Strategy Long-Only (by ChartArt) v1.2This strategy uses the RSI indicator together with the Bollinger Bands to go long when the price is below the lower Bollinger Band (and to close the long trade when this value is above the upper Bollinger band).
This simple strategy only places a long, when both the RSI and the Bollinger Bands indicators are at the same time in a oversold condition.
In this new version 1.2 the strategy was simplified even more than before by going long-only, which made the strategy more successful in backtesting than the previous version (that older version also opened short trades).
This strategy does not repaint and was updated to PineScript version 3.
All trading involves high risk; past performance is not necessarily indicative of future results. Hypothetical or simulated performance results have certain inherent limitations. Unlike an actual performance record, simulated results do not represent actual trading. Also, since the trades have not actually been executed, the results may have under- or over-compensated for the impact, if any, of certain market factors, such as lack of liquidity. Simulated trading programs in general are also subject to the fact that they are designed with the benefit of hindsight. No representation is being made that any account will or is likely to achieve profits or losses similar to those shown.
P.S. For advanced users: If you want also be able to short with the same strategy approach, then please use my older version 1.1:
Modulate 40 SymbolsModulates (multiplies) 40 securities
Useful for assessing breadth
Defaults with the Top 40 holdings in SPX
Change symbols to measure breadth in an ETF
Bars Since VIX MedianBARS SINCE VIX17 Median by dime (v1.0 release) 04/02/2017
(Inspired by "Bars Since the last RSI Extreme" from DRodriguezFX)
This indicator is useful in tracking how many daily bars since the VIX was last at a historically 'normal' range.
Currently the VIX has been in a period of low volatility for a period of 98 daily bars since the VIX was last at the 17 historical median.
Convert Yuan value symbols to USDIGNORE PREVIOUS SCRIPT/POST (titled: "yuan normiz")
If you like to look add symbols that are valued in China's Yuan and want to convert them to USD accurately then this is the perfect script for you.
"I'm not sure if this script is for me. Does my setup apply here?"
If either of these resemble your chart setup then this is for you:
Example 1: You have COINBASE:BTCUSD on your main chart often add to compare Bitstamp:btcusd and Okcoin:btccny.
Example 2: You have SPY or SPX (or DJIA etc) as your main chart but like to add other composites to compare like SSE(Shanghai Stock Exchange index) to your main chart.
This takes the symbol of your choice (default is BTCCHINA:BTCCNY) that is expressed in Yuan and divides it by the corresponding value of IDC's USDCNH ticker. Not the last value of USDCNH, but the respective tick mark----BTCCNY's close 3 months ago is divided by USDCNH's close 3 months ago.
Golden Cross, SMA 200 Moving Average Strategy (by ChartArt)This famous moving average strategy is very easy to follow to decide when to buy (go long) and when to take profit.
The strategy goes long when the faster SMA 50 (the simple moving average of the last 50 bars) crosses above the slower SMA 200. Orders are closed when the SMA 50 crosses below the SMA 200. This simple strategy does not have any other stop loss or take profit money management logic. The strategy does not short and goes long only!
Here is an article explaining the "golden cross" strategy in more detail:
www.stockopedia.com
On the S&P 500 index (symbol "SPX") this strategy worked on the daily chart 81% since price data is available since 1982. And on the DOW Jones Industrial Average (symbol "DOWI") this strategy worked on the daily chart 55% since price data is available since 1916. The low number of trades is in both cases not statistically significant though.
All trading involves high risk; past performance is not necessarily indicative of future results. Hypothetical or simulated performance results have certain inherent limitations. Unlike an actual performance record, simulated results do not represent actual trading. Also, since the trades have not actually been executed, the results may have under- or over-compensated for the impact, if any, of certain market factors, such as lack of liquidity. Simulated trading programs in general are also subject to the fact that they are designed with the benefit of hindsight. No representation is being made that any account will or is likely to achieve profits or losses similar to those shown.
SPY Master v1.0This is a simple swing trading algorithm that uses a fast RSI-EMA to trigger buy/cover signals and a slow RSI-EMA to trigger sell/short signals for SPY, an xchange-traded fund for the S&P 500.
The idea behind this strategy follows the premise that most profitable momentum trades usually occur during periods when price is trending up or down. Periods of flat price actions are usually where most unprofitable trades occur. Because we cannot predict exactly when trending periods will occur, the algorithm basically bets money on all trade opportunities during all market conditions. Despite an accuracy rate of only 40%, the algorithm's asymmetric risk/reward profile allows the average winner to be 2x the average loser. The end result is a positive (profitable) net payout.
TRADING RULES:
Buy/Cover = EMA3(RSI2) cross> 50
Sell/Short = EMA5(RSI2) cross< 50
BACKTEST SETTINGS:
- Period = March 2011 - Present
- Initial capital = $10,000
- Dividends excluded
- Trading costs excluded
PERFORMANCE COMPARISON:
There are 657 trades, which means 1,314 orders. Assuming each order costs $2 (what I pay for at Interactive Brokers), total trading costs should be $2,628.
-SPY (buy & hold) = 132.73 ---> 193.22 = +45.57% (dividends excluded)
-SPY Master v1.0 = $12,649 - $2,628 = $10,021 = +100.21%
DISCLAIMER: None of my ideas and posts are investment advice. Past performance is not an indication of future results. This strategy was constructed with the benefit of hindsight and its future performance cannot be guaranteed.
ISM Indicator As a Strategy Here's a very easy code, plotting the ISM against the SPX. In this exercise, i wanted to see if one could use the ISM indicator only to generate buy/sell signal, and what would be the performance.
What is the ISM
The ISM Manufacturing Index monitors employment, production inventories, new orders and supplier deliveries.By monitoring the ISM Manufacturing Index, investors are able to better understand national economic conditions. When this index is increasing, investors can assume that the stock markets should increase because of higher corporate profits. The opposite can be thought of the bond markets, which may decrease as the ISM Manufacturing Index increases because of sensitivity to potential inflation.
Buy/Sell Signal
ISM above 50 usually good economic condition and vice versa when below 50 . For this code I used 48.50 as my buy/sell signal line.
Results
To test this on a longer time period, I use the SPX index instead of SPY. The results are surprisingly good. 76.92% profitability with 3.03 profit factor.
Conclusion
Investors could use the ISM with other indicators to determine better entry and exit point. I will see if combining the ISM with other custom indicators , could generate better result. Feel free to share your results here.
Cheers
Algo.
RSI-EMA IndicatorThis indicator calculates and plots 2 separate EMAs of the RSI. The default settings below work great on SPX/SPY daily chart. General rule is if an EMA is above 50, the stock's near term outlook is bullish. If an EMA is below 50, the near term outlook is bearish. Personally, I like to use a fast EMA as a buy signal and a slow EMA as a sell signal.
Default settings:
RSI = 50
EMA1 = 100
EMA2 = 200
AK_ TREND ID AS A STRATEGY : FOR EDUCATIONAL PURPOSES ONLYJust converted the AK_ TREND ID into a strategy , to show the efficiency of this simple indicator. I used SPX in this example, to display that the indicator has been accurate for a long time.
Confluence script This is modified version of Dale Legan's "Confluence" indicator written by Gary Fritz.
================================================================
Here is Gary`s commentary:
* I moved the core Confluence computations into a Confluence function.
Since the Confluence indicator returned several "states" (bull, bear, grey, and zero),
he modified the return value a bit:
-9 to -1 = Bearish
-0.9 to 0.9 = "grey" (and zero)
1 to 9 = Bullish
The "grey" range corresponds to the "grey" values plotted by Dale's indicator, but
they're divided by 10.
So -0.4 is equivalent to "grey -4" in Dale's indicator.
* I got rid of a bit of extra computation in the function. I didn't try to do a hard-core
Pierre-style optimization :-), but I noticed several significant chunks of calculation were
being done several times each bar, and I commented them out and replaced them with an intermediate
variable. It still calls sine/cosine a dozen times on each bar, which accounts for the bulk of the
processing time, but I think it's a bit easier to understand what the code is doing this way. (It also
seems to work better -- see below.) For the most part I didn't try to use mnemonic names for these
intermediate variables, because I don't understand exactly what the values represent!!
* I'm appending a simplified Confluence indicator using the function.
* I've also appended a simple Confluence system. This system sets an entry stop above/below the current
bar if Confluence goes into bull/bear mode, and similarly sets an exit stop below/above the bar where it
exits bull/bear mode. There's also an optional "aggressive" stop mode that tightens the stops if the market
moves in your direction; for example, if the high is 1000 and your "Trigger" offset is 2, the initial stop
is set at 1002. If the next bar has a high of 997, the stop is tightened to 997+2=999.
Interestingly, when I first wrote this system, I ran into a strange MaxBarsBack problem. The Confluence
indicator worked just fine with a MaxBarsBack setting of "Auto-Detect." But systems don't have a setting
like that -- you have to specify a fixed value. But NO fixed value (up to the maximum of 999) worked for
either the system OR the indicator! And I couldn't see anywhere that it was looking back that many bars.
Then, when I did the optimization on the Confluence code, the MaxBarsBack problem mysteriously disappeared.
Sometimes TradeStation is just spooky... Any ideas what happened?
I've appended a sample system report for the system on SPX, using the default parameters. The system actually
does pretty well. It probably won't make anyone rich, but I thought some folks might enjoy playing with it.
There are some other things you could do with it -- e.g. it might be interesting to change it to look for
long opportunities when Confluence hits -9, and short when it hits 9.