Multi-Layer Reversal Pro [The_lurker]🔮 MULTI-LAYER REVERSAL PRO
💡 CONCEPT
─────────────────────────────────────────────────────────────
An intelligent indicator that detects potential market reversal
points through multi-layer analysis combining momentum indicators,
Smart Money Concepts, and an advanced confirmation system.
HOW IT WORKS:
1. When prices reach exhaustion levels, market behavior is
analyzed through key Smart Money Concepts
2. When SMC concepts align with exhaustion, additional
advanced confirmations are activated
3. When all conditions are met, the appropriate signal appears
🥇 Gold 5M Tips
═════════════════════════════════════════════════════════════
📊 SIGNAL TYPES
═════════════════════════════════════════════════════════════
🟢 BUY SIGNALS
─────────────────────────────────────────────────────────────
BUY
Confirmed buy signal - all conditions met
Confidence: HIGH ●●●
E.BUY (Early Buy)
Early buy opportunity - strong exhaustion + high ADX
Confidence: MEDIUM ●●○
🔴 SELL SIGNALS
─────────────────────────────────────────────────────────────
SELL
Confirmed sell signal - all conditions met
Confidence: HIGH ●●●
E.SELL (Early Sell)
Early sell opportunity - strong exhaustion + high ADX
Confidence: MEDIUM ●●○
🟡 YELLOW WARNING
─────────────────────────────────────────────────────────────
Yellow candle = Warning of potential nearby reversal
→ Action: Monitor only, do not rush
⚠️ CLOSE TRADE
─────────────────────────────────────────────────────────────
"Close Trade ⚠️" appears when:
- A yellow warning candle appeared
- The next candle closed below the TP level
→ Meaning: Exit long position + automatic short entry
═════════════════════════════════════════════════════════════
🎯 QUICK ACTION GUIDE
═════════════════════════════════════════════════════════════
BUY / SELL
Confidence: HIGH
✅ Direct entry
E.BUY / E.SELL
Confidence: MEDIUM
⚡ Cautious entry / smaller size
Yellow Candle
Confidence: ALERT
👁️ Monitor only
Close Trade
Confidence: URGENT
🚪 Immediate exit
⚠️ DISCLAIMER
━━━━━━━━━━━━━━━━━━━━━━━━━━━━━━━━━━━━━━━━━━━
This indicator is for educational purposes only. Past performance does not
guarantee future results. Always use proper risk management and conduct your
own analysis before making trading decisions.
═════════════════════════════════════════════════════════════
مؤشر الانعكاس الذكي متعدد الطبقات
═════════════════════════════════════════════════════════════
💡 الفكرة
─────────────────────────────────────────────────────────────
مؤشر ذكي يكتشف نقاط الانعكاس المحتملة في السوق عبر تحليل
متعدد الطبقات يجمع بين مؤشرات الزخم ومفاهيم Smart Money
مع نظام تأكيدات متقدم.
آلية العمل:
1. عند وصول الأسعار إلى مراحل التشبع ، يتم تحليل سلوك السوق من عدة نقاط جوهرية تعتمد على مفاهيم Smart Money
2. عند تطابق مفاهيم SMC مع التشبع ، تُفعَّل تأكيدات متقدمة
3. عند تحقق جميع الشروط، تظهر الإشارة المناسبة
🥇 نصيحة للذهب 5 دقائق
═════════════════════════════════════════════════════════════
📊 أنواع الإشارات
═════════════════════════════════════════════════════════════
🟢 إشارات الشراء
─────────────────────────────────────────────────────────────
1- شراء BUY
إشارة شراء مؤكدة - استوفت جميع الشروط
الثقة: عالية ●●●
2- شراء مبكر E.BUY
فرصة شراء مبكرة - تشبع قوي + ADX عالي
الثقة: متوسطة ●●○
🔴 إشارات البيع
─────────────────────────────────────────────────────────────
1- بيع SELL
إشارة بيع مؤكدة - استوفت جميع الشروط
الثقة: عالية ●●●
2- بيع مبكر E.SELL
فرصة بيع مبكرة - تشبع قوي + ADX عالي
الثقة: متوسطة ●●○
🟡 التحذير الأصفر
─────────────────────────────────────────────────────────────
الشمعة الصفراء = تحذير من احتمال انعكاس قريب
← التصرف: راقب فقط ولا تتسرع
⚠️ إغلاق الصفقة
─────────────────────────────────────────────────────────────
تظهر علامة "إغلاق الصفقة ⚠️" عندما:
- ظهرت شمعة تحذير صفراء
- الشمعة التالية أغلقت تحت مستوى TP
← المعنى: إشارة خروج من الشراء + فتح صفقة بيع تلقائياً
═════════════════════════════════════════════════════════════
🎯 دليل التصرف السريع
═════════════════════════════════════════════════════════════
شراء/بيع BUY / SELL
الثقة: عالية
✅ دخول مباشر
شراء مبكر/ بيع مبكر E.BUY / E.SELL
الثقة: متوسطة
⚡ دخول بحذر أو حجم أقل
شمعة صفراء
الثقة: تنبيه
👁️ مراقبة فقط
إغلاق صفقة
الثقة: عاجل
🚪 خروج فوري
═════════════════════════════════════════════════════════════
⚠️ إخلاء المسؤولية
━━━━━━━━━━━━━━━━━━━━━━━━━━━━━━━━━━━━━━━━━━━
هذا المؤشر للأغراض التعليمية فقط. الأداء السابق لا يضمن النتائج المستقبلية.
استخدم دائماً إدارة مخاطر مناسبة وقم بتحليلك الخاص قبل اتخاذ قرارات التداول.
ค้นหาในสคริปต์สำหรับ "smart"

TRADE2GO CALCULATORMobile-Optimized Position Size Calculator with Intuitive Moveable Lines
Trading on mobile just got easier. Our TradingView calculator features drag-and-drop interactive lines designed specifically for touchscreen devices, eliminating the need for manual price input on small screens.
Key Features:
Easy Touch Controls - Simply drag the Entry, Stop Loss, and Take Profit lines directly on your chart. No more typing precise prices on tiny keyboards or struggling with number pads while analyzing the market.
Real-Time Calculations - As you move the lines, lot sizes and risk parameters update instantly. See your position size, potential profit, and risk amount change dynamically as you adjust your trade setup.
Perfect for Mobile Trading - Whether you're trading on-the-go or prefer mobile analysis, the moveable lines provide a seamless experience that works naturally with touch gestures. Pinch to zoom, drag to position, and your calculations follow your trade plan in real-time.
Visual Trade Planning - Place your lines where you see support/resistance levels, trend lines, key chart patterns, or using Pip Booster trading levels. Your position sizing adapts automatically to your technical analysis, keeping risk management front and center.
One-Glance Risk Assessment - All critical information displays clearly: lot size, risk and reward amounts in your account currency, and the calculated lot size to use—all updating as you refine your trade setup visually on the chart.
Trade smarter on mobile with a calculator that moves at the speed of your analysis.

On Balance Volume [BrightSideTrading]
# On Balance Volume - Complete User Guide
## Overview
This enhanced OBV indicator provides clean, actionable volume analysis with intelligent signal filtering. It combines On-Balance Volume (OBV) with a smoothed signal line to identify shifts in buying and selling pressure without chart clutter.
**Key Features:**
- Real-time OBV and signal line visualization
- Smart crossover detection with confirmation filtering
- Z-Score momentum analysis
- Customizable signal alerts with V-shaped markers
- Window-normalized option for detrended analysis
---
## What is On-Balance Volume (OBV)?
OBV is a volume-based momentum indicator that accumulates volume on up days and subtracts volume on down days. It answers a fundamental question: **Is volume flowing in (buying) or out (selling)?**
**Formula:**
- If Close > Previous Close: OBV = Previous OBV + Volume
- If Close < Previous Close: OBV = Previous OBV - Volume
- If Close = Previous Close: OBV = Previous OBV (unchanged)
**What it tells you:**
- **Rising OBV** = Accumulation (smart money buying)
- **Falling OBV** = Distribution (smart money selling)
- **OBV above zero line** = Net positive buying pressure
- **OBV below zero line** = Net negative selling pressure
---
## Interface & Settings
### **MAIN VISUALIZATION**
**OBV Line (Green/Red Ribbon)**
- Green when OBV is above the signal line (bullish trend)
- Red when OBV is below the signal line (bearish trend)
- Toggles between window-normalized (detrended) and raw values
**Signal Line (Orange)**
- Smoothed average of OBV
- Crossovers with OBV generate buy/sell signals
- Default: 21-period SMA
**V-Shaped Markers**
- Green upward V = Bullish crossover (buy signal)
- Red downward V = Bearish crossover (sell signal)
- Appears at the OBV value when signal is triggered
**Zero Line (Yellow)**
- Center equilibrium point for volume balance
- Acts as support/resistance for OBV
- Separates buying pressure (above) from selling pressure (below)
---
### **SOURCE GROUP**
**Source**
- **Default:** Close
- **Options:** Open, High, Low, or any custom value
- Controls which price value triggers OBV direction changes
- Most traders use Close for standard OBV calculation
---
### **SIGNAL SMOOTHING GROUP**
**Show Signal?**
- **Default:** ON
- Toggle visibility of the signal line
- Disable if you prefer to see raw OBV only
**Smoothing Type**
- **SMA (Simple Moving Average)** - Default, standard smoothing
- **EMA (Exponential Moving Average)** - Faster response, weights recent bars more heavily
- **Choose SMA** for consistent, traditional OBV signals
- **Choose EMA** for faster trend identification (more whipsaws possible)
**Smoothing Length**
- **Default:** 21 bars
- **Range:** 1-200 bars
- **Lower values** (5-14): Faster signals, more noise
- **Higher values** (30-50): Slower signals, fewer false alarms
- **Recommendation:** Use 21-25 for most timeframes
---
### **SIGNAL FILTERING GROUP**
This is your primary control for signal quality and frequency.
**Show Signal Markers?**
- **Default:** ON
- Toggle the V-shaped buy/sell markers on/off
- Disable if markers distract from your analysis
**Signal Filter Type**
- **None** - Shows every single crossover (noisy, best for skilled traders)
- **Confirmation Bars** - Waits N bars before confirming signal (recommended)
- **Strength-Based** - Only signals during strong momentum (filters weakest moves)
#### **CONFIRMATION BARS MODE** (Recommended)
Best for reducing false signals while staying responsive to real moves.
**Confirmation Bars**
- **Default:** 2 bars
- **Range:** 1-10 bars
- Waits for the signal to hold for N consecutive bars after crossover
- **Setting 1:** Every crossover (same as "None")
- **Setting 2:** Wait 1 bar confirmation (good balance)
- **Setting 3:** Wait 2 bars confirmation (filters 50% of noise)
- **Setting 4+:** Very selective, misses quick reversals
**How it works:**
1. OBV crosses signal line → Confirmation counter starts
2. If OBV stays on correct side for 2 bars → V-marker appears
3. If OBV crosses back → Counter resets, no signal
#### **STRENGTH-BASED MODE**
Only signals when momentum is statistically significant.
**Min Z-Score Strength**
- **Default:** 0.3
- **Range:** 0.0-3.0
- Requires OBV deviation from its mean to reach this threshold
- **Setting 0.1-0.3:** More signals, lower quality
- **Setting 0.5-0.8:** Moderate signals, good quality
- **Setting 1.0+:** Only the strongest momentum shifts
**How it works:**
- Calculates how far OBV is from its 50-bar average (Z-score)
- Only shows signals when this distance is meaningful
- Automatically avoids weak, choppy market conditions
---
### **VISUALS & COLORS GROUP**
**Highlight Crossovers?**
- **Default:** ON
- Master toggle for all signal markers
- Turn OFF to see only the OBV/signal lines
**Apply Ribbon Filling?**
- **Default:** ON
- Colors the space between OBV and signal line
- Green fill = OBV above signal (bullish)
- Red fill = OBV below signal (bearish)
- Provides clear visual trend confirmation
- Turn OFF for minimal chart clutter
---
### **STATS & ZONES GROUP**
**Use Window-Normalized OBV (visual only)?**
- **Default:** ON
- Removes long-term trend from OBV for clearer short-term signals
- Detrends the indicator to highlight recent momentum changes
- **ON:** Better for swing trading and identifying reversals
- **OFF:** Better for trend-following strategies
- Note: Z-Score always uses raw OBV for statistical accuracy
**OBV Normalize Window**
- **Default:** 200 bars
- Lookback period for detrending calculation
- Larger values = more aggressive detrending
- Adjust if you want OBV to oscillate more/less around zero
**Show Z-Score (OBV)?**
- **Default:** ON
- Displays statistical momentum indicator below main chart
- Ranges from -3 to +3 (most data within -2 to +2)
- High Z-Score = Strong buying momentum
- Low Z-Score = Strong selling momentum
**Z-Score Lookback**
- **Default:** 50 bars
- Period for calculating Z-Score mean and standard deviation
- Larger = smoother Z-Score, slower response
- Smaller = noisier Z-Score, faster response
**Show ROC (OBV Momentum)?**
- **Default:** OFF
- Rate of Change indicator for OBV velocity
- Useful for identifying momentum turning points
- Enable if you want to see speed of volume changes
**ROC Lookback**
- **Default:** 14 bars
- Period for ROC calculation
**Show Z-Score StdDev Zones?**
- **Default:** ON
- Shaded regions around zero line showing statistical boundaries
- Inner Zone (±1 Z) = Normal variation
- Outer Zone (±2 Z) = Extreme moves, potential reversals
- Helps identify overbought/oversold volume conditions
**Inner Zone (±Z)**
- **Default:** 1.0
- First boundary for standard deviation zones
- Most normal trading occurs within ±1
**Outer Zone (±Z)**
- **Default:** 2.0
- Second boundary for extreme conditions
- Crossing these zones indicates significant momentum shift
---
## Trading Strategy Examples
### **Strategy 1: Signal Line Crossovers (Beginner)**
**Setup:**
- Signal Filter Type: **Confirmation Bars**
- Confirmation Bars: **2-3**
- Show Signal Markers: **ON**
**Rules:**
1. **BUY signal** (green V): When OBV crosses above signal line and holds for 2-3 bars
- Confirms buying pressure is building
- Look for price to follow within 1-3 bars
2. **SELL signal** (red V): When OBV crosses below signal line and holds for 2-3 bars
- Confirms selling pressure is increasing
- Expect price decline
3. **Exit:** Take profits at next signal or use price support/resistance
**Best For:** Swing trading, intraday reversals, timeframes 5m-1h
---
### **Strategy 2: Zero Line Bounce (Intermediate)**
**Setup:**
- Signal Filter Type: **Strength-Based**
- Min Z-Score Strength: **0.5**
- Show Z-Score StdDev Zones: **ON**
**Rules:**
1. **Watch OBV approach zero line** during established trends
- OBV bouncing repeatedly off zero = trend is healthy
- OBV breaking through zero = trend reversal imminent
2. **Enter on bounce:** Buy when OBV bounces from zero line in uptrend
3. **Exit on break:** Close position when OBV breaks below zero line
4. **Confirm with Z-Score:** Only take trades when Z-Score shows momentum (|Z| > 0.5)
**Best For:** Trend traders, identifying trend strength, medium timeframes 15m-4h
---
### **Strategy 3: Momentum Extremes (Advanced)**
**Setup:**
- Signal Filter Type: **None**
- Show Z-Score StdDev Zones: **ON**
- Outer Zone: **2.0**
**Rules:**
1. **Identify extremes:** When Z-Score breaks outer zone (±2.0)
- Indicator is in extreme territory
- Likely overextended
2. **Fade extremes:** Take opposite position when Z-Score hits extreme
- High Z (>2.0) = OBV overbought, expect pullback
- Low Z (<-2.0) = OBV oversold, expect bounce
3. **Confirm:** Wait for crossover signal to enter
4. **Target:** Outer zone of opposite side or zero line
**Best For:** Range trading, mean reversion, experienced traders only
---
## Reading the Indicator in Different Markets
### **Strong Uptrend**
- OBV consistently above signal line (green)
- OBV well above zero line, rising higher lows
- Z-Score positive, trending upward
- **Action:** Buy dips to signal line, sell at resistance
### **Strong Downtrend**
- OBV consistently below signal line (red)
- OBV well below zero line, making lower highs
- Z-Score negative, trending downward
- **Action:** Sell rallies to signal line, cover at support
### **Consolidation/Choppy Market**
- OBV whipsaws around signal line frequently
- Crossovers occur every few bars
- Z-Score oscillating between -1 and +1
- **Action:** Increase confirmation bars to 3-4, or switch to strength-based filter
### **Accumulation (Bottom Formation)**
- OBV rising while price is flat or falling
- Volume flowing in despite downtrend (bullish divergence)
- Z-Score climbing while price lows hold
- **Action:** Expect breakout up; prepare buy near support
### **Distribution (Top Formation)**
- OBV falling while price is flat or rising
- Volume flowing out despite uptrend (bearish divergence)
- Z-Score falling while price continues higher
- **Action:** Expect breakdown down; prepare short near resistance
---
## Parameter Tuning Guide
### **Aggressive Settings (More Signals)**
- Smoothing Length: 14
- Signal Filter: None or Confirmation Bars: 1
- Min Z-Score: 0.1
- Best for: Day trading, high volatility stocks
- Risk: More false signals
### **Balanced Settings (Recommended)**
- Smoothing Length: 21
- Signal Filter: Confirmation Bars: 2
- Min Z-Score: 0.3
- Best for: Swing trading, most market conditions
- Risk/Reward: Moderate
### **Conservative Settings (Fewer Signals)**
- Smoothing Length: 30-40
- Signal Filter: Confirmation Bars: 3-4 or Strength-Based: 0.7+
- Min Z-Score: 0.8
- Best for: Position trading, high-conviction trades only
- Risk: May miss some moves
---
## Common Questions & Troubleshooting
**Q: Why are there more sell signals than buy signals?**
A: This reflects the actual market action. Markets often decline faster than they rise (fear > greed). Confirm signals with price action and support/resistance.
**Q: The indicator keeps whipsawing, should I hide it?**
A: Increase Confirmation Bars to 3-4 or switch to Strength-Based filter. Market conditions matter—choppy markets require stricter filters.
**Q: What's the difference between normalized and raw OBV?**
A: Normalized (detrended) shows shorter-term momentum by removing long-term trends. Raw OBV shows absolute accumulation/distribution over the full period. Use normalized for swing signals, raw for trend confirmation.
**Q: My signals come too late. How do I get faster entry?**
A: Reduce Smoothing Length (try 14 instead of 21), use EMA instead of SMA, or set Confirmation Bars to 1. Trade-off: More false signals.
**Q: Can I use this for day trading?**
A: Yes, on 1m-5m charts with aggressive settings. Use Confirmation Bars: 1 and focus on Z-Score > 0.5 entries only.
**Q: Should I trade every signal?**
A: No. Filter signals using: price near support/resistance, multiple indicators confirming, and Z-Score showing momentum. Best signals occur at key levels.
---
## Best Practices
1. **Always confirm with price action:** OBV signals work best when price is near support, resistance, or moving average. Don't trade signals in a vacuum.
2. **Use volume context:** Check if volume is increasing or decreasing on the signal. Strong signals have volume confirmation (increasing volume on OBV spikes).
3. **Adjust settings per timeframe:**
- 1m-5m: Smoothing 12, Confirmation 1, Z-Score 0.2
- 15m-1h: Smoothing 20, Confirmation 2, Z-Score 0.3
- 4h-1d: Smoothing 25, Confirmation 3, Z-Score 0.5
4. **Watch the zero line:** It's your friend. OBV behavior at the zero line reveals trend strength. Bounces = healthy trend. Breaks = reversal.
5. **Risk management:** No indicator is perfect. Use proper position sizing and stop losses. OBV should confirm your thesis, not be the only reason to trade.
6. **Combine with other indicators:**
- Price moving averages for trend confirmation
- RSI or Stochastic for overbought/oversold levels
- Support/resistance for entry/exit zones
- MACD for momentum divergences
---
## Disclaimer
This indicator is for educational and informational purposes only. It is not financial advice. Past performance does not guarantee future results. Always conduct your own research and consult with a financial advisor before making trading decisions. Trading carries risk, including potential loss of principal.
---
## Version History
**Version 1.0** - Initial release with enhanced signal filtering, Z-Score analysis, and customizable parameters.

Gyspy Bot Trade Engine - V1.2B - Alerts - 12-7-25 - SignalLynxGypsy Bot Trade Engine (MK6 V1.2B) - Alerts & Visualization
Brought to you by Signal Lynx | Automation for the Night-Shift Nation 🌙
1. Executive Summary & Architecture
Gypsy Bot (MK6 V1.2B) is not merely a strategy; it is a massive, modular Trade Engine built specifically for the TradingView Pine Script V6 environment. While most tools rely on a single dominant indicator to generate signals, Gypsy Bot functions as a sophisticated Consensus Algorithm.
Note: This is the Indicator / Alerts version of the engine. It is designed for visual analysis and generating live alert signals for automation. If you wish to see Backtest data (Equity Curves, Drawdown, Profit Factors), please use the Strategy version of this script.
The engine calculates data from up to 12 distinct Technical Analysis Modules simultaneously on every bar closing. It aggregates these signals into a "Vote Count" and only fires a signal plot when a user-defined threshold of concurring signals is met. This "Voting System" acts as a noise filter, requiring multiple independent mathematical models—ranging from volume flow and momentum to cyclical harmonics and trend strength—to agree on market direction.
Beyond entries, Gypsy Bot features a proprietary Risk Management suite called the Dump Protection Team (DPT). This logic layer operates independently of the entry modules, specifically scanning for "Moon" (Parabolic) or "Nuke" (Crash) volatility events to signal forced exits, preserving capital during Black Swan events.
2. ⚠️ The Philosophy of "Curve Fitting" (Must Read)
One must be careful when applying Gypsy Bot to new pairs or charts.
To be fully transparent: Gypsy Bot is, by definition, a very advanced curve-fitting engine. Because it grants the user granular control over 12 modules, dozens of thresholds, and specific voting requirements, it is extremely easy to "over-fit" the data. You can easily toggle switches until the charts look perfect in hindsight, only to have the signals fail in live markets because they were tuned to historical noise rather than market structure.
To use this engine successfully:
Visual Verification: Do not just look for "green arrows." Look for signals that occur at logical market structure points.
Stability: Ensure signals are not flickering. This script uses closed-candle logic for key decisions to ensure that once a signal plots, it remains painted.
Regular Maintenance is Mandatory: Markets shift regimes (e.g., from Bull Trend to Crab Range). Gypsy Bot settings should be reviewed and adjusted at regular intervals to ensure the voting logic remains aligned with current market volatility.
Timeframe Recommendations:
Gypsy Bot is optimized for High Time Frame (HTF) trend following. It generally produces the most reliable results on charts ranging from 1-Hour to 12-Hours, with the 4-Hour timeframe historically serving as the "sweet spot" for most major cryptocurrency assets.
3. The Voting Mechanism: How Entries Are Generated
The heart of the Gypsy Bot engine is the ActivateOrders input (found in the "Order Signal Modifier" settings).
The engine constantly monitors the output of all enabled Modules.
Long Votes: GoLongCount
Short Votes: GoShortCount
If you have 10 Modules enabled, and you set ActivateOrders to 7:
The engine will ONLY plot a Buy Signal if 7 or more modules return a valid "Buy" signal on the same closed candle.
If only 6 modules agree, the signal is rejected.
4. Technical Deep Dive: The 12 Modules
Gypsy Bot allows you to toggle the following modules On/Off individually to suit the asset you are trading.
Module 1: Modified Slope Angle (MSA)
Logic: Calculates the geometric angle of a moving average relative to the timeline.
Function: Filters out "lazy" trends. A trend is only considered valid if the slope exceeds a specific steepness threshold.
Module 2: Correlation Trend Indicator (CTI)
Logic: Measures how closely the current price action correlates to a straight line (a perfect trend).
Function: Ensures that we are moving up with high statistical correlation, reducing fake-outs.
Module 3: Ehlers Roofing Filter
Logic: A spectral filter combining High-Pass (trend removal) and Super Smoother (noise removal).
Function: Isolates the "Roof" of price action to catch cyclical turning points before standard moving averages.
Module 4: Forecast Oscillator
Logic: Uses Linear Regression forecasting to predict where price "should" be relative to where it is.
Function: Signals when the regression trend flips. Offers "Aggressive" and "Conservative" calculation modes.
Module 5: Chandelier ATR Stop
Logic: A volatility-based trend follower that hangs a "leash" (ATR multiple) from extremes.
Function: Used as an entry filter. If price is above the Chandelier line, the trend is Bullish.
Module 6: Crypto Market Breadth (CMB)
Logic: Pulls data from multiple major tickers (BTC, ETH, and Perpetual Contracts).
Function: Calculates "Market Health." If Bitcoin is rising but the rest of the market is dumping, this module can veto a trade.
Module 7: Directional Index Convergence (DIC)
Logic: Analyzes the convergence/divergence between Fast and Slow Directional Movement indices.
Function: Identifies when trend strength is expanding.
Module 8: Market Thrust Indicator (MTI)
Logic: A volume-weighted breadth indicator using Advance/Decline and Volume data.
Function: One of the most powerful modules. Confirms that price movement is supported by actual volume flow. Recommended setting: "SSMA" (Super Smoother).
Module 9: Simple Ichimoku Cloud
Logic: Traditional Japanese trend analysis.
Function: Checks for a "Kumo Breakout." Price must be fully above/below the Cloud to confirm entry.
Module 10: Simple Harmonic Oscillator
Logic: Analyzes harmonic wave properties to detect cyclical tops and bottoms.
Function: Serves as a counter-trend or early-reversal detector.
Module 11: HSRS Compression / Super AO
Logic: Detects volatility compression (HSRS) or Momentum/Trend confluence (Super AO).
Function: Great for catching explosive moves resulting from consolidation.
Module 12: Fisher Transform (MTF)
Logic: Converts price data into a Gaussian normal distribution.
Function: Identifies extreme price deviations. Uses Multi-Timeframe (MTF) logic to ensure you aren't trading against the major trend.
5. Global Inhibitors (The Veto Power)
Even if 12 out of 12 modules vote "Buy," Gypsy Bot performs a final safety check using Global Inhibitors.
Bitcoin Halving Logic: Prevents trading during chaotic weeks surrounding Halving events (dates projected through 2040).
Miner Capitulation: Uses Hash Rate Ribbons to identify bearish regimes when miners are shutting down.
ADX Filter: Prevents trading in "Flat/Choppy" markets (Low ADX).
CryptoCap Trend: Checks the total Crypto Market Cap chart for broad market alignment.
6. Risk Management & The Dump Protection Team (DPT)
Even in this Indicator version, the RM logic runs to generate Exit Signals.
Dump Protection Team (DPT): Detects "Nuke" (Crash) or "Moon" (Pump) volatility signatures. If triggered, it plots an immediate Exit Signal (Yellow Plot).
Advanced Adaptive Trailing Stop (AATS): Dynamically tightens stops in low volatility ("Dungeon") and loosens them in high volatility ("Penthouse").
Staged Take Profits: Plots TP1, TP2, and TP3 events on the chart for visual confirmation or partial exit alerts.
7. Recommended Setup Guide
When applying Gypsy Bot to a new chart, follow this sequence:
Set Timeframe: 4 Hours (4H).
Tune DPT: Adjust "Dump/Moon Protection" inputs first. These filter out bad signals during high volatility.
Tune Module 8 (MTI): Experiment with the MA Type (SSMA is recommended).
Select Modules: Enable/Disable modules based on the asset's personality (Trending vs. Ranging).
Voting Threshold: Adjust ActivateOrders to filter out noise.
Alert Setup: Once visually satisfied, use the "Any Alert Function Call" option when creating an alert in TradingView to capture all Buy/Sell/Close events generated by the engine.
8. Technical Specs
Engine Version: Pine Script V6
Repainting: This indicator uses Closed Candle data for all Risk Management and Entry decisions. This ensures that signals do not vanish after the candle closes.
Visuals:
Blue Plot: Buy/Sell Signal.
Yellow Plot: Risk Management (RM) / DPT Close Signal.
Green/Lime/Olive Plots: Take Profit hits.
Disclaimer:
This script is a complex algorithmic tool for market analysis. Past performance is not indicative of future results. Cryptocurrency trading involves substantial risk of loss. Use this tool to assist your own decision-making, not to replace it.
9. About Signal Lynx
Automation for the Night-Shift Nation 🌙
Signal Lynx focuses on helping traders and developers bridge the gap between indicator logic and real-world automation. The same RM engine you see here powers multiple internal systems and templates, including other public scripts like the Super-AO Strategy with Advanced Risk Management.
We provide this code open source under the Mozilla Public License 2.0 (MPL-2.0) to:
Demonstrate how Adaptive Logic and structured Risk Management can outperform static, one-layer indicators
Give Pine Script users a battle-tested RM backbone they can reuse, remix, and extend
If you are looking to automate your TradingView strategies, route signals to exchanges, or simply want safer, smarter strategy structures, please keep Signal Lynx in your search.
License: Mozilla Public License 2.0 (Open Source).
If you make beneficial modifications, please consider releasing them back to the community so everyone can benefit.

Bitcoin Multibook v1.0 [Apollo Algo]Bitcoin Multibook v1.0 by Apollo Algo is an advanced market depth and order flow visualization tool that brings professional-grade multi-exchange order book analysis to TradingView. Inspired by Bookmap's multibook functionality and built upon LucF's original single "Tape" indicator concept, this tool aggregates real-time trading data from multiple Bitcoin exchanges into a unified tape display.
Credits & Attribution
This indicator is an evolution of the original "Tape" indicator created by LucF (TradingView: @LucF). The multibook enhancement and Bitcoin-specific optimizations were developed by Apollo Algo to provide traders with institutional-grade market microstructure visibility across major Bitcoin trading venues.
Purpose & Philosophy
Bitcoin leads the entire cryptocurrency market. By monitoring order flow across the primary Bitcoin exchanges simultaneously, traders gain crucial insights into:
Cross-exchange arbitrage opportunities
Institutional order flow patterns
Market maker positioning
True market sentiment beyond single-exchange data
Key Features
📊 Multi-Exchange Data Aggregation
Real-time tape from 3 major exchanges:
Binance (BTCUSDT)
Coinbase (BTCUSD)
Kraken (BTCUSD)
Customizable source inputs for any trading pair
Synchronized price and volume tracking
Exchange name identification in tape display
📈 Advanced Tape Display
Dynamic tape visualization with configurable line quantity (0-50 lines)
Directional flow indicators (+/- symbols for price changes)
Exchange identification for each trade
Volume precision control (0-16 decimal places)
Flexible positioning (9 screen positions available)
Real-time only operation for accurate order flow
🎯 Volume Delta Analysis
Real-time cumulative volume delta calculation
Divergence detection (price vs. volume direction)
Colored visual feedback for market sentiment
Total session delta displayed in footer
Cross-exchange delta aggregation
🚨 Smart Alert System
Marker 1: Volume Delta Bumps (⬆⬇)
Triggers on consecutive volume delta increases
Identifies momentum acceleration points
Filters out divergent movements
Marker 2: Volume Delta Thresholds (⇑⇓)
Fires when delta exceeds user-defined thresholds
Catches significant order imbalances
Excludes divergence conditions
Marker 3: Large Volume Detection (⤊⤋)
Highlights unusually large individual trades
Spots potential institutional activity
Direction-specific triggers
Configure Data Sources
Adjust exchange pairs if needed (e.g., for altcoin analysis)
Leave blank to disable specific exchanges
Use format: EXCHANGE:SYMBOL
Customize Display
Set tape line quantity based on screen size
Position the table for optimal visibility
Choose color scheme (text or background)
Adjust text size for readability
Configure Alerts
Enable desired markers (1, 2, or 3)
Set volume thresholds appropriate for your timeframe
Choose direction (Longs, Shorts, or Both)
Create TradingView alerts on marker signals
Trading Applications
Scalping (1-5 min)
Monitor tape speed for momentum shifts
Watch for cross-exchange divergences
Track large volume clusters
Use Marker 1 for quick momentum trades
Day Trading (5-60 min)
Identify accumulation/distribution phases
Spot institutional positioning
Confirm breakout validity with volume delta
Use Marker 2 for significant imbalances
Swing Trading (1H+)
Analyze volume delta trends
Detect smart money rotation
Time entries with order flow confirmation
Use Marker 3 for institutional footprints
Advanced Techniques
Cross-Exchange Arbitrage Detection
When price disparities appear between exchanges:
Immediate Opportunity: Price differences > 0.1%
Bot Activity: Rapid convergence patterns
Liquidity Vacuum: One exchange leading others
Divergence Trading Strategies
Volume delta diverging from price direction:
Absorption: Strong hands entering (price down, delta up)
Distribution: Smart money exiting (price up, delta down)
Reversal Setup: Sustained divergence over multiple bars
Institutional Footprint Recognition
Large volume characteristics:
Simultaneous Spikes: Same timestamp across exchanges
TWAP Patterns: Consistent volume over time
Iceberg Orders: Repeated same-size trades
Pine Script v6 Enhancements
Type Safety Improvements
Strict boolean type handling
Explicit type declarations
Enhanced error checking
Performance Optimizations
Improved request.security() function
Better memory management with arrays
Optimized table rendering
Modern Syntax Updates
indicator() instead of study()
Namespaced math functions (math.round())
Typed input functions (input.int(), input.float())
Performance Considerations
System Requirements
Real-time Data: Essential for tape operation
Multiple Security Calls: May impact performance
Array Operations: Memory intensive with high line counts
Table Rendering: CPU usage increases with tape size
Optimization Tips
Reduce tape lines for better performance
Increase volume filter to reduce noise
Disable unused markers
Use text-only coloring for faster rendering

OXE MTF Support/Resistance+Demand/Supply Zone ArsenalOXE MTF Support/Resistance + Demand/Supply Zones Indicator
Your Complete Multi-Timeframe Zone Arsenal
This professional-grade indicator transforms your chart into a zone confluence powerhouse, simultaneously tracking high-probability price reaction areas across 5 timeframes (Daily, H4, H1, M15, M5) – giving you the institutional edge you need to dominate the markets.
🎯 What It Is
A sophisticated dual-system zone detector that identifies both:
Classic Support/Resistance levels using pivot point detection
Smart Money Demand/Supply zones triggered by Break-of-Structure (BOS) confirmations
Unlike basic S/R indicators, this tool employs institutional methodology – capturing order blocks and imbalance zones where smart money is positioned, not just where price bounced.
⚡ Core Capabilities
Multi-Timeframe Mastery
Track up to 5 timeframes simultaneously without switching charts
Identify confluence zones where multiple timeframe levels align
Customize which timeframes to display for clean, focused analysis
Intelligent Zone Management
Automatic zone validation – tracks when zones flip from resistance→support or supply→demand
Invalid zone filtering – hide broken/invalidated zones to focus only on active opportunities
Configurable zone limits – control the number of zones per timeframe (up to 8 each)
Smart Money Detection
BOS-confirmed zones – only marks demand/supply after break-of-structure confirmation
Precise zone timing – captures the exact candle that created the imbalance
Visual differentiation – dashed borders distinguish demand/supply from traditional S/R
Professional Dashboard
Real-time zone counter – shows active zones per timeframe at a glance
Filter status indicators – tracks which validation filters are enabled
Color-coded timeframe labels – instant visual organization
💰 How This Transforms Your Trading
1. Find High-Probability Entries
Enter trades at zones where multiple timeframes converge – when H4 demand aligns with Daily support, you've found institutional backing.
2. Stay on the Right Side of the Market
The zone flipping system shows you when market structure changes – a supply zone that flips to demand tells you the narrative has shifted bullish.
3. Eliminate Guesswork
No more wondering "is this level still valid?" The automatic invalidation tracking removes subjectivity – zones are either active (tradeable) or broken (ignored).
4. Scale Your Timeframe Analysis
Whether you're scalping M5 or swing trading Daily, access all relevant zones without the mental overhead of switching between charts and manually tracking levels.
5. Trade Like Institutions
By combining pivot-based S/R with BOS-confirmed order blocks, you're seeing where retail AND institutional money is positioned – giving you the complete picture.
🔥 Perfect For
Day traders seeking M15/H1 confluence for precise entries
Scalpers needing M5 zones with higher-timeframe confirmation
Swing traders looking for Daily/H4 zone alignment for position trades
ICT/SMC practitioners combining order blocks with traditional analysis
Any trader who values clean, validated, multi-timeframe zones over cluttered charts

T-DOW-FLOW: Final Edition
T-DOW-FLOW: Market Structure & Smart Pivot Zones
This indicator is a comprehensive technical analysis tool designed to visualize "Market Structure" based on Dow Theory and precise Supply/Demand Zones. It helps traders identify the true market trend and high-probability reaction levels by analyzing raw price action (ZigZag Pivots) rather than lagging indicators.
The script integrates three core systems:
ZigZag Trend Cloud: Visualizes the market bias (Uptrend/Downtrend).
Smart Pivot Zones (Type 1): Highlights the specific "Wick-to-Body" area of recent pivots.
Auto Density Channels (Type 2): Detects historical support/resistance clusters.
1. ZigZag Trend Identification
Logic: The script utilizes ta.highestbars and ta.lowestbars to detect Swing Highs and Swing Lows.
Trend Cloud:
If the structure creates a Higher High, the background cloud turns Green (Uptrend).
If the structure creates a Lower Low, the background cloud turns Red (Downtrend).
This provides an instant visual filter for "Trend Flow," encouraging traders to trade only in the direction of the dominant market structure.
2. SR Type 1: Smart Pivot Zones (Wick-to-Body)
Unlike standard indicators that draw thin lines at the absolute High/Low, this script focuses on the "Imbalance Zone".
It calculates the price range between the Pivot's Wick and the Pivot's Body (Open/Close) and fills this area with a colored zone.
Why? The area between the wick and body often represents the precise zone where institutional orders were filled, acting as a more reliable support/resistance level than a single price point.
3. SR Type 2: Auto Density Channels
This module scans a significant amount of historical data (default: 300 bars) to find clusters of pivot points.
Areas where multiple pivots align within a specific width are drawn as Channels. These represent strong, long-term psychological levels.
Trend Filter: Check the Trend Cloud color.
Green: Look for Long opportunities.
Red: Look for Short opportunities.
Entry Trigger: Wait for the price to retrace into a Smart Pivot Zone (Type 1) or an Auto Channel (Type 2).
Look for price rejection (wicks) at these zones in the direction of the Trend Cloud.
Structure Confirmation: Use the ZigZag lines and labels (HH, HL, etc.) to confirm that the market structure is still intact before entering.
ZigZag Settings: Adjust the sensitivity of the trend detection.
SR Type 1: Toggle the "Wick-to-Body" fill and choose between Wicks or Bodies as the primary source.
SR Type 2: Adjust the historical loopback period and channel width sensitivity.
This script is for educational and technical analysis purposes only. Past performance does not guarantee future results.
(以下、日本語説明 / Japanese Description)
このインジケーターは、「ダウ理論」に基づくトレンド判定と、精密な「需給ゾーン(Supply/Demand)」を可視化するための市場構造分析ツールです。 遅行指標を使わず、純粋なプライスアクション(ZigZagピボット)に基づいて、機関投資家の意識する価格帯を特定します。
1. ZigZagトレンドクラウド
ロジック: 一定期間の高値・安値を検出し、ダウ理論に基づいてトレンドを判定します。
視覚化: 高値切り上げ(上昇トレンド)なら「緑」、安値切り下げ(下落トレンド)なら「赤」の背景色を表示します。これにより、トレードすべき方向(順張り)を一目で判断できます。
2. SR Type 1: スマートピボットゾーン (Wick-to-Body)
単なる水平線ではなく、ローソク足の**「ヒゲ先」から「実体」までの価格差**をゾーンとして塗りつぶして表示します。
理由: ヒゲと実体の間の領域は、大口の注文が執行された(需給の不均衡が発生した)重要なエリアであることが多く、ピンポイントのラインよりも信頼性の高い反発ゾーンとして機能します。
3. SR Type 2: オート・デンシティ・チャネル
過去の長期間(デフォルト300本)のデータをスキャンし、ピボットが密集している価格帯を自動で「チャネル」として描画します。長期的に意識される強力なレジサポ帯です。
環境認識: 背景のトレンドクラウドの色に従い、目線を固定します。
エントリー: 価格がSRゾーン(Type 1)やチャネル(Type 2)に引きつけて、反発する動きを確認してエントリーします。
構造確認: ZigZagラインとラベル(HH/HLなど)を見て、トレンドが崩れていないことを確認します。

SM Screener — Alert Engine (Tiered)🔥 Momentum Radar — Powered by My Premium All-In-One Signal Engine
This isn’t just another screener.
This is the official early-warning radar that plugs directly into my Premium All-In-One Buy/Sell Signal Tool.
The Premium version is where the real executions happen — the legitimate Buy and Sell signals, trend flips, squeeze confirmations, BOS/CHOCH tracking, and high-accuracy momentum logic.
But this?
This is the scanner that tells you where to look BEFORE the big move happens.
If the Premium tool is the weapon…
this screener is the radar locking onto targets.
🚀 What It Actually Does
It monitors every ticker on your chart and fires alerts the moment a symbol starts showing:
✔ Early momentum ignition
✔ Rising relative volume
✔ Trend pressure shifting
✔ Volatility expansion
✔ Early squeeze build-up
✔ Clustered signal behavior
✔ High-tier conviction score
These alerts tell you exactly which tickers to pull up in your Premium tool so you can inspect the chart deeper with full confirmation.
If you're serious about catching explosive moves, this combo is unreal.
💥 Designed for Traders Who Want the Monster Moves
This system is built for the same plays that create legends — the massive momentum runners and wild squeezes like the $4 → $400+ SMX eruption.
The goal is simple:
**Find the move early.
Confirm it with the Premium tool.
Then ride it with confidence.**
⚡ Alert Engine That Feels Like Insider Info
Every alert is laser-targeted:
🔥 Early Interest — tells you something is heating up
🔥 Entry Signal — means the ticker is firing on all cylinders
🔥 Volume bursts
🔥 Momentum flips
🔥 High conviction score
🔥 Trend strength alignment
You get notified instantly so you never miss the tickers entering “potential explosion mode.”
Perfect for:
→ Custom automation
→ Watchlist building
📈 A Complete Momentum Ecosystem
This isn’t a standalone indicator — it’s part of a full ecosystem:
1️⃣ The Premium All-In-One Tool (master)
→ Generates true Buy/Sell signals
→ Full trend model
→ Squeeze engine
→ Premium/discount logic
→ Volume & volatility confirmation
→ BOS/CHOCH structure tracking
2️⃣ THIS Screener Engine (scanner)
→ Alerts you which tickers deserve attention
→ Filters out noise
→ Points you to the potential runners
→ Helps you never miss the early setups
Together, they’re unreal.
⭐ Follow for More
This is only one piece of a growing suite of professional-grade tools I’m publishing.
If you want:
🔥 More scanners
🔥 Predictive momentum engines
🔥 AI-grade alert logic
🔥 My official Premium trading toolkit
Hit Follow — new releases drop frequently.
Trade smart.
Trade fast.
And catch the ones everyone else regrets missing.

ICT Base Candle with Volume Filter📘 ICT BASE CANDLE WITH VOLUME FILTER
Institutional Base Candle Detection System
Smart Money Concepts (SMC/ICT)
🔍 What This Indicator Does
ICT Base Candle with Volume Filter automatically detects institutional Base Candles—also known as pause candles, decision candles, compression candles, or repricing pauses.
These candles often appear at key algorithmic points:
After a displacement
After a liquidity sweep
Before a fair value gap reaction
Inside an Order Block (OB)
At premium/discount zones
Before large expansions
This tool highlights these candles using:
✔ Body-percentage filtering
✔ Optional volume-based filtering
✔ Bullish/Bearish color coding
✔ Optional labels (+ / –)
✔ Accurate fixed historical plotting
✔ Customizable settings
This makes it extremely useful for SMC, ICT, and algorithmic orderflow traders.
🎯 Why Base Candles Matter (SMC/ICT Context)
The market moves in an algorithmic sequence:
Liquidity Sweep (grab stops above/below)
Displacement (strong impulse candle)
Base Candle (pause candle before continuation)
Expansion / Reversal
Base candles indicate:
Loss of momentum
Repricing
Order absorption (buy/sell programs)
Potential mitigation zones
Possible entry (continuation)
Possible reversal (if sweep + base + displacement)
They act as footprints of algorithmic activity, confirming where smart money is momentarily active.
🎨 Indicator Features
✔ Customizable Base Candle Colors
Choose unique colors for bullish and bearish base candles.
Option to use the same color for both.
✔ Volume Filter
Enable/disable volume filtering
Adjust lookback and threshold values.
✔ Label Toggles
Display “+” above bullish base candles
Display “–” below bearish base candles
✔ Fixed Historical Markers
All detected base candles remain consistent as bars update.
✔ Tooltip-Enhanced Inputs
Includes advanced trading notes inside input tooltips.
📈 How to Use (Practical Guide)
1️⃣ Identify the Impulse
Look for strong displacement or impulsive candles.
2️⃣ Locate the Base Candle
A small-body candle directly following a displacement.
3️⃣ Validate With Volume (Optional)
Low volume confirms a pause in the algorithm's movement.
4️⃣ Use It With SMC Tools
Base candles work best when aligned with:
FVGs
Order Blocks
BOS / CHoCH
Liquidity sweeps
Premium/discount equilibrium
5️⃣ Entry Model (Example)
Continuation Model:
Displacement
Base Candle forms (small body)
Enter on break of base candle
SL beyond candle wick
TP at liquidity / FVG end
📌 Example Explanation
A bullish impulse appears → price pauses → forms a bullish base candle → FVG below → price mitigates → resumes trend.
This indicator marks the base candle and helps you visualize where the algorithm slowed down before continuing the move.
🚫 Limitations & Notes
This is not a buy/sell signal indicator
It highlights context, not trades
Must be combined with structure & liquidity analysis
Volume filter is optional and should be tested per asset
🔒 Invite-Only Access (If Applicable)
If published as Invite-Only, include this:
Access is manually approved
Redistribution is not allowed
Do not share access publicly
Contact the author to request access
Unauthorized reselling is strictly prohibited
🏁 Final Notes
This indicator is designed for traders who understand:
Smart Money Concepts
Institutional orderflow
Liquidity models
Algorithmic ranges
Candle behavior within displacement
Use it as part of a full trading framework—not as a standalone signal.
📜 Credits
Created by: Manish Kumar Gupta / ask2maniish
Inspired by ICT / SMC price delivery concepts

VV Moving Average Convergence Divergence # VMACDv3 - Volume-Weighted MACD with A/D Divergence Detection
## Overview
**VMACDv3** (Volume-Weighted Moving Average Convergence Divergence Version 3) is a momentum indicator that applies volume-weighting to traditional MACD calculations on price, while using the Accumulation/Distribution (A/D) line for divergence detection. This hybrid approach combines volume-weighted price momentum with volume distribution analysis for comprehensive market insight.
## Key Features
- **Volume-Weighted Price MACD**: Traditional MACD calculation on price but weighted by volume for earlier signals
- **A/D Divergence Detection**: Identifies when A/D trend diverges from MACD momentum
- **Volume Strength Filtering**: Distinguishes high-volume confirmations from low-volume noise
- **Color-Coded Histogram**: 4-color system showing momentum direction and volume strength
- **Real-Time Alerts**: Background colors and alert conditions for bullish/bearish divergences
## Difference from ACCDv3
| Aspect | VMACDv3 | ACCDv3 |
|--------|---------|---------|
| **MACD Input** | **Price (Close)** | **A/D Line** |
| **Volume Weighting** | Applied to price | Applied to A/D line |
| **Primary Signal** | Volume-weighted price momentum | Volume distribution momentum |
| **Use Case** | Price momentum with volume confirmation | Volume flow and accumulation/distribution |
| **Sensitivity** | More responsive to price changes | More responsive to volume patterns |
| **Best For** | Trend following, breakouts | Volume analysis, smart money tracking |
**Key Insight**: VMACDv3 shows *where price is going* with volume weight, while ACCDv3 shows *where volume is accumulating/distributing*.
## Components
### 1. Volume-Weighted MACD on Price
Unlike standard MACD that uses simple price EMAs, VMACDv3 weights each price by its corresponding volume:
```
Fast Line = EMA(Price × Volume, 12) / EMA(Volume, 12)
Slow Line = EMA(Price × Volume, 26) / EMA(Volume, 26)
MACD = Fast Line - Slow Line
```
**Benefits of Volume Weighting**:
- High-volume price movements have greater impact
- Filters out low-volume noise and false moves
- Provides earlier trend change signals
- Better reflects institutional activity
### 2. Accumulation/Distribution (A/D) Line
Used for divergence detection, measuring buying/selling pressure:
```
A/D = Σ ((2 × Close - Low - High) / (High - Low)) × Volume
```
- **Rising A/D**: Accumulation (buying pressure)
- **Falling A/D**: Distribution (selling pressure)
- **Doji Handling**: When High = Low, contribution is zero
### 3. Signal Lines
- **MACD Line** (Blue, #2962FF): The fast-slow difference showing momentum
- **Signal Line** (Orange, #FF6D00): EMA or SMA smoothing of MACD
- **Zero Line**: Reference for bullish (above) vs bearish (below) bias
### 4. Histogram Color System
The histogram uses 4 distinct colors based on **direction** and **volume strength**:
| Condition | Color | Meaning |
|-----------|-------|---------|
| Rising + High Volume | **Dark Green** (#1B5E20) | Strong bullish momentum with volume confirmation |
| Rising + Low Volume | **Light Teal** (#26A69A) | Bullish momentum but weak volume (less reliable) |
| Falling + High Volume | **Dark Red** (#B71C1C) | Strong bearish momentum with volume confirmation |
| Falling + Low Volume | **Light Pink** (#FFCDD2) | Bearish momentum but weak volume (less reliable) |
Additional shading:
- **Light Cyan** (#B2DFDB): Positive but not rising (momentum stalling)
- **Bright Red** (#FF5252): Negative and accelerating down
### 5. Divergence Detection
VMACDv3 compares A/D trend against volume-weighted price MACD:
#### Bullish Divergence (Green Background)
- **Condition**: A/D is trending up BUT MACD is negative and trending down
- **Interpretation**: Volume is accumulating while price momentum appears weak
- **Signal**: Smart money accumulation, potential bullish reversal
- **Action**: Look for long entries, especially at support levels
#### Bearish Divergence (Red Background)
- **Condition**: A/D is trending down BUT MACD is positive and trending up
- **Interpretation**: Volume is distributing while price momentum appears strong
- **Signal**: Smart money distribution, potential bearish reversal
- **Action**: Consider exits, avoid new longs, watch for breakdown
## Parameters
| Parameter | Default | Range | Description |
|-----------|---------|-------|-------------|
| **Source** | Close | OHLC/HLC3/etc | Price source for MACD calculation |
| **Fast Length** | 12 | 1-50 | Period for fast EMA (shorter = more sensitive) |
| **Slow Length** | 26 | 1-100 | Period for slow EMA (longer = smoother) |
| **Signal Smoothing** | 9 | 1-50 | Period for signal line (MACD smoothing) |
| **Signal Line MA Type** | EMA | SMA/EMA | Moving average type for signal calculation |
| **Volume MA Length** | 20 | 5-100 | Period for volume average (strength filter) |
## Usage Guide
### Reading the Indicator
1. **MACD Lines (Blue & Orange)**
- **Blue Line (MACD)**: Volume-weighted price momentum
- **Orange Line (Signal)**: Smoothed trend of MACD
- **Crossovers**: Blue crosses above orange = bullish, below = bearish
- **Distance**: Wider gap = stronger momentum
- **Zero Line Position**: Above = bullish bias, below = bearish bias
2. **Histogram Colors**
- **Dark Green (#1B5E20)**: Strong bullish move with high volume - **most reliable buy signal**
- **Light Teal (#26A69A)**: Bullish but low volume - wait for confirmation
- **Dark Red (#B71C1C)**: Strong bearish move with high volume - **most reliable sell signal**
- **Light Pink (#FFCDD2)**: Bearish but low volume - may be temporary dip
3. **Background Divergence Alerts**
- **Green Background**: A/D accumulating while price weak - potential bottom
- **Red Background**: A/D distributing while price strong - potential top
- Most powerful at key support/resistance levels
### Trading Strategies
#### Strategy 1: Volume-Confirmed Trend Following
1. Wait for MACD to cross above zero line
2. Look for **dark green** histogram bars (high volume confirmation)
3. Enter long on second consecutive dark green bar
4. Hold while histogram remains green
5. Exit when histogram turns light green or red appears
6. Set stop below recent swing low
**Example**:
```
Price: 26,400 → 26,450 (rising)
MACD: -50 → +20 (crosses zero)
Histogram: Light teal → Dark green → Dark green
Volume: 50k → 75k → 90k (increasing)
```
#### Strategy 2: Divergence Reversal Trading
1. Identify divergence background (green = bullish, red = bearish)
2. Confirm with price structure (support/resistance, chart patterns)
3. Wait for MACD to cross signal line in divergence direction
4. Enter on first **dark colored** histogram bar after divergence
5. Set stop beyond divergence area
6. Target previous swing high/low
**Example - Bullish Divergence**:
```
Price: Making lower lows (26,350 → 26,300 → 26,250)
A/D: Rising (accumulation)
MACD: Below zero but starting to curve up
Background: Green shading appears
Entry: MACD crosses signal line + dark green bar
Stop: Below 26,230
Target: 26,450 (previous high)
```
#### Strategy 3: Momentum Scalping
1. Trade only in direction of MACD zero line (above = long, below = short)
2. Enter on dark colored bars only
3. Exit on first light colored bar or opposite color
4. Quick in and out (1-5 minute holds)
5. Tight stops (0.2-0.5% depending on instrument)
#### Strategy 4: Histogram Pattern Trading
**V-Bottom Reversal (Bullish)**:
- Red histogram bars start rising (becoming less negative)
- Forms "V" shape at the bottom
- Transitions to light red → light teal → **dark green**
- Entry: First dark green bar
- Signal: Momentum reversal with volume
**Λ-Top Reversal (Bearish)**:
- Green histogram bars start falling (becoming less positive)
- Forms inverted "V" at the top
- Transitions to light green → light pink → **dark red**
- Entry: First dark red bar
- Signal: Momentum exhaustion with volume
### Multi-Timeframe Analysis
**Recommended Approach**:
1. **Higher Timeframe (15m/1h)**: Identify overall trend direction
2. **Trading Timeframe (5m)**: Time entries using VMACDv3 signals
3. **Lower Timeframe (1m)**: Fine-tune entry prices
**Example Setup**:
```
15-minute: MACD above zero (bullish bias)
5-minute: Dark green histogram appears after pullback
1-minute: Enter on break of recent high with volume
```
### Volume Strength Interpretation
The volume filter compares current volume to 20-period average:
- **Volume > Average**: Dark colors (green/red) - high confidence signals
- **Volume < Average**: Light colors (teal/pink) - lower confidence signals
**Trading Rules**:
- ✓ **Aggressive**: Take all dark colored signals
- ✓ **Conservative**: Only take dark colors that follow 2+ light colors of same type
- ✗ **Avoid**: Trading light colored signals during high volatility
- ✗ **Avoid**: Ignoring volume context during news events
## Technical Details
### Volume-Weighted Calculation
```pine
// Volume-weighted fast EMA
fast_ma = ta.ema(src * volume, fast_length) / ta.ema(volume, fast_length)
// Volume-weighted slow EMA
slow_ma = ta.ema(src * volume, slow_length) / ta.ema(volume, slow_length)
// MACD is the difference
macd = fast_ma - slow_ma
// Signal line smoothing
signal = ta.ema(macd, signal_length) // or ta.sma() if SMA selected
// Histogram
hist = macd - signal
```
### Divergence Detection Logic
```pine
// A/D trending up if above its 5-period SMA
ad_trend = ad > ta.sma(ad, 5)
// MACD trending up if above zero
macd_trend = macd > 0
// Divergence when trends oppose each other
divergence = ad_trend != macd_trend
// Specific conditions for alerts
bullish_divergence = ad_trend and not macd_trend and macd < 0
bearish_divergence = not ad_trend and macd_trend and macd > 0
```
### Histogram Coloring Logic
```pine
hist_color = (hist >= 0
? (hist < hist
? (vol_strength ? #1B5E20 : #26A69A) // Rising: dark/light green
: #B2DFDB) // Positive but falling: cyan
: (hist < hist
? (vol_strength ? #B71C1C : #FFCDD2) // Rising (less negative): dark/light red
: #FF5252)) // Falling more: bright red
```
## Alerts
Built-in alert conditions for divergence detection:
### Bullish Divergence Alert
- **Trigger**: A/D trending up, MACD negative and trending down
- **Message**: "Bullish Divergence: A/D trending up but MACD trending down"
- **Use Case**: Potential reversal or continuation after pullback
- **Action**: Look for long entry setups
### Bearish Divergence Alert
- **Trigger**: A/D trending down, MACD positive and trending up
- **Message**: "Bearish Divergence: A/D trending down but MACD trending up"
- **Use Case**: Potential top or trend reversal
- **Action**: Consider exits or short entries
### Setting Up Alerts
1. Click "Create Alert" in TradingView
2. Condition: Select "VMACDv3"
3. Choose alert type: "Bullish Divergence" or "Bearish Divergence"
4. Configure: Email, SMS, webhook, or popup
5. Set frequency: "Once Per Bar Close" recommended
## Comparison Tables
### VMACDv3 vs Standard MACD
| Feature | Standard MACD | VMACDv3 |
|---------|---------------|---------|
| **Price Weighting** | Equal weight all bars | Volume-weighted |
| **Sensitivity** | Fixed | Adaptive to volume |
| **False Signals** | More during low volume | Fewer (volume filter) |
| **Divergence** | Price vs MACD | A/D vs MACD |
| **Volume Analysis** | None | Built-in |
| **Color System** | 2 colors | 4+ colors |
| **Best For** | Simple trend following | Volume-confirmed trading |
### VMACDv3 vs ACCDv3
| Aspect | VMACDv3 | ACCDv3 |
|--------|---------|--------|
| **Focus** | Price momentum | Volume distribution |
| **Reactivity** | Faster to price moves | Faster to volume shifts |
| **Best Markets** | Trending, breakouts | Accumulation/distribution phases |
| **Signal Type** | Where price + volume going | Where smart money positioning |
| **Divergence Meaning** | Volume vs price disagreement | A/D vs momentum disagreement |
| **Use Together?** | ✓ Yes, complementary | ✓ Yes, different perspectives |
## Example Trading Scenarios
### Scenario 1: Strong Bullish Breakout
```
Time: 9:30 AM (market open)
Price: Breaks above 26,400 resistance
MACD: Crosses above zero line
Histogram: Dark green bars (#1B5E20)
Volume: 2x average (150k vs 75k avg)
A/D: Rising (no divergence)
Action: Enter long at 26,405
Stop: 26,380 (below breakout)
Target 1: 26,450 (risk:reward 1:2)
Target 2: 26,500 (risk:reward 1:4)
Result: High probability setup with volume confirmation
```
### Scenario 2: False Breakout (Avoided)
```
Time: 2:30 PM (slow period)
Price: Breaks above 26,400 resistance
MACD: Slightly positive
Histogram: Light teal bars (#26A69A)
Volume: 0.5x average (40k vs 75k avg)
A/D: Flat/declining
Action: Avoid trade
Reason: Low volume, no conviction, potential false breakout
Outcome: Price reverses back below 26,400 within 10 minutes
Saved: Avoided losing trade due to volume filter
```
### Scenario 3: Bullish Divergence Bottom
```
Time: 11:00 AM
Price: Making lower lows (26,350 → 26,300 → 26,280)
MACD: Below zero but curving upward
Histogram: Red bars getting shorter (V-bottom forming)
Background: Green shading (divergence alert)
A/D: Rising despite price falling
Volume: Increasing on down bars
Setup:
1. Divergence appears at 26,280 (green background)
2. Wait for MACD to cross signal line
3. First dark green bar appears at 26,290
4. Enter long: 26,295 (next bar open)
5. Stop: 26,265 (below divergence low)
6. Target: 26,350 (previous swing high)
Result: +55 points (30 point risk, 1.8:1 reward)
Key: Divergence + volume confirmation = high probability reversal
```
### Scenario 4: Bearish Divergence Top
```
Time: 1:45 PM
Price: Making higher highs (26,500 → 26,520 → 26,540)
MACD: Positive but flattening
Histogram: Green bars getting shorter (Λ-top forming)
Background: Red shading (bearish divergence)
A/D: Declining despite rising price
Volume: Decreasing on up bars
Setup:
1. Bearish divergence at 26,540 (red background)
2. MACD crosses below signal line
3. First dark red bar appears at 26,535
4. Enter short: 26,530
5. Stop: 26,555 (above divergence high)
6. Target: 26,475 (support level)
Result: +55 points (25 point risk, 2.2:1 reward)
Key: Distribution while price rising = smart money exiting
```
### Scenario 5: V-Bottom Reversal
```
Downtrend in progress
MACD: Deep below zero (-150)
Histogram: Series of dark red bars
Pattern Development:
Bar 1: Dark red, hist = -80, falling
Bar 2: Dark red, hist = -95, falling
Bar 3: Dark red, hist = -100, falling (extreme)
Bar 4: Light pink, hist = -98, rising!
Bar 5: Light pink, hist = -90, rising
Bar 6: Light teal, hist = -75, rising (crosses to positive momentum)
Bar 7: Dark green, hist = -55, rising + volume
Action: Enter long on Bar 7
Reason: V-bottom confirmed with volume
Stop: Below Bar 3 low
Target: Zero line on histogram (mean reversion)
```
## Best Practices
### Entry Rules
✓ **Wait for dark colors**: High-volume confirmation is key
✓ **Confirm divergences**: Use with price support/resistance
✓ **Trade with zero line**: Long above, short below for best odds
✓ **Multiple timeframes**: Align 1m, 5m, 15m signals
✓ **Watch for patterns**: V-bottoms and Λ-tops are reliable
### Exit Rules
✓ **Partial profits**: Take 50% at first target
✓ **Trail stops**: Use histogram color changes
✓ **Respect signals**: Exit on opposite dark color
✓ **Time stops**: Close positions before major news
✓ **End of day**: Square up before close
### Avoid
✗ **Don't chase light colors**: Low volume = low confidence
✗ **Don't ignore divergence**: Early warning system
✗ **Don't overtrade**: Wait for clear setups
✗ **Don't fight the trend**: Zero line dictates bias
✗ **Don't skip stops**: Always use risk management
## Risk Management
### Position Sizing
- **Dark green/red signals**: 1-2% account risk
- **Light signals**: 0.5% account risk or skip
- **Divergence plays**: 1% account risk (higher uncertainty)
- **Multiple confirmations**: Up to 2% account risk
### Stop Loss Placement
- **Trend trades**: Below/above recent swing (20-30 points typical)
- **Breakout trades**: Below/above breakout level (15-25 points)
- **Divergence trades**: Beyond divergence extreme (25-40 points)
- **Scalp trades**: Tight stops at 10-15 points
### Profit Targets
- **Minimum**: 1.5:1 reward to risk ratio
- **Scalps**: 15-25 points (quick in/out)
- **Swing**: 50-100 points (hold through pullbacks)
- **Runners**: Trail with histogram color changes
## Timeframe Recommendations
| Timeframe | Trading Style | Typical Hold | Advantages | Challenges |
|-----------|---------------|--------------|------------|------------|
| **1-minute** | Scalping | 1-5 minutes | Fast profits, many setups | Noisy, high false signals |
| **5-minute** | Intraday | 15-60 minutes | Balance of speed/clarity | Still requires quick decisions |
| **15-minute** | Swing | 1-4 hours | Clearer trends, less noise | Fewer opportunities |
| **1-hour** | Position | 4-24 hours | Strong signals, less monitoring | Wider stops required |
**Recommendation**: Start with 5-minute for best balance of signal quality and opportunity frequency.
## Combining with Other Indicators
### VMACDv3 + ACCDv3
- **Use**: Confirm volume flow with price momentum
- **Signal**: Both showing dark green = highest conviction long
- **Divergence**: VMACDv3 bullish + ACCDv3 bearish = examine price action
### VMACDv3 + RSI
- **Use**: Overbought/oversold with momentum confirmation
- **Signal**: RSI < 30 + dark green VMACD = strong reversal
- **Caution**: RSI > 70 + light green VMACD = potential false breakout
### VMACDv3 + Elder Impulse
- **Use**: Bar coloring + histogram confirmation
- **Signal**: Green Elder bars + dark green VMACD = aligned momentum
- **Exit**: Blue Elder bars + light colors = momentum stalling
## Limitations
- **Requires volume data**: Will not work on instruments without volume feed
- **Lagging indicator**: MACD inherently follows price (2-3 bar delay)
- **Consolidation noise**: Generates false signals in tight ranges
- **Gap handling**: Large gaps can distort volume-weighted values
- **Not standalone**: Should combine with price action and support/resistance
## Troubleshooting
**Problem**: Too many light colored signals
**Solution**: Increase Volume MA Length to 30-40 for stricter filtering
**Problem**: Missing entries due to waiting for dark colors
**Solution**: Lower Volume MA Length to 10-15 for more signals (accept lower quality)
**Problem**: Divergences not appearing
**Solution**: Verify volume data available; check if A/D line is calculating
**Problem**: Histogram colors not changing
**Solution**: Ensure real-time data feed; refresh indicator
## Version History
- **v3**: Removed traditional MACD, using volume-weighted MACD on price with A/D divergence
- **v2**: Added A/D divergence detection, volume strength filtering, enhanced histogram colors
- **v1**: Basic volume-weighted MACD on price
## Related Indicators
**Companion Tools**:
- **ACCDv3**: Volume-weighted MACD on A/D line (distribution focus)
- **RSIv2**: RSI with A/D divergence detection
- **DMI**: Directional Movement Index with A/D divergence
- **Elder Impulse**: Bar coloring system using volume-weighted MACD
**Use Together**: VMACDv3 (momentum) + ACCDv3 (distribution) + Elder Impulse (bar colors) = complete volume-based trading system
---
*This indicator is for educational purposes. Past performance does not guarantee future results. Always practice proper risk management and never risk more than you can afford to lose.*

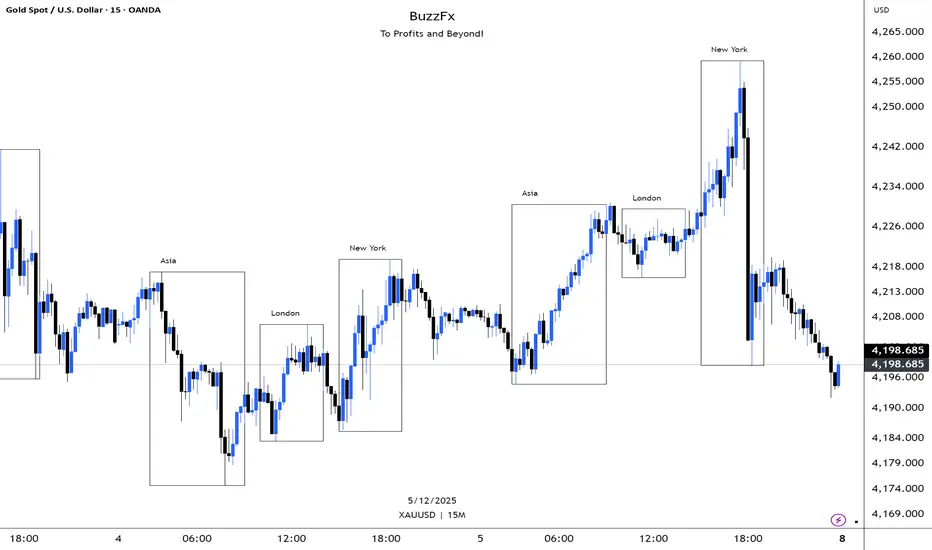
BuzzFx Market SessionsBuzzFx Market Sessions is a clean and powerful tool that highlights the most important trading sessions directly on your chart.
It automatically marks:
London Session
New York Session
Asian Session
Pre-New York
Session highs & lows (optional)
Session ranges & volatility zones
This indicator helps traders instantly understand:
When major liquidity enters the market
When volatility typically increases
How price reacts inside each session
Which session is driving the current trend
Designed for both beginners and advanced traders, BuzzFx Market Sessions gives you a clearer view of market structure and timing—so you can trade smarter, not harder.
Perfect for day traders, scalpers, and SMC traders who rely on timing, volatility, and session behavior.
OBV + A/D Accumulation Score# OBV + A/D Accumulation Score
This script fuses **On-Balance Volume (OBV)** and **Chaikin Accumulation/Distribution Line** into one perfectly normalized, weighted, smoothed score that reveals **exactly** what smart money is doing on a **daily basis** — even when you're watching lower timeframes.
It only moves when real institutional order flow is present. Zero-line crosses and extreme levels have an uncanny ability to call major turns before price even blinks.
Institutional accumulation/distribution, distilled into one clean line.
### Why This Indicator Is Special
- **Z-Score Normalization** → OBV and A/D are forced onto the exact same scale so neither dominates (most combined indicators fail here)
- **Weighted Composite** → Default 50/50, but you can slide it to favor OBV or A/D depending on the asset (huge edge on crypto vs stocks)
- **Daily Resolution Forced** → Shows true daily smart-money flow no matter what chart you're on (add to 1H/4H for god-tier context)
- **Extreme Thresholds** (±1.2 default) with lime/maroon coloring → When these hit, institutions are going nuclear
- **Optional Histogram Mode** + subtle pane background tint → Instant bias recognition
- **Full Alert Suite** → Zero-cross + Extreme breaches (with current score value in the message)
### How to Trade It (The Signals That Actually Print)
**Primary Signals**
- Green triangle + alert → Accumulation just turned ON (smart money buying pressure now dominant)
- Red triangle + alert → Distribution just turned ON (smart money exiting)
**Nuclear Signals**
- Lime color + "EXTREME ACCUMULATION" alert → Institutions aggressively piling in → one of the strongest buy signals on daily
- Maroon color + "EXTREME DISTRIBUTION" alert → Institutions dumping hard → one of the strongest sell/short signals
**Best Uses**
- Zero-cross up + price above daily EMA-9/21 → Swing long bias god mode
- Divergences on daily (price new high + score lower high = top incoming)
- Extreme accumulation while price is basing → Buy the breakout and thank me later
Works insanely well on BTC/ETH, SPX/QQQ, NVDA, TSLA — anything with real institutional volume.
### Settings Explained
- **Z-Score Lookback** (50): Longer = only major regime changes
- **Signal Smoothing** (10): Lower = more responsive, higher = smoother trend
- **OBV Weight** (0.5): Slide toward 1.0 for pure direction-based strength, toward 0.0 for close-location sensitivity
- **Extreme Threshold**: 1.2 is perfect balance — raise to 1.8+ for only the absolute strongest moves
- **Show as Histogram**: MACD-style bars (great for ranging markets)
- **Background tint**: Subtle green/red — you'll love it or disable it

DarkPool FlowDarkPool Flow is a professional-grade technical analysis tool designed to align retail traders with the dominant "smart money" flow. Unlike standard moving average crossovers that often generate false signals during consolidation, this script employs a multi-layered filtering engine to isolate high-probability trends.
The core philosophy of this indicator is that Trends are fractal. A sustainable move on a lower timeframe must be supported by momentum on a higher timeframe. By comparing a "Fast Signal Trend" against a "Slow Anchor Trend" (e.g., Daily vs. Weekly), the script identifies the market bias used by institutional algorithms.
This edition features a Smart Recovery Engine, ensuring that valid trends are not missed simply because momentum started slowly, and a Dynamic Cloud that visually represents the strength of the trend spread.
Key Features
1. Auto-Adaptive Timeframe Logic
The script eliminates the guesswork of Multi-Timeframe (MTF) selection. By enabling "Auto-Adapt," the indicator detects your current chart timeframe and automatically maps it to the mathematically correct institutional pairings:
Scalping (<15m): Uses 15-Minute Trend vs. 1-Hour Anchor.
Day Trading (15m - 1H): Uses 4-Hour Trend vs. Daily Anchor.
Swing Trading (4H - Daily): Uses Daily Trend vs. Weekly Anchor (The classic "Golden" setup).
Investing (Weekly): Uses 21-Week EMA vs. 50-Week SMA (Bull Market Support Band logic).
2. Smart Recovery Signal Engine
Standard crossover scripts often miss major moves if the specific breakout candle has low volume or weak ADX. This script utilizes a state-machine logic that "remembers" the trend direction. If a trend begins during low volatility (gray candles), the script waits. The moment volatility and momentum confirm the move, a Smart Recovery Signal is triggered, allowing you to enter an existing trend safely.
3. Chop Protection (Gray Candles)
Preservation of capital is the priority. The script analyzes the Average Directional Index (ADX) and Volatility (ATR).
Colored Candles (Green/Red): The market is trending with sufficient strength. Trading is permitted.
Gray Candles: The market is in a low-energy chop or consolidation (ADX < 20). Trading is discouraged.
4. Dynamic Trend Cloud
The space between the Fast and Slow trends is filled with a dynamic cloud.
Darker/Opaque Cloud: Indicates a widening spread, suggesting accelerating momentum.
Lighter/Transparent Cloud: Indicates a narrowing spread, suggesting the trend may be weakening or consolidating.
5. Pullback & Retest Signals (+)
While triangles mark the start of a trend, the Plus (+) signs mark low-risk opportunities to add to a position. These appear when price dips into the cloud, finds support at the "Fair Value" zone, and closes back in the direction of the trend with confirmed momentum.
User Guide & Strategy
Setup
Add the indicator to your chart.
For Beginners: Enable "Auto-Adaptive Timeframes" in the settings.
For Advanced Users: Disable Auto-Adapt and manually configure your Fast/Slow pairings (Default is Daily 50 EMA / Weekly 50 EMA).
Signal Mode: Choose "First Breakout Only" for a cleaner chart, or "All Signals" if you wish to see re-entry points during choppy starts.
Long Entry Criteria (Buy)
Trend: The Cloud must be Green (Fast Trend > Slow Trend).
Signal: A Green Triangle appears below the bar.
Confirmation: The signal candle must not be Gray.
Re-Entry: A small Green (+) sign appears, indicating a successful test of the cloud support.
Short Entry Criteria (Sell)
Trend: The Cloud must be Red (Fast Trend < Slow Trend).
Signal: A Red Triangle appears above the bar.
Confirmation: The signal candle must not be Gray.
Re-Entry: A small Red (+) sign appears, indicating a successful test of the cloud resistance.
Stop Loss & Risk Management
Stop Loss: A standard institutional stop loss is placed just beyond the Slow Trend Line (the outer edge of the cloud). If price closes beyond the Slow Trend, the macro thesis is invalid.
Take Profit: Target liquidity pools or use a trailing stop based on the Fast Trend line.
Settings Overview
Mode Selection: Toggle between Auto-Adaptive logic or Manual control.
Manual Configuration: Define the specific Timeframe, Length, and Type (EMA, SMA, WMA) for both Fast and Slow trends.
Signal Logic: Toggle "Show Pullback Signals" on/off. Switch between "First Breakout" or "All Signals."
Quality Filters: Toggle individual filters (ATR, RSI, ADX) to adjust sensitivity. Turning these off makes the script more responsive but increases false signals.
Visual Style: Customize colors for Bullish, Bearish, and Neutral (Gray) states. Adjust cloud transparency.
Disclaimer
Risk Warning: Trading financial markets involves a high degree of risk and is not suitable for all investors. You could lose some or all of your initial investment.
Educational Use Only: This script and the information provided herein are for educational and informational purposes only. They do not constitute financial advice, investment advice, trading advice, or any other recommendation.
No Guarantee: Past performance of any trading system or methodology is not necessarily indicative of future results. The "Institutional Trend" indicator is a tool to assist in technical analysis, not a crystal ball. The creators of this script assume no responsibility or liability for any trading losses or damages incurred as a result of using this tool. Always perform your own due diligence and consult with a qualified financial advisor before making investment decisions.

SMC Fib Range Signals [@gyanapravah]SMC Fib Range Signals
This indicator blends Smart Money Concepts (SMC) with a Range Filter Trend System and Fibonacci Retracement & Extensions to generate high-probability automated Buy/Sell signals.
Designed to avoid noise and focus on market structure + trend + price confluence, this tool is ideal for:
1. Intraday traders
2. Swing traders
3. Index & stock traders
4. Crypto & Forex traders
CORE FEATURES
Range Filter Trend Detection
Smooth adaptive filter identifies true trend direction
Visual confirmation:
🟢 Green filter = bullish pressure
🔴 Red filter = bearish pressure
🟡 Yellow filter = neutral
Upper & Lower Bands act as dynamic support/resistance zones
Smart Money Order Blocks (SMC)
Automatically detects important pivot highs & lows
Marks:
OB High → supply / resistance zone
OB Low → demand / support zone
Continuously tracks latest OB levels for live price interaction
Fibonacci Engine
Detects the current swing zone and plots:
Retracement levels
0.236 – 0.382 – 0.500 – 0.618 – 0.786 (editable)
Extension targets
1.272 – 1.618
All levels update dynamically on new market structure and pivots.
SIGNAL ENGINE
This indicator generates signals from three independent confirmation systems:
BUY SIGNALS trigger when:
1. Trend flips bullish (price crosses above the Filter)
2.Bullish trend + price reacts near:
Order Block support
Fibonacci 0.382 / 0.618 levels
Bounce from the Lower Band with trend support
All setups require volume confirmation to filter fake breakouts.
SELL SIGNALS trigger when:
1. Trend flips bearish (price crosses below the Filter)
2. Bearish trend + price reacts near:
Order Block resistance
Fibonacci 0.382 / 0.618 levels
Rejection from the Upper Band with trend support
ALERTS READY
Two built-in alerts:
BUY Alert — fires on bullish signal
SELL Alert — fires on bearish signal
INPUT SETTINGS
Trend Engine
1.Source
2.Sampling Period
3.Range Multiplier
Smart Money
Pivot detection sensitivity (Left / Right bars)
Fibonacci
1.Swing lookback length
2.Editable Fib retracement and extension values
3.Toggle show/hide Fib levels
BEST USE CASE
Works extremely well on:
⏱️ 3M – 15M Intraday scalping
⏱️ 30M – 1H positional entries
⏱️ 4H – D1 swing trading
Tested on:
NIFTY / BANKNIFTY / FINNIFTY
Stocks
Crypto
Forex
DISCLAIMER
This indicator is for educational purposes only.
It does NOT guarantee profits.
Always use:
Proper risk management
Stop-loss rules
Your own confirmation before entering trades.
AUTHOR
Built & shared by @gyanapravah (Odisha, India)
Open-source for learning and community improvement.

Price Action Strategy v2.0 [Ista]💎 Overview
Price Action Strategy v2.0 is a comprehensive, all-in-one institutional trading toolkit designed for visual traders who demand precision. Unlike standard indicators, this tool focuses on the narrative of price by combining advanced Market Structure, Institutional Order Flow, and Predictive Analytics into a single, non-cluttered interface.
The core philosophy of this script is "Clean Precision". It filters out noise and presents only the most critical decision-making data via smart chart overlays and a state-of-the-art Analytic Dashboard.
🚀 Key Features
1. 🏛️ Institutional Order Blocks (Origin Scan Engine)
This is not a standard pivot-based OB indicator. We utilize a proprietary "Origin Scan" algorithm that:
Detects the exact origin candle responsible for a structural break (BOS).
Filters out weak blocks, keeping only the most significant institutional footprints.
Smart Management: Limits active blocks to the 3 most recent per side (Support/Resistance) to keep charts clean.
Ghost Mode: When an Order Block is broken, it doesn't just disappear; it turns into a faint "Ghost" level, allowing you to see historical reactions without visual clutter.
2. 🔮 Echo Forecast (Predictive Path)
A powerful forecasting engine based on Pattern Similarity:
Scans historical price action (Evaluation Window) to find patterns mathematically similar to the current market state.
Projects the most likely future path (Forecast Window) directly onto the chart.
Uses a cumulative calculation method to smooth out noise and provide a realistic trajectory.
Visual Coding: The forecast line thickens and changes color based on the Confidence Score (Correlation %). High confidence patterns (>80%) are highlighted in deep green.
3. 📊 ISTA Command Center (Analytic Dashboard)
A professional, compact, and right-aligned dashboard that acts as your trading HUD. It monitors 8 vital market vitals in real-time:
Market Structure: Real-time Swing trend direction.
HTF Trend: Higher Timeframe bias (Price Action based).
Momentum: Current & HTF RSI status (Overbought/Oversold).
MACD: Signal crossover status.
Smart Money Flow (MFI): Detects institutional accumulation/distribution.
Volatility (ATR%): Current market volatility percentage.
Forecast Confidence: The statistical reliability of the current Echo Forecast.
4. 📉 Dynamic EMAs
Includes three key moving averages (20, 200, 1440) with dynamic transparency logic. They fade into the background when not interacting with price, ensuring they are there when you need them but invisible when you don't.
🛠️ How to Use
Identify Trend: Look at the Dashboard. If Structure and HTF Trend align (e.g., both Bullish), look for longs.
Wait for Pullback: Wait for price to return to a Bullish Order Block.
Confirm: Check the Forecast line. Does it suggest a bounce? Check MFI and RSI on the dashboard for oversold conditions.
Execute: Use the Order Block edges for precise entry and invalidation points.
⚙️ Settings
Swing Length: Adjust sensitivity of the structure (Default: 10).
Evaluation Window: How far back the Echo Forecast looks for patterns (Default: 300).
Dashboard: Fully customizable position and size.
Developed by Soheil_kheiri | Ista Web Analytics

ICT Complete SuiteICT Complete Suite - Advanced SMC & Liquidity Analysis
A comprehensive indicator combining ICT (Inner Circle Trader) methodology with Smart Money Concepts for professional trading analysis.
🔹 KEY FEATURES:
- Market Structure Detection (MSS, CISD, BOS, CHoCH)
- Smart Money Liquidity Analysis (BSL/SSL Sweeps)
- Premium Discount Arrays (Order Blocks, FVG, Breaker Blocks)
- OTE Zones (0.62-0.79 Fibonacci)
- Session & Killzone Tracking (Asian, London, NY)
- Silver Bullet Time Windows
- Real-time Info Dashboard
- Multi-timeframe Support
🔹 MODULES:
1. Market Structure & Trend Analysis
2. Liquidity Hunter (BSL/SSL Detection)
3. PD Arrays (OB, FVG, Breaker Blocks)
4. Sessions & Killzones
Perfect for traders who follow ICT concepts and Smart Money trading strategies.
⚠️ Best on M15-H1 timeframes
⚠️ Compatible with XAUUSD, EURUSD, GBPUSD, and major pairs
