Schwarzman Custom ORB with Box DisplayIndicator Overview
The Schwarzman Custom ORB (Opening Range Breakout) Indicator is a fully self-developed script designed for traders who utilize opening range breakout strategies. This indicator allows users to customize their ORB settings, apply them to historical price data, and visually connect multiple ORBs to analyze past performance. The goal is to provide traders with a tool to backtest and refine their breakout strategies based on historical ORB data.
How the Indicator Works
1️⃣ User-Defined ORB Settings
• The user selects a custom start time (hour and minute) for the ORB.
• The user defines a duration (e.g., 15 minutes, 30 minutes, etc.) for the ORB period.
• A timezone offset is included to adjust for different market sessions.
2️⃣ ORB High and Low Calculation
• The script records the highest and lowest prices within the selected ORB time window.
• The recorded values remain static after the ORB period ends, ensuring accurate range plotting.
3️⃣ Historical ORB Visualization
• Instead of only showing a single ORB for the current session, this indicator connects multiple ORBs across past data.
• This allows traders to visually analyze previous breakout performance.
• The plotted ORBs remain fixed and do not repaint, ensuring an accurate backtesting experience.
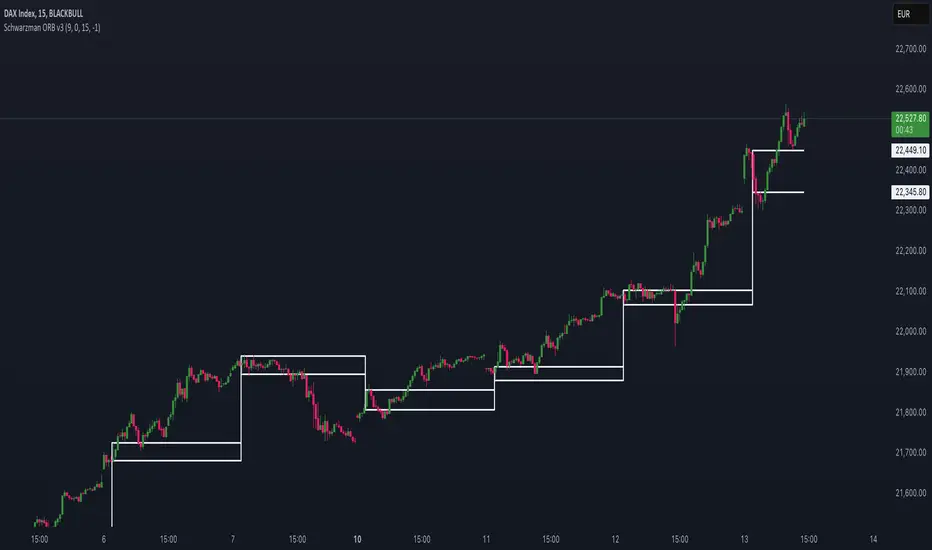
4️⃣ Stepline Visualization & Range Filling
• The high and low ORB levels are displayed using stepline plots to maintain clear horizontal levels.
• A shaded box is applied between the ORB high and low for better visualization.
Use Cases & Strategy Application
📌 Backtesting Historical ORBs – See how past ORBs performed under different market conditions.
📌 Custom ORB Settings – Adjust the start time and duration for different trading sessions.
📌 Multi-ORB Analysis – Connect ORBs over multiple trading days to study trends and breakouts.
📌 Breakout Strategy Optimization – Use the historical ORB connections to refine entry and exit points.
This indicator is particularly useful for day traders, scalpers, and breakout traders looking for a data-driven approach to trading.
Indicator Development & Transparency Statement
As a trader, I have tested various ORB (Opening Range Breakout) indicators available in the TradingView community. Through these experiences, I aimed to develop a version that best fits my own trading needs and strategy.
This script is a self-developed ORB tool, created from scratch while drawing inspiration from the concept of opening range breakouts, which is widely used in trading. Since I initially coded in Pine Script v4, I used ChatGPT to help refine and migrate the script to Pine Script v6 to ensure compatibility with the latest TradingView features. However, the core logic, structure, and customization were entirely designed and implemented based on my own approach.
I am making this indicator public not to violate any TradingView guidelines but to share my work with the trading community and provide a tool that can help others analyze ORB-based strategies. If there are any compliance concerns, I am open to adjusting the script accordingly, but I want to clarify that this is not a copy of any existing ORB script—it is a custom-built indicator tailored to my own trading preferences.
I appreciate the opportunity to contribute to the community and would welcome any specific feedback from TradingView regarding rule compliance.
Best regards,
Janko S. (Schwarzman)
Appeal to TradingView
Dear TradingView Team,
This script is 100% self-developed and does not copy or replicate any third-party code. It is a customized ORB tool designed for traders who wish to backtest and analyze opening range breakout strategies over multiple sessions. We kindly request specific clarification regarding which exact line(s) of code violate TradingView’s guidelines. If there are any compliance concerns, we are happy to adjust the script accordingly.
Please let us know the precise rules or community guidelines that were violated so we can make the necessary modifications.
🚀 Summary
✔ Fully Custom & Self-Developed – No copied or third-party code.
✔ Innovative Feature – Connects past ORBs for strategy backtesting.
✔ Transparent & Compliant – Requesting exact details on any potential rule violations.
อินดิเคเตอร์ Pine Script®